Cytonn Annual Markets Review - 2022
By Research Team, Jan 2, 2023
Executive Summary
Global Market Review:
According to the October 2022 World Economic Outlook by the International Monetary Fund (IMF), the global economy is projected to grow at a slower rate of 3.2% in 2022, from the 6.0% growth recorded in 2021. The expected slowdown in the Global economy’s growth is majorly attributable to the persistent inflationary pressures attributed to the high global fuel and energy prices experienced through most of the year, coupled with pre-existing supply chain disruptions worsened by the ongoing conflict in Ukraine which have greatly impacted commodities supply. Additionally, emerging markets and developing economies are projected to expand by 3.7% in 2022, lower than the 6.6% growth in 2021 while advanced economies are expected to record a 2.4% growth from the 5.2% expansion recorded in 2021. Additionally, it is worth noting that the 2021 high economic growth globally was on the back of COVID-19 recovery;
Sub-Saharan Africa Region Review
The Sub-Saharan Africa economy is projected to grow by 3.3% in 2022 according to the World Bank’s Pulse Issue and 3.6% according to the International Monetary Fund (IMF), down from the 4.1% and 4.7% growth in 2021 according to the World Bank and the IMF respectively. The decline in the growth in the region is attributable to the elevated inflationary pressures, adverse weather conditions that have undermined agricultural productivity, elevated risk of debt distress in the region and hiked interest rates in advanced economies such as the United States of America (USA) which have led to increased capital outflows in the region;
During the year, all select Sub-Saharan African currencies depreciated against the United States Dollar, with the Ghanaian Cedi being the largest decliner in 2022, depreciating by 42.8% against the U.S Dollar. Also, the region’s appetite for foreign-denominated Eurobonds remained muted with Nigeria and Angola being the only issuers during the year. Additionally, Sub-Saharan Africa (SSA) stock markets recorded mixed performance in 2022, with Zambia Stock Exchange (LASILZ) being the largest gainer with a 11.6% gain in 2022 due to improved macroeconomic environment supported by the IMF financial assistance maintaining investor confidence in the country;
Kenya Macro Economic Review
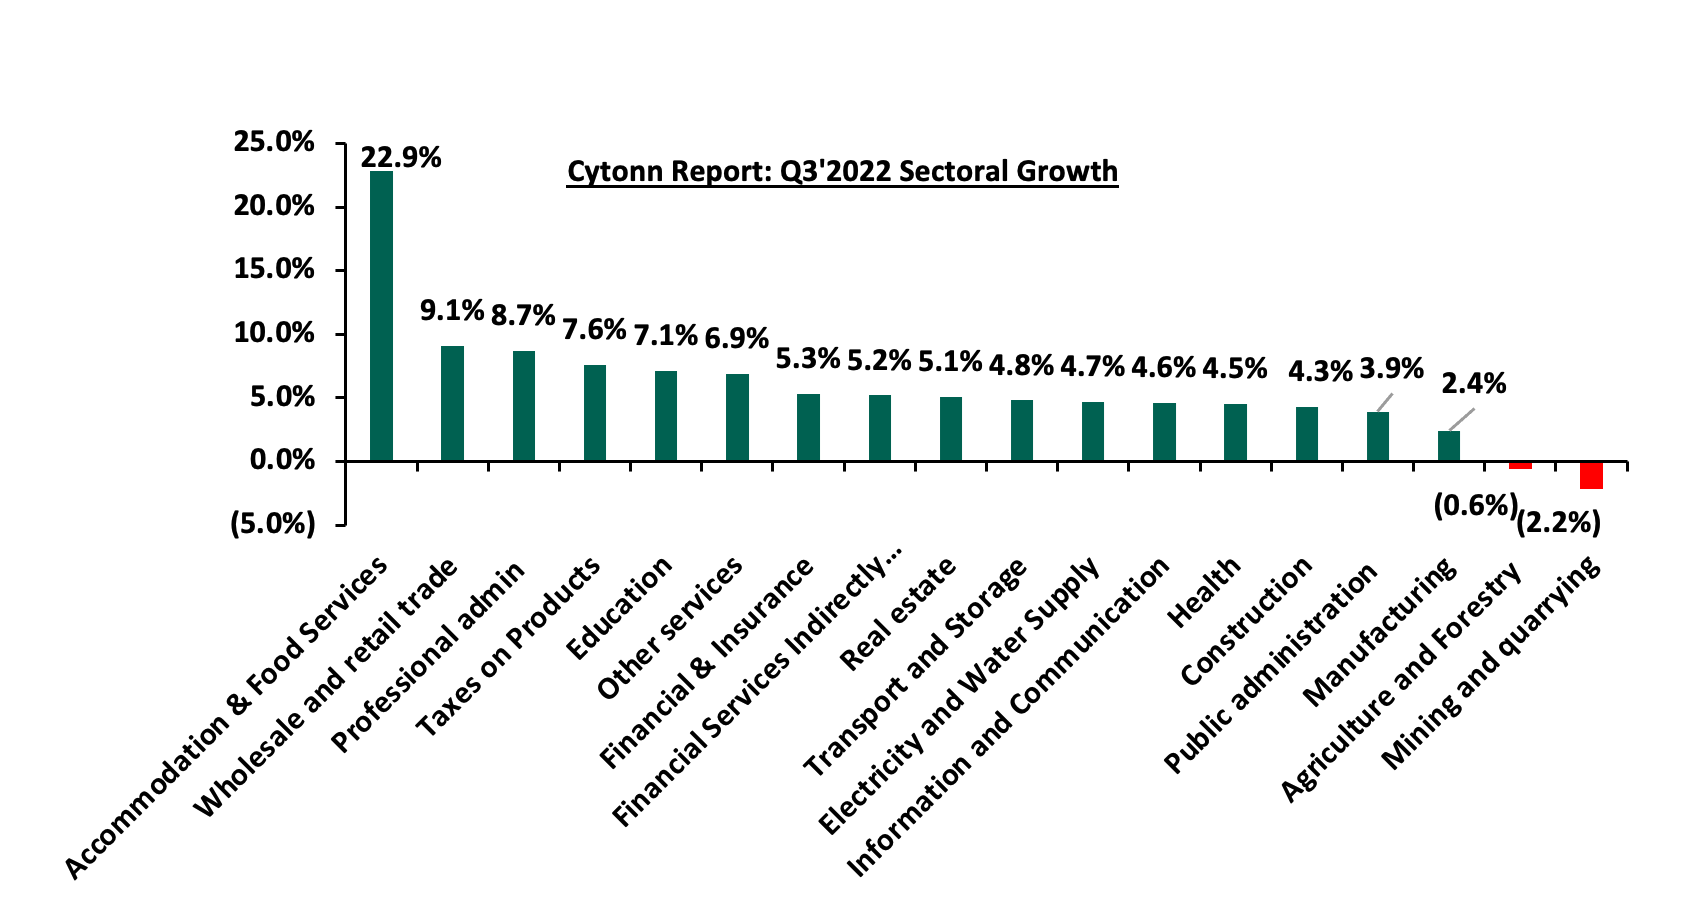
The Kenyan economy recorded an average growth of 5.6% in the period between January to September 2022, with Q3’2022 GDP coming in at 4.7%, adding to the 5.2% and 6.8% growth recorded in Q2’2022 and Q1’2022, respectively. The average GDP growth of 5.6% marked a decline from the 7.7% average growth recorded in a similar period in 2021. Growth in Q3’2022 was largely driven by the non-agricultural sectors, with accommodation and food, wholesale and retail trade, professional administrative and support, and finance and insurance sectors recording growths of 22.9%, 9.1%, 8.7%, and 5.3%, respectively, in Q3’2022, albeit slower than growth of 127.5%, 6.4%, 13.4%, and 11.8%, respectively recorded in Q3’2021. The growths in these sectors were supported by continued post COVID-19 economy recovery due to lifting of travel restrictions and ease in cross border transactions. However, the sectoral growths remained subdued due to uncertainties of the electioneering period and the adverse macroeconomic conditions in the country. Notably, the agricultural sector recorded a 0.6% contraction in Q3’2022, compared to a corresponding expansion of 0.6% growth in Q3’2021 but an improvement from preceding contractions of 2.1% and 0.7% recorded in Q2’2022 and Q1’2022, respectively. The contraction during the quarters is mainly attributable to unfavorable weather conditions witnessed during the period, as well as increased costs of agricultural inputs such as fertilizer;
In 2022, the Kenyan economy is projected to grow at an average of 5.1%, lower than the 7.5% growth recorded in 2021. The slower growth is mainly attributable to a deteriorated business environment for majority of the year brought about by the uncertainties preceding the August 2022 general elections and elevated inflationary pressures driven by the high global fuel prices and the pre-existing supply chain constraints worsened by the Russia-Ukraine conflict. Notably, the unfavorable weather conditions experienced during the period under review has subdued agricultural production, with the sector being the largest contributor to Kenya’s GDP;
Fixed Income
During the year, the yields on the government bills were on an upward trajectory with the yields on the 91-day, 182-day and 364-day T-bills increasing by 124.3 bps, 142.2 bps and 133.1 bps to 8.2%, 9.0% and 9.9% in 2021, from 7.0%, 7.6% and 8.6% at the end of 2021, respectively. Both the short term and long term government papers were undersubscribed, with the average subscription rate for T-bills and T-bonds coming in at 94.9% and 98.8%, from the 91.9% and 147.6% subscription recorded in 2021, respectively. The undersubscription was partly attributable to the tightened liquidity in the money market with the average interbank rates increasing to 4.9% in 2022, from 4.7% in 2021 and perceived risks arising from the August 2022 General Elections. Notably, the pre-election subscription rates weighed down on the overall subscriptions with the pre-election average T-bills subscriptions coming in at 88.8%, lower than 103.8% for post-election average;
During the week, T-bills were undersubscribed, for the second consecutive week, with the overall subscription rate dropping significantly to 17.9%, down from the 69.9% recorded the previous week, partly attributable to the tightened liquidity in the money market with the average interbank rate increasing to 6.4% from 6.2% recorded the previous week. Investor’s preference for the shorter 91-day paper persisted as they sought to avoid duration risk, with the paper receiving bids worth Kshs 2.2 bn against the offered Kshs 4.0 bn, translating to a subscription rate of 54.5%, down from 347.9% recorded the previous week. The subscription rates for the 364-day and the 182-day papers also declined to 4.3% and 16.9% from 9.3% and 19.3% recorded the previous week, respectively. The yields on the government papers recorded mixed performance, with the yields on the 364-day and 91-day papers declining slightly by 0.2 bps and 0.1 bps to 10.3% and 9.4%, respectively, while the yield on 182-day paper increased marginally by 0.9 bps to 9.8%;
During the week, Nigeria’s President sent a proposal to parliament for approval to allow for a restructuring of USD 54.0 bn, short term loans owed to its Central Bank to a 40-year security at an interest of 9.0%. The debt was incurred through Ways and Means Advances to finance government deficit as a result of delayed government receipts. The Nigerian Executive also requested for a three-year moratorium on interest payments on existing debts and asked for another USD 2.2 bn (N1.0 tn) debt from Central bank on similar terms. This comes at a time when the country has been accruing more debt resulting to high debt service to revenue which was 57.1% as of Q3’2022. This comes after Ghana announced plans to restructure their domestic debt and is currently in talks with domestic bondholders, as part of the conditions to receive financial assistance worth USD 3.0 bn from the International Monetary Fund (IMF), highlighting the current debt sustainability concerns in the Sub-Saharan Africa Region;
The Kenya National Bureau of Statistics (KNBS) released the Q3’2022 Quarterly Gross Domestic Product Report , highlighting that the Kenyan economy recorded a 4.7% growth in Q3’2022, significantly lower than the 9.3% growth recorded in Q3’2021 when the most sectors of the economy were recovering from the impacts of COVID-19 pandemic. The performance during the quarter was largely supported by growth recorded in non-agricultural sectors like Accommodation and Food Services activities (22.9%), Wholesale and retail trade (9.1%), Professional, Administrative and Support services (8.7%) and Education (7.1%), among others. The expansion was however weighed down by declines recorded sectors such as Mining and quarrying, and Agriculture and Forestry which contracted by 2.2% and 0.6%, respectively. Key to note, this is the fourth consecutive quarter that the agriculture sector has recorded a contraction;
The Kenya National Bureau of Statistics released the Quarterly Balance of Payments report for Q3’2022 report highlighting that Kenya’s balance of payments position recorded a deficit of Kshs 112.7 bn, a significant increase of 283.9% from the deficit of Kshs 29.3 bn in Q3’2021. Additionally, the BoP performance was a reversal from the surplus of Kshs 10.9 bn recorded in Q2’2022. The performance was mainly attributable to widening of the current account deficit by 5.5% to Kshs 193.4 bn from Kshs 183.4 bn recorded in Q3’2021, coupled with a 13.4% expansion of the financial account to Kshs 190.8 bn from Kshs 168.3 bn recorded in Q3’2021;
Equities
During the year, the Kenyan equities market was on a downward trajectory with all indices declining with NASI, NSE 20 and NSE 25 down by 23.7%, 12.4% and 16.6% respectively. The equities market performance was driven by losses recorded by large cap stocks such as Safaricom of 36.7%, Bamburi of 17.5%, as well as banking stocks such as KCB Group, Diamond Trust Bank Kenya, Equity Group and Co-operative Bank Kenya of 16.4%, 16.0%, 15.6%, and 5.4% respectively. The losses were however mitigated by gains recorded by other banking stocks such as NCBA Group, Standard Chartered Bank Kenya (SCBK)and ABSA Bank Kenya of 54.6%, 9.8% and 4.7%, respectively, while BAT Kenya and EABL gained by 4.5%, and 1.2%, respectively. In the banking sector, the Kenya listed banks recorded a weighted average increase in the core earnings per share of 36.7% in Q3’2022, compared to a weighted average increase of 102.0% in Q3’2021, while in the Insurance sector, the listed insurers recorded a weighted average increase in core earnings per share of share 16.0% in H1’2022, compared to a weighted average increase of 127.6% in H1’2021. During the year, 11 companies issued profit warnings, as compared to 4 companies in 2021, and 15 companies in 2020. The companies are Kakuzi Plc, The Limuru Tea Kenya Plc, Sanlam Kenya Limited, Unga Group Ltd, Liberty Kenya Holdings Ltd, Centum Investments Co Plc, Sameer Africa plc, Nairobi Securities Exchange PLC, Bamburi Cement PLC, Crown Paints Kenya Plc and Flame Tree Group Holdings Ltd. Additionally, during the year, the Capital Markets Authority approved the listing by introduction of the Local Authority Pension Trust (LAPTRUST) Imara Income Real Estate Investment Trust (I-REIT) on the Nairobi Securities Exchange (NSE) under the Restricted Sub-Segment. Four companies remained suspended at the Nairobi Securities Exchange, namely, Deacons (East Africa) PLC, ARM Cement PLC, Mumias Sugar Co. Ltd and Kenya Airways;
Real Estate
In 2022, the general Real Estate sector witnessed considerable growth in activity in terms of property transactions and development activities. Consequently, the sector’s activity contribution to GDP grew by 5.6% to Kshs 749.7 bn for the 9 months to September 2022, from Kshs 710.3 bn recorded during the same period in 2021. Additionally, selling and rental prices also continued to soar, driven by continued inflationary pressures and a weakened shilling against the United States dollar that has seen a rise in costs of construction materials. In terms of performance, the Nairobi Metropolitan Area (NMA) Residential, Commercial Office, Retail, Hospitality, and Mixed-Use Development sectors realized average rental yields of 5.1%, 7.6%, 7.9%, 6.2%, and 7.4%, respectively. This resulted to an average rental yield for the Real Estate market at 6.8%, 0.3% points higher than the 6.5% recorded in 2021. In Listed Real Estate, Fahari I-REIT closed the week trading at an average price of Kshs 6.5 per share on the Nairobi Stock Exchange, a 1.8% decline from Kshs 6.6 per share recorded the previous week. On the Unquoted Securities Platform as at 16th December 2022, Acorn D-REIT and I-REIT closed the week trading at Kshs 23.8 and Kshs 20.9 per unit, respectively, a 19.2% and 4.4% gain for the D-REIT and I-REIT, respectively, from the Kshs 20.0 inception price;
Investment Updates:
- Weekly Rates:
- Cytonn Money Market Fund closed the week at a yield of 10.92%. To invest, dial *809# or download the Cytonn App from Google Playstore here or from the Appstore here;
- Cytonn High Yield Fund closed the week at a yield of 13.88% p.a. To invest, email us at sales@cytonn.com and to withdraw the interest, dial *809# or download the Cytonn App from Google Playstore here or from the Appstore here;
- We continue to offer Wealth Management Training every Wednesday, from 9:00 am to 11:00 am, through our Cytonn Foundation. The training aims to grow financial literacy among the general public. To register for any of our Wealth Management Trainings, click here;
- If interested in our Private Wealth Management Training for your employees or investment group, please get in touch with us through wmt@cytonn.com;
- Any CHYS and CPN investors still looking to convert are welcome to consider one of the five projects currently available for assignment, click here for the latest term sheet;
- Cytonn Insurance Agency acts as an intermediary for those looking to secure their assets and loved ones’ future through insurance namely; Motor, Medical, Life, Property, WIBA, Credit and Fire and Burglary insurance covers. For assistance, get in touch with us through insuranceagency@cytonn.com;
- Cytonnaire Savings and Credit Co-operative Society Limited (SACCO) provides a savings and investments avenue to help you in your financial planning journey. To enjoy competitive investment returns, kindly get in touch with us through clientservices@cytonn.com;
Real Estate Updates:
- For an exclusive tour of Cytonn’s real estate developments, visit: Sharp Investor's Tour, and for more information, email us at sales@cytonn.com;
- Phase 3 of The Alma is now ready for occupation and the show house is open daily. To rent please email properties@cytonn.com;
- We have 8 investment-ready projects, offering attractive development and buyer targeted returns; See further details here: Summary of Investment-ready Projects;
- For Third Party Real Estate Consultancy Services, email us at rdo@cytonn.com;
- For recent news about the group, see our news section here;
Hospitality Updates:
- We currently have promotions for Staycations. Visit cysuites.com/offers for details or email us at sales@cysuites.com;
Economic Growth:
According to the October 2022 World Economic Outlook Report by the International Monetary Fund (IMF), the global economy is projected to grow at a slower rate of 3.2% in 2022, from the 6.0% growth recorded in 2021. Additionally, emerging markets and developing economies are projected to expand by 3.7% in 2022, 2.9% points lower than the 6.6% growth in 2021 while advanced economies are expected to record a 2.4% growth from the 5.2% expansion recorded in 2021. The expected slowdown in the Global economy’s growth is majorly attributable to;
- The persistent inflationary pressures which have seen several central banks raise their interest rates with the aim of anchoring inflation. Notably, Global inflation is forecasted to rise to 8.8% in 2022, from 4.7% in 2021,
- Unfavorable financial conditions occasioned by high cost of borrowing and worsened liquidity in emerging economies as most advanced economies continue to tighten their monetary policies, and,
- Pre-existing supply chain disruptions worsened by the ongoing conflict in Ukraine which have greatly impacted global fuel energy and food supplies, and,
- COVID-19 pandemic and its related impact remain a constraining factor for global economic growth mainly as result of emergence of new strains, and resurgence in infections in some economies such as China which have necessitated re-imposition of lockdowns.
The global economy’s future performance is majorly dependent on how soon the inflationary pressures will ease, which will see central banks will ease the monetary policy, the course of the war in Ukraine, and the possibility of further pandemic-related supply-side disruptions, for example, in China.
Global Commodities Market Performance:
Global commodity prices registered mixed performance in 2022, with prices of metals and minerals declining the most by 11.5% largely driven by slowed global demand. Similarly, the prices of precious metals declined by 6.5% mainly attributable to reduced demand for safe haven assets, which has been accelerated by interest rate hikes in advanced economies that has seen investors opt for higher-yield-bearing assets. On the other hand, the energy prices increased the most by 21.8% year on year, mainly due increasing demand for fuel and gas amid lower supply, a situation that has been worsened by persistent supply chain bottlenecks arising from geopolitical tension between Russia and Ukraine. Below is a summary performance of various commodities;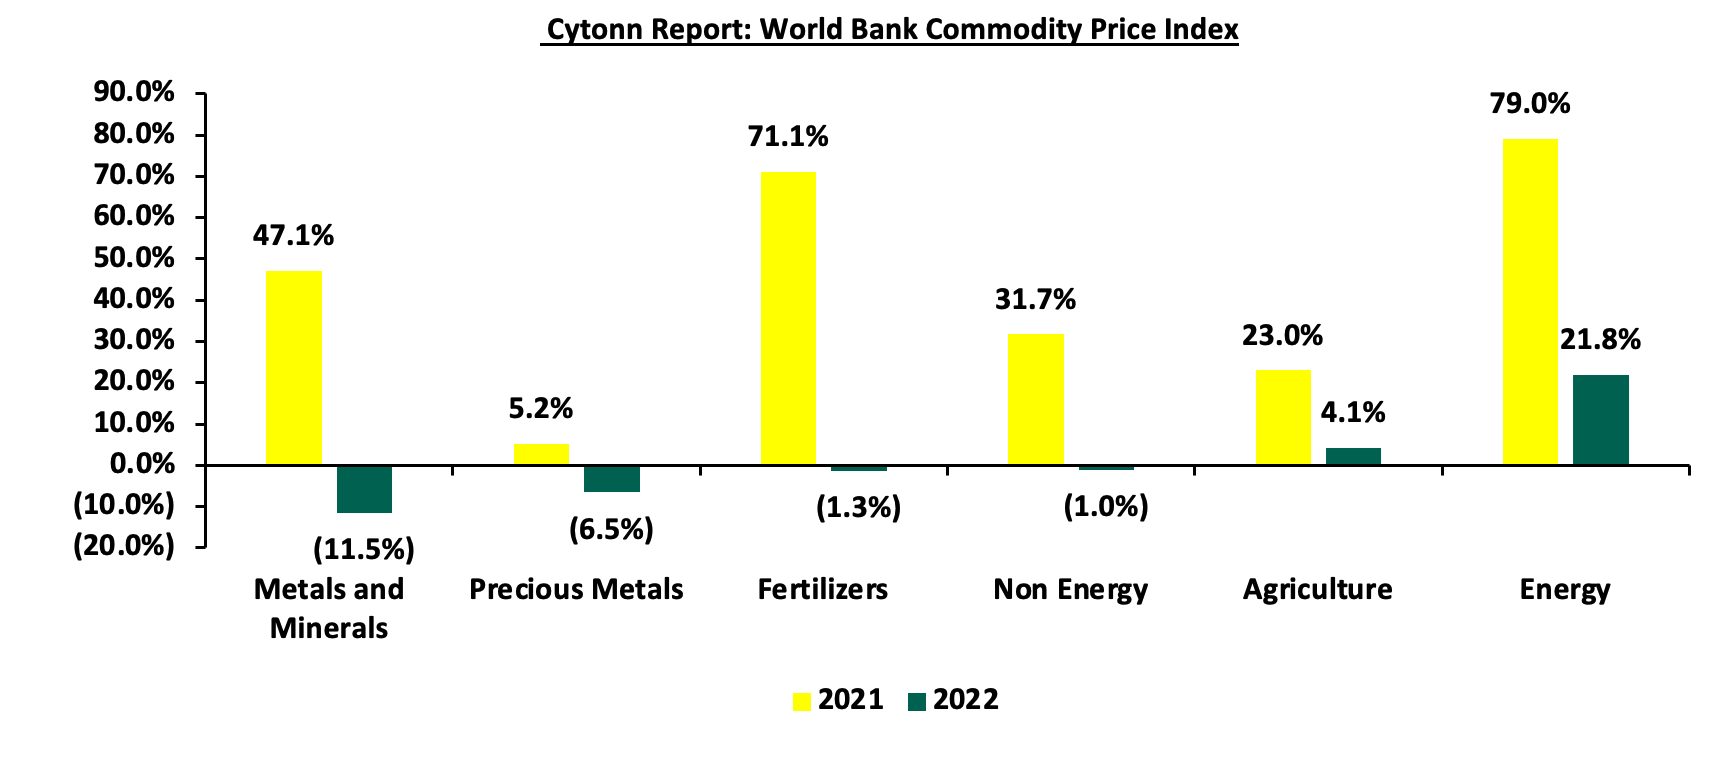
Source: World Bank
Global Equities market performance:
Global stock market recorded mixed performance in 2022, with most indices declining attributable to capital outflows as investors sought less risky markets such as government papers and other investments alternatives. Additionally, stock markets in developing countries witnessed high capital flights and higher declines as a result of increased uncertainties about the economies following interest rate hikes around the world particularly in advanced economies aimed at curbing the inflationary pressures. The Nigeria all share index was the largest gainer, recording a 10.1% gain, largely driven by increased investor sentiments following the rallying of crude oil prices with Nigeria being a net exporter of crude oil. Additionally, the Nigerian banking stocks recorded significant gains mainly attributable to the Central Bank of Nigeria’s decision to gradually hike the Monetary Policy Rate (MPR) to 16.5% in November 2022, from 11.5% in January 2022, which consequently led to 0.5% points increase in maximum lending rate to 28.1% in November 2022, from 27.7% in January 2022. On the other hand, Ghana stock composite index was the largest decliner recording losses of 40.3%, mainly due to continuous deterioration in the country’s business environment arising from high inflation at 50.3% as of November 2022 coupled with continued weakening of the Ghanaian Cedi which depreciated by 42.8% in 2022. Additionally, the re-imposition of capital gains tax on securities listed on the GSE has seen investors prefer fixed income securities. Below is a summary of the performance of key indices: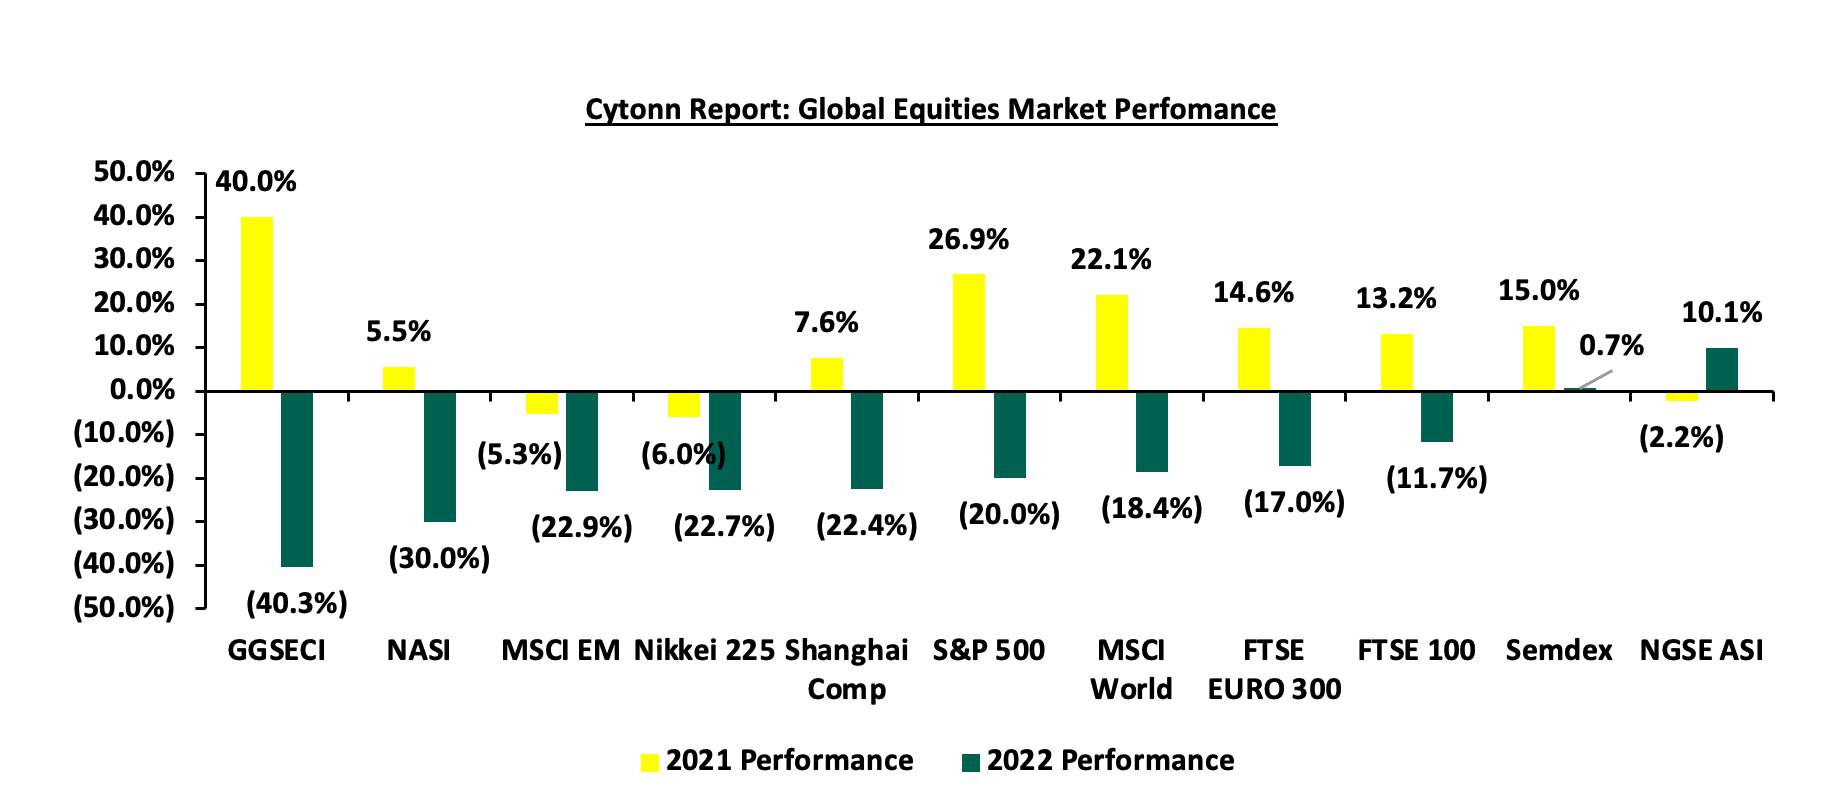
*Dollarized performance
Economic Growth
The Sub-Saharan Africa economy is projected to grow by 3.3% in 2022 according to the World Bank’s Pulse Issue and 3.6% according to the International Monetary Fund (IMF), down from the 4.1% and 4.7% growth in 2021 according to the World Bank and the IMF respectively. Notably, the projected region’s growth was revised downwards from the initial growth forecast of 3.6% and 3.8% in April 2022 by the World Bank and the IMF, respectively. The decline in the region’s economic growth is attributable to;
- Elevated inflationary pressures, emanating from the spill over effects of the Russian Invasion to Ukraine have led to increased fuel and food prices in the global markets given that majority of the SSA countries are net importers, coupled with adverse weather conditions that have undermined agricultural productivity in the region,
- Rising risk of debt distress in the region is expected to weigh down on the region’s growth, and notably, countries like Ghana and Zambia have initiated forms of public debt restructuring during the year, due to unsustainable debt levels,
- Pre-existing supply chain constraints have been worsened by disruptions arising from increasing lock downs to curb the spread of COVID-19 in China which is the region’s largest trading partner, and,
- Hiked interest rates in advanced economies such as the United States of America (USA) has increased capital outflows in the region further fuelling the economic decline in the SSA.
Currency Performance
In 2022, all select Sub-Saharan African currencies depreciated against the U.S Dollar, mainly on the back of elevated inflationary pressures in the region, high debt servicing costs that continue to dwindle foreign exchange reserves, coupled with monetary policy tightening by United States Federal reserve. The table below shows the performance of select African currencies against the USD;
|
Cytonn Report: Select Sub-Saharan Africa Currency Performance vs USD |
|||||
|
Currency |
Dec-20 |
Dec-21 |
Dec 22 |
2021 y/y change(%) |
2022 y/y change (%) |
|
Ghanaian Cedi |
5.8 |
6.0 |
8.6 |
(4.3%) |
(42.8%) |
|
Malawian kwacha |
770.8 |
816.4 |
1,026.4 |
(5.9%) |
(25.7%) |
|
Kenyan Shilling |
109.2 |
113.1 |
123.4 |
(3.6%) |
(9.0%) |
|
Botswana Pula |
10.8 |
11.7 |
12.8 |
(8.8%) |
(8.8%) |
|
Zambian Kwacha |
21.2 |
16.7 |
18.1 |
21.2% |
(8.4%) |
|
Nigerian Naira |
379.5 |
413.0 |
447.1 |
(8.8%) |
(8.3%) |
|
Senegal CFA Franc |
532.0 |
577.0 |
615.0 |
(8.5%) |
(6.6%) |
|
South African Rand |
14.6 |
15.9 |
16.9 |
(8.5%) |
(6.5%) |
|
Ugandan Shilling |
3,650.1 |
3,544.7 |
3,717.5 |
2.9% |
(4.9%) |
|
Mauritius Rupee |
39.4 |
43.5 |
43.9 |
(10.3%) |
(1.1%) |
|
Tanzanian Shilling |
2,298.5 |
2,297.8 |
2,308.9 |
0.0% |
(0.5%) |
Key take outs from the table include;
- The Ghanaian Cedi was the worst performer during the year, depreciating by 42.8% against the dollar, attributable to the deteriorated macroeconomic environment, evidenced by its elevated inflation, with November 2022 inflation rate coming in at a record of 50.3%, tightened monetary policy as Ghana’s interest rates were hiked to 27.0% in November 2022 and a high debt distress with its public debt to GDP coming in at 75.9% in September 2022. As a result, the government announced a cease of debt servicing on foreign bonds, commercial and bilateral loans in December 2022 and also initiated a Domestic Debt Exchange Programme (DDEP) for its domestic bonds coupled with a staff level agreement for a financing assistance package of USD 3.0 bn from the IMF. This partially increased confidence in their economy and consequently the Cedi appreciated by 34.6% to close the year at GHc 8.6 from the adverse exchange rate of GHc 13.1 against the U.S Dollar recorded on 17th November 2022,
- The Kenyan Shilling depreciated by 9.0% in 2022 to close at Kshs 123.4 against the U.S Dollar, compared to the Kshs 113.1 recorded at the end of 2021, driven by increased dollar demand from importers, especially oil and energy sectors against a slower supply of hard currency. Additionally, the 15.1% YTD decline of its foreign exchange reserves which currently stand at USD 7.4 bn representing 4.2 months of import cover, from USD 8.8 bn recorded at the beginning of the year has continued to put pressure on the Kenyan shilling, and,
- The Zambian Kwacha depreciated by 8.4% during the year from an appreciation of 21.2% in 2021, attributable to public debt sustainability concerns that have continued to weigh down investor confidence, especially the external debt, which resulted to a 62.1% external debt to GDP ratio at the end of 2021, leading to the country initiating an external debt restructuring. Additionally, with copper being its main export commodity, the 17.3% decline in the global copper prices in 2022 compared with the 37.6% price increase in 2021 has continued to weigh down on the country’s current account.
African Eurobonds
The region’s appetite for foreign-denominated debt declined during the year, due to its high yields that translates to high borrowing costs, attributable to elevated inflationary pressures and tough macroeconomic conditions that have worsened pre-pandemic debt sustainability concerns. As such, Nigeria and Angola were the only Eurobonds issuers during the year, with the countries raising USD 1.3 bn and USD 1.8 bn in March and April 2022, for Nigeria and Angola, respectively, translating to a total of USD 3.1 bn raised, down from USD 11.8 bn raised in 2021 representing a 73.7% decline. Yields for the African Eurobonds significantly increased during the year, attributable to investors attaching a higher risk premium to the region, driven by the region’s elevated inflationary pressures, public debt distress and currency depreciation that have deteriorated the region’s macroeconomic environment.
Yields for the Kenyan and Senegal Eurobonds increased by 8.4% and 5.6% during the year, to close the year at 12.9% and 8.9%, from 4.5% and 3.3% recorded at the end of December 2021. The graph below shows the 5-year Eurobond secondary market performance of select 10-year Eurobonds issued by Kenya and Senegal;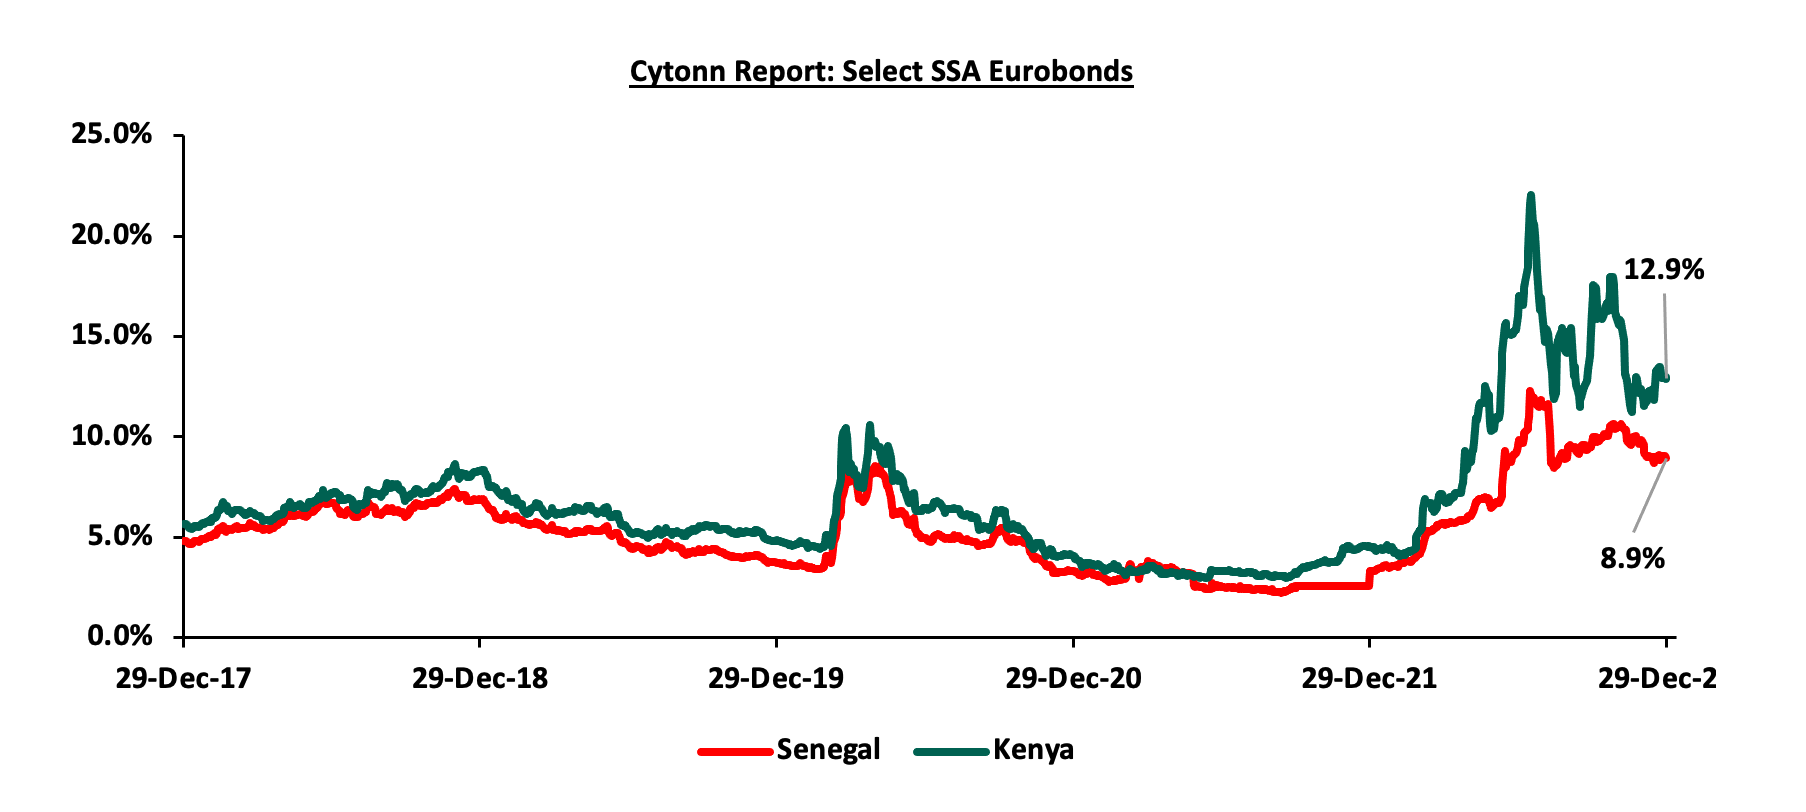
Equities Market Performance
Sub-Saharan Africa (SSA) stock markets recorded mixed performance in 2022, with Zambia Stock Exchange (LASILZ) being the largest gainer with an 11.6% gain in 2022 due to improved macroeconomic environment supported by the IMF financial assistance maintaining investor confidence in the country. This has however declined from the 96.9% gain in 2021 partly due to the 17.3% drop in global copper prices in 2022 compared to a 37.6% increase in copper prices in 2021. On the other hand, Ghana’s GSCECI was the worst performing index in 2022, recording a loss of 41.7% due to a deteriorated macroeconomic environment and regulatory policies such the re-imposition of capital gains tax on listed equities securities, and this has adversely impacted the stock exchange by dampening investor sentiments. Below is a summary of the performance of the key SSA indices;
|
Cytonn Report: Equities Market Performance |
||||||
|
Country |
Index |
Dec-20 |
Dec-21 |
Dec-22 |
2021 y/y change (%) |
2022 y/y change (%) |
|
Zambia |
LASILZ |
185.2 |
364.7 |
406.9 |
96.9% |
11.6% |
|
Nigeria |
NGEASI |
105.8 |
103.5 |
111.4 |
(2.2%) |
10.8% |
|
Rwanda |
RSEASI |
0.2 |
0.1 |
0.1 |
(4.0%) |
(4.6%) |
|
South Africa |
JALSH |
4,044.8 |
4,618.3 |
4,292.8 |
14.2% |
(7.0%) |
|
Tanzania |
DARSDEI |
0.7 |
0.6 |
0.6 |
(2.7%) |
(8.1%) |
|
Uganda |
USEASI |
0.4 |
0.4 |
0.3 |
11.6% |
(18.6%) |
|
Kenya |
NASI |
1.4 |
1.5 |
1.0 |
5.5% |
(29.8%) |
|
Ghana |
GSECI |
332.5 |
465.6 |
271.5 |
40.0% |
(41.7%) |
|
*The index values are dollarized for ease of comparison |
||||||
The tough macroeconomic environment experienced in the region in 2022 coupled with socio-political turmoil in West and Central Africa have continued to adversely impact its economic growth. As such, subdued GDP growth rate in Sub-Saharan Africa is expected to continue in 2023, in line with the rest of the global economy, amid fears of a global recession in 2023. Elevated inflation rates, debt sustainability concerns and supply chain constraints in the region are expected to persist in 2023, and this will continue to weigh down its economic growth. Additionally, the continued weakening of local currencies will even make debt servicing costlier, and this lead to increased perceived risks in the region, resulting to reduced investor confidence in the region.
Economic Growth
The Kenyan economy recorded an average growth of 5.6% in the period between January to September 2022, with Q3’2022 GDP coming in at 4.7%, adding to the 5.2% and 6.8% growth recorded in Q2’2022 and Q1’2022, respectively. The average GDP growth of 5.6% marked a decline from the 7.7% average growth recorded in a similar period in 2021. The growth in Q3’2022 was largely driven by the non-agricultural sectors, with accommodation and food, wholesale and retail trade, professional administrative and support, and finance and insurance sectors recording growths of 22.9%, 9.1%, 8.7%, and 5.3%, respectively, in Q3’2022, albeit slower than growth of 127.5%, 6.4%, 13.4%, and 11.8%, respectively recorded in Q3’2021. The growths in these sectors were supported by continued post COVID-19 economy recovery due to lifting of travel restrictions and ease in cross border transactions. However, the sectoral growths remained subdued due to uncertainties of the electioneering period and the adverse macroeconomic conditions in the country. Notably, the agricultural sector recorded a 0.6% contraction in Q3’2022, compared to a corresponding expansion of 0.6% growth in Q3’2021 but an improvement from preceding contractions of 2.1% and 0.7% recorded in Q2’2022 and Q1’2022, respectively. The contraction during the quarters is mainly attributable to unfavorable weather conditions witnessed during the period, as well as increased costs of agricultural inputs such as fertilizer;
In 2022, the Kenyan economy is projected to grow at an average of 5.1%, lower than the 7.5% growth recorded in 2021. The slower growth is mainly attributable to a deteriorated business environment for majority of the year brought about by the uncertainties preceding the August 2022 general elections and elevated inflationary pressures driven by the high global fuel prices and the pre-existing supply chain constraints worsened by the Russia-Ukraine conflict. Notably, the unfavorable weather conditions experienced during the period under review has subdued agricultural production, with the sector being the largest contributor to Kenya’s GDP. The table below shows the projections of Kenya’s 2022 GDP by various organizations:
|
Cytonn Report: 2022 GDP Projections |
||
|
No. |
Organization |
2022 Projections |
|
1 |
International Monetary Fund |
5.3% |
|
2 |
National Treasury |
6.0% |
|
3 |
Cytonn Investments Management PLC |
4.5% |
|
4 |
World Bank |
5.5% |
|
5 |
S&P Global |
4.4% |
|
Average |
5.1% |
|
|
Median of Growth Estimates |
5.3% |
|
Source: Cytonn Research, 2022
Business conditions in the Kenyan private sector remained subdued during the year, with the average Stanbic Bank Monthly Purchasing Managers’ Index (PMI) for the first eleven months averaging at 49.0, 1.6 points lower than the average of 50.6 recorded during a similar period in 2021 indicating a deterioration of the country’s business environment in 2022 compared to 2021. However, for the month of November 2022, the index improved to 50.9 from 50.2 recorded in October 2022. The chart below shows the trend of Kenya’s Purchasing Managers index for the last 24 months;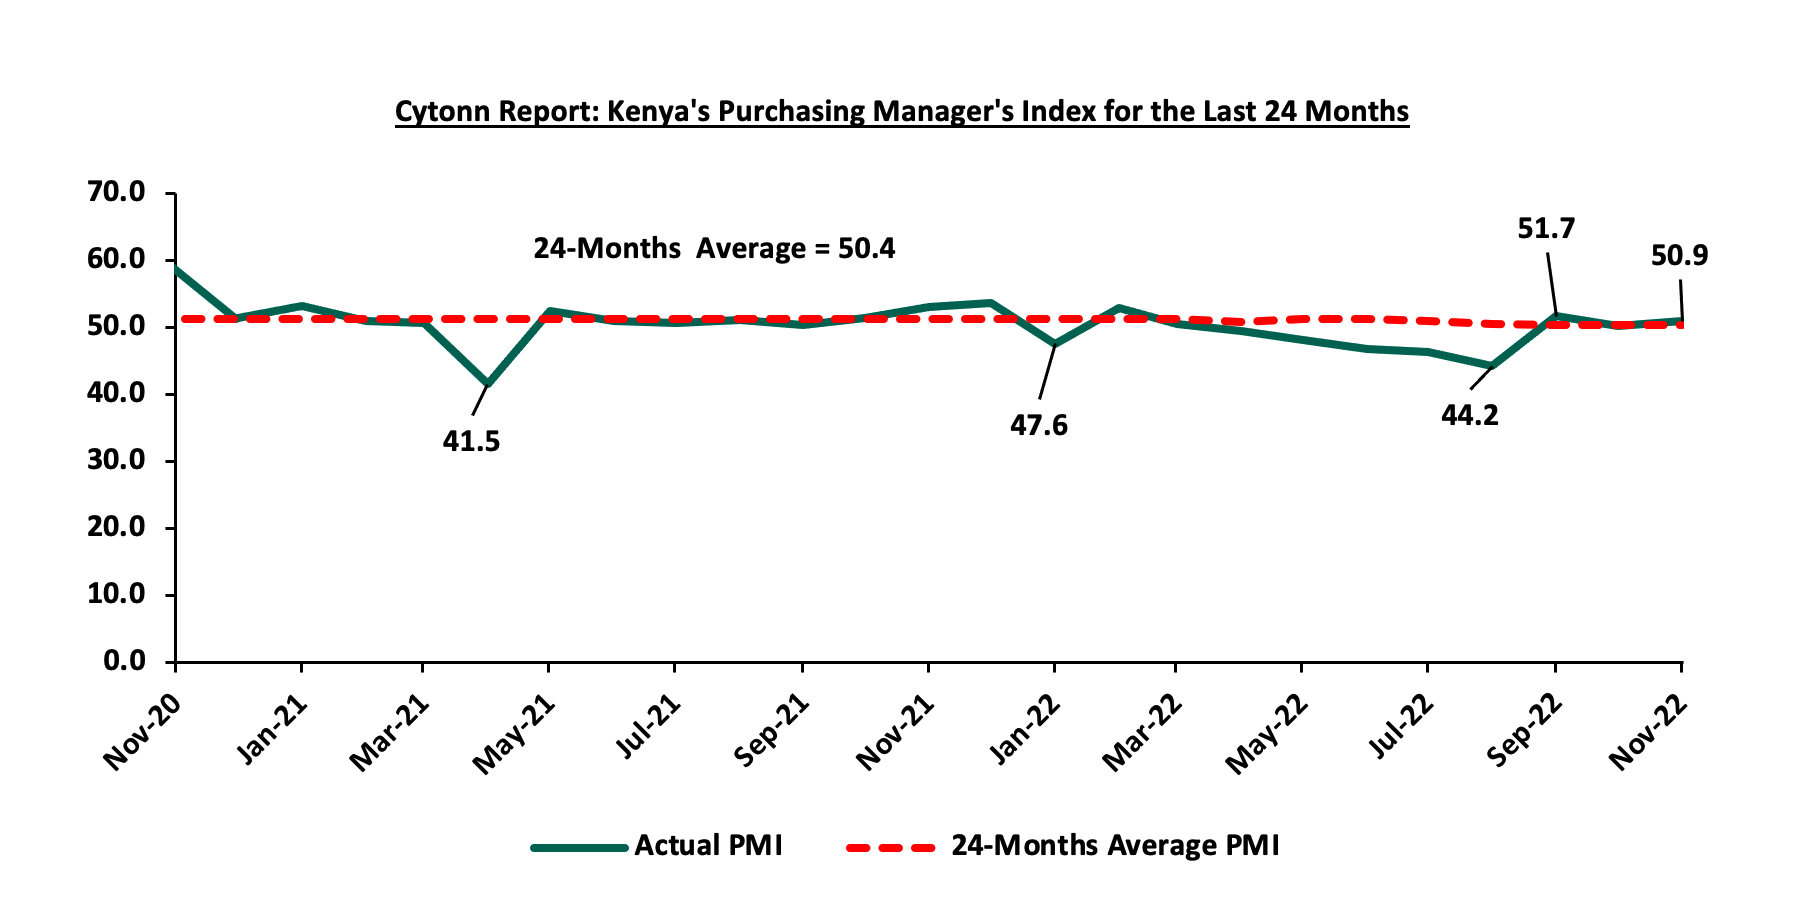
Kenyan Shilling
The Kenya Shilling depreciated by 9.0% against the US Dollar to close at Kshs 123.4 in 2022, compared to Kshs 113.1 at the end of 2021, equivalent to a 3.6% depreciation. The chart below highlights the performance of the Kenyan Shilling against the US Dollar in 2022;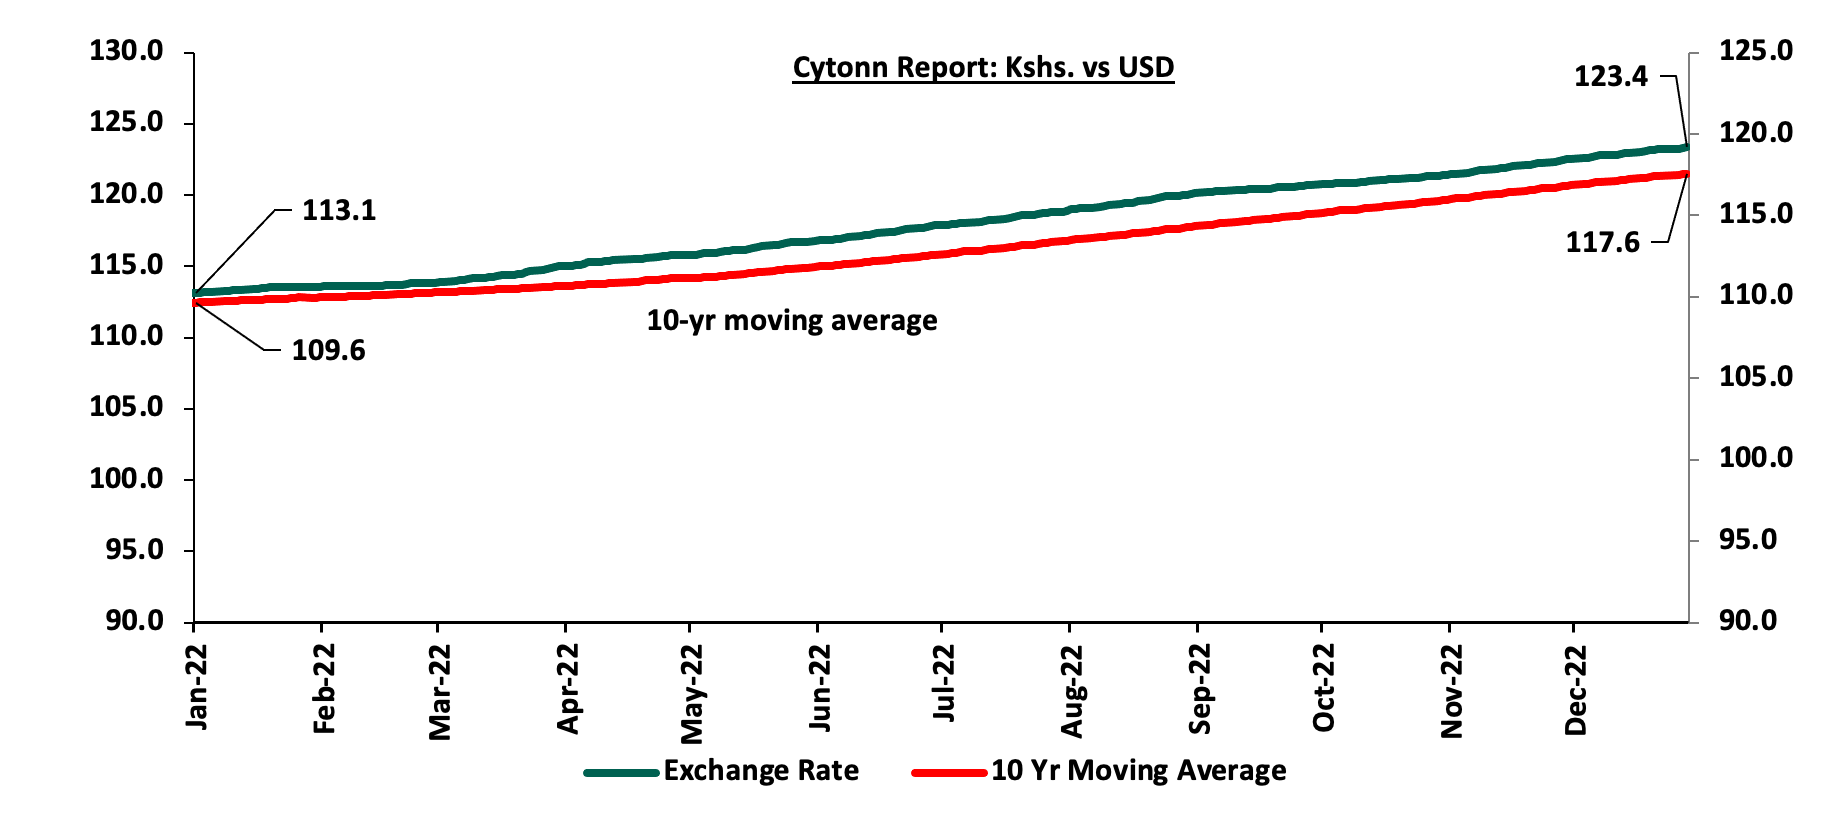
The depreciation of the Kenyan shilling in 2022 was driven by;
- High global crude oil prices attributable to the persistent supply chain constraints and high demand with fuel being an integral input in most sectors,
- Increased dollar demand by importers especially in the oil and energy sector, as well as, manufacturers against a low supply of dollar currency leading to shortage of USD in the Kenyan market,
- Existence of an ever-present current account deficit estimated at 5.5% of GDP in the 12 months to October 2022, same to what was recorded in a similar period in 2021. Key to note, the current account deficit was driven by a 15.8% deterioration in trade imbalance to Kshs 373.1 bn, from Kshs 322.0 bn in Q3’2021. This is despite merchandise exports increasing by a faster 29.7% to Kshs 228.2 bn in Q3’2022 from 175.9 bn recorded in Q3’2021 relative to a 20.8% increase in merchandise imports to Kshs 601.2 bn in Q3’2022 from Kshs 498.0 bn recorded in a similar period in 2021,
- The need for Government debt servicing which continues to put pressure on forex reserves given that 69.3% of Kenya’s External debt was US Dollar denominated as of October 2022, and,
- A continued hike in the USA Fed interest rates in 2022 to a range of 4.25%-4.50% in December 2022 to curb inflation has strengthened the dollar against other currencies resulting in capital outflows from emerging and developing markets such as Kenya.
The shilling received some support driven by:
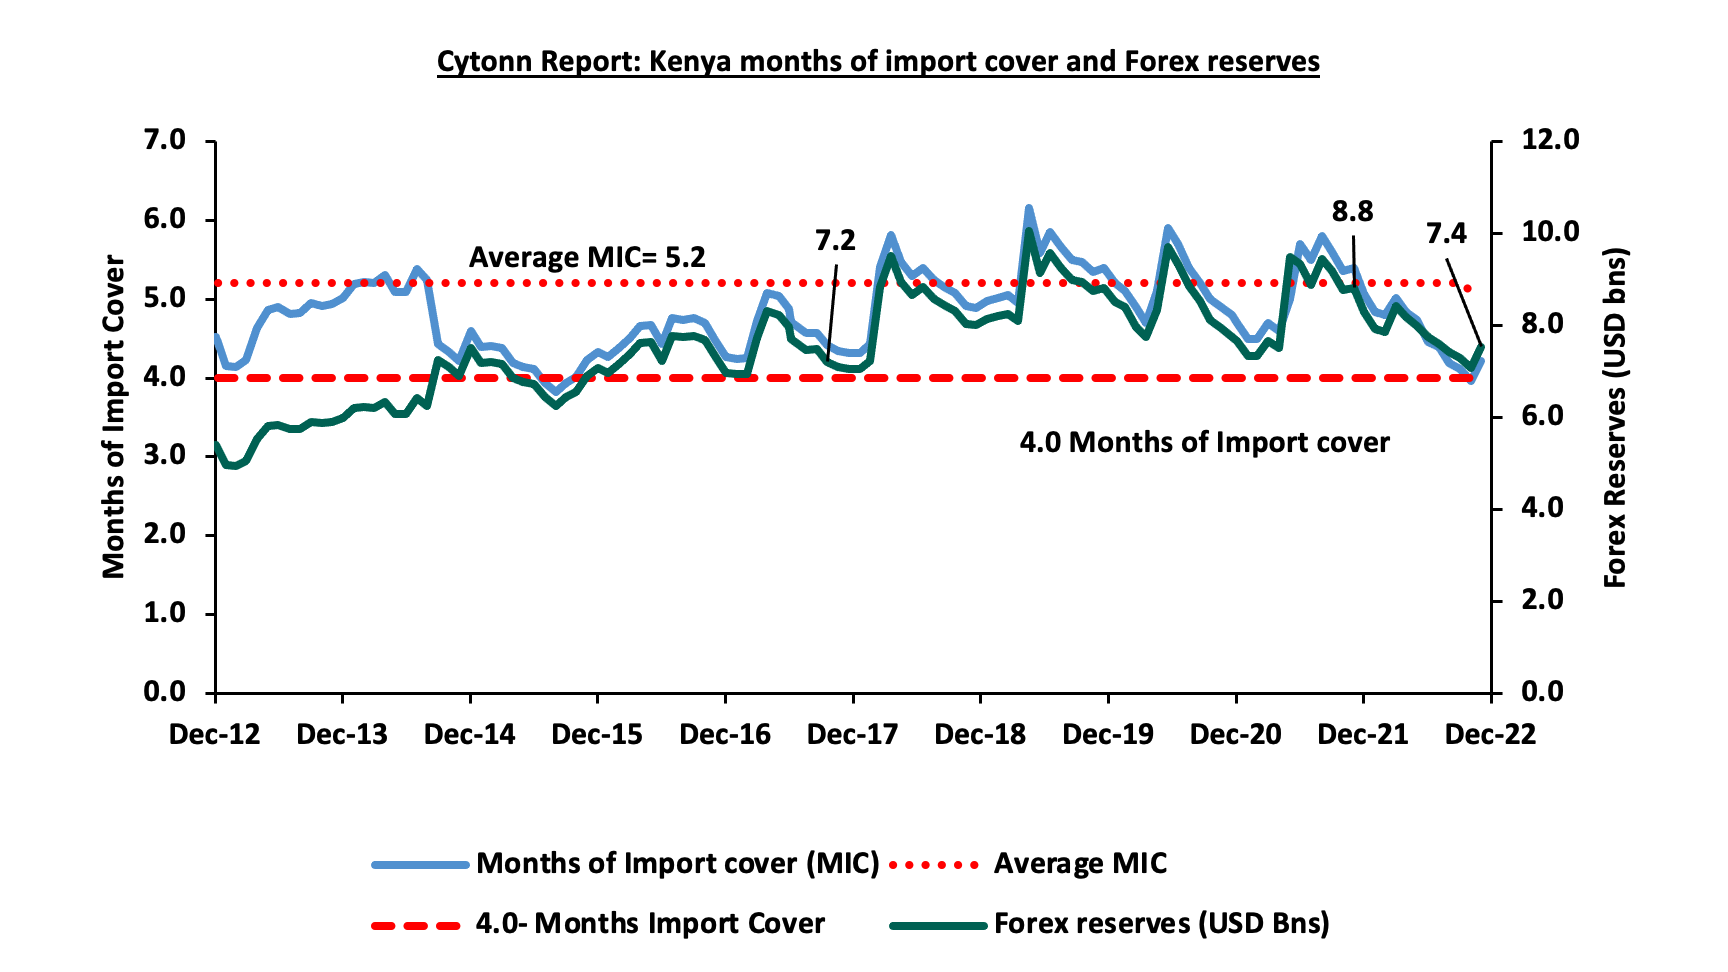
- Sufficient Forex reserves closing the year at USD 7.4 bn (equivalent to 4.2 months of import cover), which is slightly above the statutory requirement of maintaining at least 4.0-months of import cover. However, despite the Forex reserves being adequate, they have dropped by 15.1% YTD from USD 8.8 bn recorded in January 2022. The following is a graph showing Kenya months of import cover and forex reserves for the last 10 years;
- Improved diaspora remittances standing at a cumulative USD 4.0 bn as at November 2022, representing a 9.7% y/y increase from USD 3.7 bn recorded over the same period in 2021,
- The government received USD 750.0 mn World Bank loan facility in March 2022, as well, USD 235.6 mn and USD 447.4 mn funding from the International Monetary Fund (IMF) disbursed under the fourth and fifth tranches of the 38-month Extended Fund Facility (EFF) and Extended Credit Facility (ECF) in July and December 2022. Additionally, through the Special Drawing Rights, IMF disbursed an additional USD 14.6 mn (Kshs 26.6 bn) as buffer from the drought effects, which supported the reserves despite the continued depreciation of the Kenyan currency. The latter loan disbursement is expected to further support the Kenyan Shilling in 2023 evidenced by forex reserves increasing to USD 7.5 bn in December 2022, from USD 7.0 bn recorded in November 2022, and,
- CBK’s supportive activities in the money market, such as repurchase agreements and selling of dollars.
Against our expectations, the Kenyan shilling closed the year at Kshs 123.4. We expected the Kenyan shilling to remain within a range of Kshs 115.1 and Kshs 119.1 against the USD in the medium term based on the Purchasing Power Parity (PPP) and Interest Rate Parity (IRP) approach respectively, with a bias of a 4.7% depreciation. Read on our outlook on Performance of Kenya Currency.
Inflation
The inflation rate for the year 2022 averaged at 7.6%, 1.5% points higher than average inflation rate of 6.1% recorded in 2021. Notably on a m/m basis, Kenya’s inflation rate declined by 0.4% points to 9.1% in December 2022, from 9.5% recorded in November 2022, but remained above the government’s target range of 2.5% - 7.5%. The relatively high inflation can be attributed to increase in prices of major commodity indices with food and non-alcoholic index and transport index, registering the highest year-on-year (y/y) increases of 13.8% and 13.0%, respectively. This is mainly attributable to the high fuel prices experienced in 2022 as a result of persistent supply chain constraints, as well as, the erratic weather conditions experienced in the first half of the year and increased costs of agricultural inputs which affected agricultural production.
Going forward, we expect the inflation rate to remain elevated in the short-term and above the government’s set range of 2.5% - 7.5% driven by the high global fuel prices coupled with the expected complete removal of the fuel subsidy program at the end of the year which could have spillover effects on production given that fuel is an integral input in production of core commodities. Food prices will also remain elevated in the short run due to erratic weather patterns experienced during the year that adversely affected agricultural production. However, with the several parts of the country have experienced rains in December, coupled with the fertilizer subsidy program introduced by the current administration to reduce agricultural input costs, we expect that food inflation will ease in the medium term on the back of improved productivity.
Monetary Policy:
During the year the Monetary Policy Committee (MPC) met 6 times where they maintained the Central Bank Rate (CBR) at 7.00% and the Cash Reserve Ratio of 4.25% in the first two of the meetings of January and March 2022. However, the MPC raised the CBR rate by 50.0 and 75.0 basis points (bps) to 7.50% and 8.25% in May 2022 and September 2022, respectively. Further, the MPC hiked the CBR by an additional 50.0 bps to 8.75% in latest meeting in November 2022 in a bid to anchor inflation which is currently above the government’s target range of 2.5% - 7.5%. We expect the MPC to continue raising the CBR rates in a bid to stabilize inflation within the government’s target range and also anchor the Kenyan shilling that has suffered a 9.0% YTD depreciation against the US Dollar.
2022 Key Highlights:
- FY’2022/2023 Budget Policy Statement;
On 7thApril 2022, the National Treasury presented Kenya’s FY’2022/2023 National Budget to the National Assembly highlighting that the total budget estimate for the 2022/2023 fiscal year was Kshs 3.3 tn, a 10.3% increase from the Kshs 3.0 tn final FY’2020/21 budget. The government projects that total revenue will increase by 20.3% to Kshs 2.4 tn, from the Kshs 2.0 tn in FY’2022/2023, the increase largely being projected to come from ordinary revenue, which is to grow by 25.4% to Kshs 2.1 tn in FY’2022/23 from Kshs 1.8 tn in the FY’2021/22 budget. The projected revenues are mainly pegged on Kenya’s economic recovery from COVID-19 effects, broadening the tax base and tax reforms, as well as reduction of the fiscal deficit to 6.2% of the GDP. The expenditure is expected to increase by 10.3% to Kshs 3.3 tn in FY’2022/23, from Kshs 3.0 tn in the FY’2021/22 budget. For more information, see our Kenya’s FY’2022/2023 Budget Review.
- Credit Facilities extended to Kenya;
- In 2022, Kenya received a total of USD 750 mn (Kshs 80.9 bn) under the Development Policy Operation (DPO) from the World Bank and a total of USD 683.0 (Kshs 83.8 bn) from the IMF under the Extended Credit Facility arrangement (EFF/ECF) for budgetary support by providing low-cost budget financing to support key policies and institutional reforms. Additionally, the funding from the World Bank would also boost Kenya’s post-COVID-19 recovery. For more information, see our Cytonn Weekly #11/2022, and,
- On 18th July and 20th December 2022, the Kenyan authorities and the IMF reached a staff level agreement on the fourth and fifth tranches of the 38-month Extended Fund Facility (EFF) and Extended Credit Facility (ECF) - funded program. Per the agreements, Kenya would access USD 236.5 (Kshs 28.7 bn) and USD 447.4 mn (Kshs 55.1 bn) as the fourth and fifth tranches respectively to support the country’s economic growth and achieve the medium term debt strategy objectives. For more information, see our Cytonn Monthly April 2022, Cytonn Weekly #29/2022, Cytonn Weekly #45/2022 and Cytonn Weekly #51/2022.
- FY’2021/2022 KRA Revenue Performance;
On 7th July 2022, The Kenya Revenue Authority (KRA) released the annual revenue performance for the FY’2021/2022, highlighting that the total revenue collected amounted to Kshs 2.03 tn against the revised target of Kshs 1.98 tn, translating to a 2.8% over performance. Notably revenue collection grew by 21.7% to Kshs 2.0 tn in FY’2021/22, from Kshs 1.7 tn in FY’2020/21 due to the enhanced tax compliance efforts and the implementation of new tax measures. For more information, see our Cytonn Weekly #27/2022.
- Balance of Payments
The Kenya National Bureau of Statistics released the Q3’2022 Balance of Payments Report highlighting that Kenya’s balance of payments deteriorated by 283.9% in Q3’2022, coming in at a deficit of Kshs 112.7 bn, from a deficit of Kshs 29.3 bn in Q3’2021. The deterioration was brought by a 5.5% widening of the Current Account deficit to Kshs 193.4 bn, from Kshs 183.4 bn in Q3’2021, driven by a 15.8% deterioration in trade imbalance to Kshs 373.1 bn, from Kshs 322.0 bn in Q3’2021. This is despite merchandise exports increasing by a faster 29.7% to Kshs 228.2 bn in Q3’2022 from 175.9 bn recorded in Q3’2021 relative to a 20.8% increase in merchandise imports to Kshs 601.2 bn in Q3’2022 from Kshs 498.0 bn recorded in a similar period in 2021,
- Credit Ratings;
In 2022, Fitch Ratings, a global rating agency, revised Kenya's Long-Term Foreign-Currency Issuer Default Rating (IDR) downwards to ‘B’ from ‘B+’, but with a stable outlook. The rating is similar to Standard & Poor’s affirmation of the country’s long and short-term foreign and local currency sovereign credit ratings at 'B' with a Stable Outlook in August 2022. Fitch Rating pointed out that the downgrade was attributable to the widened current account deficit coming in at 5.5% of the GDP in October 2022 against low currency reserves at USD 7.4 bn having registered a 19.3% YTD decline from the USD 8.8 bn recorded in January 2022, coupled with a high debt to GDP ratio at 385.0% of the GDP surpassing the recommended 282.0% ratio mark. On the other hand, the Stable Outlook on the ratings reflected the gradual fiscal consolidation and the steady economic growth. For more information, see our Cytonn Weekly #50/2022. Below is a summary of the credit rating on Kenya by various rating agencies;
|
Cytonn Report: Kenya Credit Rating Agencies Ratings |
||||
|
Rating Agency |
Previous Rating |
Current Rating |
Current Outlook |
Date Released |
|
Fitch Ratings |
B+ |
B |
Stable |
14th December 2022 |
|
S&P Global |
B |
B |
Stable |
30th August 2022 |
Source: Fitch Ratings, S&P Global
2022 returns by various Asset Classes
The returns by the various asset classes improved in 2022, with the average of the top five money market funds (MMFs), Real Estate yield and government papers being on upward trajectories. The average of top 5 MMF recorded a yield of 9.8%, 0.3% points increase from 9.5% recorded in 2021 as the average Real Estate yield also increased by 0.3% points to 6.8% in 2022, from 6.5% recorded in 2021. Similarly, the 364-day, 182-day and 91-day Government papers recorded average yields of 9.9%, 9.0% and 8.2%, respectively. However, for the equities class, NASI registered a 23.7% loss in 2022 from a 5.5% gain recorded in 2021. The graph below shows the summary of returns by various asset classes (Average top 5 MMF, Fixed Income, Real Estate and Equities).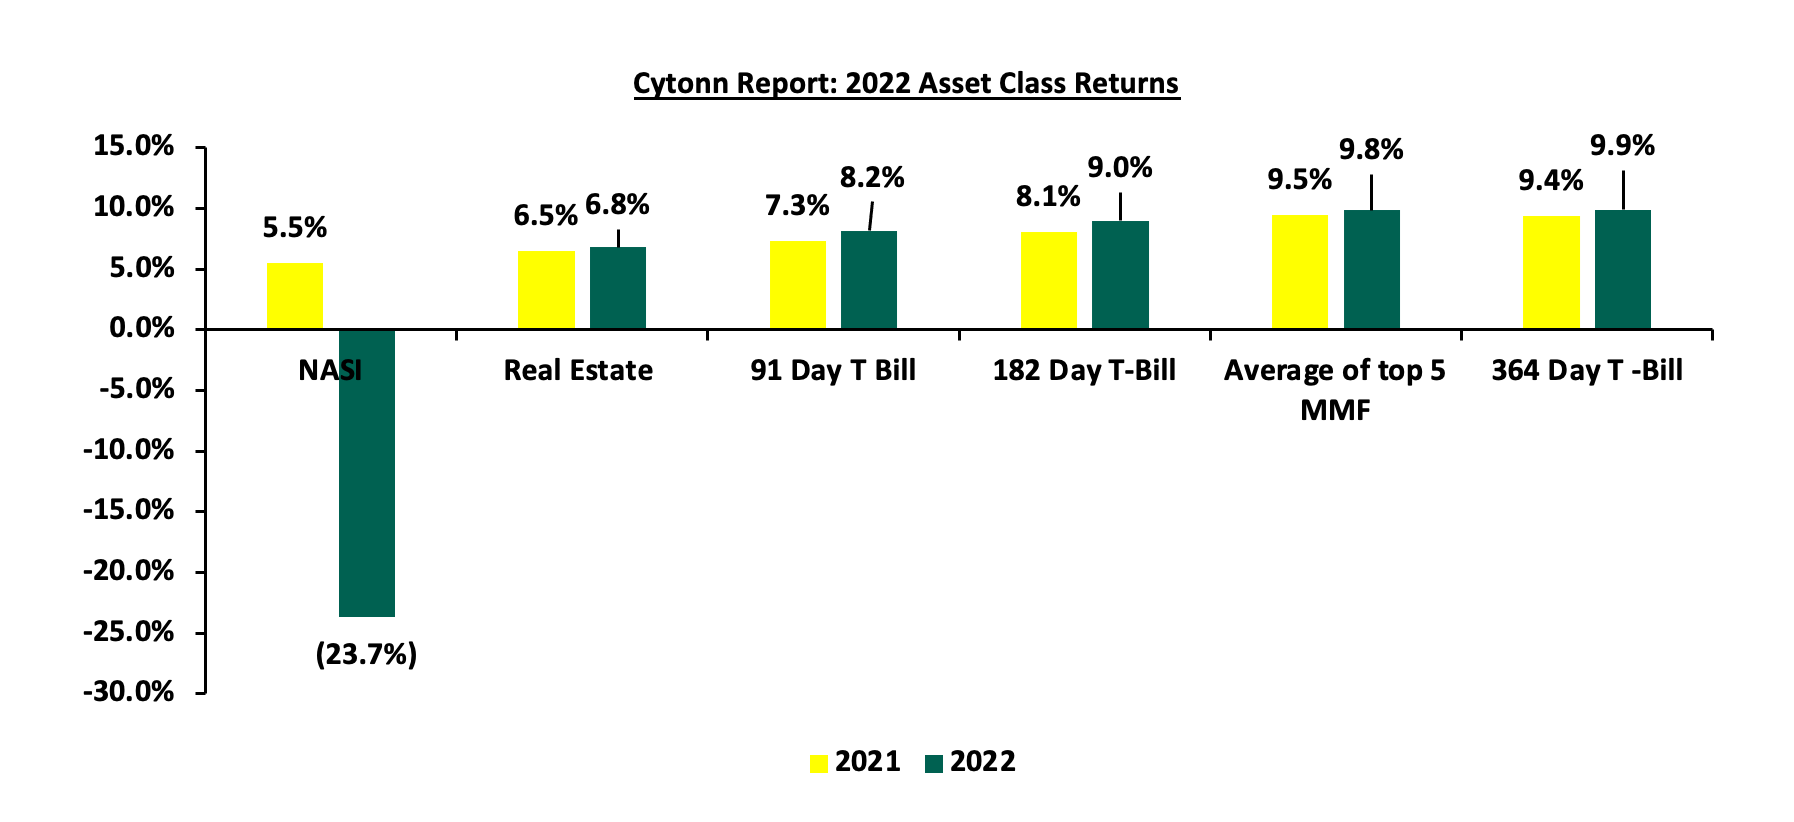
The table below shows the macro-economic indicators that we track, indicating our expectations for each variable at the beginning of 2022 versus the experience;
|
Cytonn Report: Macro-Economic & Business Environment Outlook |
||||
|
Macro-Economic Indicators |
2022 Outlook |
Effect |
2022 Experience |
Effect |
|
Government Borrowing |
|
Negative |
|
Negative |
|
Exchange Rate |
|
Neutral |
|
Negative |
|
Interest Rates |
|
Neutral |
|
Negative |
|
Inflation |
|
Neutral |
|
Negative |
|
GDP |
|
Neutral |
|
Neutral |
|
Investor Sentiment |
|
Negative |
|
Negative |
|
Security |
|
Neutral |
|
Positive |
Since the beginning of the year, the notable changes we have seen out of the seven metrics that we track, fall under four metrics, namely; Interest rates, Inflation, Exchange rates, and Security. Key to note, Security changed from neutral to positive while Interest rates, Inflation, and Exchange rate changed from neutral to negative. In conclusion, macroeconomic fundamentals showed mixed performance during the year with most metrics on downward trajectories. We expect a slight recovery in 2023 supported by the improving business conditions in the country evidenced by the November PMI coming in at 50.9, an improvement from 50.2 in October. However, improvement of the business conditions in the country, are largely pegged on how fast global fuel prices stabilize, decline in inflation rates and stabilization of the Kenyan currency. This is because, Kenya, as a net fuel importer suffers from imported inflation levels.
T-Bills & T-Bonds Primary Auction:
During the year, T-bills auction recorded an undersubscription, with the average subscription rate coming in at 94.9% compared to an average of 91.9% in 2021, partially attributable to tightened liquidity in the market with the average interbank rate increasing to 4.9% in 2022 from 4.7% in 2021 and perceived risks arising from the August 2022 General Elections. Notably, the pre-election subscription rates weighed down on the overall subscriptions with the pre-election T-bills average subscription coming in at 88.8%, lower than the Post-election average of 103.8%. The yields on the 91-day, 182-day and 364-day T-bills increased by 124.3 bps, 142.2 bps and 133.1 bps to 8.2%, 9.0% and 9.9% in 2021, from 7.0%, 7.6% and 8.6% at the end of 2021, respectively. Yields on government securities were on an upward trajectory, mainly attributable to investors attaching higher premiums to compensate for perceived risks arising from inflationary pressures and local currency depreciation.
During the week, T-bills were undersubscribed, for the second consecutive week, with the overall subscription rate dropping significantly to 17.9%, down from the 69.9% recorded the previous week, partly attributable to the tightened liquidity in the money market with the average interbank rate increasing to 6.4% from 6.2% recorded the previous week. Investor’s preference for the shorter 91-day paper persisted as they sought to avoid duration risk, with the paper receiving bids worth Kshs 2.2 bn against the offered Kshs 4.0 bn, translating to a subscription rate of 54.5%, down from 347.9% recorded the previous week. The subscription rates for the 364-day and the 182-day papers also declined to 4.3% and 16.9% from 9.3% and 19.3% recorded the previous week, respectively. The yields on the government papers recorded mixed performance, with the yields on the 364-day and 91-day papers declining slightly by 0.2 bps and 0.1 bps to 10.3% and 9.4%, respectively, while the yield on 182-day paper increased marginally by 0.9 bps to 9.8%. The Government continued to reject expensive bids, accepting a total of Kshs 4.2 bn worth of bids out of the Kshs 4.3 bn worth of bids received, translating to an acceptance rate of 98.6%.
Primary T-bond auctions in 2022 were undersubscribed, with the subscription rate averaging 98.8%, which was lower than the 147.6% average subscription rate recorded in 2021, partly attributable to the tightened liquidity in the money market with the average interbank rate increasing to 4.9% in 2022, from 4.7% in 2021 and perceived risks arising from the August 2022 General Elections Notably, the pre-election subscription rates weighed down on the overall subscriptions with the pre-election average T-bills subscriptions coming in at 88.8% lower than 103.8% for post-elections. The average acceptance rate came in at 87.2% in 2022, a 7.3% points increase from the 79.9% recorded in 2021 as the market adjusted to the increasing interest rate in the country.
Secondary Bond Market Activity:
The secondary bond market recorded reduced activity with the turnover having declined by 19.8% to Kshs 736.9 bn, from Kshs 919.1 bn in 2021. This is attributable to local institutional investors decreasing their allocation to treasury bonds as most of them increased lending to the private sector, higher interest rates in developed countries leading to capital flight by foreign investors and tightened liquidity in the market.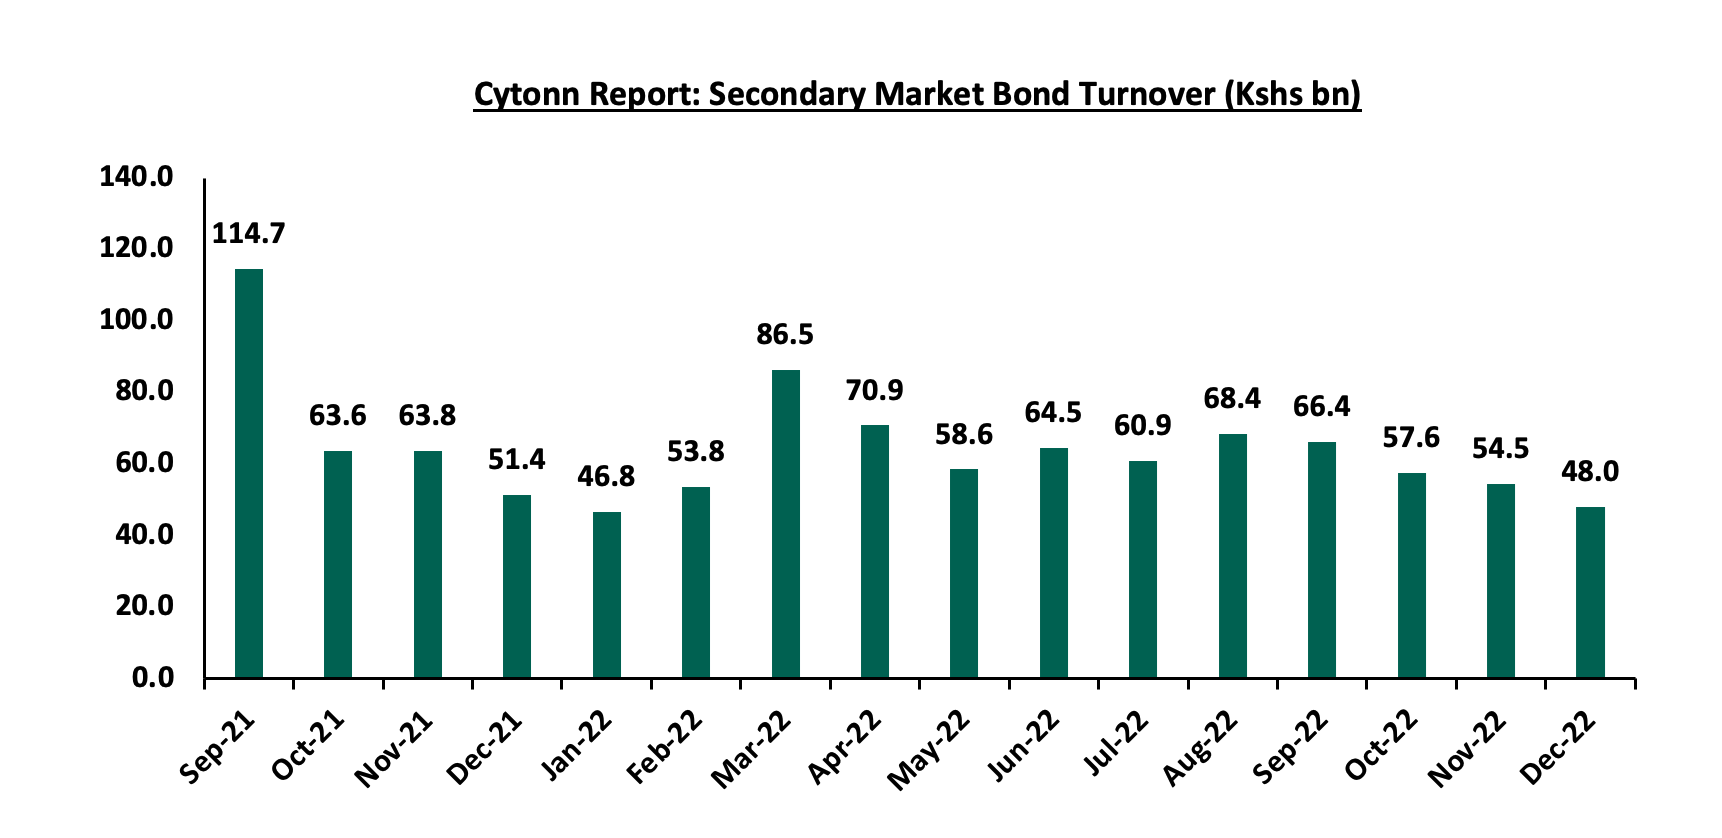
In 2022, the yield curve experienced an upward adjustment, partly attributable to the increased government borrowing, currency depreciation and the increasing inflation seen in 2022 which is expected to persist in the short-term. As such, investors will continue to demand higher yields to compensate for inflation and currency depreciation risk leading to rise across the yield curve. The chart below is the yield curve movement during the period; 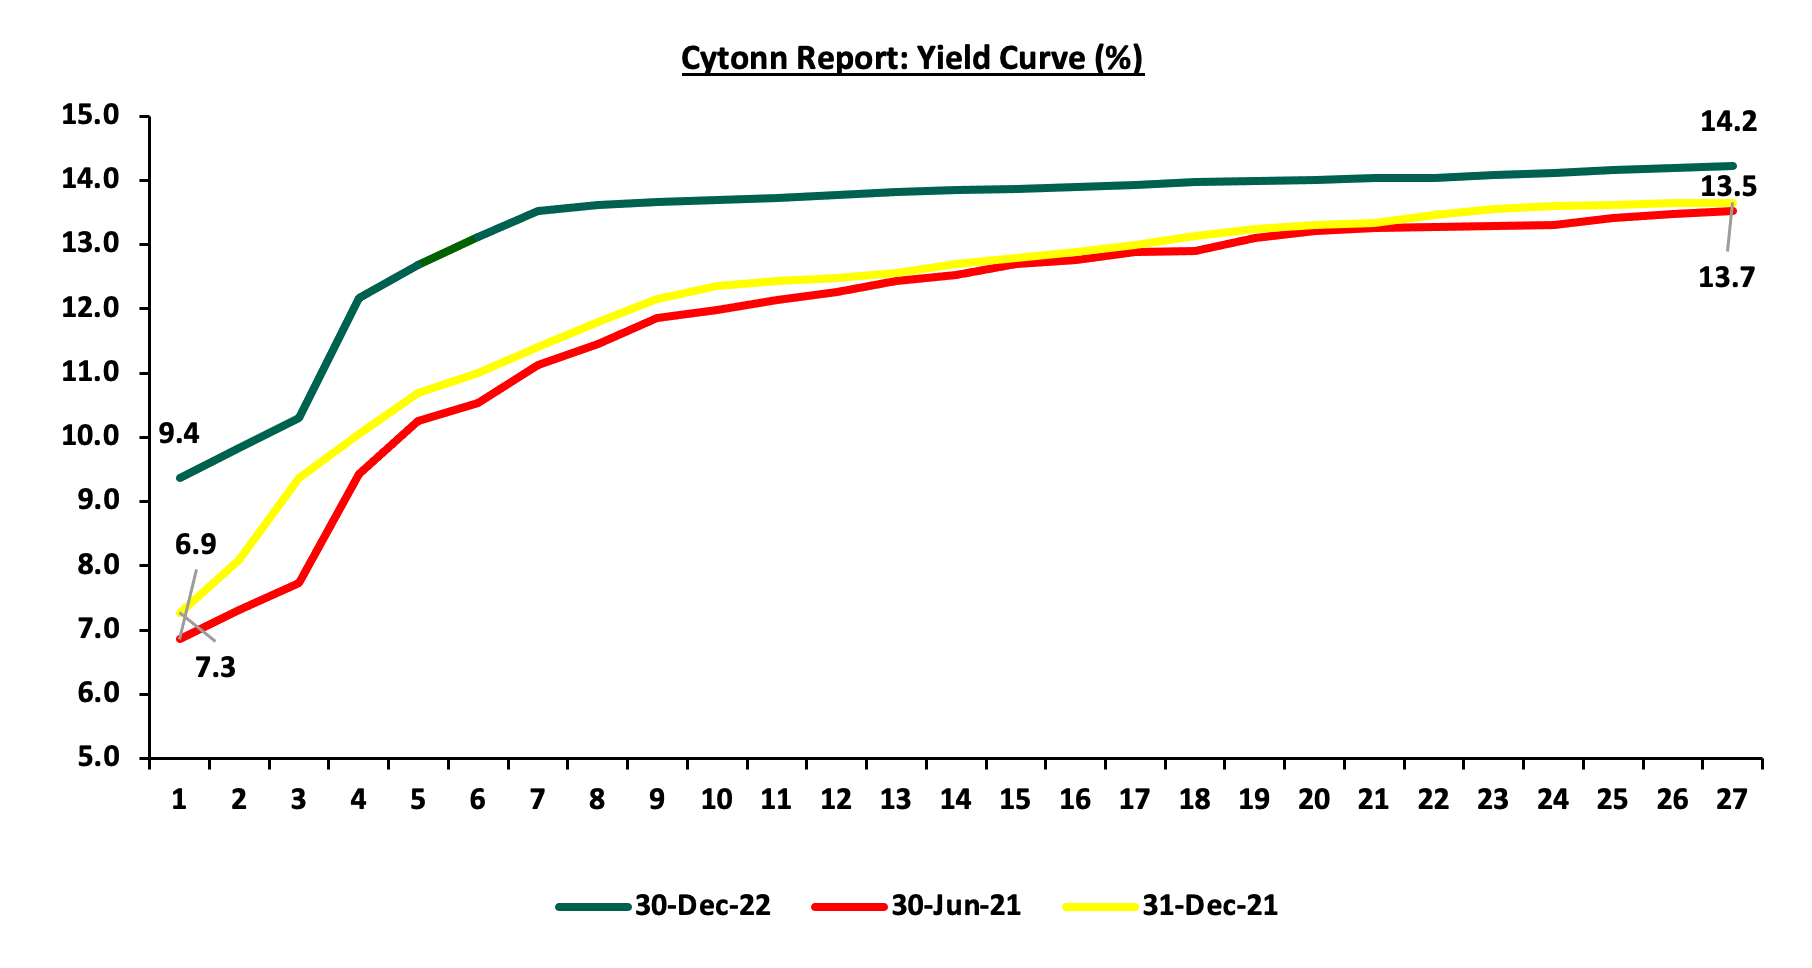
Money Market Performance: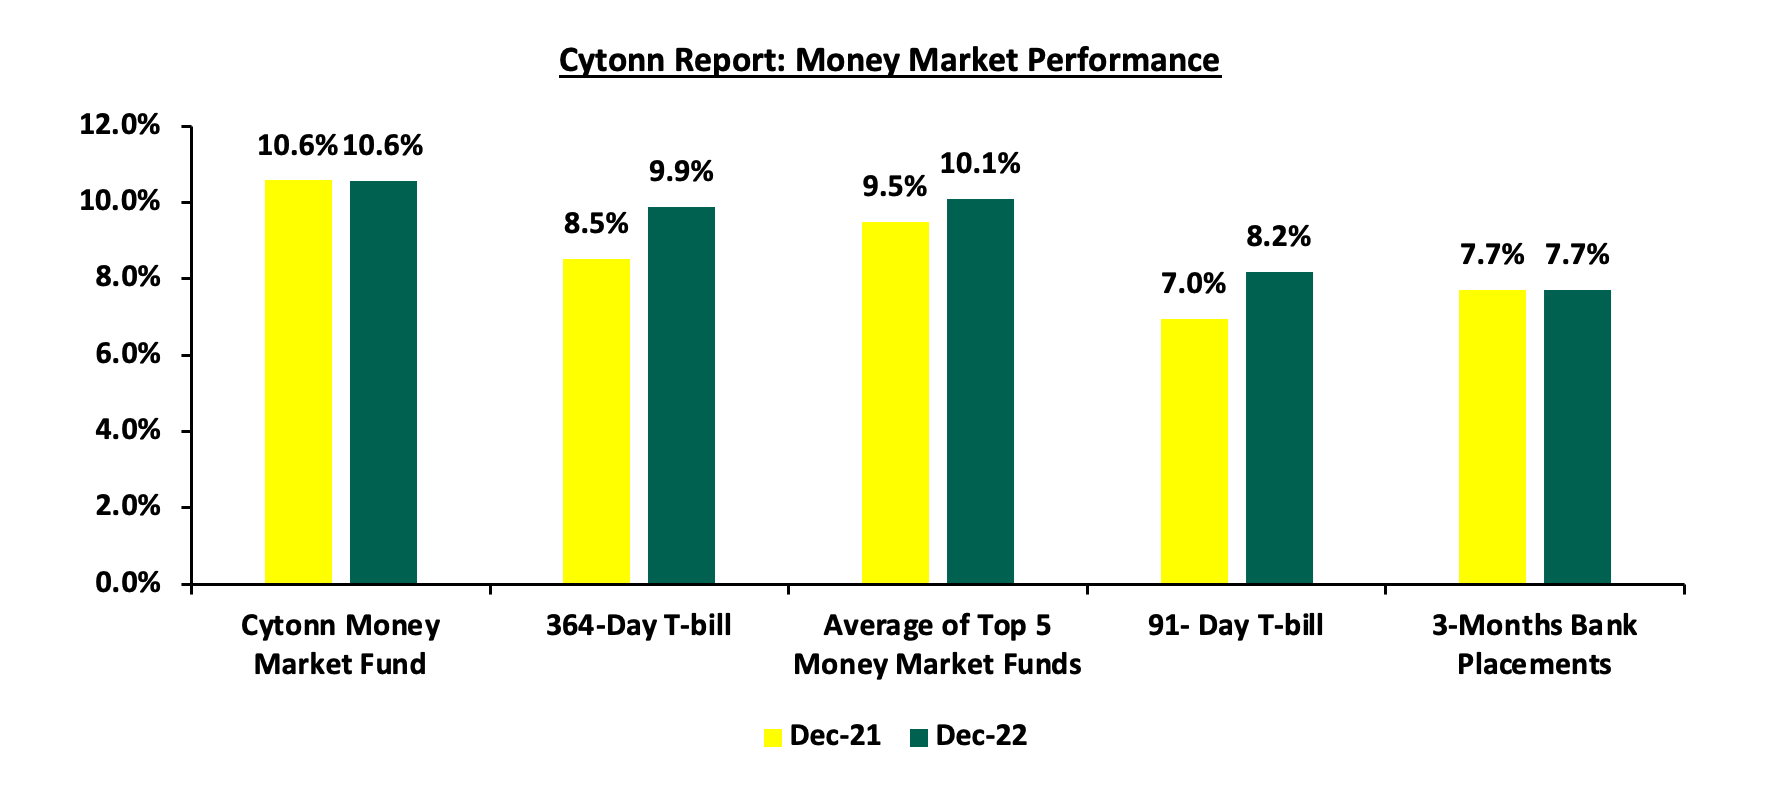
The 3-month bank placements recorded 7.7% as at the end of FY’2022, similar to what was recorded at the end of FY’2021 (based on what we have been offered by various banks). The average yield on the 91-day T-bill and the average Top 5 Money Market Funds increased by 1.2% points and 0.6% points to 8.2% and 10.1% in FY’2022 from 7.0% and 9.5% in FY’2021, respectively. The average yield on the Cytonn Money Market (CMMF) remained relatively unchanged at 10.6% in FY’2022 same as to what was recorded in FY’2021.
During the week, 3-month bank placements ended the week at 7.7% (based on what we have been offered by various banks), while the yield on the 364-day T-bill and 91-day T-bill declined slightly by 0.2 bps and 0.1 bps to 10.3% and 9.4%, respectively. The average yield of the Top 5 Money Market Funds and Cytonn Money Market Fund remained relatively unchanged at 10.1% and 10.9%, respectively, as recorded the previous week.
The table below shows the Money Market Fund Yields for Kenyan Fund Managers as published on 30th December 2022:
|
Cytonn Report: Money Market Fund Yield for Fund Managers as published on 30th December 2022 |
||
|
Rank |
Fund Manager |
Effective Annual Rate |
|
1 |
Cytonn Money Market Fund(dial *809# or download Cytonn App) |
10.9% |
|
2 |
Zimele Money Market Fund |
9.9% |
|
3 |
NCBA Money Market Fund |
9.9% |
|
4 |
Kuza Money Market fund |
9.9% |
|
5 |
GenCap Hela Imara Money Market Fund |
9.9% |
|
6 |
Apollo Money Market Fund |
9.8% |
|
7 |
Sanlam Money Market Fund |
9.6% |
|
8 |
Nabo Africa Money Market Fund |
9.5% |
|
9 |
Madison Money Market Fund |
9.5% |
|
10 |
Old Mutual Money Market Fund |
9.5% |
|
11 |
Co-op Money Market Fund |
9.2% |
|
12 |
Dry Associates Money Market Fund |
9.2% |
|
13 |
CIC Money Market Fund |
9.1% |
|
14 |
British-American Money Market Fund |
9.0% |
|
15 |
AA Kenya Shillings Fund |
8.7% |
|
16 |
ICEA Lion Money Market Fund |
8.7% |
|
17 |
Orient Kasha Money Market Fund |
8.6% |
|
18 |
Absa Shilling Money Market Fund |
7.9% |
Source: Business Daily
Liquidity:
During the year, liquidity levels tightened as evidenced by the increase in the average interbank rate to 4.9%, from 4.7% in 2021. The tightened liquidity is partly due to tax remittances which offset government payments. The average volumes traded in the interbank market increased significantly by 74.7% to Kshs 18.6 bn in 2022 from Kshs 10.7 bn recorded in 2021.
During the week, liquidity in the money markets slightly tightened, with the average interbank rate rising to 6.4% from 6.2% recorded the previous week, partly attributable to tax remittances that offset government payments. The average interbank volumes traded declined by 0.6% to Kshs 21.3 bn from Kshs 21.2 bn recorded the previous week.
Kenya Eurobonds:
Yields on all Kenyan Eurobonds generally increased in 2022, pointing towards increased concerns on the elevated inflationary pressures and currency depreciation. As a result, investors attached higher premiums to the country’s Eurobonds. According to the CBK, the yields on the 10-Year Eurobond issued in 2014, set to mature in 2024, increased the most by 8.5% points to 12.9%, from 4.4% recorded at the end of 2021.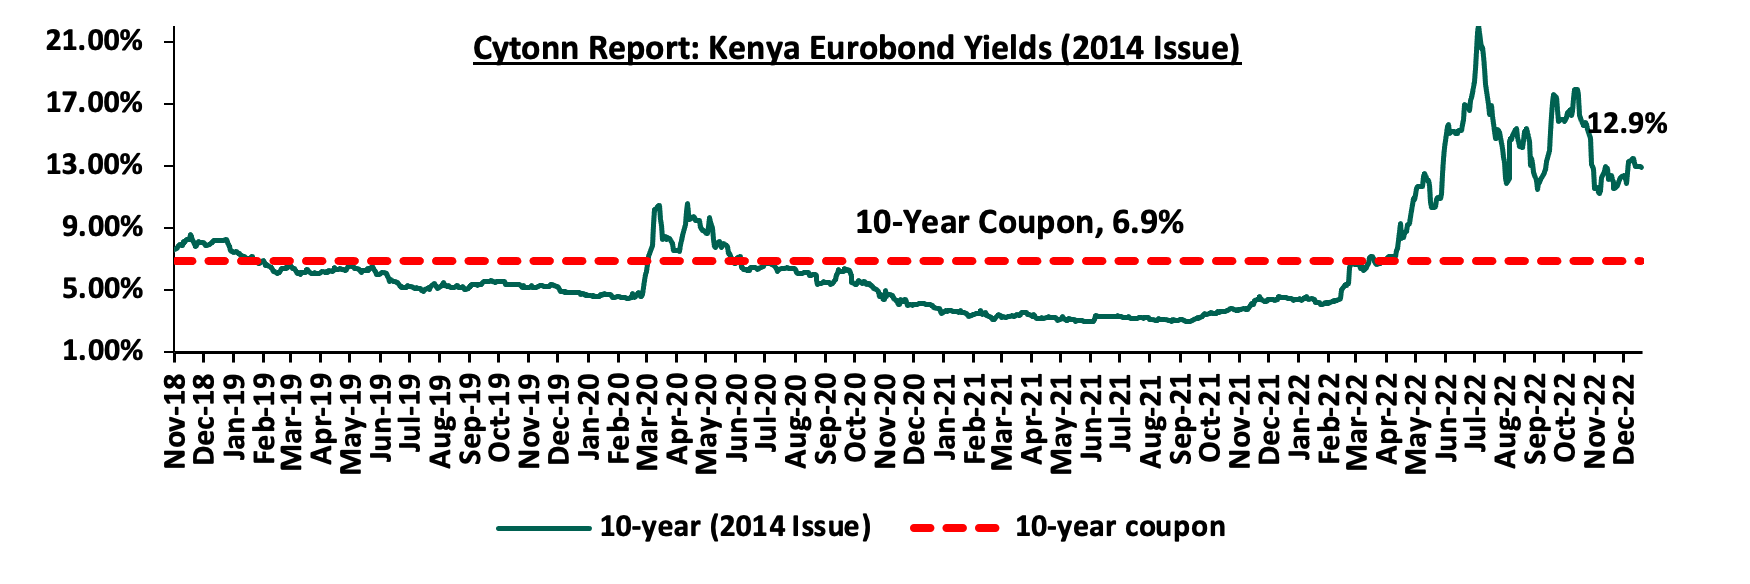
For the 2018 Eurobond issue, the yields on the 10-year Eurobond and the 30-year Eurobond both increased by 4.6% points and 2.8% points to close the year at 10.4% and 10.9%, from yields of 5.8% and 8.1% at the close of 2021 respectively. 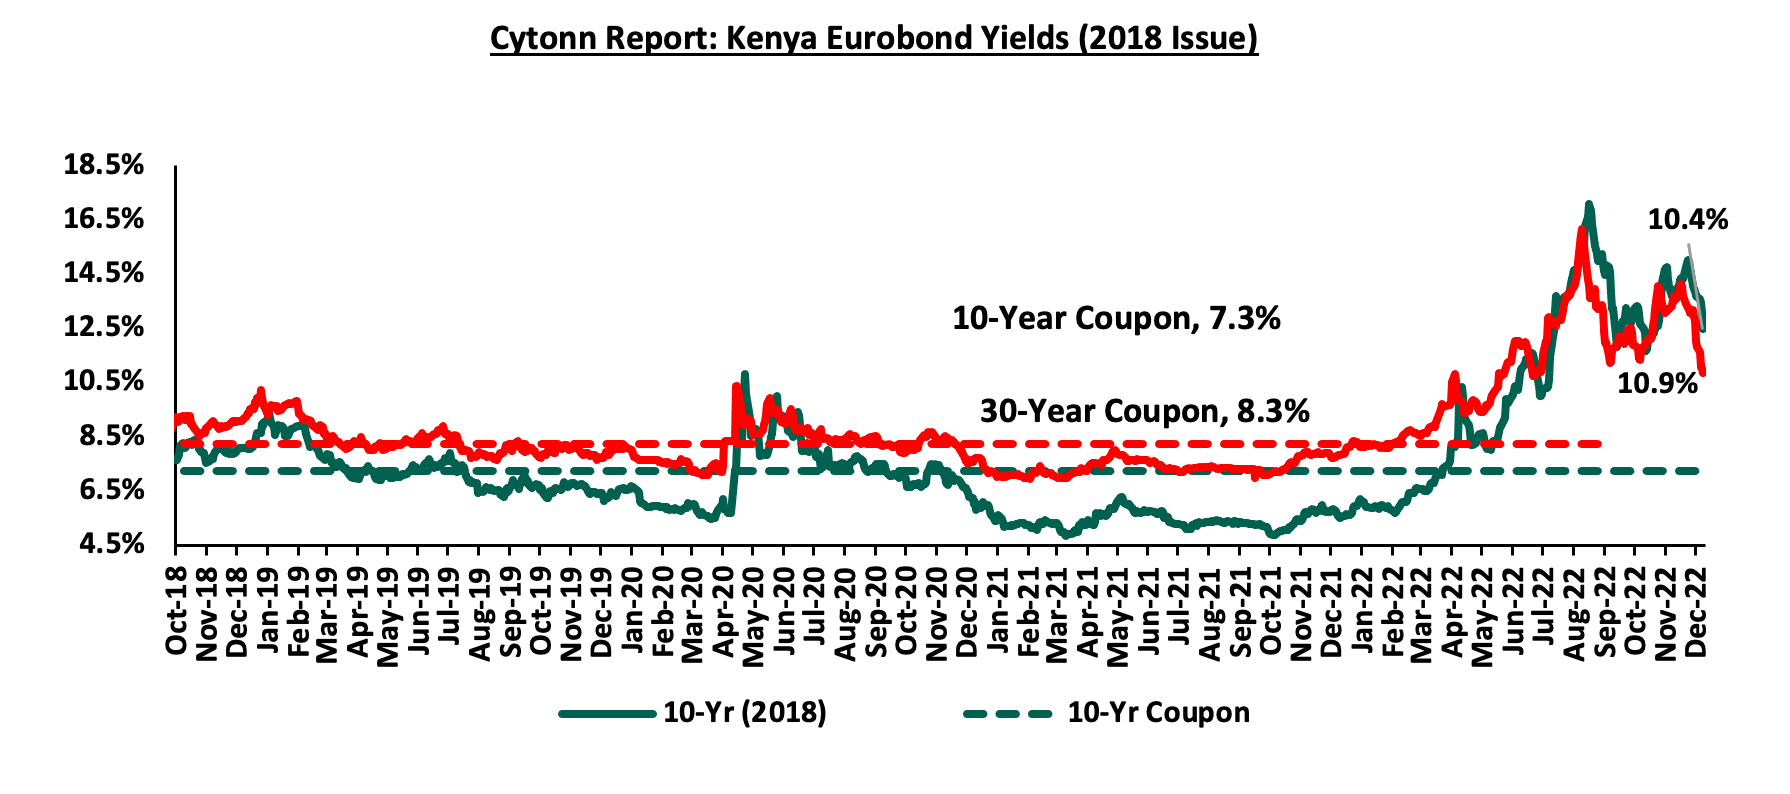
For the 2019 Dual-tranche Eurobond issue, the yields on the 7-year Eurobond and the 12-year Eurobond increased by 5.3% points and 4.1% points to close the year at 10.9% and 10.8%, from 5.6% and 6.7% at the close of 2021, respectively. 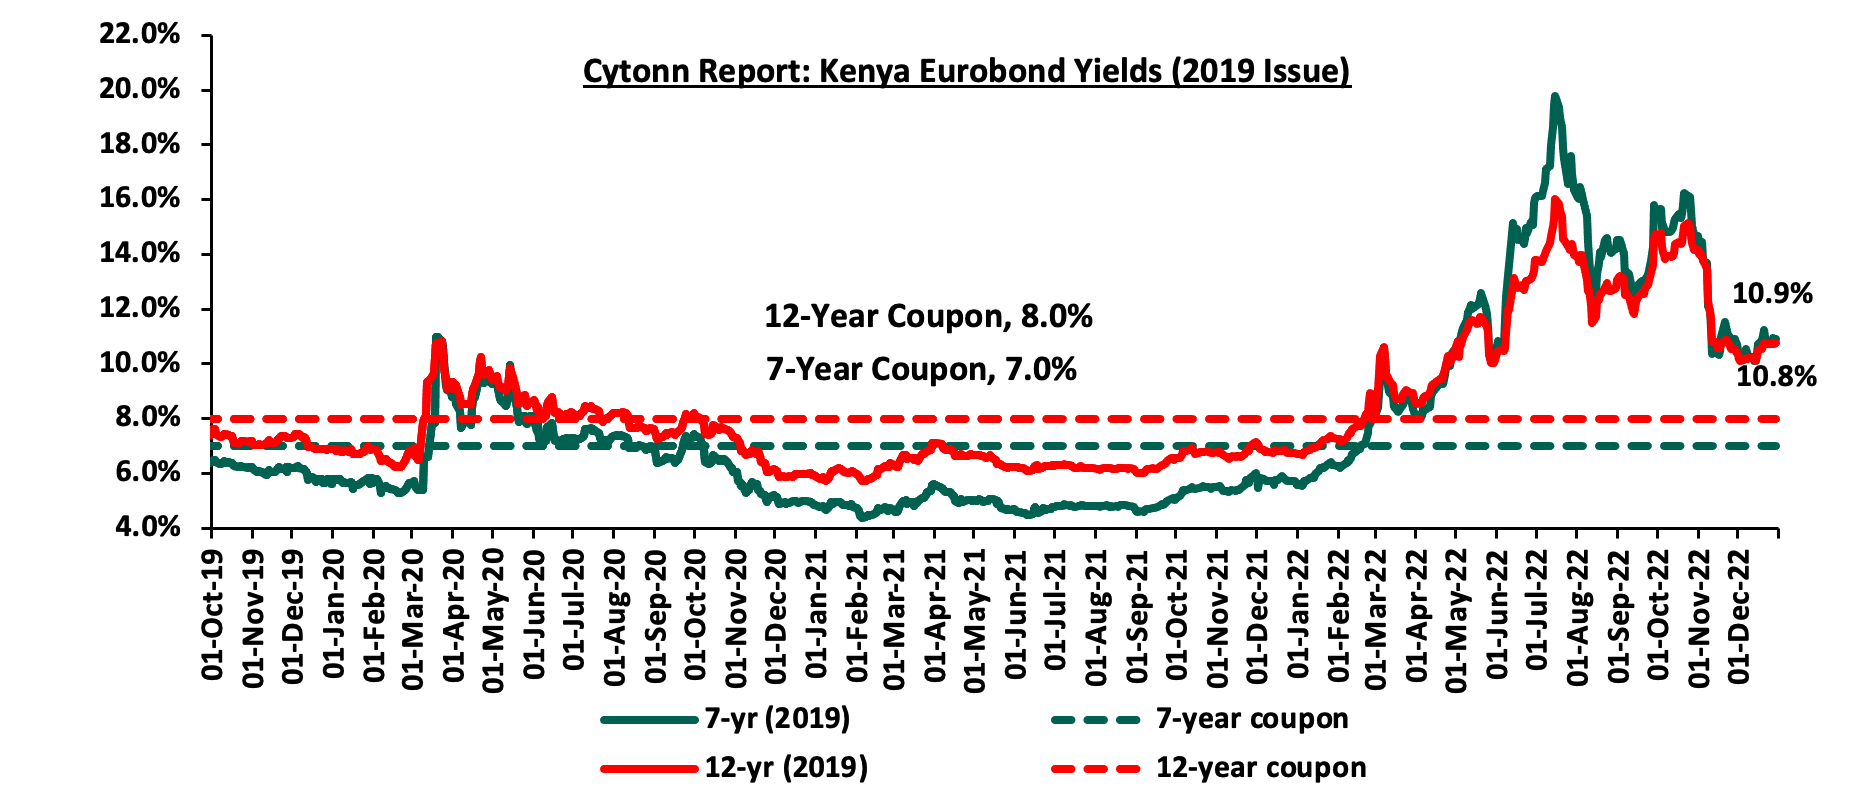
The yields on the 12-Year Eurobond issued in 2021, set to mature in 2033, increased by 3.3% points to 9.9%, from 6.6% recorded at the end of 2022
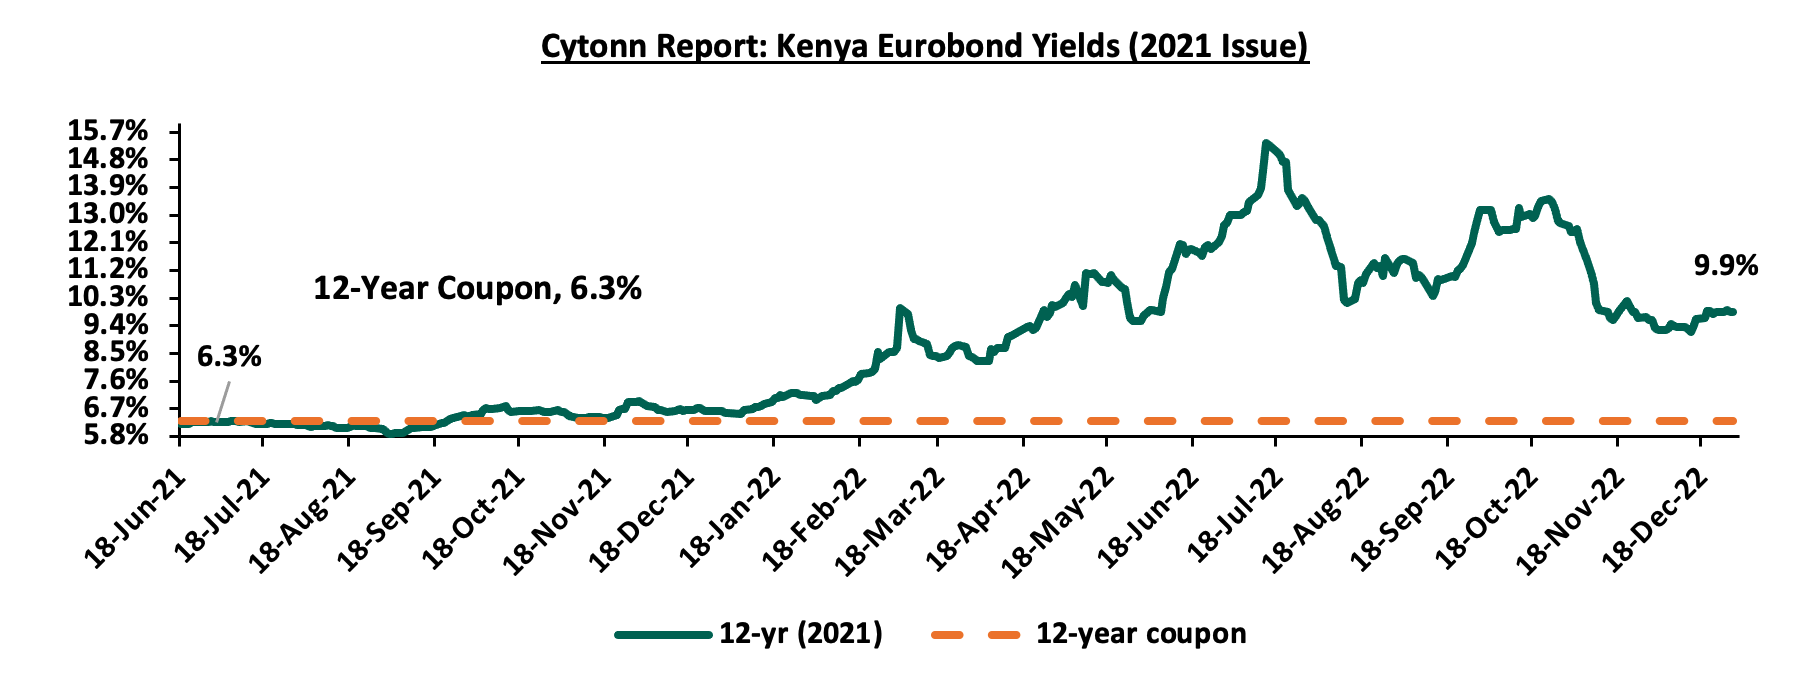
However, during the week, the yields on Eurobonds recorded mixed performance with the 7-year Eurobond issued in 2019, 12-year Eurobond issued in 2019 and 12-year Eurobond issued in 2021 increasing by 0.1% points each to 10.9%, 10.8% and 9.9% from 10.8%, 10.7% and 9.8%, respectively while the 10-year Eurobond issued in 2014 declined the most by 0.2% points to 12.9% from 13.1%. The table below shows the summary of the performance of the Kenyan Eurobonds as of 30th December 2022;
|
Cytonn Report: Kenya Eurobond Performance |
||||||
|
|
2014 |
2018 |
2019 |
2021 |
||
|
Date |
10-year issue |
10-year issue |
30-year issue |
7-year issue |
12-year issue |
12-year issue |
|
3-Jan-22 |
4.4% |
8.1% |
8.1% |
5.6% |
6.7% |
6.6% |
|
30-Nov-22 |
12.0% |
10.1% |
10.8% |
10.7% |
10.4% |
9.6% |
|
22-Dec-22 |
13.1% |
10.4% |
10.9% |
10.8% |
10.7% |
9.8% |
|
23-Dec-22 |
13.0% |
10.4% |
10.9% |
10.8% |
10.7% |
9.9% |
|
26-Dec-22 |
13.0% |
10.4% |
10.9% |
10.8% |
10.7% |
9.9% |
|
27-Dec-22 |
13.0% |
10.5% |
10.9% |
10.9% |
10.8% |
9.9% |
|
28-Dec-22 |
13.0% |
10.4% |
10.9% |
10.9% |
10.7% |
9.9% |
|
29-Dec-22 |
12.9% |
10.4% |
10.9% |
10.9% |
10.8% |
9.9% |
|
Weekly Change |
(0.2%) |
0.0% |
0.0% |
0.1% |
0.1% |
0.1% |
|
MTM Change |
0.9% |
0.4% |
0.1% |
0.2% |
0.3% |
0.3% |
|
YTD Change |
8.5% |
2.4% |
2.8% |
5.3% |
4.1% |
3.3% |
Source: Central Bank of Kenya (CBK)
Weekly Highlights:
- Nigeria Government seeks to restructure short term loans owed to the Central Bank of Nigeria
During the week, Nigeria’s President sent a proposal to parliament for approval to allow for a restructuring of USD 54.0 bn, short term loans owed to its Central Bank to a 40-year security at an interest of 9.0%. The debt was incurred through Ways and Means Advances to finance government deficit as a result of delayed government receipts. The Nigerian Executive also requested for a three-year moratorium on interest payments on existing debts and asked for another USD 2.2 bn (N1.0 tn) debt from Central bank on similar terms. This comes at a time when the country has been accruing more debt resulting to high debt service to revenue, it was at 57.1% in 2021. High debt service has resulted to deterioration on debt payment leading to Fitch downgrading Nigeria’s rating to ‘B-‘ with stable outlook. According to the Nigeria’s Central Bank Report, the total public debt at the end of September 2022 stood at USD 98.2 bn (N44.1 tn), representing 37.3% of GDP. This represents an increase of 32.0% to USD 98.2 bn (N44.1 tn) in September 2022 from USD 75.3 bn (N33.8 tn) as at the end of September 2021. The increase is mainly attributable to new borrowings by the federal government to finance the estimated budget deficit of 6.2% of GDP in 2022 mainly attributable to fuel subsidy costs. The total domestic debt stood at USD 60.0 (N26.9 tn), representing 61.1% of total debt while the external debt was at USD 38.2 (N17.2 tn).
According to International Monetary Fund (IMF), the government’s debt to GDP is projected at 37.3% for 2022 which is 12.7% points below the IMF’s threshold of 50.0% for developing countries. However, this is not of significant concern since debt to GDP ratio is still sustainable. Additionally, the USD 54.0 bn debt is owed to the central bank and not the investors in the government securities. Significant to note, the World Bank stated that Nigeria has not approached them for debt restructuring, but for suitable options to reduce the high debt service. This indicates that Nigeria’s debt is sustainable in the medium-term, however, such debt is susceptible to macro-economic shock which can quickly push debt levels straining revenue through high interest payments making the fiscal position highly vulnerable to real interest rate shocks. Additionally, the increasing debt situation will also reduce expenditure on vital social issues such as health and education which are already in poor state. Below is a chart showing Nigeria’s debt to GDP levels;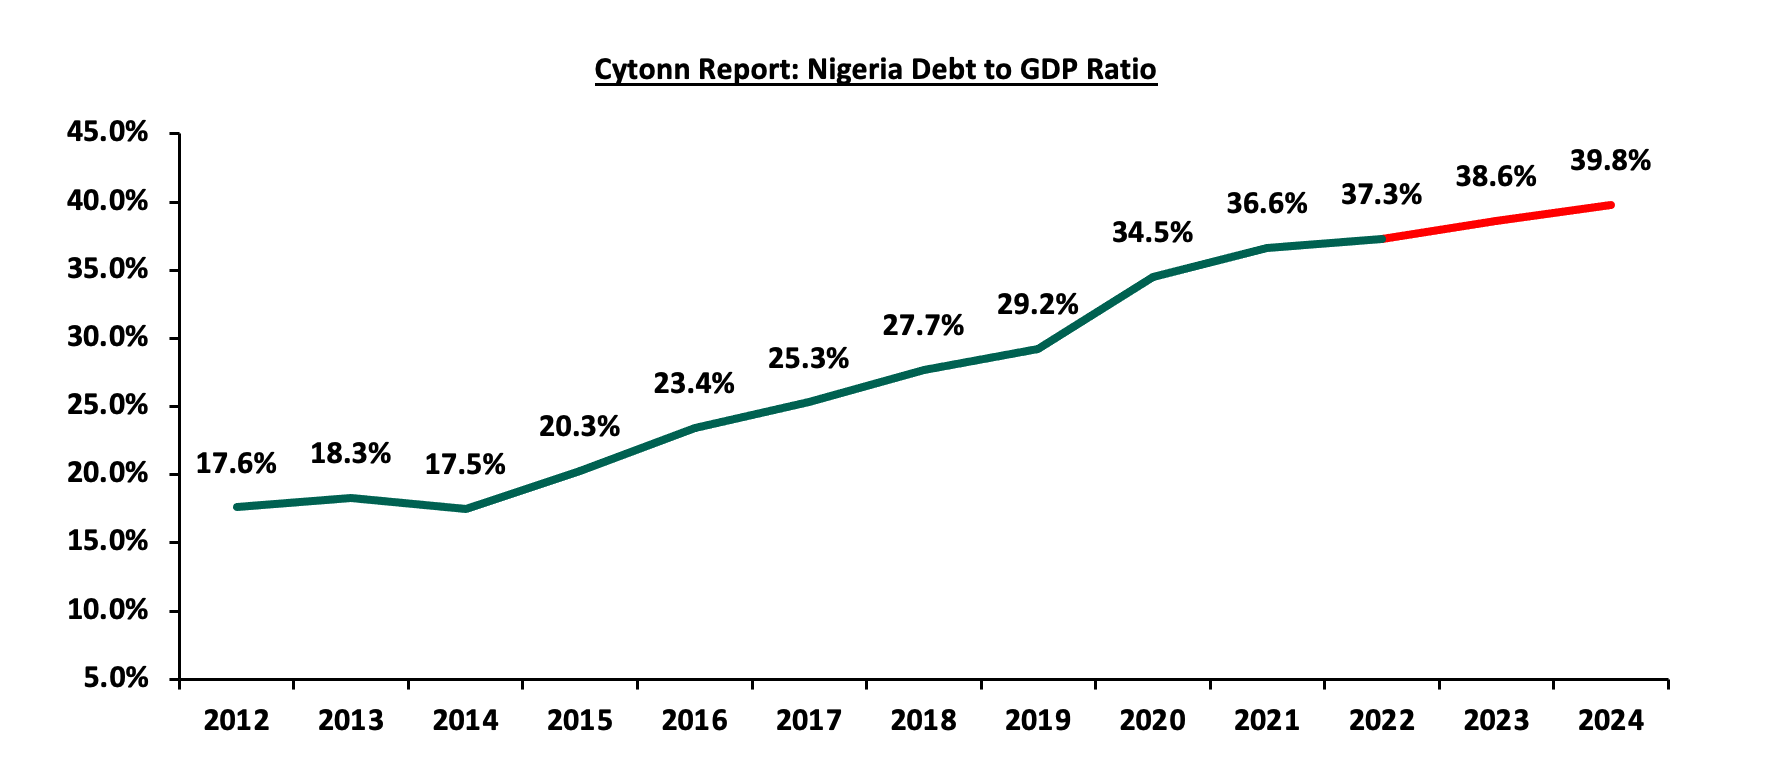
Source: IMF
Despite Nigeria’s ability to manage her debt in the medium-term, many counties in Sub-Saharan Africa (SSA) are on the verge of debt distress. One such case study is Ghana, which we covered in our Cytonn Weekly highlighting that Ghana’s Public Debt stood at USD 54.5 bn, equivalent to 77.5% of GDP as of May 2022 with external debt to GDP at 39.9% while that of the domestic debt at 37.5%. The debt service to revenue ratio as of 2021 stood at 47.8% and is projected at 90.7% for 2022 which is 40.7% points above the IMF’s threshold of 50.0% for developing countries. Below is a table comparing various debt metrics between Nigeria, Ghana and Kenya;
|
|
Nigeria |
Ghana |
Kenya |
|
Public Debt (USD bn) |
98.2 |
54.4 |
70.9 |
|
Public Debt to GDP |
37.3% |
90.7% |
69.4% |
|
Debt Service to Revenue ratio |
57.1% |
47.8% |
50.0% |
Source: Nigeria Ministry of Finance, Kenya National Treasury, IMF and Ministry of Finance Ghana
Key to note, public debt has been increasing steadily in Sub-Saharan Africa escalated by the increasing spending and reduced revenue collection during the COVID-19 pandemic. According to the IMF Regional Economic Outlook for Sub-Saharan Region, at least one-third of the region’s economies have debt levels above 70.0% of the GDP resulting to 19 of the region’s 35 low-income nations to be in debt distress or at a high risk of such. As such, Nigeria is better placed to manage its debt situation compared to the many nations in SSA on the verge of debt distress.
- Kenya Q3’2022 GDP growth
The Kenya National Bureau of Statistics (KNBS) released the Q3’2022 Quarterly Gross Domestic Product Report highlighting that the Kenyan economy recorded a 4.7% growth in Q3’2022, significantly lower than the 9.3% growth recorded in Q3’2021 when the most sectors of the economy were recovering from the impacts of COVID-19 pandemic. The performance during the quarter was largely supported by growth recorded in sectors like Accommodation and Food Services activities (22.9%), Wholesale and retail trade (9.1%), Professional, Administrative and Support services (8.7%) and Education (7.1%), among others. The expansion was however weighed down by declines recorded sectors such as Mining and quarrying, and Agriculture and Forestry which contracted by 2.2% and 0.6%, respectively. The key take-outs from the report include;
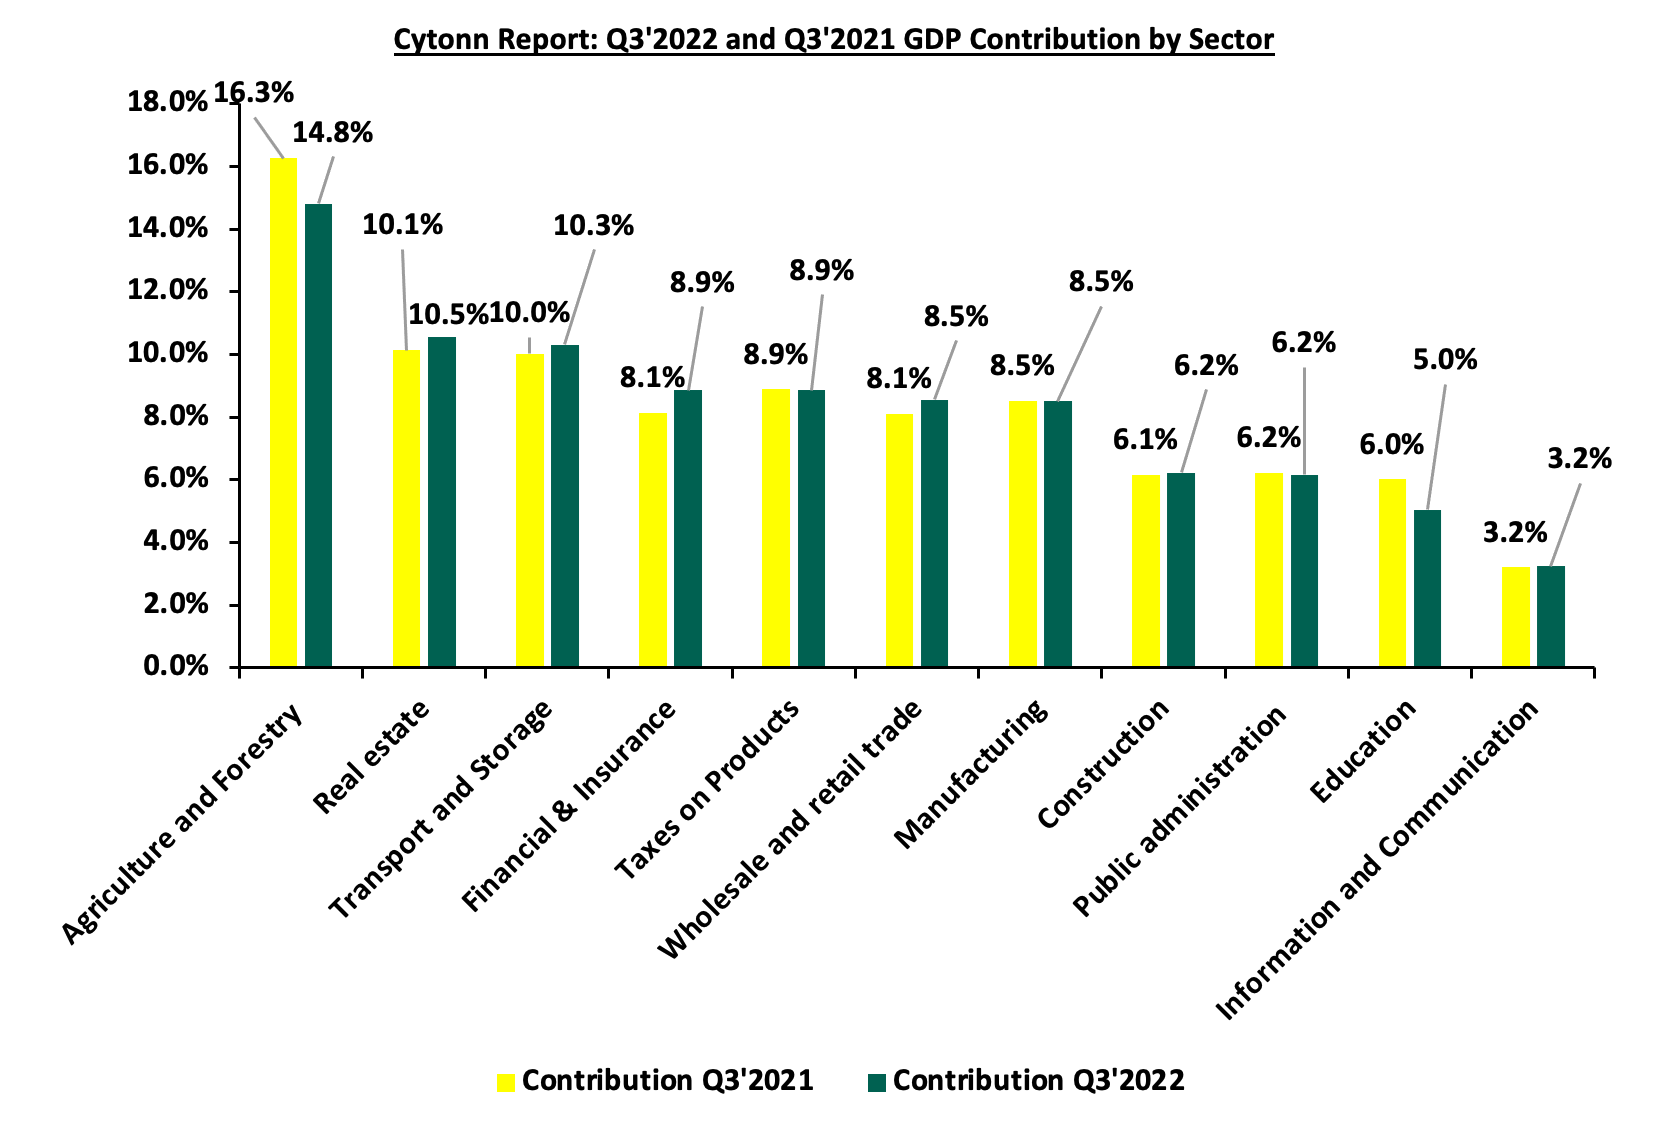
- Sectoral Contribution to Growth - The biggest gainer in terms of sectoral contribution to GDP was Financial and Insurance sector, increasing by 0.8% points to 8.9% from 8.1% in Q3’2021, while Agriculture and Forestry was the biggest loser, declining by 1.5% points to 14.8% in Q3’2022, from 16.3% in Q3’2021. Real Estate remained the 2nd largest contributor to GDP at 10.5%, a 0.4% increase from 10.1% in Q3’2021. Accommodation and Food Services sector recorded the highest growth rate in Q3’2022 growing by 22.9% compared to the 127.5% growth recorded in Q3’2021. The chart below shows the top contributors to GDP by sector in Q3’2022:
Source: KNBS Q3’2022 and Q3’2021 GDP Report
- Continued subdued Growth in the Agricultural Sector – Agriculture, Forestry and Fishing activities recorded a decline of 0.6% in Q3’2022 compared to a growth of 0.6% in Q3’2021. The contraction recorded during the quarter was mainly attributable to unfavorable weather conditions experienced in the first three quarters of 2022 which resulted to lower agricultural production. The sector's poor performance was reflected by declines recorded in vegetable exports and milk production. However, increased production of fruits, coffee, and cane cushioned the sector from a deeper slump,
- Slower growth in the manufacturing sector - The manufacturing sector reported a growth of 2.4% in Q3’2022 compared to a 10.2% growth in a similar period of review in 2021. However, the sectoral contribution remained relatively unchanged at 8.5%, as was recorded in the similar period in 2021, and,
- Sustained rebound in the Accommodation and Food services sector- The sector recorded 22.9% growth in Q3’2022 though lower than the 127.5% growth recorded in Q3’2021. This comes after sector recorded significantly subdued performance in 2020 and part of 2021 as a consequence of the COVID-19 pandemic. As such, the activity in the sector remained resilient during the quarter, with the number of visitor’s arrival through Jomo Kenyatta international Airport and Moi international Airport increasing by 44.6% to 315,112 up from 217, 873 recorded in Q3’2021. Additionally, the sectoral contribution increased by 0.5% points to 1.0% in Q3’2022 from 0.5% recorded in Q3’2021. The chart below shows the different sectoral GDP growth rates for Q3’2022:
Source: KNBS Q3’2022 GDP Report
Going forward, we expect the economy to grow at a slower pace given the subdued general business environment in the country mainly as a result of elevated inflationary pressures occasioned by high fuel and food prices. Additionally, the MPC decision to raise the Central Bank Rate (CBR) by 50.0 bps to 8.75% from 82.5% by the CBK Monetary Policy Committee in a bid to curb inflation and maintain price stability is expected to curtail economic growth. Further, we expect the Agricultural sector to remain subdued largely due to erratic weather conditions. However, the sector is expected to be supported by the recent fiscal policies such as subsidizing costs of crucial farm inputs such as fertilizers that will enhance growth in the sector, which remains as Kenya’s largest contributor to GDP as well as food prices being a major contributor to headline inflation.
- Kenya’s Q3’2022 Balance of Payments
The Kenya National Bureau of Statistics released the Quarterly Balance of Payments report for Q3’2022 report highlighting that Kenya’s balance of payments position recorded a deficit of Kshs 112.7 bn, a significant declines of 283.9% from a deficit of Kshs 29.3 bn in Q3’2021. Additionally, the BoP performance was a reversal from the surplus of Kshs 10.9 bn recorded in Q2’2022. The performance was mainly attributable to widening of the current account deficit by 5.5% to Kshs 193.4 bn from Kshs 183.4 bn recorded in Q3’2021, coupled with a 13.4% expansion of the financial account to Kshs 190.8 bn from Kshs 168.3 bn recorded in Q3’2021. The table below shows the breakdown of the various balance of payments components, comparing Q3’2022 and Q3’2021;
Cytonn Report: Quarterly Balance of Payments
Item
Q2’2021
Q2’2022
Q3’2021
Q3’2022
y/y % Change
Current Account Balance
(158.9)
(174.4)
(183.4)
(193.4)
(5.5%)
Capital Account Balance
7.4
4.9
3.9
0.6
(84.0%)
Financial Account Balance
(282.5)
(253.0)
(168.3)
(190.8)
13.4%
Net Errors and Omissions
48.7
(72.6)
(18.1)
(110.7)
(511.7%)
Balance of Payments
179.8
10.9
(29.3)
(112.7)
(283.9%)
All values in Kshs bns
Key take-outs from the table include;
- The current account deficit (value of goods and services imported exceeds the value of those exported) expanded 5.5% to Kshs 193.4 bn from Kshs 183.4 bn in Q3’2021, mainly attributable to the 15.8% increase in the merchandise trade balance deficit to Kshs 373.1 bn, from Kshs 322.0 bn recorded in Q3’2021,
- The capital account (shows capital transfers receivable and payable between residents and non-residents, including the acquisition and disposal of non-produced non-financial items) which includes foreign direct investments (FDIs), contracted by 84.0% to Kshs 0.6 bn from Kshs 3.9 bn in Q3’2021, highlighting the increased perceived risks by investors due to the deteriorated macroeconomic and business environment,
- The financial account balance deficit (the difference between the foreign assets purchased by domestic buyers and the domestic assets purchased by foreign buyers) expanded by 13.4% to Kshs 190.8 bn from a deficit of Kshs 168.3 bn recorded in Q3’2021. Also, the stock of gross official reserves declined by 11.7% to Kshs 940.2 bn, from Kshs 1,064.2 in Q3’2021 and,
- Consequently, the Balance of Payments (BoP) position declined to a deficit of Kshs 112.7 bn from a deficit of Kshs 29.3 bn mainly due to the 5.5% widening of the current account and the 84.0% decline in capital account balance.
Current Account Balance
The Kenya’s current account deficit increased by 5.5% to Kshs 193.4 bn in Q3’2022 from Kshs 183.4 bn in Q3’2021 and a 10.9% increase from a deficit of Kshs 174.4 bn in Q2’2022, driven by;
- The widening of the merchandise trade (a scenario where imports are greater than exports of goods resulting to a negative net foreign investment) by 15.8% to Kshs 373.1 bn, from Kshs 322.0 bn recorded in Q3’2021,
- A 162.7% increase in the services trade balance (the difference between imports and exports of services) to Kshs 59.2 bn from Kshs 22.5 bn in Q3’2021, and,
- An 8.7% increase in the secondary income balance (the transactions recorded in the secondary income account pertain to those current transfers between residents and non-residents that directly affect the level of gross national disponsable income and thus influence the economy’s ability to consume goods and services), to Kshs 183.8 bn from Kshs 169.1 bn in Q3’2021.
The table below shows the breakdown of the various current account components, comparing Q3’2022 and Q3’2021;
Cytonn Report: Quarterly Current Account Balance
Item
Q2’2021
Q2’2022
Q3’2021
Q3’2022
% Change
Merchandise Trade balance
(271.6)
(365.6)
(322.0)
(373.1)
15.8%
Service Trade Balance
12.7
59.3
22.5
59.2
162.7%
Primary Income Balance
(62.5)
(51.6)
(53.0)
(63.3)
19.5%
Secondary Income (Transfers) Balance
162.5
183.5
169.1
183.8
8.7%
Current Account Balance
(158.9)
(174.4)
(183.4)
(193.4)
5.5%
All values in Kshs bns
During Q3’2022, the Kenyan Shilling depreciated by 9.2% y/y to Kshs 120.7 from Kshs 110.5 in Q3’2021, which, however, was supported by sufficient forex reserves which came in at USD 7.4 bn in Q3’2022. The performance of Kenya’s Balance of Payments reflects the tough macroeconomic performance in the country evidenced by the slowdown in the country’s economic growth to 4.7% in Q3’2022 from the 9.3% recorded in Q3’2021. As such, we expect the country’s reliance on imports coupled with high global commodity prices to continue weighing down on the country’s Balance of payments. However, the current administration’s initiatives to increase exports especially agricultural products through multilateral partnerships such as the US- Kenya Strategic Trade and Investment Partnership and the Africa Continental Free Trade Area (AfCFTA) are also expected to ensure relative stability in the Kenya’s Balance of Payments.
Rates in the Fixed Income market have remained relatively stable due to the relatively ample liquidity in the money market. The government is 6.3% ahead of its prorated borrowing target of Kshs 290.9 bn having borrowed Kshs 309.1 bn of the Kshs 581.7 bn borrowing target for the FY’2022/2023. We expect sustained gradual economic recovery as evidenced by the revenue collections of Kshs 789.3 bn in the FY’2022/2023 as at the end of November, equivalent to a 36.9% of its target of Kshs 2.1 tn. Despite the performance, we believe that the projected budget deficit of 6.2% is relatively ambitious given the downside risks and deteriorating business environment occasioned by high inflationary pressures. We however expect the support from the IMF and World Bank to ease the need for elevated borrowing and thus help maintain a stable interest rate environment since the government is not desperate for cash. Owing to this, our view is that investors should be biased towards short-term fixed-income securities to reduce duration risk.
Market Performance
In 2022, the Kenyan equities market was on a downward trajectory, with NASI, NSE 20 and NSE 25 declining by 23.7%, 12.4% and 16.6%, respectively. Below is a summary of the 2022 annual performance of some of the large cap stocks in the Kenyan stock market:
|
Cytonn Report: Kenya Equities Performance - Large Cap Gainers and Losers 2022 |
||
|
No |
Company |
Share Price Performance 2022 |
|
1 |
NCBA Bank Kenya |
54.6% |
|
2 |
Standard Chartered Bank Kenya |
9.8% |
|
3 |
ABSA Bank Kenya |
4.7% |
|
4 |
BAT Kenya |
4.5% |
|
5 |
East African Breweries Limited (EABL) |
1.2% |
|
6 |
Co-operative Bank Kenya |
(5.4%) |
|
7 |
Equity Group |
(15.6%) |
|
8 |
Diamond Trust Bank Kenya |
(16.0%) |
|
9 |
KCB Group |
(16.4%) |
|
10 |
Bamburi Cement |
(17.5%) |
|
11 |
Safaricom |
(36.7%) |
During the week, the equities market recorded mixed performance with NASI declining by 0.5%, while NSE 20 and NSE 25 gained by 0.8% and 0.2%, respectively. The equities market performance was mainly driven by losses recorded by large cap stocks such as Safaricom and Equity Group of 1.8% and 1.7%, respectively. The losses were however mitigated by gains recorded by banking stocks such as NCBA Group, Diamond Trust Bank Kenya, ABSA Bank and Co-operative Bank of 5.5%, 2.0%, 1.7% and 1.2% respectively.
During the year, equities turnover declined by 36.5% to USD 0.8 bn, from USD 1.3 bn in ’2021. Foreign investors remained net sellers, with a net outflow of USD 204.3 mn, compared to net outflows of USD 91.9 mn recorded in 2021. The foreign-investor outflows during the year can be largely attributed to investors fleeing emerging markets such as Kenya, to advanced economies such as United States and United Kingdom following interest rate hikes as well as increased concerns on macroeconomic deterioration.
During the week, equities turnover declined by 31.8% to USD 6.9 mn from USD 10.1 mn recorded the previous week, taking the YTD turnover to USD 794.7 mn. Additionally, foreign investors remained net sellers, with a net selling position of USD 2.9 mn, from a net selling position of USD 4.0 mn recorded the previous week, taking the YTD net selling position to USD 204.3 mn.
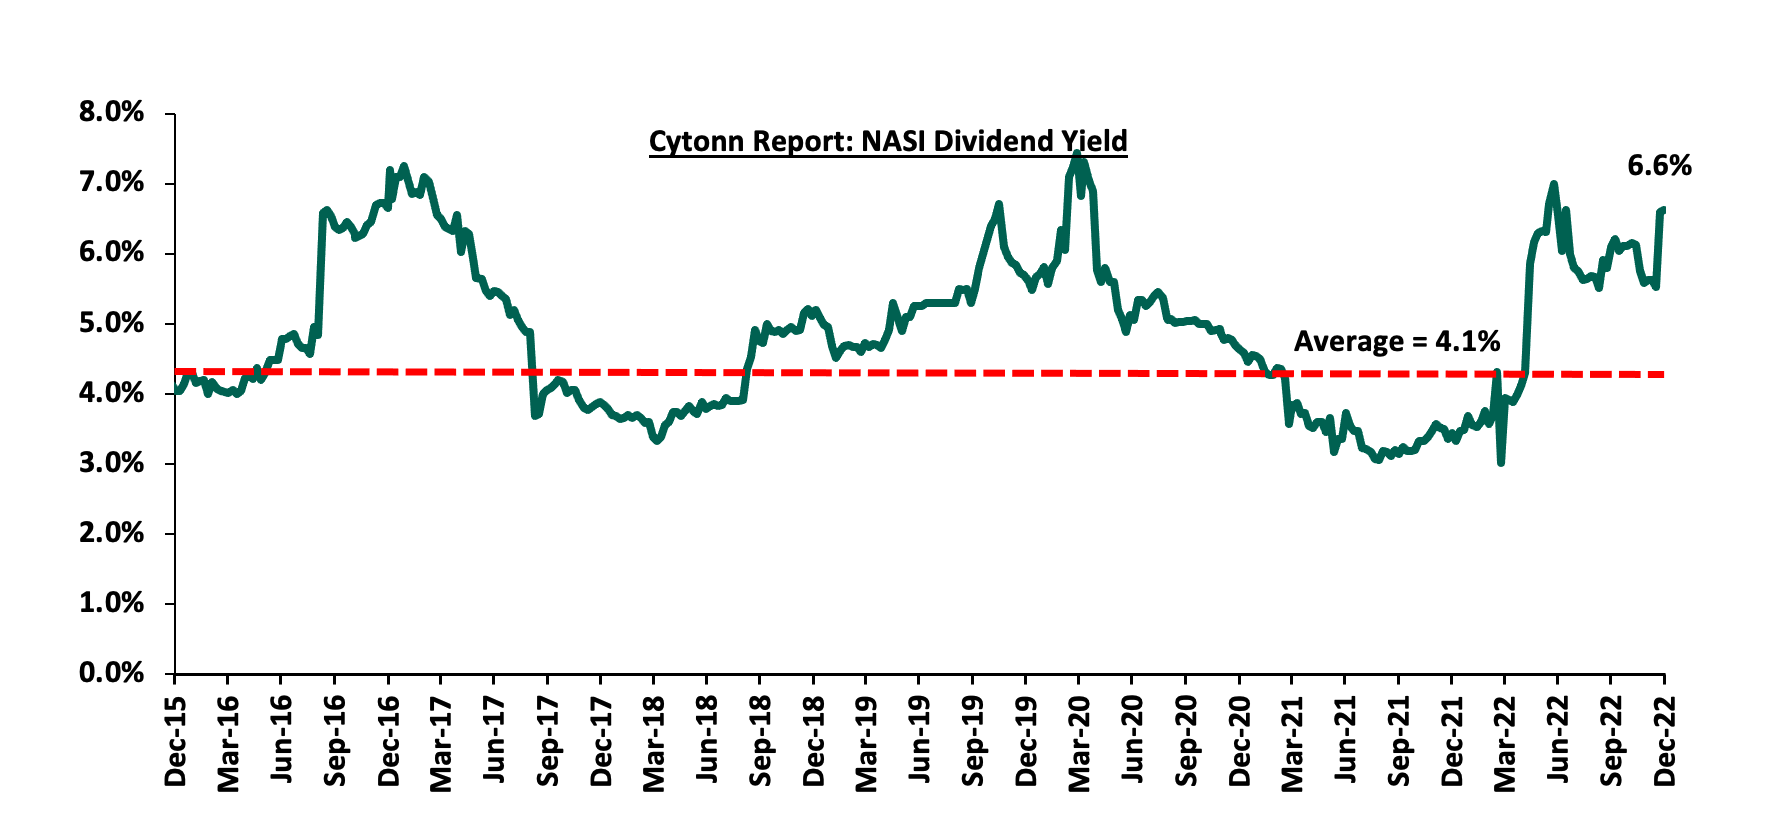
The market is currently trading at a price to earnings ratio (P/E) of 6.7x lower than 11.5x recorded at the end of 2021, and is 47.0% below the 12-year historical average of 12.6x. NASI’s P/E ratio remained suppressed for majority of the year, mainly attributable to drop in prices of large cap stocks such as Safaricom whose price declined by 36.7% during the year. Safaricom continues to be a key part of Kenyan equities portfolios, accounting for 49.6% of Nairobi Stock Exchange (NSE’s) market capitalization, and has dominated both the market turnover and determines the direction of the market given its weight and liquidity in the Nairobi Securities Exchange. On the other hand, the dividend yield is currently at 6.6%, 2.5% points above the historical average of 4.1%.
Key to note, NASI’s PEG ratio currently stands at 0.9x an indication that the market is undervalued relative to its future earnings growth. The charts below indicate the market’s historical P/E and dividend yield: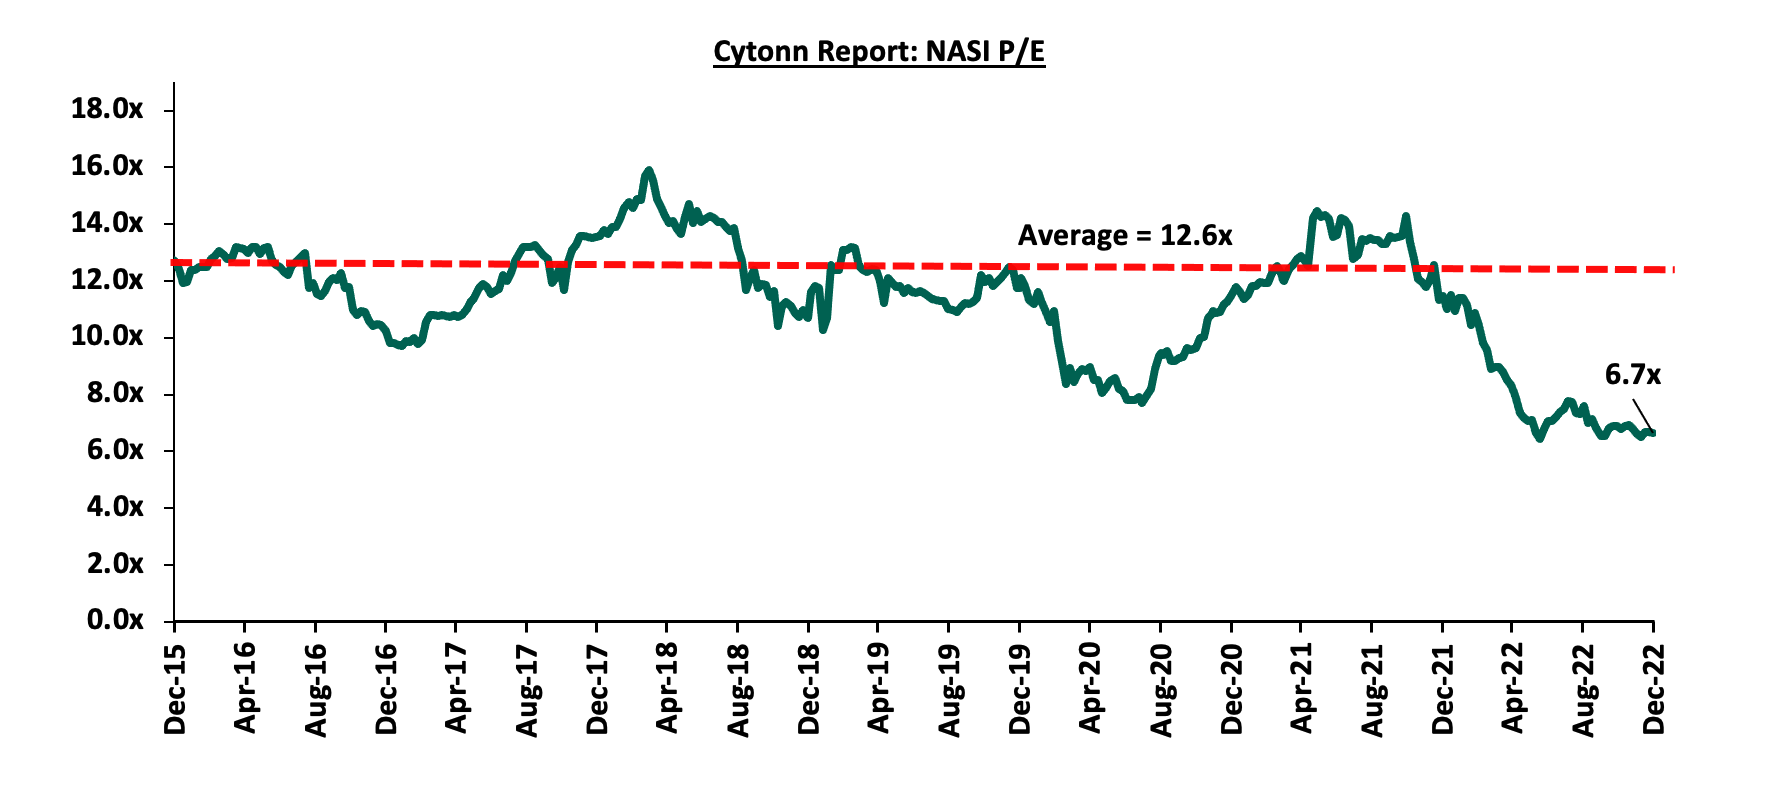
2022 Key Highlights
- Banking Sector Earnings
As per the Q3’2022 results, the listed banks recorded a weighted average increase in the core earnings per share of 36.7%, compared to a weighted average increase of 102.0% in Q3’2021. The table below highlights the performance of the banking sector, showing the performance using several metrics, and the key take-outs of the performance.
|
Cytonn Report: Listed Banks Q3’2022 Earnings and Growth Metrics |
|||||||||||||
|
Bank |
Core EPS Growth |
Interest Income Growth |
Interest Expense Growth |
Net Interest Income Growth |
Net Interest Margin |
Non-Funded Income Growth |
NFI to Total Operating Income |
Growth in Total Fees & Commissions |
Deposit Growth |
Growth in Government Securities |
Loan to Deposit Ratio |
Loan Growth |
Return on Average Equity |
|
HF |
110.8% |
6.8% |
0.7% |
13.9% |
4.7% |
66.1% |
32.4% |
(3.6%) |
3.5% |
51.2% |
90.7% |
1.7% |
0.5% |
|
NCBA |
96.2% |
13.3% |
10.8% |
15.1% |
6.0% |
40.1% |
49.2% |
5.2% |
3.2% |
9.1% |
57.6% |
11.7% |
21.2% |
|
Co-op |
47.0% |
10.5% |
7.2% |
11.7% |
8.5% |
28.3% |
38.6% |
31.7% |
2.8% |
(5.7%) |
77.6% |
9.4% |
22.5% |
|
SCBK |
37.1% |
4.1% |
(12.6%) |
7.3% |
6.3% |
16.1% |
35.7% |
(13.4%) |
10.7% |
13.2% |
47.6% |
3.3% |
21.0% |
|
Stanbic |
36.8% |
3.1% |
19.2% |
26.8% |
6.2% |
37.5% |
44.6% |
8.1% |
25.6% |
38.3% |
88.6% |
34.1% |
25.1% |
|
ABSA |
30.1% |
24.7% |
22.4% |
25.3% |
7.6% |
16.4% |
30.4% |
(1.2%) |
4.6% |
10.5% |
103.0% |
26.4% |
23.2% |
|
Equity |
27.9% |
25.6% |
31.3% |
23.6% |
7.3% |
32.0% |
41.4% |
28.6% |
15.1% |
(0.1%) |
66.9% |
20.6% |
31.3% |
|
I&M |
25.1% |
17.3% |
20.0% |
15.6% |
6.6% |
43.0% |
35.4% |
26.0% |
6.7% |
(2.6%) |
75.1% |
11.4% |
13.9% |
|
KCB |
21.4% |
13.6% |
28.4% |
9.1% |
8.1% |
30.2% |
33.2% |
17.3% |
7.4% |
6.9% |
80.1% |
16.4% |
22.6% |
|
DTB-K |
21.1% |
15.4% |
17.2% |
43.5% |
5.7% |
43.5% |
29.0% |
24.5% |
11.1% |
17.4% |
67.7% |
18.5% |
8.0% |
|
Q3'22 Mkt Weighted Average* |
36.7% |
16.4% |
19.6% |
17.6% |
7.3% |
30.1% |
38.1% |
16.2% |
9.7% |
6.5% |
73.7% |
17.1% |
24.2% |
|
Q3'21 Mkt Weighted Average** |
102.0% |
15.9% |
14.9% |
16.9% |
7.3% |
14.3% |
35.2% |
11.4% |
14.3% |
11.7% |
69.7% |
12.4% |
18.7% |
|
*Market cap weighted as at 08/12/2022 |
|||||||||||||
|
**Market cap weighted as at 10/12/2021 |
|||||||||||||
Key takeaways from the table include:
- The listed banks recorded a 36.7% weighted average growth in core Earnings per Share (EPS), compared to a weighted growth of 102.0% recorded in Q3’2021 when the sector was recovering from a lower base. The performance during the period was mainly attributed to a 30.1% growth in non-funded income coupled with a 17.6% growth in net interest income,
- The listed banks continued to implement their revenue diversification strategies as evidenced by non-funded income growth of 30.1% in Q3’2022 compared to 14.3% growth recoded in Q3’2021. The performance was mainly driven by 16.2% growth in total fees and commissions, which was an increase from 11.4% growth recorded during the same period last year,
- The Banks recorded a weighted average deposit growth of 9.7%, slower than the 14.3% growth recorded in Q3’2021, an indication of reduced investment risk in the business environment,
- Interest income grew by 16.4% in Q3’2022, compared to a growth of 15.9% recorded in Q3’2021 while the weighted average Yield on Interest Earning Assets (YIEA) remained relatively unchanged at 9.9%, similar to what was recorded in in Q3’2021 for the listed banking sector. Additionally, the Net Interest Margin (NIM) also remained unchanged at 7.3%, as was recorded in Q3’2021 for the whole listed banking sector, and,
- The listed banks recorded a 24.2% weighted average Return on Equity (ROE), 5.5% points higher than the 18.7% weighted average recorded in Q3’2021. Additionally, the entire banking sector’s Return on Equity recorded 5.2% points increase to 27.2% in Q3’2022, from 22.0% recorded in Q3’2021. As such, the Kenyan banking sector continues to record high profitability compared to other economies in the world with a 13.3% points higher ROE than the average of 13.9%. The chart below compares the banking sector’s return on equity in Kenya to other economies around the world;
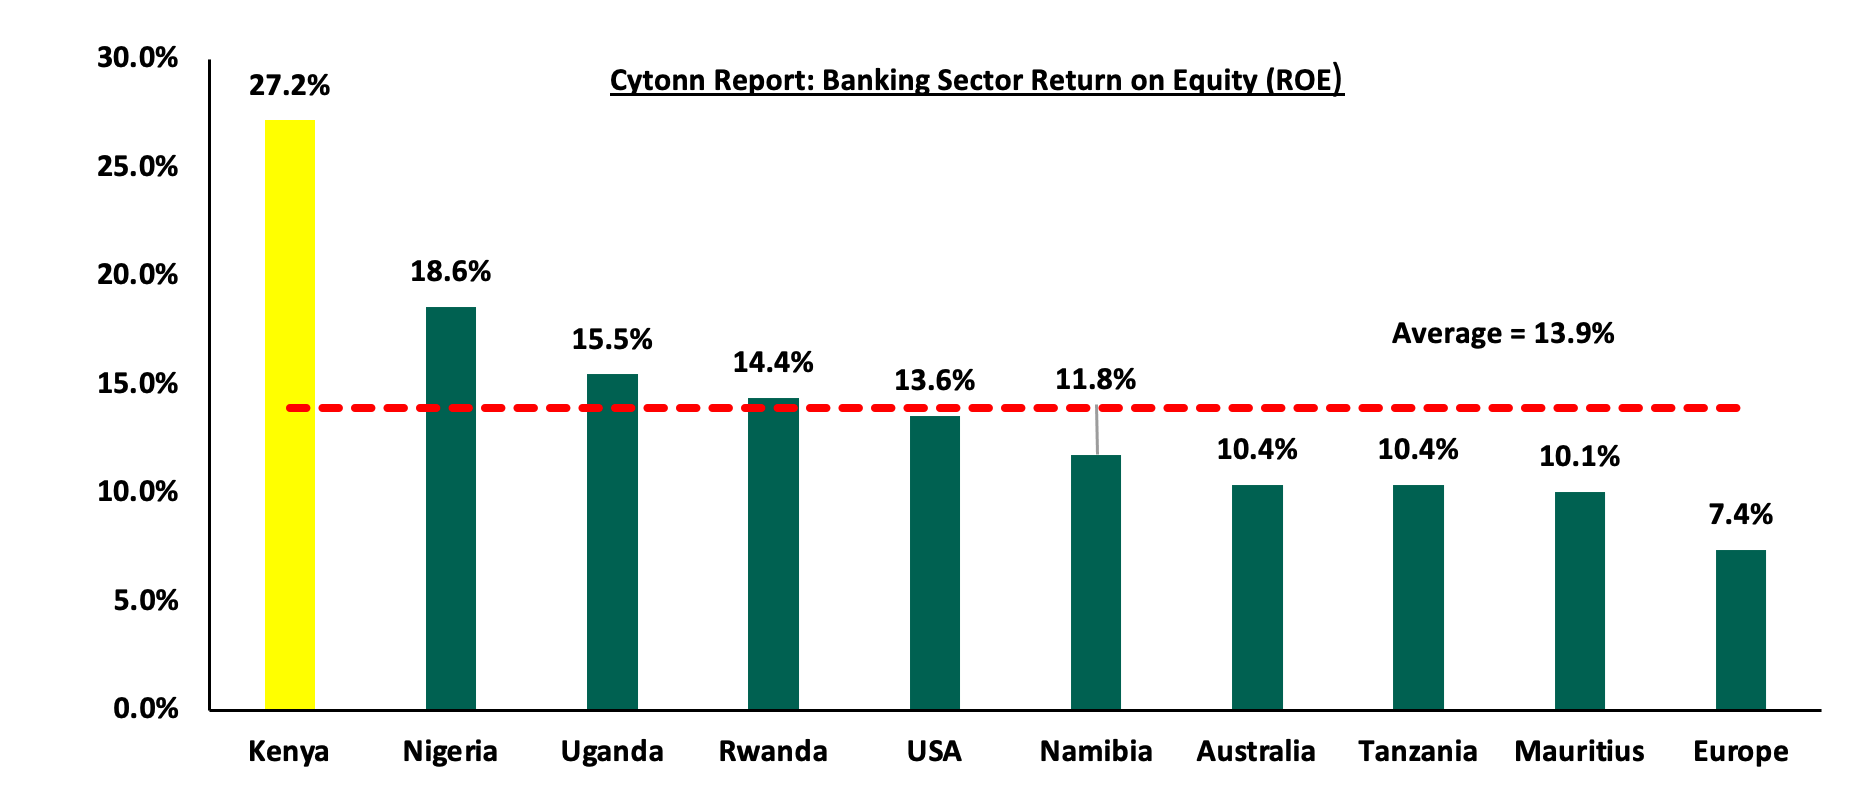
For more information, see our Kenya Listed Banks Q3’2022 Report.
- Insurance Sector Earnings:
During the year, Kenya listed insurers released their H1’2022 results, recording a weighted average increase in core earnings per share of share 16.0%, compared to a weighted average increase of 127.6% in H1’2021. The table below highlights the performance of the listed insurance sector, showing the performance using several metrics, and the key take-outs of the performance;
Cytonn Report: Listed Insurance Companies H1’2022 Earnings and Growth Metrics
Insurance
Core EPS Growth
Net Premium growth
Claims growth
Loss Ratio
Expense Ratio
Combined Ratio
ROaE
ROaA
Britam
77.4%
5.1%
(1.5%)
73.5%
48.6%
122.1%
2.0%
0.3%
CIC
45.0%
20.5%
2.0%
68.8%
49.6%
118.4%
4.7%
0.8%
Sanlam
(1.4%)
5.5%
(9.1%)
91.4%
36.7%
128.2%
(34.4%)
(0.8%)
Jubilee Insurance
(25.3%)
(7.6%)
(16.2%)
99.4%
33.7%
133.0%
8.0%
2.2%
Liberty
(99.4%)
6.1%
(20.0%)
60.6%
66.9%
127.5%
0.02%
0.004%
*H1'2022 Weighted Average
16.0%
1.7%
(8.7%)
83.4%
43.4%
126.8%
3.4%
1.1%
H1'2021 Weighted Average
127.6%
6.3%
29.1%
92.8%
53.8%
146.6%
6.2%
1.6%
*Market cap weighted as at 14/10/2022
**Market cap weighted as at 30/09/2021
Key take-outs from the above table include;
- Core EPS growth recorded a weighted growth of 16.0%, compared to a weighted average growth of 127.6% in H1’2021. The sluggish growth in earnings was attributable to a slower premium growth during the period following slower economic growth and deteriorated business environment, coupled with declines recorded in investment income,
- The premiums grew at a slower pace of 1.7% in H1’2022, compared to growth of 6.3% in H1’2021, while claims declined significantly at a rate of 8.7% in H1’2022, from the 29.1% growth recorded in H1’2021 on a weighted average basis,
- The loss ratio across the sector eased to 83.4% in H1’2022, from 92.8% in H1’2021,
- The expense ratio eased to 43.4% in H1’2022, from 53.8% in H1’2021, owing to a decline in operating expenses, a sign of increased efficiency,
- The insurance core business still remains unprofitable, despite the combined ratio improving to 126.8% in H1’2022, compared to 146.6% in H1’2021, and,
- On average, the insurance sector delivered a Return on Average Equity (ROaE) of 3.4%, a decline from a weighted Return on Average Equity of 6.2% in H1’2021.
For more information, see our Kenya H1’2022 Listed Insurance Report
Other Key Results
Safaricom Limited released the H1’2023 results, recording a decline in core earnings per share of 10.0% to Kshs 0.8 in H1’2023, from Kshs 0.9 in H1’2022. The decline was largely attributable to a 32.2% increase in operating expenses to Kshs 31.0 bn from Kshs 23.4 bn recorded in H1’2022, with its Ethiopian subsidiary incurring Kshs 6.0 bn in operating expenses representing 24.0% of the group’s total operating expenses. The Ethiopian subsidiary recorded a total revenue of Kshs 98.3 mn, with service revenue coming at Kshs 9.1 mn and operating cost at Kshs 6.0 bn leading to a loss after tax of Kshs 7.3 bn which weighed down on the group’s overall performance. For more information, please see our Cytonn Weekly #45/2022.
During the year, 11 companies issued profit warnings to investors compared to 4 companies in 2021 and 15 companies in 2020. The increased in number of companies that issued profit warning in 2022 is an indication of tough economic conditions brought about by the continued effects of COVID-19 as well as the disruption of the global supply chain due to the ongoing Ukraine-Russia conflicts which has led to high cost of production. Companies are required to issue profit warnings if they project a more than 25.0% decline in profits year-on-year. Below is the summary of the said companies:
|
Cytonn Report: Companies that issued profit warnings |
|||
|
No |
2022 |
2021 |
2020 |
|
1 |
Kakuzi Plc |
Centum Investment Company PLC |
ABSA Kenya |
|
2 |
The Limuru Tea Kenya Plc |
Umeme Limited |
Diamond Trust Bank |
|
3 |
Sanlam Kenya Limited |
Williamson Tea Kenya PLC |
Standard Chartered |
|
4 |
Unga Group Ltd |
WPP ScanGroup PLC |
I&M Holdings |
|
5 |
Liberty Kenya Holdings Ltd |
|
NCBA Group |
|
6 |
Centum Investments Co Plc |
|
Britam Holdings |
|
7 |
Sameer Africa plc |
|
East African Breweries Limited |
|
8 |
Nairobi Securities Exchange PLC |
|
Nation Media Group |
|
9 |
Bamburi Cement PLC |
|
Longhorn Publishers |
|
10 |
Crown Paints Kenya PLC |
|
Kenya Power |
|
11 |
Flame Tree Group Holdings Ltd |
|
Unga Group |
|
12 |
|
|
East Africa Cables |
|
13 |
|
|
Kenya Orchards |
|
14 |
|
|
TPS East African |
|
15 |
|
|
Nairobi Business Ventures |
The key take outs from the tale include:
- Kakuzi Plc was the first company in 2022 to issue a profit warning ahead of the release of its financials for the year ended 31st December 2021, indicating that the expected decline in earnings was due to lower production and export of avocado fruits coupled with lower market prices in the European key markets due to higher supply of the fruit from Peru and Columbia,
- The Limuru Tea Kenya Plc issued a profit in January 2022 ahead of the release of its financials for the year ended 31st December 2021 indicating that the expected decline in its net profits was mainly due to lower green leaf volumes that were realized in 2021,
- Sanlam Kenya Limited issued a profit warning in January 2022 ahead of the release of its financials for the year ended 31st December 2021 noting that the expected decline in its earnings was mainly due to the continued effects of COVID-19 which adversely affected both corporate and retail segments of its businesses. Due to the elevated risk, the company noted that it increased the level of premium debt provisioning to reflect the associated default risk while claims and related policyholder reserving was increased to ensure sufficient prudence,
- Unga Group Ltd issued a profit warning in February 2022 stating that the expected decline in its half-year profit was due to increased costs of raw materials attributable to disruption in global supply chain and a weakened Kenya shilling which had caused the escalation of the price of finished goods,
- Liberty Kenya Holdings issued a profit warning in January 2022 ahead of release of its financials for the year ended 2021. The decline in its earnings was mainly due to the impact of COVID-19 that resulted in significantly higher risk claims in 2021,
- Centum Investments Co Plc issued a profit warning for the financial year ended 31st March 2022, indicating that the expected decline in net profit was attributable to lower revaluation gains on investment property compared to 2021,
- Sameer Africa Plc issued a profit warning in August 2022 indicating the expected decline in its earnings was mainly due to global disruption in supply chain as a result of the COVID-19 pandemic, and the ongoing conflict in Eastern Europe which impacted the availability of key products in their business. The company also noted the immense weakening of Kenya shilling adversely impactsed its margin as the full effect of price change cannot be passed to consumers,
- Nairobi Securities Exchange Plc issued a profit warning statement noting that the company performance was impacted by reduced trading in equity and debt markets brought on by continued economic challenges both locally and international. Key challenges included, the rising inflation, increased in interest rate both in local and international markets which led to re allocation of funds to developed markets,
- Bamburi Cement Plc issued a profit warning indicating that the expected decline in its earnings was largely attributable to a slowdown in market demand for cement, high energy cost coupled with increased raw material cost brought on by disruption in global supply chain,
- Crown Paints Kenya Plc issued a profit warning indicating that the expected decline in earnings is mainly attributable to the increased cost of raw materials, volatility in foreign exchange rates and slowdown in economic activities during the year, and,
- Flame Tree Group Holdings Ltd issued a profit warning on 30th December 2022, indicating the expected decline in its earnings in 2022 is mainly due to the sharp increase of raw material prices, high freight costs, high prevailing inflation and interest rates, as well as the immense depreciation of the local currencies against the US Dollar. The company noted that the aforementioned factors affected its margins and cash flows due to higher finance cost incurred.
Below is a summary of the number of companies that issued profit warnings over the last 8 years:
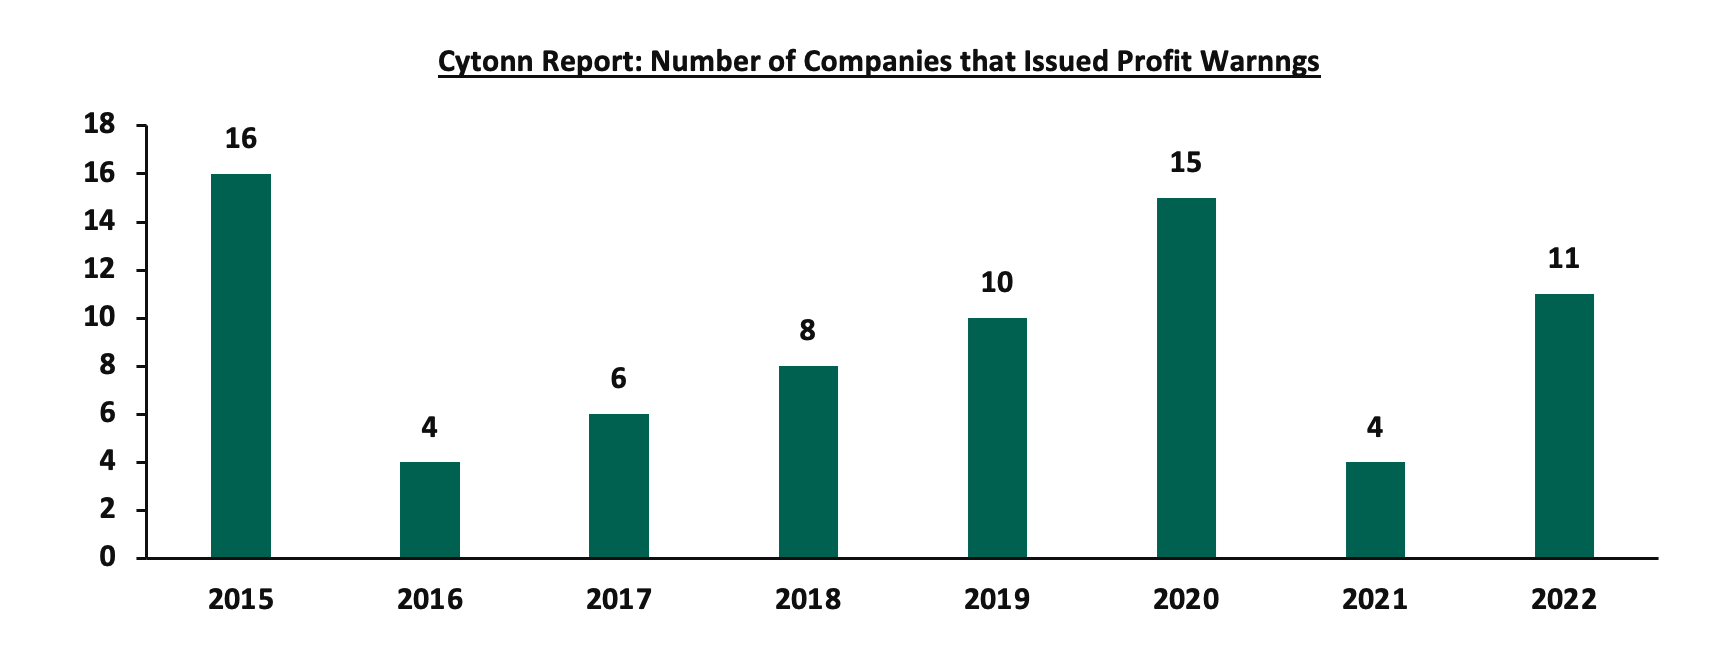
Source: Cytonn Research, NSE
- Listings and Suspensions
In November 2022, Capital Markets Authority approved listing by introduction of the Local Authority Pension Trust (LAPTRUST) Imara Income Real Estate Investment Trust (I-REIT) on the Nairobi Securities Exchange (NSE) under the Restricted Sub-Segment. Which implied that LAPTRUST held 100.0% of the Imara I-REIT shares with no initial offer to the public, for more information, please see our Cytonn Monthly – October 2022. During the year, four companies remained suspended at the Nairobi Securities Exchange (NSE), namely; Deacons (East Africa) PLC, ARM Cement PLC, Mumias Sugar Co. Ltd and Kenya Airways. The chart below shows the number of listed companies in the Nairobi Securities Exchange for the period 2010-2022:
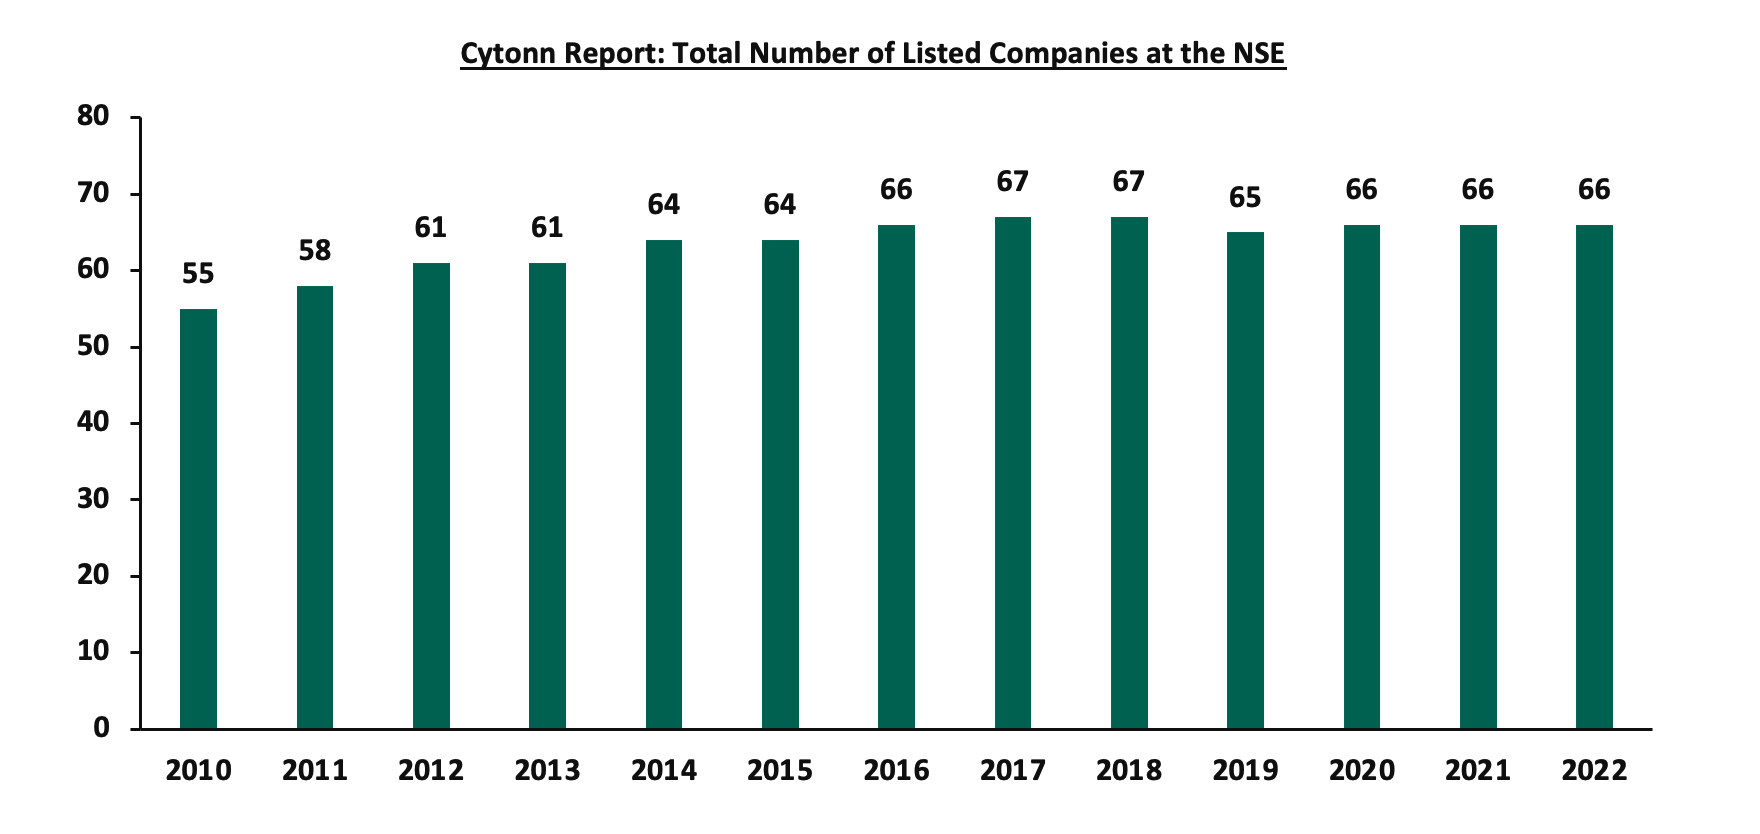
Source: CMA Quarterly Statistical Bulletins
- Liquidations
During the year, there were no liquidations, compared to 2021 where Central Bank approved liquidation of three banks; namely, Chase Bank Limited (In Receivership), Imperial Bank Limited (In Receivership) and Charterhouse Bank Limited. However, in the insurance sector, the Insurance Regulatory Authority (IRA), announced that Resolution Insurance Company had been placed.
- Legislations and other Developments
During the year, there were legislative changes and other developments that affected the equities market and investor sentiments, namely;
- Central Bank of Kenya (Digital Credit Providers) Regulations 2022. In March 2022, the Central Bank of Kenya gazetted the digital lenders regulations paving way for their oversight in licensing, governance and lending practices. The regulations focuses to address public concerns given the significance growth in number of digital lenders. The regulations also provide for consumers protection on credit information sharing and outline the Anti-Money Laundering and Combating the Financing of Terrorism (AML/CFT) obligations. Key takeout’s include;
-
- Digital Credit Provides (DCPs) shall not invite or collect deposits in any form, including the taking of cash collateral as security for loans, in the course of carrying out digital credit business,
- Lenders are forbidden from sharing customer information with any other person except with the customer’s consent, or seek permission under any written law,
- DCPs are not allowed to submit negative credit information of a customer or any other person to a Credit Reference Bureau where the outstanding amount relating to the credit information does not exceed Kshs 1,000.0, and,
- In a move to combat money laundering, all digital credit providers to issue evidence and sources of funds invested or proposed to be invested in the business and demonstrate that the funds are not proceeds of crime.
Following the elapse of the transition period for all operating unregulated Digital Credit Providers (DCPs) on September 17, 2022, the CBK announced that it received 288 applications and only 10 Digital Credit Providers had been licensed while the other applicants were at difference stages of the approval process.
- Draft Capital Markets Public Offers Listing and Disclosures Regulations 2022. In May 2022, the Capital Markets Authority (CMA) announced that it had made public the Draft Capital Markets Public Offers Listing and Disclosures Regulations 2022, which are meant to replace the Public Offers Listing and Disclosures Regulations 2002, which had been in place since 2002, with the only amendments done in 2016. The main aim of the Draft Regulations is to provide a more enabling environment in Kenya’s Capital Markets in order to spur more listings in the Nairobi Securities Exchange. Key to note, the bourse has had an Initial Public Offering drought since 2015, when Stanlib Kenya Investments issued shares in Kenya’s first and only listed Real Estate Investment Trust (Fahari I-REIT). Since then, the bourse has had only one more listing by introduction, done by Homeboyz Entertainment in 2020. For a detailed analysis of the draft regulations, please see our Cytonn Weekly#18/2022.
- Capital Market Authority gazetted investment Based Crowdfunding regulations. In October 2022, the Capital Markets Authority (CMA) gazetted new crowdfunding regulations aimed at curbing risks such as fraud, doubtful returns and vulnerabilities to hackers attack. The regulation is set to benefit Micro, Small and Medium Enterprises (MSMEs) by offering them alternative ways of raising capital from members of public in exchange for capital markets investment instruments to help finance their businesses. Under the regulations, the Authority places duty upon crowdfunding platforms to supervise its users, issuers and investors. Following the gazetting of the regulation, all existing investment-based crowdfunding platforms in Kenya will be required to comply with the Regulations within one year of the commencement date of the Regulations.
- Share purchase and consolidation
During the year, consolidation activity remained one of the key highlights witnessed in 2022, as players in the sector were either acquired or merged, leading to the formation of relatively larger, well capitalized, and possibly more stable entities. The following were some of the major M&A’s activities witnessed during the year.
- In May 2022, Standard Africa Holdings Limited, (SAHL), the majority shareholder in Stanbic Holdings announced that it had completed the acquisition of additional shares in the company, raising its total shareholding to 296,188,531 shares equivalent to 74.9% of the company’s ownership. This came three months after SAHL received regulatory approval from the Capital Markets Authority, for further extension of the exemption from making a full take-over under the Capital Markets (Take over and Mergers) Regulations, 2002. SAHL had targeted to acquire a maximum of 10.6 mn ordinary shares in Stanbic to bring its total shareholding up to 75.0% of Stanbic Holdings’ ordinary shares, and has since sought extensions to enable them meet their target. After acquiring 74.9% of Stanbic Holdings, SAHL has ceased acquiring any additional shares in the entity. Click here for more information,
- In May 2022, Sanlam Limited, a South African financial services group listed on the Johannesburg Stock Exchange, announced that it had entered into a definitive Joint Venture agreement for a term of 10 years with Allianz SE, a global integrated financial services firm listed on the Frankfurt Stock Exchange with the aim to leverage on the two entities footprints in Africa and create a leading Pan-African financial services group with an estimated equity value of Kshs 243.7 bn. For more information, please see our Cytonn Cytonn Weekly #18/2022,
- In June 2022, Centum Investments announced it had entered into agreement to sell 83.4% stake in Sidian Bank to Nigerian based lender Access bank at a value of Kshs 4.3 bn. This was a second acquisition by Access Bank in Kenya following its acquisition of 100.0% stake in Transnational Bank in 2020 at a value of Kshs 1.6 bn which was later renamed Access Bank Kenya. The combination of Sidian Bank and Access Bank Kenya made it become the largest tier three bank with an asset base of Kshs 57.1 bn with a loan book of Kshs 26.6 bn,
- In September 2022, Equity Group Holdings Plc through Equity Bank (Kenya) Limited, announcedthat it had entered into an Assets and Liabilities purchase agreement with Spire Bank Limited for purchase of certain assets and liabilities. Equity Bank Kenya Limited would acquire approximately 20,000 deposit customers with deposits totalling Kshs 1.3 bn, and 3,700 loan customers with outstanding loan balances at Kshs 1.7 bn, with a net carrying value of Kshs 0.9 bn after adjusting for statutory loan loss provisions of Kshs 0.8 bn. For more information, please see our Cytonn Weekly #37/2022. However, the move was frozen by the Employment and Labour Relations Court following dispute over the fate of employees in Spire bank, and,
- In December 2022, KCB Group announcedthat it had completed acquisition of the 85.0% stake in Trust Merchant Bank (TMB), after receiving all the regulatory approvals. For this acquisition, KCB Group had cited that they would pay a cash consideration based on the net asset value of TMB at completion of the proposed transaction using a Price to Book (P/B) multiple of 1.5x. As such, we estimate that KCB made a payment of around Kshs 15.7 bn at the trading multiple of 1.5x given TMB’s book value of FC 208.4 bn (Kshs 12.4 bn) as of 2020. The acquisition has seen KCB Group take over 109 branches from TMB, taking its total branch network to 607, from the current 498 branches, and take its total assets to more than Kshs 1.5 tn. This acquisition makes KCB Group the second Kenyan banking group to enter the DRC banking market after Equity Group Holdings, with KCB Group now having its presence in seven countries. Read more information on the transaction Cytonn Weekly #50/2022.
Below is a summary of the deals in the last 9 years that have either happened, been announced or expected to be concluded:
Cytonn Report: Banking sector Deals and Acquisitions
Acquirer
Bank Acquired
Book Value at Acquisition (Kshs bn)
Transaction Stake
Transaction Value
(Kshs bn)
P/Bv Multiple
Date
KCB Group PLC
Trust Merchant Bank (TMB)
12.4
85.0%
15.7
1.5x
Dec-22
Equity Group
Spire Bank
Unknown
Undisclosed
Undisclosed
N/A
Sep-22*
Access Bank PLC (Nigeria)
Sidian Bank
4.9
83.4%
4.3
1.1x
June-22*
KCB Group
Banque Populaire du Rwanda
5.3
100.0%
5.6
1.1x
August-21
I&M Holdings PLC
Orient Bank Limited Uganda
3.3
90.0%
3.6
1.1x
April-21
KCB Group**
ABC Tanzania
Unknown
100%
0.8
0.4x
Nov-20*
Co-operative Bank
Jamii Bora Bank
3.4
90.0%
1
0.3x
Aug-20
Commercial International Bank
Mayfair Bank Limited
1.0
51.0%
Undisclosed
N/D
May-20*
Access Bank PLC (Nigeria)
Transnational Bank PLC.
1.9
100.0%
1.4
0.7x
Feb-20*
Equity Group **
Banque Commerciale Du Congo
8.9
66.5%
10.3
1.2x
Nov-19*
KCB Group
National Bank of Kenya
7.0
100.0%
6.6
0.9x
Sep-19
CBA Group
NIC Group
33.5
53%:47%
23.0
0.7x
Sep-19
Oiko Credit
Credit Bank
3.0
22.8%
1
1.5x
Aug-19
CBA Group**
Jamii Bora Bank
3.4
100.0%
1.4
0.4x
Jan-19
AfricInvest Azure
Prime Bank
21.2
24.2%
5.1
1.0x
Jan-18
KCB Group
Imperial Bank
Unknown
Undisclosed
Undisclosed
N/A
Dec-18
SBM Bank Kenya
Chase Bank Ltd
Unknown
75.0%
Undisclosed
N/A
Aug-18
DTBK
Habib Bank Kenya
2.4
100.0%
1.8
0.8x
Mar-17
SBM Holdings
Fidelity Commercial Bank
1.8
100.0%
2.8
1.6x
Nov-16
M Bank
Oriental Commercial Bank
1.8
51.0%
1.3
1.4x
Jun-16
I&M Holdings
Giro Commercial Bank
3.0
100.0%
5.0
1.7x
Jun-16
Mwalimu SACCO
Equatorial Commercial Bank
1.2
75.0%
2.6
2.3x
Mar-15
Centum
K-Rep Bank
2.1
66.0%
2.5
1.8x
Jul-14
GT Bank
Fina Bank Group
3.9
70.0%
8.6
3.2x
Nov-13
Average
74.5%
1.3x
* Announcement Date
** Deals that were dropped
Universe of coverage:
Company
Price as at 23/12/2022
Price as at 30/12/2022
w/w change
m/m change
YTD Change
Year Open 2022
Target Price*
Dividend Yield
Upside/ Downside**
P/TBv Multiple
Recommendation
Jubilee Holdings
190.0
198.8
4.6%
(0.6%)
(37.3%)
275.8
305.9
0.5%
61.5%
0.4x
Buy
KCB Group***
38.0
38.1
0.3%
0.3%
(16.4%)
38.4
52.5
10.5%
48.6%
0.6x
Buy
Kenya Reinsurance
1.9
1.8
(1.1%)
5.2%
(20.1%)
2.3
2.5
5.5%
41.1%
0.1x
Buy
Britam
5.1
5.2
2.4%
(3.0%)
(31.2%)
7.0
7.1
0.0%
40.2%
0.9x
Buy
ABSA Bank***
12.1
12.3
1.7%
5.6%
4.7%
9.5
15.5
12.2%
39.9%
1.0x
Buy
Equity Group***
45.3
44.5
(1.7%)
(2.5%)
(15.6%)
76.8
58.4
6.7%
35.7%
1.1x
Buy
Co-op Bank***
12.2
12.3
1.2%
2.5%
(5.4%)
12.6
15.5
8.1%
35.5%
0.7x
Buy
I&M Group***
17.0
17.0
0.0%
0.0%
(20.6%)
44.9
20.8
8.8%
31.3%
0.4x
Buy
NCBA***
37.3
39.4
5.5%
18.5%
54.6%
26.6
43.4
10.8%
27.1%
0.9x
Buy
Sanlam
9.6
9.6
(0.2%)
6.4%
(17.1%)
36.3
11.9
0.0%
24.1%
1.0x
Buy
Diamond Trust Bank***
49.0
50.0
2.0%
2.7%
(16.0%)
85.0
57.1
6.0%
22.6%
0.2x
Buy
CIC Group
1.9
2.0
1.6%
1.6%
(10.1%)
2.1
2.3
0.0%
20.8%
0.7x
Buy
Stanbic Holdings
97.8
102.0
4.3%
9.1%
17.2%
7.7
108.6
8.8%
20.0%
0.9x
Accumulate
Standard Chartered***
143.5
142.8
(0.5%)
(1.0%)
9.8%
144.5
164.8
4.2%
19.1%
1.0x
Accumulate
Liberty Holdings
5.7
5.6
(1.4%)
23.1%
(20.7%)
13.0
6.8
0.0%
18.8%
0.4x
Accumulate
HF Group
3.1
3.2
3.2%
(1.5%)
(16.1%)
3.1
3.5
0.0%
14.6%
0.2x
Accumulate
Target Price as per Cytonn Analyst estimates
**Upside/ (Downside) is adjusted for Dividend Yield
***For Disclosure, these are stocks in which Cytonn and/or its affiliates are invested in
We are “Neutral” on the Equities markets in the short term due to the current adverse operating environment and huge foreign investor outflows, and, “Bullish” in the long term due to current cheap valuations and expected global and local economic recovery.
With the market currently trading at a discount to its future growth (PEG Ratio at 0.9x), we believe that investors should reposition towards value stocks with strong earnings growth and that are trading at discounts to their intrinsic value. We expect the current high foreign investors sell-offs to continue weighing down the economic outlook in the short term.
In 2022, the general Real Estate sector witnessed considerable growth in activity in terms of property transactions and development activities. Consequently, the sector’s activity contribution to GDP grew by 5.6% to Kshs 749.7 bn for the 9 months to September 2022, from Kshs 710.3 bn recorded during the same period in 2021. Additionally, selling and rental prices also continued to soar, driven by continued inflationary pressures and a weakened shilling against the United States dollar that has seen a rise in costs of construction materials. Some of the key factors that continued to positively shape the performance of the Real Estate sector include:
- The continued launch and implementation of various infrastructure projects by the government, hence opening up various areas for developments and investments, as well as positioning Kenya as a regional hub,
- Aggressive expansion efforts by both local and international retailers such as Naivas, Carrefour and Quickmart, among others, in a bid to increase their share of the market and ensure dominance, as Kenya’s formal retail penetration stands at approximately 30.0% according to the Nielsen Report 2018,
- Continuous focus by the government and private sector to provide housing units to Kenyans through the affordable housing initiative and general housing projects, and, rehabilitation of existing housing assets by relevant authorities such as the Nairobi Metropolitan Services,
- The Kenya Mortgage Refinance Company (KMRC) continuous efforts to make home ownership more accessible to Kenyans by providing long-term, low-interest home loans to potential buyers,
- Mergers and Acquisitions in the hospitality sector, signifying investor appetite and confidence in a bid to gain market dominance. This is on the back of the sector’s gradual recovery away from the slowdown that was caused by pandemic lockdowns and travel restrictions, and,
- Positive demographics evidenced by relatively high urbanization and population growth rates of 4.0% p.a and 2.3% p.a, respectively, against the global average of 1.8% p.a and 1.0% p.a, respectively, as at 2020. This continually promotes demand for Real Estate developments.
Despite the above, there were various challenges that impeded the optimum performance of the Real Estate sector such as:
- Prevailing inflationary pressures from local and external shocks which slowed down activity in Kenya’s Real Estate sector. In support of this, the sector’s GDP growth rate came in at 5.1% in Q3’2022, 2.0% points lower than the 7.1% growth recorded in Q3’2021, as shown below;
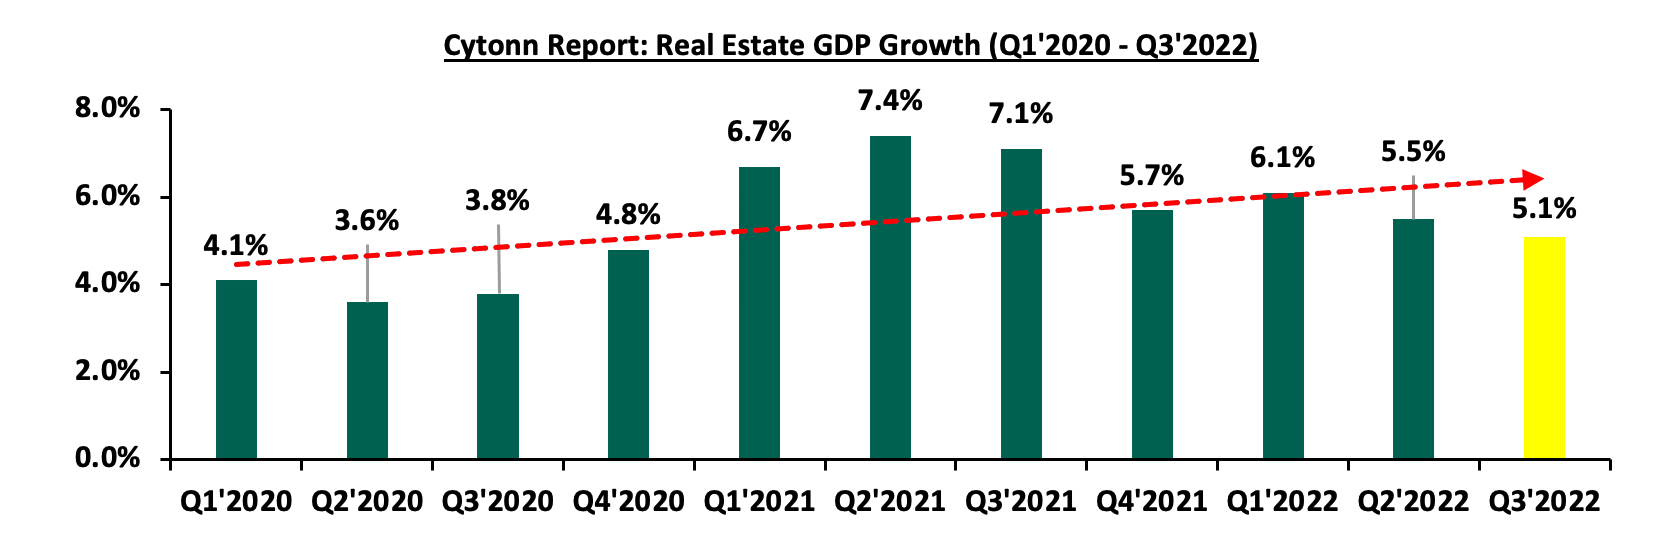
Source: Kenya National Bureau of Statistics (KNBS)
- Difficulty in accessing credit as lenders continue to tighten their lending terms while requesting for more collateral from developers, owing to the high credit risk in the Real Estate sector. This is evidenced by the 9.2% increase in gross non-performing loans (NPLs) in the sector to Kshs 75.6 bn in Q3’2022 from Kshs 69.2 bn recorded during the same period in 2021. However, it is worth noting that the NPLs declined on a q/q basis from Kshs 79.4 bn recorded in Q2’2022 attributed to increased Real Estate loan repayments within the period as a result of increased business activity,
- Low absorption of physical space in select sectors due to the continued oversupply in the Nairobi Metropolitan Area (NMA) office and retail markets at 6.7 mn SQFT and 3.0 mn SQFT, respectively, coupled with an oversupply of 1.7 mn SQFT in the overall Kenyan retail market,
- Lack of urban planning in many urban areas has led to uncoordinated land use, through the proliferation of large, sprawling developments that are not connected to public transportation, water supply, and other services, and,
- Subdued performance of the Real Estate Investment Trusts (REITs) market with just two approved REITs, of which only one is listed and actively trades on the Nairobi Securities Exchange (NSE) Main Investment Market. This is majorly due to the large minimum capital requirements, prolonged approval processes, scant investor knowledge, and only a few entities being capable of incorporating REITs. See our REITs Topical for an in-depth analysis.
In terms of performance in the Nairobi Metropolitan Area (NMA), the Residential, Commercial Office, Retail, Hospitality, and Mixed-Use Development sectors realized average rental yields of 5.1%, 7.6%, 7.9%, 6.2%, and 7.4%, respectively in FY’2022. This resulted to an overall rental yield of 6.8%, 0.3% points higher than the 6.5% recorded in FY’2021. The table below shows the annual Real Estate rental yields for existing properties from FY’2017 to FY’2022;
Cytonn Report: Annual Real Estate Rental Yields Summary Table, for Existing Properties
FY’2017
FY’2018
FY’2019
FY’2020
FY’2021
FY’2022
Y/Y Change (% Points)
Average Rental Yield
7.6%
7.4%
7.0%
6.1%
6.5%
6.8%
0.3%
Sectoral Performance
- Residential Sector
The NMA residential sector recorded improvement in performance with the average total return to investors coming at 6.2%, a 0.1%-points increase from the 6.1% recorded in FY’2021, attributable to average rental yield of 5.1% and y/y appreciation of 1.1%. The y/y improvement in performance was majorly driven by improved selling prices and rents which came in at Kshs 119,609 and Kshs 540, respectively, from Kshs 119,494 and Kshs 508, respectively, recorded in FY’2021. On a q/q basis, the average total returns improved by 0.3% points from the 5.9% recorded in Q3’2022, attributable to average rental yields increasing by 0.3% points to 5.1% from the 4.8% recorded in Q3’2022. The table below shows the NMA residential sector’s performance in FY’2022;
All values in Kshs unless stated otherwise
Cytonn Report: Residential Sector Summary FY’2022
Segment
Price per SQM FY'2022
Rent per SQM FY'2022
Occupancy FY'2022
Uptake FY'2022
Annual Uptake FY'2022
Rental Yield FY'2022
Price Appreciation FY'2022
Total Returns
Detached Units
High End
193,036
728
92.3%
94.7%
12.5%
4.4%
1.4%
5.8%
Upper Middle
147,178
594
85.2%
89.8%
13.0%
4.5%
1.1%
5.6%
Lower Middle
73,696
325
87.0%
90.6%
15.3%
5.0%
1.0%
6.0%
Detached Units Average
137,970
549
88.2%
91.7%
13.6%
4.7%
1.1%
5.8%
Apartments
Upper Mid-End
126,751
670
84.3%
89.9%
15.8%
5.4%
0.5%
5.9%
Lower Mid-End Suburbs
94,406
514
85.8%
88.0%
14.9%
5.5%
1.1%
6.6%
Lower Mid-End Satellite Towns
82,586
409
85.4%
86.3%
16.4%
5.5%
1.4%
6.9%
Apartments Average
101,248
531
85.2%
88.1%
15.7%
5.5%
1.0%
6.5%
Residential Market Average
119,609
540
86.7%
89.9%
14.7%
5.1%
1.1%
6.2%
Source: Cytonn Research
- Detached Units
The table below shows the NMA residential sector detached units’ performance during FY’2022;
All values in Kshs unless stated otherwise
Cytonn Report: Residential Detached Units Summary FY’2022
Area
Price per SQM FY'2022
Rent per SQM FY'2022
Occupancy FY'2022
Uptake FY'2022
Annual Uptake FY'2022
Rental Yield FY'2022
Price Appreciation FY'2022
Total Returns
High-End
Rosslyn
185,067
848
90.0%
98.2%
15.0%
5.0%
1.5%
6.5%
Kitisuru
227,620
808
96.0%
94.9%
11.8%
4.8%
1.6%
6.4%
Karen
186,636
679
83.3%
91.8%
12.7%
3.8%
1.7%
5.5%
Runda
212,856
839
96.8%
97.0%
10.1%
4.6%
0.7%
5.2%
Lower Kabete
153,001
465
95.3%
91.5%
13.1%
3.9%
1.1%
5.0%
Average
193,036
728
92.3%
94.7%
12.5%
4.4%
1.4%
5.8%
Upper-Middle
Redhill & Sigona
99,238
447
84.6%
96.1%
14.4%
4.9%
1.5%
6.4%
Ridgeways
169,159
790
76.1%
87.4%
12.8%
4.7%
1.6%
6.3%
Runda Mumwe
152,756
718
90.8%
92.6%
13.6%
5.2%
0.8%
6.0%
Loresho
167,195
705
80.7%
83.0%
14.2%
4.8%
1.1%
5.9%
South B/C
113,184
436
88.5%
86.9%
12.6%
4.3%
1.3%
5.6%
Lavington
189,131
618
87.0%
91.3%
12.7%
4.0%
0.6%
4.6%
Langata
139,581
446
88.8%
91.0%
10.7%
3.8%
0.7%
4.5%
Average
147,178
594
85.2%
89.8%
13.0%
4.5%
1.1%
5.6%
Lower-Middle
Ruiru
68,474
345
87.3%
83.6%
18.2%
6.2%
1.6%
7.8%
Juja
66,081
290
81.4%
83.9%
18.2%
5.7%
1.2%
6.9%
Ngong
65,329
319
93.6%
96.3%
12.4%
6.2%
0.4%
6.5%
Kitengela
62,623
315
76.7%
85.4%
13.7%
4.9%
1.4%
6.3%
Syokimau/Mlolongo
75,913
321
91.3%
90.8%
18.3%
4.4%
1.5%
5.9%
Athi River
85,292
340
86.2%
95.0%
13.4%
4.3%
1.1%
5.4%
Rongai
81,535
286
98.8%
97.1%
16.7%
4.1%
1.2%
5.2%
Thika
63,549
304
83.3%
86.9%
13.7%
5.0%
0.2%
5.2%
Donholm & Komarock
94,468
404
85.0%
96.0%
13.1%
4.5%
0.3%
4.7%
Average
73,696
325
87.0%
90.6%
15.3%
5.0%
1.0%
6.0%
Detached Units Average
137,970
549
88.2%
91.7%
13.6%
4.7%
1.1%
5.8%
Source: Cytonn Research
The key take-outs from the table include;
- Average Total Return – The average total return came in at 5.8%, a 0.2% points increase from the 5.6% recorded in FY’2021. The improved performance is attributable to increase in rental yield by 0.5% points to 4.7% in FY’2022 from the 4.3% recorded in FY’2021, majorly driven by increase in selling and rental prices to Kshs 137,970 and Kshs 549, respectively, from Kshs 136,031 and Kshs 505, respectively in FY’2021,
- Segment Performance – The best performing segment was the lower-middle segment offering an average total return of 6.0%, attributable to relatively high rental yields of 5.0%, which is driven by returns from well-performing nodes such as Ruiru, Juja, and Ngong, and,
- Overall Node Performance – Ruiru was the best performing node, offering the highest returns at 7.8% attributable to relatively high rental yield of 6.2% and price y/y appreciation of 1.6%. This is driven by increased popularity by investors due to presence of key infrastructure developments, such as the Eastern Bypass and Thika Superhighway which grants easy access from Ruiru to the Nairobi CBD. In addition, the node enjoys high demand in property due to affordability of apartments, with rents averaging Kshs 345 against the overall detached units’ average of Kshs 549,
- Apartments
The table below shows the NMA residential sector apartments’ performance during FY’2022;
All values in Kshs unless stated otherwise
Cytonn Report: Residential Apartments Summary FY’2022
Area
Price per SQM FY'2022
Rent per SQM FY'2022
Occupancy FY'2022
Uptake FY'2022
Annual Uptake FY'2022
Rental Yield FY'2022
Price Appreciation FY'2022
Total Returns
Upper Mid-End
Westlands
149,518
826
83.1%
87.3%
24.5%
5.9%
0.5%
6.4%
Kilimani
106,700
646
84.4%
88.9%
21.1%
5.8%
0.2%
6.0%
Kileleshwa
126,855
654
85.0%
88.2%
14.8%
5.5%
0.3%
5.8%
Loresho
123,248
541
88.0%
97.2%
10.4%
4.7%
1.1%
5.8%
Upperhill
134,588
745
81.5%
87.8%
10.6%
5.0%
0.7%
5.7%
Parklands
119,595
609
83.8%
89.9%
13.6%
5.2%
0.4%
5.6%
Average
126,751
670
84.3%
89.9%
15.8%
5.4%
0.5%
5.9%
Lower Mid-End Suburbs
Waiyaki Way
87,429
539
83.8%
87.3%
21.2%
6.3%
1.1%
7.4%
South C
113,660
823
83.8%
84.8%
17.0%
6.2%
0.9%
7.1%
Imara Daima
85,008
395
86.1%
86.5%
11.7%
5.3%
1.5%
6.8%
Dagoretti
84,893
538
88.6%
81.4%
14.9%
5.8%
0.8%
6.6%
Donholm & Komarock
75,864
385
92.1%
91.8%
12.9%
5.7%
0.6%
6.3%
Kahawa West
83,616
371
89.0%
86.5%
9.8%
5.0%
1.2%
6.2%
Race Course/Lenana
98,276
654
81.4%
91.5%
19.1%
5.5%
0.4%
5.9%
Langata
115,681
482
82.0%
88.8%
12.4%
4.4%
1.5%
5.9%
South B
105,230
441
85.9%
93.2%
15.4%
4.4%
1.3%
5.7%
Average
94,406
514
85.8%
88.0%
14.9%
5.5%
1.1%
6.6%
Lower Mid-End Satellite Towns
Ruaka
109,462
567
78.6%
83.8%
22.3%
5.2%
2.3%
7.5%
Ruiru
89,592
492
87.0%
83.6%
17.1%
5.8%
1.6%
7.4%
Ngong
66,940
368
83.1%
84.4%
14.0%
5.5%
1.7%
7.2%
Kikuyu
82,332
415
82.8%
86.8%
17.6%
5.0%
2.0%
7.0%
Athi River
59,754
354
86.8%
92.8%
16.0%
5.6%
1.3%
6.9%
Syokimau
77,437
368
85.5%
90.2%
12.0%
5.3%
1.4%
6.7%
Thindigua
102,267
505
90.0%
80.8%
21.1%
5.4%
1.1%
6.5%
Rongai
93,884
313
89.2%
77.0%
16.8%
6.0%
0.3%
6.3%
Kitengela
61,608
295
85.9%
97.5%
10.3%
5.3%
0.7%
6.0%
Average
82,586
409
85.4%
86.3%
16.4%
5.5%
1.4%
6.9%
Apartments Average
101,248
531
85.2%
88.1%
15.7%
5.5%
1.0%
6.5%
Source: Cytonn Research
The key take-outs from the table include;
- Average Total Return - The average total return came in at 6.5%, a decline of 0.2% points from the 6.7% recorded in 2021. The decline came as sellers were open to negotiate apartment prices with buyers in order to close business, with people prefering renting apartments compared to buying, which is evidenced by a 0.4% decline in price appreciation to 1.0% from 1.4% in 2021,
- Segment Performance - The best performing segment was the lower mid-end satellite towns with average total return of 6.9%, attributed to average rental yield of 5.5% and relatively high price appreciation of 1.4%. The performance of the segment is boosted by the presence of rapidly developing nodes such as Ruaka and Ruiru, and,
- Overall Node Performance - Overall, the best performing node was Ruaka with average rental yield of 7.5% attributable to a relatively high y/y price appreciation of 2.3%, while Waiyaki Way closely followed with 7.4% average total return. The proximity of Ruaka and Waiyaki Way to more well-off neighborhoods has driven up property prices, making them prime locations for the development of high-density residential apartment complexes which garner high preference among low to middle-income earners.
For notable highlights related to the residential sector during the year please see our Cytonn Q1’2022 Markets Review, Cytonn H1’2022 Markets Review and Cytonn Q3’2022 Markets Review Reports. In Q4’2022, see Cytonn Monthly – October 2022 and Cytonn Monthly – November. For the month of December;
- Superior Homes, a Nairobi based housing developer where Cytonn Investments is the second largest shareholder, launched a luxurious Conservancy Living Development project dubbed ‘Lukenya Wildlife Estate’ located within Swara Plains Conservancy, Machakos County. For more information, see Cytonn Weekly #51/2022,
- Property developer Erdemann Limited, in conjunction with the County Government of Machakos, broke ground for the construction of the 5th phase of Great Wall Gardens project located in Mavoko municipality. For more information, see Cytonn Weekly #50/2022, and,
- The Kenyan national government in partnership with the United Nations Habitat, and, Epco Builders, a local private developer, broke ground for the construction of Mavoko Affordable Housing Project in Syokimau, Machakos County. For more information, see Cytonn Weekly #49/2022.
Our Outlook for the residential sector is NEUTRAL supported by the continued development of infrastructure serving to open up areas for development and easy access for residency. This is as demand for housing is expected to continue growing on the back of Kenya’s attractive demographic profile. Additionally, the ongoing focus by the government and private sector to provide housing will serve to improve the sector's performance and in turn curb the existing housing deficit in the country. However, we expect the prevailing inflationary pressure coupled with a weakened shilling, high construction costs, and the low penetration of mortgages in the country to continue impeding the performance of the sector. For detached units, investment opportunity lies in areas such as Ruiru, Juja, and Ngong, while for apartments, investment opportunity lies in Ruaka, Waiyaki Way, and Ruiru.
- Commercial Office Sector
The table below highlights the performance of the Nairobi Metropolitan Area (NMA) Commercial Office sector over time;
All values in Kshs unless stated otherwise
Cytonn Report: Nairobi Metropolitan Area (NMA) Commercial Office Returns Over Time
Item
Q1'2021
H1'2021
Q3'2021
FY'2021
Q1'2022
H1'2022
Q3'2022
FY'2022
∆ FY'2021/
FY'2022
Occupancy %
76.3%
75.8%
79.9%
77.6%
77.9%
77.9%
78.2%
79.4%
1.8%
Asking Rents (Kshs/SQFT)
92
93
94
94
94
95
96
96
2.1%
Average Prices (Kshs/SQFT)
12,228
12,224
12,479
12,106
12,113
12,142
12,221
12,223
1.0%
Average Rental Yields (%)
6.8%
6.9%
7.2%
7.3%
7.3%
7.4%
7.4%
7.6%
0.3%
Source: Cytonn Research
The key take-outs from the table include;
- Average Asking Rent – Average asking rents per SQFT in the NMA increased by 2.1% to Kshs 96 per SQFT from Kshs 94, owing to increased supply of Grade A offices fetching higher rents such as Karen Green and Global Trade Centre (GTC) Office Tower, among others,
- Average Occupancy Rate – The overall occupancy rates increased by 1.8% points to 79.4% from 77.6% as a result of a slow but rising demand for physical space on the back of various firms resuming full operations, coupled with the expansion strategy by various firms such as Nairobi Garage and Call Centre International (CCI) Group, and,
- Average Rental Yield – The average rental yield improved by a 0.3% points increase to 7.6% in FY’2022 from 7.3% recorded in FY’2021, due to improved occupancy and rental rates.
For the submarket performance, Gigiri was the best performing node realizing an average rental yield of 8.7% in FY’2022 compared to the market average of 7.6%. Westlands and Karen were the second-best performing nodes, both registering average rental yields of 8.3%. These locations continue to record the best yields as a result of; i) high concentration of top-notch office spaces fetching premium rental rates and attractive yields for investors, ii) availability of adequate infrastructure and amenities in the areas enhancing investments, and, iii) presence of international organizations, multinational companies and embassies within the areas which drive up demand for quality offices. On the other hand, Mombasa Road was the least performing node with an average rental yield of 5.1% in 2022, 2.5% points lower than the market average of 7.6%, attributed to; i) low quality offices which attract low average rents at Kshs 73 per SQFT, ii) its recognition as an industrial area thus making it less attractive to office businesses and, iii) stiff competition from other sub-markets. The table below shows the Nairobi Metropolitan Area (NMA) sub-market performance;
All values in Kshs unless stated otherwise
Cytonn Report: Nairobi Metropolitan Area Commercial Office Market Performance FY’2022
Area
Price/SQFT
FY 2021
Rent/SQFT
FY 2021
Occupancy
FY 2021(%)
Rental Yields FY 2021(%)
Price Kshs/ SQFT FY 2022
Rent Kshs/ SQFT FY 2022
Occupancy FY 2022(%)
Rental Yield FY 2022(%)
∆ in Rental Yields
(% points)
Gigiri
13,500
119
81.3%
8.6%
13,500
118
81.6%
8.7%
0.1%
Westlands
11,972
104
75.5%
8.1%
12,032
108
76.4%
8.3%
0.2%
Karen
13,325
106
83.0%
7.7%
13,431
111
82.9%
8.3%
0.6%
Kilimani
12,364
91
79.8%
7.1%
12,260
92
84.1%
7.7%
0.6%
Upperhill
11,336
91
80.1%
7.6%
11,662
91
81.5%
7.7%
0.1%
Parklands
11,787
82
82.8%
6.8%
11,971
83
85.2%
7.3%
0.5%
Nairobi CBD
12,409
94
78.0%
7.0%
12,586
96
76.5%
7.1%
0.1%
Thika Road
12,571
79
76.3%
5.7%
12,571
79
80.1%
6.0%
0.3%
Mombasa Road
11,250
73
64.2%
5.1%
11,325
71
66.9%
5.1%
0.0%
Average
12,106
94
77.6%
7.3%
12,223
96
79.4%
7.6%
0.3%
Source: Cytonn Research
For notable highlights during the year, please see our Cytonn Q1’2022 Markets-Review, Cytonn H1’2022 Markets Review , and, Cytonn Q3’2022 Markets Review Reports.
Our outlook for the NMA commercial office sector is NEUTRAL owing to the existing oversupply of office spaces at 6.7 mn SQFT in the NMA thereby crippling the overall demand for physical spaces. Conversely, given the reduced developments in the pipeline, coupled with the slow but rising expansion in the sector, we expect that this will help curb the oversupply challenge by allowing room for the absorption of available and fewer incoming spaces.
- Retail Sector
The table below shows the performance of the retail sector performance in Nairobi Metropolitan Area from 2021 to 2022;
Cytonn Report: Summary of Retail Sector Performance in Nairobi Metropolitan Area 2021 to 2022
Item
Q1'2021
H1'2021
Q3'2021
FY'2021
Q1'2022
H1'2022
Q3'2022
FY'2022
Y/Y 2022 ∆
Average Asking Rents (Kshs/SQFT)
166
177
177
170
170
173
171
174
2.4%
Average Occupancy (%)
75.0%
78.0%
78.0%
76.8%
77.2%
75.9%
76.1%
77.6%
0.8%
Average Rental Yields
7.4%
8.1%
8.1%
7.8%
7.9%
7.8%
7.6%
7.9%
0.1%
Source: Cytonn Research
The key take-outs from the table include;
- Average Occupancy Rate - The average occupancy rates came in at 77.6%, a 0.8% points increase from 76.8% recorded in FY’2021. This was primarily on the back of factors such as; i) an improved business environment following the gradual recovery of the economy in the post COVID-19 era, ii) aggressive expansion by local and foreign retailers such as Naivas, Optica Limited, Kentucky Fried Chicken (KFC), Chicken and Pizza Inn, Chandarana Food plus, QuickMart, and Carrefour, iii) improved infrastructure developments enhancing accessibility to retail centres, and, iv) positive demographics which continues to facilitate demand for spaces, goods and services,
- Asking Rents - The average asking rents per SQFT increased by 2.4% to Kshs 174 in FY’2022 from Kshs 170 recorded in FY’2021, driven by an increased presence of quality retail spaces which attract high rents such as the Global Trade Centre (GTC) in Westlands, and,
- Average Rental Yield- The average rental yield for the NMA retail sector improved by 0.1% points to 7.9% in FY’2022, from 7.8% in FY’2021, as a result of improved rental yields and occupancy rates.
In terms of the sub-markets performance, Kilimani, Karen, and, Westlands continued to outshine other nodes thereby being the best performing nodes with average rental yields of 9.8%, 9.4%, and 8.7% respectively, compared to the overall market average of 7.9%. The impressive performance is mainly driven by presence of high quality retail spaces fetching the high rents, coupled with the availability of quality infrastructure services. On the other hand, retail spaces in Eastlands recorded the least average rental yield of 5.9% as a result of; i) the lower rents chargeable at Kshs 131 per SQFT compared to market average of Kshs 174 per SQFT, ii) poor quality infrastructure which does not sufficiently support the retail spaces, iii) heavy presence of informal retail spaces causing stiff competition to the formal investments, and, iv) relatively low demand evidenced by their low occupancy rates at 73.0%, compared to the market average of 77.6%. The table below shows the submarket performance of nodes in the Nairobi Metropolitan Area (NMA) 2022;
All values in Kshs unless stated otherwise
Cytonn Report: Nairobi Metropolitan Area Retail Market Performance FY’2022
Area
Rent Kshs
/SQFT
FY’2021
Occupancy% FY’2021
Rental Yield FY’2021
Rent Kshs
/SQFT
FY’2022
Occupancy% FY’2022
Rental Yield FY’2022
FY’ 2022 ∆ in
Rental Yield
(% points)
Kilimani
183
86.0%
9.8%
187
83.8%
9.8%
0.0%
Karen
202
84.0%
9.8%
216
80.2%
9.4%
(0.4)%
Westlands
213
78.8%
10.0%
211
75.7%
8.7%
(1.3)%
Kiambu/Limuru road
180
74.2%
7.7%
202
72.8%
8.6%
0.9%
Ngong Road
171
79.0%
7.7%
168
80.5%
7.7%
(0.1)%
Mombasa road
148
75.0%
6.8%
154
78.9%
7.4%
0.6%
Thika Road
161
74.0%
6.7%
165
78.7%
7.3%
0.6%
Satellite towns
142
69.0%
6.2%
134
74.6%
6.2%
0.0%
Eastlands
133
71.6%
5.6%
131
73.0%
5.9%
0.3%
Average
170
76.8%
7.8%
174
77.6%
7.9%
0.1%
Source: Cytonn Research
For notable highlights during the year; see (Cytonn Q1’2022 Markets-Review, Cytonn H1’2022 Markets Review, and, Cytonn Q3’2022 Markets Review highlights). During Q4’2022;
- Naivas Supermarket opened five new outlets located at Shell Express Uthiru along Waiyaki Way, Nairobi West Shopping Centre, Boardwalk Mall located in Parklands, Ruai, opposite Ruai Market, Meru’s Greenwood City Mall, and Kahawa Sukari opposite Engen Petrol Station, bringing the total number of its operating outlets countrywide to 91 outlets. For more information, see Cytonn Weekly #51/2022, and,
- Carrefour Supermarket, a French based retail chain opened a new store at Comet House along Monrovia Street bringing the retailer’s number of operating outlets to 19, and the first ever store to be opened by the retailer at Nairobi’s Central Business District. For more information, see Cytonn Weekly #45/2022.
We have a NEUTRAL outlook on the performance of retail sector with the performance expected to be driven by; i) the continuous aggressive growth and expansion by both local and international retailers, ii) increased infrastructural developments boosting accessibility, and, iii) positive demographics facilitating demand of space, goods and services. However, its optimum performance is expected to be impeded by; i) oversupply of retail space at approximately 3.0 mn SQFT in the NMA retail sector and 1.7 mn SQFT in the Kenyan retail sector excluding NMA, and, ii) fast-evolving e-commerce hampering the optimum uptake of physical retail spaces.
- Hospitality Sector
During the year, the hospitality sector continued to make great strides towards its recovery path, away from the adverse effects of the COVID-19 pandemic as evidenced by an increase in the number of international tourist arrivals into the country, number of hotels in operation, bed occupancies and hotel bookings. According to the Leading Economic Indicators (LEI) September 2022, the total number of visitors arriving through Jomo Kenyatta International Airport (JKIA) and Mombasa International Airport (MIA) stood at 0.8 mn persons for the period between January and September 2022, an 18.4% increase from 0.7 mn persons registered during the same period under review in 2021. Furthermore, Central Bank of Kenya (CBK)’s Monetary Policy Committee Hotels Survey – July 2022 report highlighted that out of the 80 hotels sampled around the country, all 80 of them were operating in Q2’2022, up from 90.3% and 39.0% over the same period in 2021 and 2020, respectively. The survey established that normalcy in the level of operations in most hotels around the country had returned to pre-COVID-19 levels, signaling the continued recovery of the sector.
We attribute the upward performance and activities of the sector to; i) intensive marketing of Kenya’s tourism market through platforms such as the Magical Kenya and Kenya Tourism Board, ii) increased promotion of local tourism, iii) improved security, iv) reopening of the global economy owing to mass vaccinations as well as lifting of all travel restrictions and lockdowns, v) continuous improvement of the economy after the peaceful August general elections, vi) increased conferences and meetings from private sector businesses and companies, vii) increased leisure activities during the festive season and sporting activities with the hosting of Annual Safari Rally competition until 2026, and, vii) continued recognition of Kenya’s hospitality industry through positive accolades awarded to several local and foreign hotel brands based in Kenya in different categories such as the World Travel Awards, MICE Awards, Fodor Finest Hotels, among others, which has boosted investors’ confidence in the sector.
Despite the above cushioning factors, the sector’s optimum performance was still majorly weighed down by the prevailing inflationary pressures, and consequently its GDP growth also curtailed. According to the Q3’2022 GDP report, the Accommodation and Restaurant services grew by 22.9% in Q3’2022, 104.6% decline from the 127.5% growth recorded in Q3’2021. However, on a q/q basis, the performance represented a 0.9% points increase from the 22.0% growth recorded in Q2'2022. Additionally, the performance of the sector continued to be cushioned by rising tourism activities, with the number of international arrivals through Jomo Kenyatta International Airport (JKIA) and Moi International Airport (MIA) increasing by 44.6% to 315,112 in Q3’2022, from the 217,873 recorded in Q3’2021. The graph below shows the Accommodation and Restaurant Sector growth rate from Q1’2020-Q2’2022;
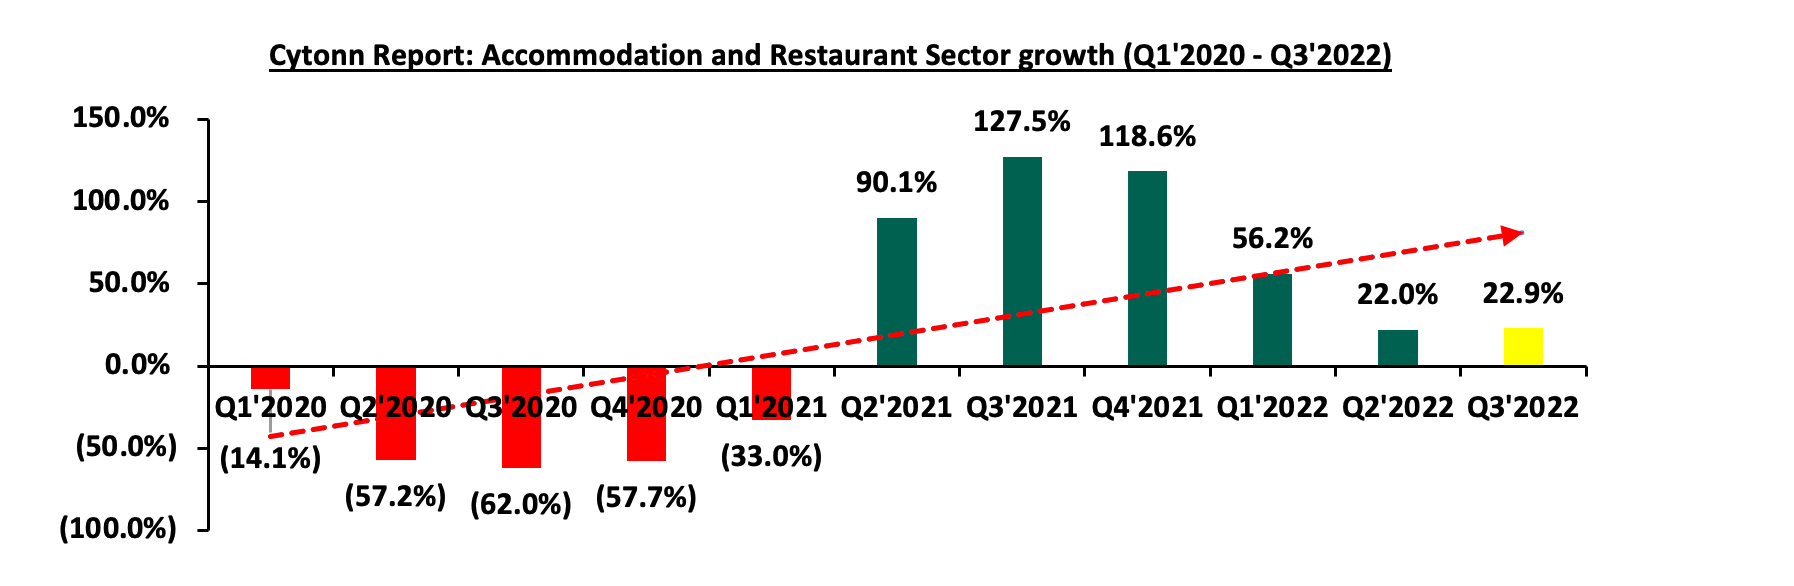
Source: Kenya National Bureau of Statistics (KNBS)
Additionally during the year, we released the Nairobi Metropolitan Area (NMA) Serviced Apartments Report 2022. The general performance of the serviced apartments improved y/y, with the occupancy rates coming in at 65.8%, a 4.3% points increase from the 61.5% recorded in 2021. The monthly charges also improved to Kshs 2,716 per SQM from Kshs 2,549 per SQM recorded in 2021, representing a 6.6% increase. Consequently, the average rental yield increased to 6.2% in 2022, a 0.7% points increase from the 5.5% recorded in 2021. The table below shows the comparative analysis between 2021 and 2022;
All values in Kshs unless stated otherwise
Cytonn Report: Comparative Analysis-2021/2022 Market Performance
Node
Monthly
Charge/S
QM 2021
Occupancy 2021
Rental
Yield
2021
Monthly
Charge/S
QM 2022
Occupancy 2022
Rental
Yield
2022
Change in Monthly Charges/ SQM
Change in
Occupancy
Change in Rental
Yield
Westlands
3,569
68.8%
8.3%
3,916
70.7%
9.3%
9.7%
1.9%
1.0%
Kilimani
2,815
60.0%
5.8%
2,937
69.3%
7.2%
4.3%
9.3%
1.4%
Kileleshwa & Lavington
2,571
57.1%
6.4%
2,811
66.3%
6.6%
9.3%
9.2%
0.2%
Limuru Road
2,853
60.5%
4.9%
2,976
60.6%
5.8%
4.3%
0.1%
0.9%
Nairobi CBD
2,176
66.6%
4.9%
2,348
66.2%
5.2%
7.9%
(0.4%)
0.3%
Upperhill
2,109
61.1%
4.5%
2,225
65.4%
5.0%
5.5%
4.3%
0.5%
Thika Road
1,748
56.4%
3.5%
1,800
62.1%
4.2%
3.0%
5.7%
0.7%
Average
2,549
61.5%
5.5%
2,716
65.8%
6.2%
6.3%
4.3%
0.7%
Source: Cytonn Research
For notable highlights during the year please see our Cytonn Q1’2022 Markets Review, Cytonn H1’2022 Markets Review and Cytonn Q3’2022 Markets Review Reports. During Q4’2022;
- Hotel group Hemingways Collection took over management of Eden Hotel, which featured as the only Kenyan hotel in the Fodor Finest Hotels List, Africa 2023. The hotel set to be renamed Hemingways Eden is located in Karen, Nairobi and will take the number of operating hotels by the group to four. For more information, see Cytonn Weekly #49/2022,
- Global hospitality chain Hilton Hotel, announced plans to open a new hotel in Westlands dubbed Kwetu Nairobi in February 2023. For more information, see Cytonn Weekly #46/2022,
- Crowne Plaza Nairobi was voted the best luxury airport hotel in Africa during the 16th World Luxury Hotel Awards 2022, thereby becoming Kenya’s first airport hotel to win the award, while Kenya emerged as Africa’s best MICE destination in the in the 3rd annual World MICE Awards. For more information, see Cytonn Weekly #43/2022, and,
- Nairobi was voted as Africa’s leading business travel destination in the 29th World Travel Awards which was held at the Kenyatta International Convention Centre (KICC). Nairobi has received the award for the fourth consecutive year signifying the continued confidence in the city as a vibrant business destination. For more information, see Cytonn Weekly #42/2022.
We have a NEUTRAL outlook for the sector as we expect the sector to continue registering improved performance moving forward in terms of overall hotels in operations, hotel bookings, and hotel occupancies. However, we anticipate factors such as the newly issued travel advisory by the United Kingdom government through its Foreign and Commonwealth Office (FCO) to have a negative impact on international arrivals in 2023 considering the UK is among top five tourist markets for Kenya, and, the government’s directive to indefinitely suspend hotel meetings, conferences and trainings to weigh down the optimum performance of the conferencing, food and accommodation sub-sectors.
- Mixed Use Developments (MUDs)
In October 2022, we released the Nairobi Metropolitan Area (NMA) Mixed Use Developments (MUDs) Report 2022, which highlighted that MUDs recorded an average rental yield of 7.4%, 0.2% points higher than the 7.2% yield recorded in 2021. The relatively improved performance was mainly attributed to; i) strategic and prime locations of the developments attracting prospective clients, ii) increased infrastructural developments in the NMA hence improving accessibility to the developments, and, iii) continuous preference by target clientele owing to convenience, resulting in increased demand and returns on investment. The table below shows the performance of Mixed-Use development themes by node in 2022;
All Values in Kshs Unless Stated Otherwise
Cytonn Report: Nairobi Metropolitan Area Mixed Use Developments Performance by Nodes 2022
Location
Commercial Retail Sector
Commercial Office Sector
Residential Sector
Average MUD Yield
Rent (Kshs/SQFT)
Occupancy
Rental Yield
Rent (Kshs/SQFT)
Occupancy
Rental Yield
Price (Kshs/SQM)
Rent (Kshs/SQM)
Annual Uptake
Rental Yield
Karen
240
94.0%
10.5%
115
90.0%
9.1%
9.8%
Kilimani
166
80.0%
8.7%
102
80.0%
7.4%
8.0%
Westlands
193
71.1%
9.2%
106
74.4%
7.6%
245,095
1,984
13.7%
7.0%
7.9%
Upper Hill
140
73.3%
7.8%
102
78.3%
7.9%
7.8%
Limuru Road
238
80.0%
10.3%
105
72.5%
6.9%
184,399
1,292
31.1%
6.0%
7.7%
Thika Rd
193
76.7%
8.6%
93
75.0%
6.5%
138,831
758
17.8%
4.4%
6.5%
Mombasa Rd
203
72.5%
8.8%
90
70.0%
5.8%
120,539
551
13.6%
4.1%
6.3%
Eastlands
125
77.5%
5.8%
80
66.5%
5.3%
81,081
360
10.7%
4.0%
5.2%
Average
185
76.4%
8.8%
101
76.2%
7.3%
159,301
1,030
16.5%
5.2%
7.4%
*The average MUDs performance is based on areas where sampled projects exist
Source: Cytonn Research
Overall performance: In terms of performance per node, Karen was the best performing of all sampled nodes with an average MUD rental yield of 9.8%, 2.4% points higher than the market average of 7.4% in 2022. The remarkable performance was largely attributed to; i) the presence of prime retail and office spaces fetching higher rents and yields, ii) quality infrastructure supporting investments, and, iii) affluent residents with high consumer spending power.
For notable highlights during the year please see our Cytonn Q1’2022 Markets Review, Cytonn H1’2022 Markets Review, and Cytonn Q3’2022 Markets Review Reports. In Q4’2022;
- Property developer Mi Vida Homes announced plans to begin the construction of two projects at Garden City in April 2022; the 2nd phase of their mid-market apartments dubbed Amaiya, and, affordable housing units dubbed 237 Garden City. For more information, see Cytonn Weekly #45/2022,
Our overall outlook for Mixed Use Developments is Neutral, backed by the attractive returns in comparison to single use projects and the rising demand for high quality, efficient and environmentally sustainable developments. Nevertheless, the surplus in the NMA commercial office market which currently stands at 6.7 mn SQFT, 3.0 mn SQFT in the NMA retail market and 1.7 mn SQFT oversupply in the overall Kenyan retail market is expected to have a negative impact on their performance. In terms of investment opportunities, Karen, Kilimani and Westlands are the most promising node, with average yields of 9.8%, 8.0% and 7.9% respectively, compared to the general market average yield of 7.4%.
- Land Sector
The NMA land sector continued to soar in FY’2022, with land asking prices per acre rising by 0.2% Year-on-Year (y/y) to Kshs 131.0 mn from Kshs 130.8 mn in FY’2021. The improvement in performance was ascribed to;
- Better accessibility through improved infrastructure which has increased areas attractiveness to investors and developers thereby fueling demand for land,
- Increased demand for Real Estate facilitated by Kenya’s high population and urbanization growth rates, coupled with a rising middle income class population with disposable income,
- Limited supply of land especially in urban areas which has contributed to rising land prices,
- Government’s continued efforts in the construction of infrastructure, such as roads, trains, water, and sewer lines, which has improved and opened up areas for investment, ultimately increasing property prices, and,
- The availability of amenities such as learning institutions, shopping malls and organizations among others, which increase desirability of areas, potentially increasing demand for land and consequently drive up land prices.
Overall Performance – Un-serviced land in Nairobi's satellite towns recorded the highest y/y capital growth of 11.1%, with demand being fueled by: i) high land prices within Nairobi, which has caused investors to source for cheaper land in satellite towns, ii) enhanced accessibility to the areas owing to infrastructure boost through projects such as the Nairobi Expressway and expanded Eastern Bypass, that unlocked value for investors, iii) their affordability which entices both buyers and investors, and, iv) a high number of affordable housing development projects in the areas compared to other NMA regions, further increasing demand for land. The table below shows the overall performance of the sector across all regions in FY’2022:
Cytonn Report: Summary of the Performance Across All regions FY’2022
FY’2021
FY'2022
Annualized Capital Appreciation
Un-serviced land-satellite Towns
13.5 mn
15.1 mn
11.1%
Serviced land-Satellite Towns
16.4 mn
17.8 mn
8.0%
Nairobi High End Suburbs- Low and High Rise Residential Areas
130.2 mn
137.4 mn
6.0%
Nairobi Middle End Suburbs- High Rise Residential Areas
83.0 mn
81.1 mn
(2.0%)
Nairobi Suburbs- Commercial Areas
410.8 mn
403.4 mn
(1.3%)
Average
130.8 mn
131.0 mn
4.3%
Source: Cytonn Research
Sub-markets Performance – For satellite towns , Syokimau and Juja were the best performing nodes with y/y capital appreciations of 19.2% and 16.6% respectively, owing to: i) improved infrastructure developments such as refurbishment of roads, ii) reduced commute time owing to infrastructural improvements which has benefitted homebuyers seeking to settle away from the city, and, iii) a high presence of higher learning institutions within Juja Sub-County, Zetech University Main Campus located in Weteithie being the latest entrant in September 2022, which have exacerbated the demand for land for development of student housing. For Nairobi suburbs, Kitisuru recorded the highest appreciation of 12.1% due to; i) good infrastructure supporting investments, ii) a large population of affluent residents with higher purchasing power and disposable incomes, iii) ample security, iv) serene environment, and, v) proximity to social amenities such as Two Rivers malls which have generally increased the area’s desirability driving land prices upwards. The table below shows NMA’s land performance by submarkets in FY’2022;
Price in Kshs per Acre
Cytonn Report: Nairobi Metropolitan Area Land Performance By Submarkets – FY’2022
Location
Price FY'2021
Price FY'2022
Capital Appreciation
Satellite Towns - Unserviced Land
Juja
12.4 mn
14.4 mn
16.6%
Utawala
16.2 mn
18.6 mn
14.8%
Limuru
20.0 mn
22.7 mn
13.4%
Rongai
14.0 mn
15.0 mn
7.1%
Athi River
4.7 mn
4.9 mn
3.4%
Average
13.5 mn
15.1 mn
11.1%
Satellite Towns - Serviced Land
Syokimau
16.3 mn
19.5 mn
19.2%
Ruiru & Juja
23.3 mn
26.3 mn
13.0%
Rongai
15.7 mn
16.2 mn
3.3%
Athi River
15.0 mn
15.5 mn
3.2%
Ruai
11.5 mn
11.7 mn
1.4%
Average
16.4 mn
17.8 mn
8.0%
Nairobi High End Suburbs (Low and High Rise Areas)
Kitisuru
89.1 mn
99.9 mn
12.1%
Spring Valley
168.5 mn
179.7 mn
6.6%
Karen
60.9 mn
64.5 mn
6.0%
Ridgeways
83.3 mn
87.0 mn
4.5%
Kileleshwa
298.3 mn
309.5 mn
3.8%
Runda
81.4 mn
83.7 mn
2.9%
Average
130.2 mn
137.4 mn
6.0%
Nairobi Middle End Suburbs – High Rise Areas
Embakasi
74.5 mn
78.8 mn
5.5%
Kasarani
75.5 mn
78.7 mn
4.1%
Dagoretti
99.1 mn
85.7 mn
(15.7%)
Average
83.0 mn
81.1 mn
(2.0%)
Nairobi Suburbs - Commercial Zones
Riverside
319.3 mn
342.1 mn
7.2%
Upperhill
487.9 mn
479.4 mn
(1.7%)
Kilimani
397.8 mn
378.7 mn
(4.8%)
Westlands
438.2 mn
413.2 mn
(5.7%)
Average
410.8 mn
403.4 mn
(1.3%)
Source: Cytonn Research
We retain a positive performance for the land sector in the Nairobi Metropolitan Area which proves to be a reliable investment opportunity, having continued to show great resilience even during times of economic hardship in the COVID-19 period, and a depreciating Kenyan currency. We anticipate that the sector’s performance will continue being driven by; i) a greater emphasis on Affordable Housing projects and private projects, ii) positive population demographics, iii) the government's attempts to streamline land transactions, and iv) rapid growth of satellite towns amid increased delivery of infrastructural developments which are improving accessibility, property prices and demand in the regions- Infrastructure
The government of Kenya continued to make considerable efforts in advancing infrastructural developments across the country amid focus on achieving the Vision 2030 and Big Four Agenda with regards to providing efficient, sustainable, and, environmentally friendly projects. However, 2022 experienced a slight slowdown in the completion and commissioning of projects on the back of; i) the recently concluded election season, ii) change of guard, and, iii) consequential administrative restructuring of government Ministries, departments and Agencies (MDAs) involved in the projects by the new government administration after the August polls. For notable highlights during the year please see our Cytonn Q1’2022 Markets Review, Cytonn H1’2022 Markets Review, and Cytonn Q3’2022 Markets Review Reports. For Q4’2022;
- African Infrastructure Investment Managers (AIIM), one of Africa’s leading infrastructure private equity managers, committed Kshs 4.1 bn to Kenya’s Road Annuity Programme for the development of road infrastructure in the country to be done through the AIIM’s pan African AIIF4 Fund. For more information, please see our Cytonn Weekly #47/2022, and,
- The national government in partnership with the African Development Bank (AfDB), announced plans to construct a highway linking West Pokot and Turkana counties with South Sudan. The construction of the road whose distance, construction cost and period is yet to be disclosed, will be done by the Kenya National Highway Authority (KeNHA). For more information, please see our Cytonn Monthly – October 2022.
- Statutory Review
In 2022, both the Kenyan national and county governments continued to implement various relevant laws and regulations in the Real Estate sector in order to level up transactions and build on the overall efficiency, compliance, and, transparency in the industry. For notable highlights during the year, please see our Cytonn Q1’2022 Markets Review, Cytonn H1’2022 Markets Review and Cytonn Q3’2022 Markets Review Reports. In Q4’2022;
- Nairobi City Hall issued a notice on the increment of land rates to 0.115% of the current value of undeveloped land in Nairobi County based on the 2019 Draft Valuation roll, from 1st January 2023, in line with the Nairobi City Finance Act 2022. For more information, see Cytonn Weekly #47/2022,
- President William Ruto announced plans to exempt all first-time home buyers from paying stamp duty. This comes two years after the Stamp Duty Act was amended in 2020 to allow exemptions for first time home buyers of only approved affordable housing units by the government. For more information, see Cytonn Weekly #43/2022, and,
- The Retirement Benefits Authority (RBA) announced plans to have pension managers publish data on the number of Kenyans who use their retirement savings to purchase homes by January 2023, after having reviewed the Retirement and Benefits Act. For more information, see Cytonn Weekly #41/2022.
- Real Estate Investment Trusts (REITs)
During the week, the Capital Markets Authority (CMA) granted a No Objection to Acorn Investment Management Limited to roll-out its Vuka Investment Platform to the mass market after successful completion of testing on the regulatory sandbox that started in August 2021.
Vuka allows retail investors to own units of the Acorn Student Accommodation Income REIT (Acorn I-REIT) which operates under the brand names of Qwetu and Qejani. Under the platform, qualified retail investors purchase and sell asset-backed units through CMA-qualified custodial accounts, which entitle them to dividends and capital appreciation of the underlying income generating portfolio. Qualified retail investors include Investment Clubs (Chamas), Saccos or individuals with earnings equivalent Ksh 50,000 per month seeking long-term investments of not less than one year. Vuka currently has 2,100 retail investors and Kshs 62.0 mn worth of assets under management. The Platform is expected to boost the performance of the Kenyan REITs market by;
- Mobilizing investor participation in the REITs market,
- Increasing liquidity to investors willing to participate in the Real Estate market which is illiquid in nature, and,
- Enhancing financial literacy regarding trading of units amongst investors akin to the larger capital markets.
Acorn Investment Management Limited is a wholly-owned subsidiary of Acorn Holdings Limited, which serves as the REIT Manager for Acorn Student Accommodation Development REIT (Acorn D-REIT) and the Acorn Student Accommodation Income REIT (Acorn I-REIT) which are both traded on the Unquoted Securities Platform (USP) of the Nairobi Securities Exchange (NSE).
We expect the deployment of the Vuka Investment Platform into the Kenyan REITs market to open up the opportunity for more investors to tap into REITs market the asset-backed units, thereby providing liquidity for investors. However, the high minimum capital requirements for Trustees, long approval process, and few entities capable of incorporating REITs to continue subduing the optimal performance of the sector.
In the Nairobi Securities Exchange, ILAM Fahari I-REIT closed the week trading at an average price of Kshs 6.5 per share. The performance represented a 1.8% decline from Kshs 6.6 per share recorded the previous week, taking it to a 1.6% Year-to-Date (YTD) gain from Kshs 6.4 per share. However, the performance represented a 67.4% Inception-to-Date (ITD) loss from the Kshs 20.0 price. The dividend yield currently stands at 7.7%. The graph below shows Fahari I-REIT’s performance from November 2015 to 30th December 2022;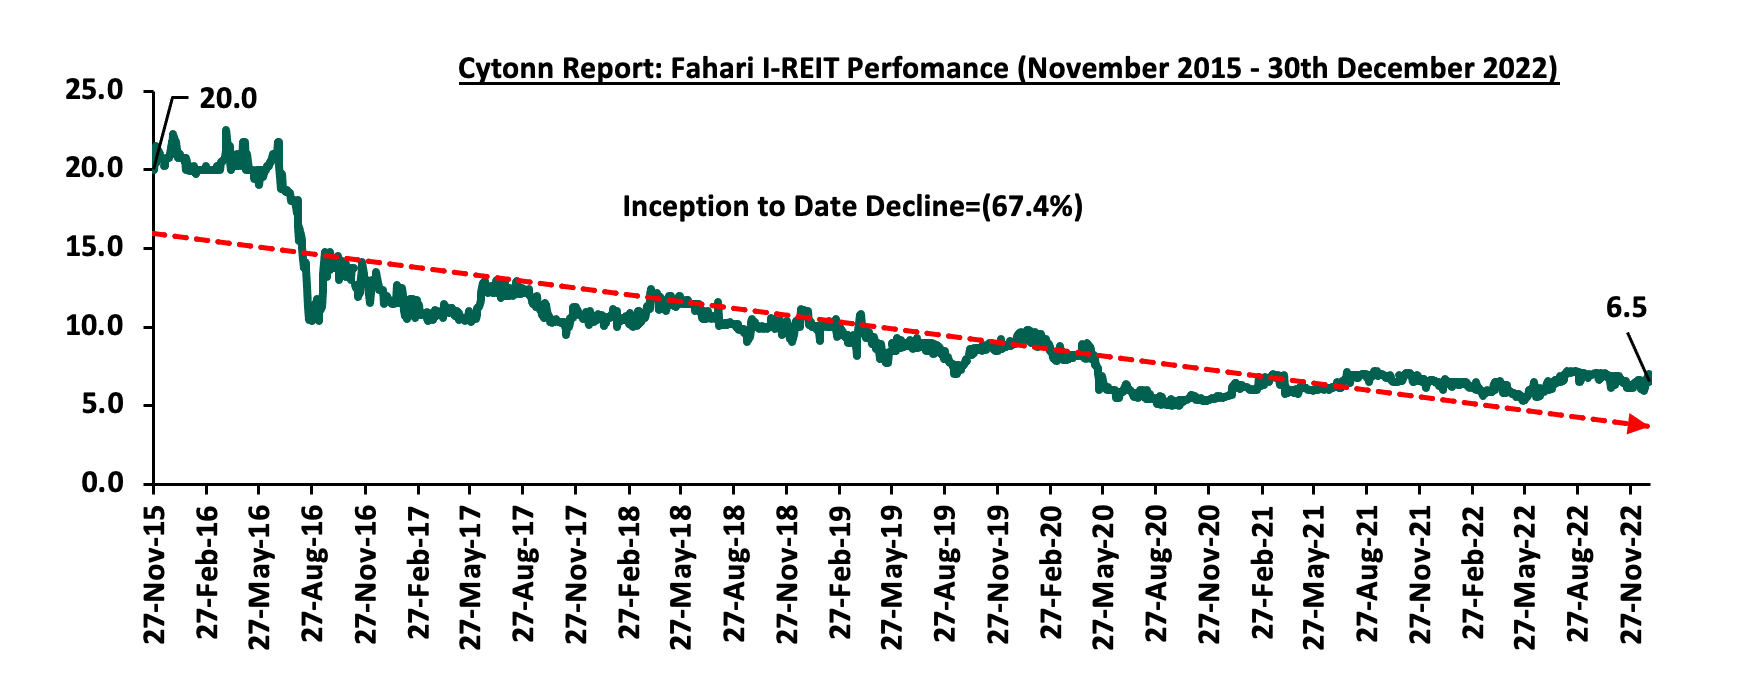
In the Unquoted Securities Platform, Acorn D-REIT and I-REIT traded at Kshs 23.8 and Kshs 20.9 per unit, respectively, as at 16th December 2022. The performance represented a 19.2% and 4.4% gain for the D-REIT and I-REIT, respectively, from the Kshs 20.0 inception price. The volumes traded for the D-REIT and I-REIT came in at 5.5 mn and 15.5 mn shares, respectively, with a turnover of Kshs 117.0 mn and Kshs 320.7 mn, respectively, since inception in February 2021.
We maintain an overall NEUTRAL outlook for Kenya’s property market whose performance is expected to be underpinned by; i) continued growth in demand for developments due to Kenya’s positive demographic profile, ii) rehabilitation of existing housing assets, iii) aggressive expansion efforts by both local and international retailers, iv) growing investor confidence on the hospitality sector as a result of continuous recovery, v) efforts by the KMRC to provide home loans to buyers, and, vi) initiation and implementation of infrastructure projects. However, the increase in capital gains tax on property sales commencing in 2023, prevailing oversupply of physical space in the commercial office and retail sectors, slow delivery of affordable housing projects, rising cost of construction materials, and, the low investor appetite for REITs is expected to hinder the optimum performance of the sector.
Disclaimer: The views expressed in this publication are those of the writers where particulars are not warranted. This publication, which is in compliance with Section 2 of the Capital Markets Authority Act Cap 485A, is meant for general information only and is not a warranty, representation, advice or solicitation of any nature. Readers are advised in all circumstances to seek the advice of a registered investment advisor

- Talk to us
- Kenya
- P.O Box 20695 - 00200, Nairobi, Kenya
- Cell +254709101200
- Tel +254709101200
- WhatsApp +254741676635
- United States
- +254709101200
- DOWNLOAD OUR APP
-


- Kenya
- 8th Floor, Pinetree Plaza, Kaburu Drive, Ngong Road, Nairobi, Kenya
- USA
- Suite 1150, 1775 Eye Street NW, USA, Washington DC 20006, USA
- Investments
- High Yield
- Private Equity
- Real Estate
- Real Estate
- RiverRun Estates
- Cytonn Towers
- The Ridge
- Taraji Heights
- The Alma