Infrastructure in the Nairobi Metropolitan Area (NMA): Roads, Water & Sewer Coverage, & Cytonn Weekly #18/2022
By Cytonn Research, May 8, 2022
Executive Summary
Fixed Income
During the week, T-bills were undersubscribed, with the overall subscription rate coming in at 70.2%, down from the 117.8% recorded the previous week. The 91-day paper recorded the highest subscription rate, receiving bids worth Kshs 5.3 bn against the offered Kshs 4.0 bn, translating to a subscription rate of 131.3%, a decline from the 254.6% recorded the previous week. The continued investor preference for the 91-day paper is partly attributable to the higher return on a risk-adjusted basis. The subscription rate for the 364-day and 182-day papers declined to 78.8% and 37.2%, from 93.9% and 87.0%, respectively, recorded the previous week. The yields on the government papers were on an upward trajectory, with the yields on the 364-day, 182-day and the 91-day papers increasing by 6.4 bps, 8.4 bps and 8.3 bps to 9.8%, 8.5% and 7.6%, respectively;
Also during the week, Stanbic Bank released its monthly Purchasing Manager’s Index (PMI) highlighting that the index for the month of April 2022 declined to 49.5 from 50.5 recorded in March 2022 pointing towards a deterioration of the business environment in the Kenyan private sector. The decline was largely on the back of the high cost of living occasioned by the rising fuel prices and production costs. Additionally, the Kenya National Bureau of Statistics (KNBS) released the Economic Survey 2022, highlighting that the economy expanded by 7.5% in 2021 from the 0.3% contraction recorded in 2020. The growth was mainly driven by the resumption of most economic activities following the lifting of COVID-19 containment measures put in place in 2020 to curb the spread of the virus, which led to the recovery of most sectors of the economy;
Equities
During the week, the equities market was on a downward trajectory, with NASI, NSE 20 and NSE 25 declining by 3.6%, 2.5% and 3.0%, respectively, taking their YTD performance to losses of 13.4%, 8.3% and 12.7% for NASI, NSE 20 and NSE 25, respectively. The equities market performance was driven by losses recorded by large cap stocks such as Safaricom, NCBA, BAT, EABL and KCB of 5.0%, 4.0%, 3.7%, 3.5% and 3.2%, respectively. The losses were however mitigated by gains recorded by other stocks such as Jubilee Holdings and Stanbic Holdings of 0.4% and 0.2% respectively;
During the week, the Capital Markets Authority (CMA) announced that it had made public the Draft Capital Markets Public Offers Listing and Disclosures Regulations 2022, which are meant to replace the Public Offers Listing and Disclosures Regulations 2002, which have been in place since 2002, with the only amendments done in 2016. The main aim of the Draft Regulations is to provide a more enabling environment in Kenya’s Capital Markets in order to spur more listings in the Nairobi Securities Exchange. Additionally, during the week, Sanlam Limited, a South African financial services group listed on the Johannesburg Stock Exchange, announced that it had entered into a definitive Joint Venture agreement for a term of 10 years with Allianz SE, a global integrated financial services firm listed on the Frankfurt Stock Exchange with the aim to leverage on the two entities footprints in Africa and create a leading Pan-African financial services group, with an estimated equity value of Kshs 243.7 bn;
During the week, NCBA Group released their Q1’2022 results, with the Core earnings per share (EPS) growing by 20.3% to Kshs 2.1, from Kshs 1.7 in Q1’2021;
Real Estate
During the week, the Kenya National Bureau of Statistics (KNBS) released the Economic Survey 2022, a report that analyses the performance of key sectors of the Kenyan economy, highlighting that Real Estate Sector GDP growth came in at 6.7% in 2021, a 2.6% points increase from 4.1% in 2020. In the retail sector, Naivas Supermarket announced plans to open a new outlet to be located at Safari Centre in Naivasha by 13th May 2022. In the infrastructure sector, infrastructure Principal Secretary Paul Maringa announced that the government plans to launch the 27.1-km Nairobi Expressway by the end of May. In Listed Real Estate, the ILAM Fahari I-REIT closed the week trading at an average price of Kshs 5.8 per share, representing a 3.3% Week-to-Date (WTD) decline from Kshs 6.0 per share;
Focus of the Week
Over the years, we have witnessed numerous infrastructure development activities in the country, particularly in the Nairobi Metropolitan Area (NMA). This has mainly been fuelled by government’s aggressive focus towards initiation and implementation of infrastructure projects, with an aim of improving the country’s economic status, as well as positioning Kenya as a regional hub. This week we shall cover the status of infrastructure in the Nairobi Metropolitan Area (NMA), with a major focus on roads, water and sewer network coverage, as well as highlighting the importance of infrastructure to the NMA’s Real Estate sector;
Investment Updates:
- Weekly Rates:
- Cytonn Money Market Fund closed the week at a yield of 10.53%. To invest, dial *809#;
- Cytonn High Yield Fund closed the week at a yield of 13.89% p.a. To invest, email us at sales@cytonn.com and to withdraw the interest, dial *809#;
- Kevin Karobia, an Investments Analyst, moderated a panel on Twitter Spaces to discuss “The State of Kenya’s Capital Markets”. The panel included Kevin Maina, Head of Equities Trading and Analysis at Genghis Capital, and, Edwin Dande, CEO at Cytonn Investments. Listen to the conversation here,
- We continue to offer Wealth Management Training every Thursday and every third Saturday of the month, from 9:00 am to 11:00 am, through our Cytonn Foundation. The training aims to grow financial literacy among the general public. To register for any of our Wealth Management Trainings, click here;
- If interested in our Private Wealth Management Training for your employees or investment group, please get in touch with us through wmt@cytonn.com;
- Any CHYS and CPN investors still looking to convert through assignment of debt are welcome to consider one of the five projects currently available for assignment, click here for the latest term sheet;
- Cytonn Insurance Agency acts as an intermediary for those looking to secure their assets and loved ones’ future through insurance namely; Motor, Medical, Life, Property, WIBA, Credit and Fire and Burglary insurance covers. For assistance, get in touch with us through insuranceagency@cytonn.com;
- Cytonnaire Savings and Credit Co-operative Society Limited (SACCO) provides a savings and investments avenue to help you in your financial planning journey. To enjoy competitive investment returns, kindly get in touch with us through clientservices@cytonn.com;
Real Estate Updates:
- For an exclusive tour of Cytonn’s Real Estate developments, visit: Sharp Investor's Tour, and for more information, email us at sales@cytonn.com;
- Phase 3 of The Alma is now ready for occupation. To rent please email properties@cytonn.com;
- We have 8 investment-ready projects, offering attractive development and buyer targeted returns; See further details here: Summary of Investment-ready Projects;
- For recent news about the group, see our news section here;
Hospitality Updates:
We currently have promotions for Staycations. Visit cysuites.com/offers for details or email us at sales@cysuites.com;
Money Markets, T-Bills & T-Bonds Primary Auction:
During the week, T-bills were undersubscribed, with the overall subscription rate coming in at 70.2%, down from the 117.8% recorded the previous week. The 91-day paper recorded the highest subscription rate, receiving bids worth Kshs 5.3 bn against the offered Kshs 4.0 bn, translating to a subscription rate of 131.3%, a decline from the 254.6% recorded the previous week. The continued investor preference for the 91-day paper is partly attributable to the higher return on a risk-adjusted basis. The subscription rate for the 364-day and 182-day papers declined to 78.8% and 37.2%, from 93.9% and 87.0%, respectively, recorded the previous week. The yields on the government papers were on an upward trajectory, with the yields on the 364-day, 182-day and the 91-day papers increasing by 6.4 bps, 8.4 bps and 8.3 bps to 9.8%, 8.5% and 7.6%, respectively. The government accepted all the Kshs 16.8 bn worth of bids received, translating to an acceptance rate of 100.0%, reflecting the elevated borrowing appetite by the government as it nears the end of the current fiscal year 2021/2022.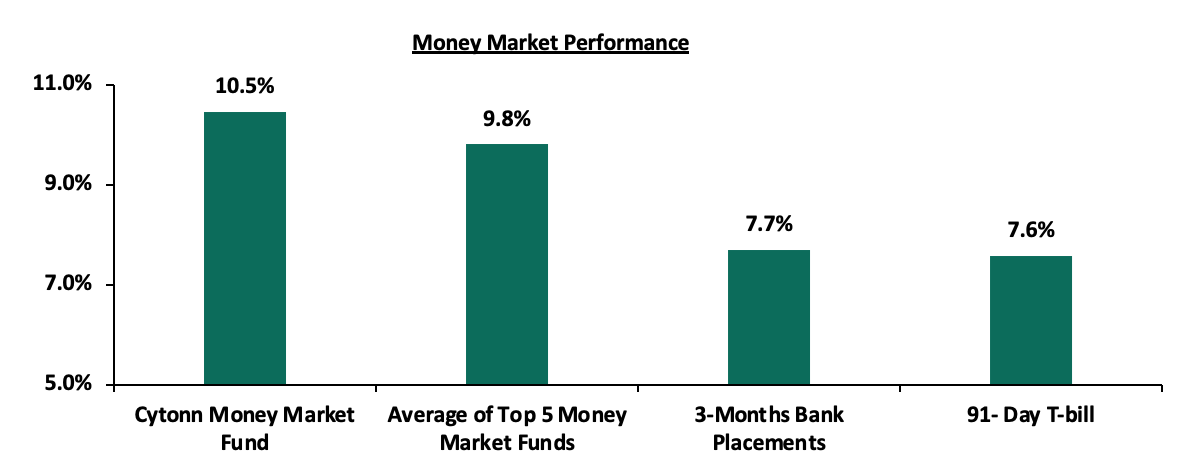
In the money markets, 3-month bank placements ended the week at 7.7% (based on what we have been offered by various banks), while the yield on the 91-day T-bill increased by 8.3 bps to 7.6%. The yield on the Cytonn Money Market Fund and average yield of the Top 5 Money Market Funds remained relatively unchanged at 10.5% and 9.8%, respectively as recorded the previous week.
The table below shows the Money Market Fund Yields for Kenyan Fund Managers as published on 6th May 2022:
|
Money Market Fund Yield for Fund Managers as published on 6th May 2022 |
||
|
Rank |
Fund Manager |
Effective Annual Rate |
|
1 |
Cytonn Money Market Fund |
10.5% |
|
2 |
Zimele Money Market Fund |
9.9% |
|
3 |
Nabo Africa Money Market Fund |
9.8% |
|
4 |
Sanlam Money Market Fund |
9.6% |
|
5 |
Dry Associates Money Market Fund |
9.4% |
|
6 |
Madison Money Market Fund |
9.4% |
|
7 |
Apollo Money Market Fund |
9.3% |
|
8 |
CIC Money Market Fund |
9.1% |
|
9 |
ICEA Lion Money Market Fund |
8.7% |
|
10 |
GenCap Hela Imara Money Market Fund |
8.7% |
|
11 |
Co-op Money Market Fund |
8.6% |
|
12 |
NCBA Money Market Fund |
8.4% |
|
13 |
Orient Kasha Money Market Fund |
8.4% |
|
14 |
AA Kenya Shillings Fund |
7.7% |
|
15 |
Old Mutual Money Market Fund |
7.5% |
|
16 |
British-American Money Market Fund |
7.4% |
Source: Business Daily
Liquidity:
During the week, liquidity in the money markets remained relatively stable, with the average interbank rate remaining relatively unchanged at 4.8%, as recorded the previous week, partly attributable to government payments which offset tax remittances. The average interbank volumes traded increased by 1.6% to Kshs 17.3 bn, from Kshs 17.0 bn recorded the previous week.
Kenya Eurobonds:
During the week, the yields on Eurobonds were on an upward trajectory, attributable to the heightened perceived risks by investors on the back of the rising inflation and the upcoming August 2022 elections. The yields on the 10-year Eurobond issued in 2014 and the 7-year Eurobond issued in 2019 increasing by 0.6% points to 9.3% and 11.1%, from 8.7% and 10.5%, respectively. The 30-year Eurobond issued in 2018, and the 12-year Eurobonds issued in 2019 and 2021 all increased by 0.3% points to 11.3%, 10.7% and 10.3%, from 11.0%, 10.4% and 10.0%, respectively. Similarly, the 10-year Eurobond issued in 2018 increased by 0.2% points to 10.2% from 10.0%:
|
Kenya Eurobond Performance |
||||||
|
|
2014 |
2018 |
2019 |
2021 |
||
|
Date |
10-year issue |
10-year issue |
30-year issue |
7-year issue |
12-year issue |
12-year issue |
|
3-Jan-22 |
4.4% |
8.1% |
8.1% |
5.6% |
6.7% |
6.6% |
|
29-April-22 |
8.7% |
10.0% |
11.0% |
10.5% |
10.4% |
10.0% |
|
02-May-22 |
8.8% |
10.0% |
11.1% |
10.5% |
10.8% |
10.2% |
|
03-May-22 |
9.2% |
10.2% |
11.2% |
10.8% |
10.7% |
10.3% |
|
04-May-22 |
9.2% |
10.4% |
11.3% |
10.8% |
10.7% |
10.4% |
|
05-May-22 |
9.3% |
10.2% |
11.3% |
11.1% |
10.7% |
10.3% |
|
Weekly Change |
0.6% |
0.2% |
0.3% |
0.6% |
0.3% |
0.3% |
|
MTD Change |
0.6% |
0.2% |
0.3% |
0.6% |
0.3% |
0.3% |
|
YTD Change |
4.9% |
2.1% |
3.2% |
5.5% |
4.0% |
3.7% |
Source: CBK
Kenya Shilling:
During the week, the Kenyan shilling depreciated marginally by 0.1% against the US dollar to close the week at Kshs 115.9, from Kshs 115.8 recorded the previous week, partly attributable to increased dollar demand from the oil and energy sectors. Key to note, this is the lowest the Kenyan shilling has ever depreciated against the dollar. On a year to date basis, the shilling has depreciated by 2.4% against the dollar, in comparison to the 3.6% depreciation recorded in 2021. We expect the shilling to remain under pressure in 2022 as a result of:
- Rising global crude oil prices on the back of supply constraints and geopolitical pressures at a time when demand is picking up with the easing of COVID-19 restrictions and as economies reopen. Key to note, risks abound the recovery following the emergence of the new COVID-19 variants,
- Increased demand from merchandise traders as they beef up their hard currency positions in anticipation for more trading partners reopening their economies globally,
- An ever-present current account deficit due to an imbalance between imports and exports, with Kenya’s current account deficit estimated to come in at 5.6% of GDP in the 12 months to February 2022 compared to the 4.3% for a similar period in 2021. The wider deficit reflects a higher import bill, particularly for oil, which more than offset increased receipts from agricultural and services exports, and remittances, and,
- The aggressively growing government debt, with Kenya’s public debt having increased at a 10-year CAGR of 18.6% to Kshs 8.2 tn in December 2021, from Kshs 1.5 tn in December 2011 thus putting pressure on forex reserves to service some of the public debt. It is worth noting that the average GDP growth over the same period has been 3.9%, an indicator that the increase in debt is not translating into GDP growth.
The shilling is however expected to be supported by:
- High Forex reserves currently at USD 8.4 bn (equivalent to 5.0-months of import cover), which is above the statutory requirement of maintaining at least 4.0-months of import cover, and the EAC region’s convergence criteria of 4.5-months of import cover. In addition, the reserves were boosted by the USD 750.0 mn World Bank loan facility received in March 2022 and are expected to be boosted further by the expected USD 244.0 bn from the International Monetary Fund (IMF), and,
- Improving diaspora remittances evidenced by a 25.0% y/y increase to USD 363.6 mn as of March 2022, from USD 290.8 mn recorded over the same period in 2021, the highest figure ever which has continued to cushion the shilling against further depreciation.
Weekly Highlights:
- Stanbic Bank’s April 2022 Purchasing Manager’s Index (PMI)
During the week, Stanbic Bank released its monthly Purchasing Manager’s Index (PMI) highlighting that the index for the month of April 2022 declined to 49.5 from 50.5 recorded in March 2022 pointing towards a deterioration in the business environment in the Kenyan private sector. The decline was partly attributable to a rise in input costs, marking an eight – year high and a decline in output on the back of persistent supply chain constraints which led to increased cost pressures on the consumers. Consequently, new order volumes declined as consumers reduced their spending. Key to note, purchasing activity by businesses continued to increase despite the rise in prices as businesses sought to restock goods amid concerns that supply would worsen. Additionally, firms reported a slower increase in employment in April helped in stabilizing the work backlog, amid lower demand. The chart below summarizes the evolution of the PMI over the last 24 months: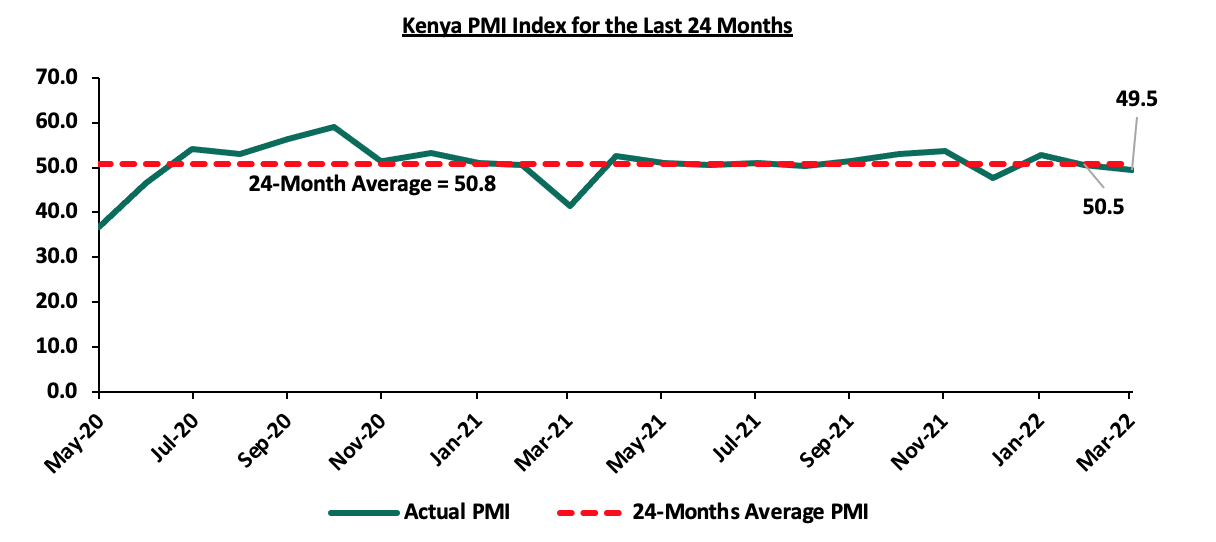
*** Key to note, a reading above 50.0 signals an improvement in business conditions, while readings below 50.0 indicate a deterioration.
The average PMI for the first four months of 2022 came in at 50.1, higher than the 49.1 recorded in the same period in 2021 indicative of an improved business environment over the period. However, the general business environment deteriorated in April following two months of improvement and is expected to continue deteriorating in the short term on the back of the increasing cost of products which have led to a rise in the cost of living. As such, we maintain a cautious outlook in the short-term owing to the continued rise in cost of fuel and production materials which has led to reduced consumer spending. With fuel being a major input cost to many businesses, we expect the increasing global fuel prices to further contribute to the deterioration of business conditions in the country. Additionally, we believe that the stabilization under the fuel subsidy program by the National Treasury is unsustainable given the continued rise in the average landed cost of fuel with the cost having increased by 20.5%, 24.7% and 11.8% for super petrol, diesel and kerosene in April 2022. Further, the uncertainties surrounding the upcoming August elections, are likely to have a negative effect on the business environment as the elections are expected to disrupt the economy in general.
- KNBS Economic Survey 2022
During the week, the Kenya National Bureau of Statistics (KNBS) released the Economic Survey 2022, highlighting that the economy expanded by 7.5% in 2021, from the 0.3% contraction that was recorded in 2020. The Nominal GDP grew by 12.9% to Kshs 12.1 tn in 2021, from Kshs 10.7 tn in 2020. The growth was mainly driven by the resumption of most economic activities following the lifting of COVID-19 containment measures put in place in 2020 to curb the spread of the virus, which led to the recovery of most sectors of the economy. Notably, all sectors of the economy expanded apart from the agricultural sector which contracted by 0.2%. Some of the key take-outs from the report include;
- The agriculture, forestry and fishing sector, the largest contributor to GDP accounting for 22.4% in 2021, contracted by 0.2% from a growth rate of 4.6%. The performance is mainly attributable to unfavorable weather conditions coupled with the continued ban on logging activities in government forests since 2018 which has curtailed growth in the forestry sector. There was a decline in production of the key food crops while production of cash crops recorded mixed performance with increases being recorded in horticultural production,
- The manufacturing sector recorded 6.9% growth in 2021, up from the 0.4% contraction recorded in 2020. The growth is largely attributable the reopening of the economy both locally and internationally, which saw an increase in demand and activities in the economy. Notably, the food sub sector grew by 5.5% while the non-food sub sector expanded by 8.8% in 2021,
- The accommodation and food service sector recorded robust growth, expanding by 52.5% in 2021 from the 47.7% contraction recorded in 2020. Notably, the number of international arrivals increased by 50.3% to 0.9 mn visitors from 0.6 mn visitors in 2020 largely due to the easing of the COVID-19 related restrictions in most parts of the world. Additionally, bed night occupancy increased by 50.3% to 5.5 mn in 2021 from 3.7 mn in 2020,
- Other key GDP contributors such as Transportation and Storage, and, Real estate also recorded growth, growing by 7.2% and 6.7% buoyed by the easing of COVID-19 measures that had constrained activities in the sector for the better part of 2020 and increased activity in the real estate sector, respectively, and,
- The Central Bank of Kenya (CBK) maintained the Central Bank Rate (CBR) at 7.0% during the year in a bid support economic recovery from the adverse effects of COVID-19. During the review period, there was a general increase in the interest rates with the lending rate for commercial banks’ loans and advances increasing to 12.2% in December 2021, from 12.0% in December 2020 while the average deposit rate increased to 6.5% in 2021 from 6.3% in 2020.
Below is the overall Gross Domestic Product (GDP) performance over the last 10 years: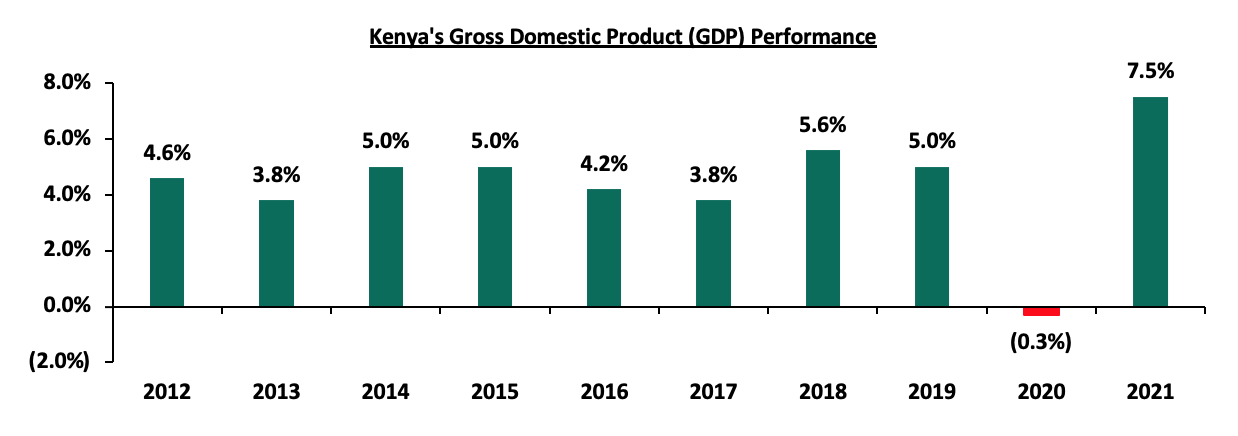
Some other key highlights from the Economic Survey 2022 report include:
- Public Debt: Total stock of public debt rose by 14.9% to Kshs 7,188.1 bn in June 2021 from Kshs 6,254.4 bn as at June 2020, with public external debt accounting for 53.5% of the total debt. In FY’2021/22 a total of Kshs 1,094.0 bn is expected to be spent on servicing public debt, a 53.4% increase from Kshs 713.3 bn in FY’2020/2021. This translates to a debt service to GDP of 9.0% in FY’2021/2022, up from 6.7% in FY’2020/2021,
- Employment: During the year, total employment outside small-scale agriculture and pastoralist activities grew by 5.3% to 18.3 mn in 2021 from 17.4 mn in 2020 as firms sought to clear backlog and as the economy recovered. Total number of self-employed and unpaid family workers within the modern sector remained relatively unchanged at 0.2 mn in 2021 as was recorded in 2020. Informal sector accounted for 81.4% of total employment outside of small-scale agriculture and pastoralist activities while the formal sector accounted for 18.6% of the total employment,
- Money Supply: Broad money supply increased by 6.1% to Kshs 4,235.2 bn in December 2021 from Kshs 3,990.0 bn in December 2020. Total domestic credit grew at slower rate of 15.1% compared to a growth of 18.5% seen in 2020, partly attributable to slower growth in credit extended to the National Government of 29.3% compared to a growth of 50.9% as at end of December 2020,
- Liquidity: Quasi money, money supply (M2), broad money supply (M3), and overall liquidity grew by 3.5%, 5.6%, 6.1%, and 9.5% respectively in the review period,
- Imports & Exports: Total exports increased by 15.5% to Kshs 743.7 bn in 2021, from Kshs 643.7 bn in 2020, mainly on account of increased value of domestic exports such as horticulture. On the other hand, imports grew by 30.9% to Kshs 2,151.2 bn, from Kshs 1,643.6 bn in 2020. As a result, the balance of trade widened by 40.8% to a deficit of Kshs 1,407.6 bn in 2021, from 999.9 bn in 2020. The total value of trade transactions declined to Kshs 2,287.3 bn, from Kshs 2,403.0 bn in 2020, and,
- Balance of Payments: The overall Balance of Payment position improved to a deficit of Kshs 20.4 bn, from a deficit of Kshs 152.5 bn in 2020, partly attributable to the reopening of economies which saw an improvement in international trade, and,
- Current Account: The current account balance deteriorated to a deficit of Kshs 663.8 bn in 2021 from a deficit of Kshs 510.1 bn in 2020. The current account deficit as a percentage of GDP came in at 5.5% in 2021, in comparison to the 4.8% recorded in 2020.
The Kenyan economy has had robust recovery from the adverse effects of COVID-19 and is expected to grow at a slower rate of 5.9% in 2022 driven by the global recovery and the easing of COVID-19 containment measures following an increase in vaccination rates and reduced infections. We expect to see continued growth in key sectors such as the manufacturing, tourism and accommodation sectors in tandem with the global recovery. The agricultural sector is also expected to grow in 2022 supported by the better weather conditions and the fertilizer subsidy extended by the government. However, the key challenges remain the rising fuel prices, increase in costs of production inputs, external risks such as weaker global growth, erratic weather conditions and the uncertainty surrounding the upcoming August 2022 elections.
Rates in the Fixed Income market have remained stable due to the relatively ample liquidity in the money market. The government is 1.9% ahead of its prorated borrowing target of Kshs 572.6 bn having borrowed Kshs 583.3 bn of the Kshs 661.6 bn borrowing target for the FY’2021/2022. We expect a gradual economic recovery as evidenced by the revenue collections of Kshs 1.2 tn during the first eight months of the current fiscal year, which was equivalent to 100.8% of the prorated revenue collection target. However, despite the projected high budget deficit of 8.1% and the affirmation of the `B+’ rating with negative outlook by Fitch Ratings, we believe that the support from the IMF and World Bank will mean that the interest rate environment will remain stable since the government is not desperate for cash. Owing to this, our view is that investors should be biased towards short-term fixed-income securities to reduce duration risk.
Markets Performance
During the week, the equities market was on a downward trajectory, with NASI, NSE 20 and NSE 25 declining by 3.6%, 2.5% and 3.0%, respectively, taking their YTD performance to losses of 13.4%, 8.3% and 12.7% for NASI, NSE 20 and NSE 25, respectively. The equities market performance was driven by losses recorded by large cap stocks such as Safaricom, NCBA, BAT, EABL and KCB of 5.0%, 4.0%, 3.7%, 3.5% and 3.2%, respectively. The losses were however mitigated by gains recorded by other stocks such as Jubilee holdings and Stanbic Holdings of 0.4% and 0.2% respectively.
During the week, equities turnover increased by 43.5% to USD 12.0 mn, from USD 8.4 mn recorded the previous week, taking the YTD turnover to USD 306.6 mn. Foreign investors remained net sellers, with a net selling position of USD 4.7 mn, from a net selling position of USD 0.2 mn recorded the previous week, taking the YTD net selling position to USD 33.8 mn.
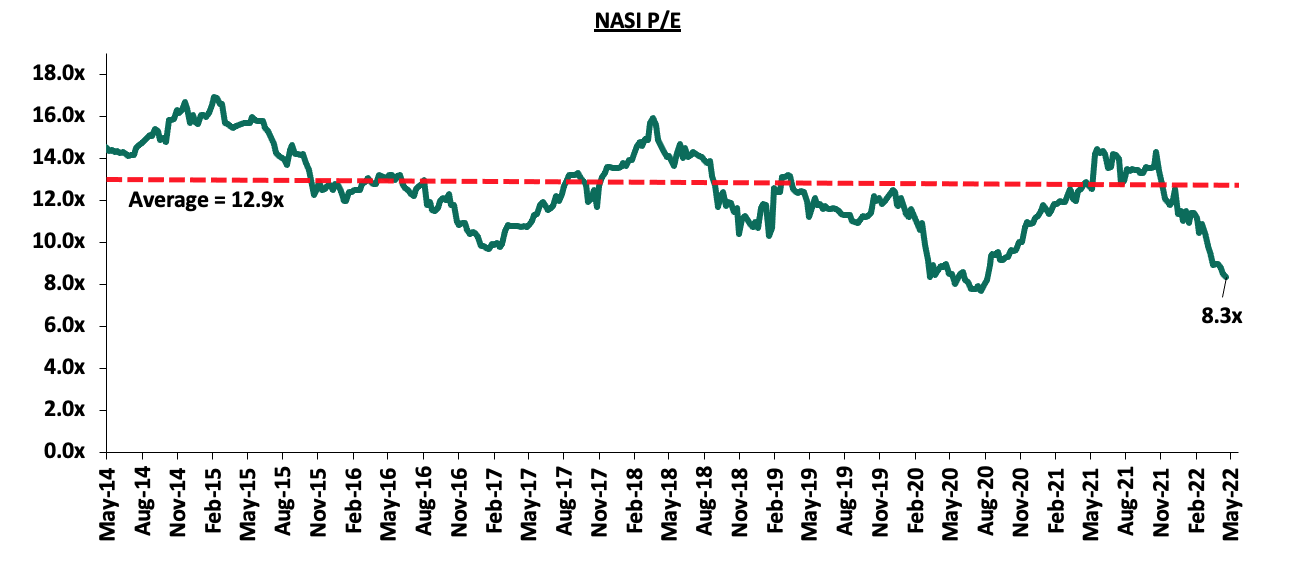
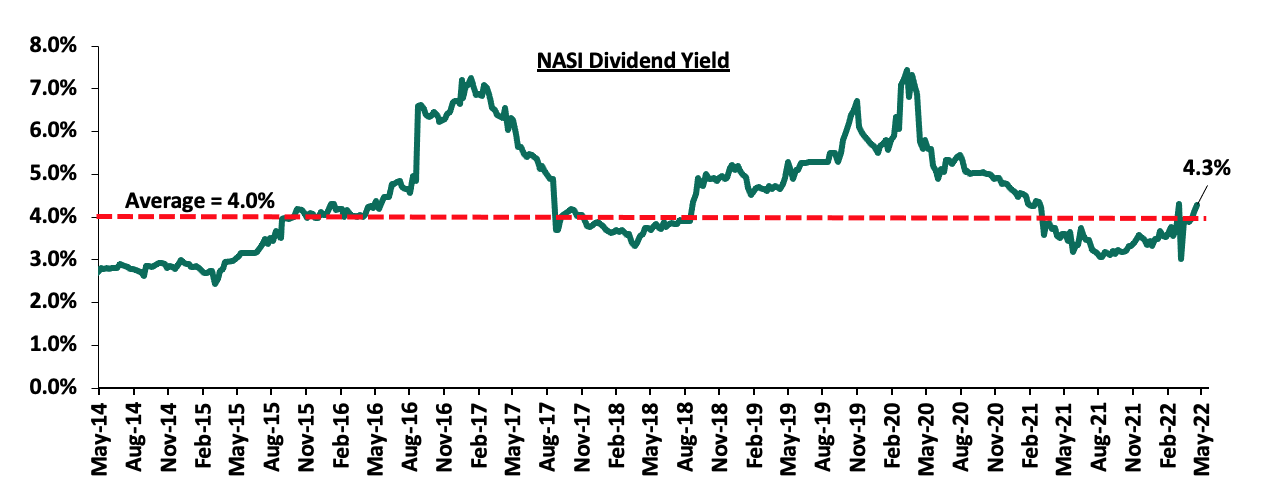
The market is currently trading at a price to earnings ratio (P/E) of 8.3x, 35.1% below the historical average of 12.9x, and a dividend yield of 4.3%, 0.3% points above the historical average of 4.0%. Key to note, NASI’s PEG ratio currently stands at 1.1x, an indication that the market is trading at a premium to its future earnings growth. A PEG ratio greater than 1.0x indicates the market may be overvalued while a PEG ratio less than 1.0x indicates that the market is undervalued. The current P/E valuation of 8.3x is 8.3% above the most recent trough valuation of 7.7x experienced in the first week of August 2020. The charts below indicate the historical P/E and dividend yields of the market:
Weekly highlights:
- Draft Capital Markets Public Offers Listing and Disclosures Regulations 2022
During the week, the Capital Markets Authority (CMA) announced that it had made public the Draft Capital Markets Public Offers Listing and Disclosures Regulations 2022, which are meant to replace the Public Offers Listing and Disclosures Regulations 2002, which have been in place since 2002, with the only amendments done in 2016. The main aim of the Draft Regulations is to provide a more enabling environment in Kenya’s Capital Markets in order to spur more listings in the Nairobi Securities Exchange. Key to note, the bourse has had an Initial Public Offering drought since 2015, when Stanlib Kenya Investments issued shares in Kenya’s first and only listed Real Estate Investment Trust (Fahari I-REIT). Since then, the bourse has had only one more listing by introduction, done by Homeboyz Entertainment in 2020. The draft regulations are now subject to public review with members of the public required to submit their comments on the draft regulations by 3rd June 2022.
Below are some of the key take-outs from the draft regulations;
- Introduction of Small and Medium Enterprises (SME) segments – In order to spur market and capital raising activities by SMEs, the draft regulations provide for an SME Fixed Income Securities Market Segment (SME FISMS) and SME Market Segment (SMEMS). SME FISMS will provide for listing debt securities with an initial offer size below Kshs 250.0 mn or an amount that can be set by the regulator, while the SMEMS will be a market segment for listing non-debt securities issued by SMEs,
- Special Purpose Acquisition Company (SPAC) regulations – Under the draft regulations, a SPAC is defined as a company with no prior operating history, no operating and revenue-generating business or asset at the point of the initial public offer, and which raises proceeds for the sole purpose of undertaking a business combination in accordance with the business strategy and acquisition mandate disclosed in the information memorandum issued in relation to the SPAC’s initial public offer. An issuer applying for listing of its equity securities on the Main Investment Market Segment (MIMS) as an SPAC is required to;
-
- Have a market capitalisation of not less than Kshs 1.0 bn based on the issue price and post-invitation issued share capital,
- Have at least 25.0% of its total number of issued shares post issue must be held by at least 100 shareholders,
- Be incorporated in Kenya, and,
- Have its founding shareholders and management team, must in aggregate, subscribe for and hold at least 20% of the total post-invitation issued share capital,
- Green shoe option – The draft regulations have introduced new provisions for capital raising such as the Green shoe option or over-allotment option, in relation to an offer, the right reserved by an issuer to allot up to a specified number of securities in excess of the number of the relevant securities declared as the securities on offer and available under the offer. An issuer making a public offer of securities may provide a green shoe option for purposes of benefitting from the demand for the securities of the issuer (in the event of an oversubscription) or for purposes of stabilizing the post listing price of its securities, subject to disclosure of the securities to be offered in the green shoe option which shall not exceed 30% of the specified offer amount and the use of the proceeds of the green shoe option in the Information memorandum,
- Shelf prospectus - Additionally, the draft regulations provide for shelf prospectuses whereby subscription of securities or class of securities which are to be offered in one or more tranches over a specified period of time, not exceeding two years from the date of opening of the first offer of securities. Further, the shelf prospectus shall comply with the disclosure requirements for public offers of securities and not more than four issuances of securities shall be made through a single shelf prospectus,
- Registration status of the listing company – The draft regulations provide that the issuer shall be a body corporate duly incorporated and/or registered under the Laws of Kenya and in existence for at least five years as is in the current regulations. In the SMEMS segment, the issuer is required to have been in existence for at least two years,
- Minimum share capital – The draft regulations propose minimum issued and fully paid up ordinary share capital for listing in the main investment market segment to remain at Kshs 50.0 mn, while the minimum issued and fully paid up ordinary share capital in the SMEMS is to be capped at Kshs 10.0 mn,
- Total assets – In the main investment market segment, total assets immediately before the public offering or listing of shares is proposed at Kshs 1.0 bn unless exempted by the authority, while total assets in the SMEMS should not be less than Kshs 100.0 mn unless exempted by the Authority. This takes a departure from the current regulations that provide for net assets rather than total assets. Currently, net assets in the main investment market should not be less than Kshs 100.0 mn. Key to note, net assets are total assets minus liabilities,
- Track record, profitability and future prospects – The draft regulations provide for the issuer to have been in existence for a minimum of five years, with at least one year reflecting a profit with good growth potential and a revenue earning record. In the current regulations, the issuer must have declared profits in at least three of the last five completed accounting periods. In the SMEMS, the draft regulations provide for the issuer to only have a credible and auditable business plans with verifiable growth potential,
- Share ownership structure – In the main investment market segment, the draft regulations require at least 15.0% of the securities excluding those held by a controlling shareholder or people associated with him or the Company's Senior Managers, must be available for trade by the public at the time of listing. In comparison, the current regulations that provide that, at least 25.0% of the shares must be held by not less than one thousand shareholders excluding employees of the issuer, and,
- Private offers – The proposed regulations define private offers as securities offered to not more than one hundred persons who are specifically identified, it is noteworthy that in the current regulations has one hundred persons as just one of the 9 criteria where meeting any one of the 9 qualifies one to be a private offer. There is also a new requirement that the offer shall not remain open for a continuous period of more than 12 months and such offer is not repeated with wholly or partially different persons by the same entities within a period of 24 months from the date of the first offer. Further the draft regulations bar any public advertisement or utilization of any media, marketing nor distribution channels or agents to inform the public or capable of informing the media of such an offer, which is just an explicit clarification since private offers could not be advertised before. The issuer of a private offer is also required to keep a complete record of all individuals the Private offer has been offered to and produced to the Authority when demanded. The current threshold of subscription for securities per applicant of Kshs 100,000.00 has been scrubbed under the draft regulations.
In our view, the eased restrictions for public listing are a step in the right direction in opening up the Capital markets space to more participants. Should the draft regulations be passed, we expect more corporates to take advantage and seek capital markets funding through IPOs. This will further help to increase the percentage of funding for business by the Capital Markets from the current less than 1.0%, as we aim to emulate developed economies at 60.0% as recommended by the World Bank. However, CMA should provide actionable metrics for assessing track record, profitability and future prospects of would be issuers in order to ensure that investor interests are protected and that they do not invest in book perfect but ailing companies.
Additionally, some of the proposed regulations are also counterproductive such as the regulations on private offers which seem to further constrain the private offers space, yet private offers are essential to funding businesses. An example of constrain is the requirement that a private offer cannot be replicated in the same manner for a period of 24 months, no matter the success of the previous issue. Further a private offer in the draft regulations cannot be in place for more than 12 months, effectively limiting private offers to short term investments. Finally, current regulations require that meeting any one of the 9 conditions qualify as a private offer, but the proposed regulations limit them to 100 persons. This will limit sources of funding, and, amount of capital that businesses have access to in Kenya.
- Sanlam Limited(South Africa) announces the formation of a Joint Venture Company with Allianz SE
During the week, Sanlam Limited, a South African financial services group listed on the Johannesburg Stock Exchange, announced that it had entered into a definitive Joint Venture agreement for a term of 10 years with Allianz SE, a global integrated financial services firm listed on the Frankfurt Stock Exchange with the aim to leverage on the two entities footprints in Africa and create a leading Pan-African financial services group, with an estimated equity value of Kshs 243.7 bn. Key to note, Sanlam Limited, indirectly owns 100.0% in Hubris Holdings Limited, which is the majority shareholder in Sanlam Kenya Plc, a listed insurance and financial services entity on the Nairobi Stock Exchange. The initial shareholding split of the Joint Venture will be 60:40, Sanlam Limited to Allianz respectively, with the effective date of the proposed transaction being within 12-15 months of the announcement, subject to relevant approvals.
The Joint Venture Company will operate in 29 countries and adds to Allianz’s recent forays into the African Insurance and financial services sector, following the acquisition of 66.0% in Jubilee General Insurance, a subsidiary of Jubilee Holdings Limited. The Joint Venture is expected to increase life and general insurance penetration, accelerate product innovation and drive financial inclusion in high growth African markets by leveraging on the two leading insurance and financial services companies resources and expertise.
With Allianz shareholding of the Joint Venture at 40.0%, Sanlam Kenya Plc’s shareholding structure is expected to remain unchanged, as Hubris Holdings Limited will remain the majority shareholder at 57.1%. However, given the length of the Agreement we expect that the Joint Venture will provide for Sanlam Kenya Plc, Allianz General Insurance Kenya and Jubilee General Insurance (which Allianz owns the majority stake in – 66.0%), to combine operations to grow their market share, asset base and bottom lines. According to the Insurance Regulatory Authority’s Q4’2021 industry release, were the entities to combine operations, they would amass a total asset base of Kshs 37.6 bn as of Q4’2021. The table below gives a breakdown of the contribution of the entities to the asset base and key ratios as at Q4’2021;
|
Insurance Firm – Q4’2021 |
Assets (Kshs bn) |
Liabilities (Kshs bn) |
Profit after tax (Kshs bn) |
Claims Ratios |
|
Sanlam Life |
28.8 |
26.1 |
0.4 |
92.8% |
|
Sanlam General |
3.6 |
3.2 |
(0.8) |
80.3% |
|
Allianz General |
1.7 |
1.1 |
(0.1) |
63.6% |
|
Jubilee General |
3.5* |
2.5* |
(0.1) |
101.6% |
|
Total |
37.6 |
32.9 |
(0.6) |
|
|
*Adjusted for 66.0% that the JV would hold |
||||
Source: Insurance Regulatory Authority Q4’2021 Industry release
In our view, we expect to see sustained consolidation activities in the Kenyan insurance sector as the existing companies come consolidate to improve efficiency and meet regulatory requirements such the minimum capital requirements. We expect the increased reach of the JV in Kenya to drive products and operations innovation which would help in improving Kenya’s insurance penetration which stood at a paltry 2.2%, as calculated from the recently released Economic Survey 2022. The consolidation of operations of the 4 insurance sector players following the JV arrangement would come at a time when core insurance business has continued to be unprofitable mainly attributable to the high and increasing claims ratios. For the general insurance business, the industry claims ratios increased to 68.8% in Q4’2021, from 63.6% in Q4’2020 whereas for long term insurance, the claims ratios improved slightly to 65.4% in Q4’2021 from 66.4% in Q4’2020. This has created the need for consolidation of the small market players and capital raising in order to remain in business.
- Earnings release – NCBA Group
During the week, NCBA Group released its Q1’2022 financial results. Below is a summary of the group’s performance;
|
Balance Sheet (bns) |
Q1’2021 |
Q1’2022 |
y/y change |
|
Net Loans and Advances |
243.1 |
243.9 |
0.3% |
|
Government Securities |
158.7 |
194.7 |
22.6% |
|
Total Assets |
542.1 |
587.4 |
8.4% |
|
Customer Deposits |
434.2 |
465.5 |
7.2% |
|
Total Liabilities |
467.5 |
507.1 |
8.5% |
|
Shareholders’ Funds |
74.4 |
80.2 |
7.8% |
|
Income statement |
|||
|
Income Statement items |
Q1’2021 |
Q1’2022 |
y/y change |
|
Net Interest Income |
6.6 |
7.1 |
7.6% |
|
Net non-Interest Income |
5.2 |
6.1 |
15.5% |
|
Total Operating income |
11.8 |
13.1 |
11.1% |
|
Loan Loss provision |
2.6 |
2.5 |
(4.3%) |
|
Total Operating expenses |
7.8 |
8.1 |
4.5% |
|
Profit before tax |
3.9 |
4.8 |
25.3% |
|
Profit after tax |
2.8 |
3.4 |
20.3% |
|
Core EPS |
1.7 |
2.1 |
20.3% |
|
Key Ratios |
|||
|
Ratios |
Q1’2021 |
Q1’2022 |
y/y % points change |
|
Yield from interest-earning assets |
2.5% |
2.6% |
0.1% |
|
Cost of funding |
1.0% |
1.1% |
0.1% |
|
Net Interest Spread |
1.5% |
1.5% |
0.0% |
|
Net Interest Margin |
6.0% |
5.8% |
(0.2%) |
|
Cost of Risk |
22.3% |
19.2% |
(3.1%) |
|
Net Interest Income as % of operating income |
55.7% |
53.9% |
(1.8%) |
|
Non-Funded Income as a % of operating income |
44.3% |
46.1% |
1.8% |
|
Cost to Income Ratio |
65.6% |
61.7% |
(3.9%) |
|
Cost to Income Ratio without LLP |
43.3% |
42.5% |
(0.8%) |
|
Capital Adequacy Ratios |
|||
|
Capital Adequacy Ratios |
Q1'2021 |
Q1'2022 |
% points change |
|
Core Capital/Total Liabilities |
15.6% |
15.4% |
(0.2%) |
|
Minimum Statutory ratio |
8.0% |
8.0% |
0.0% |
|
Excess |
7.6% |
7.4% |
(0.2%) |
|
Core Capital/Total Risk Weighted Assets |
18.2% |
17.8% |
(0.4%) |
|
Minimum Statutory ratio |
10.5% |
10.5% |
0.0% |
|
Excess |
7.7% |
7.3% |
(0.4%) |
|
Total Capital/Total Risk Weighted Assets |
18.3% |
17.9% |
(0.5%) |
|
Minimum Statutory ratio |
14.5% |
14.5% |
0.0% |
|
Excess |
3.8% |
3.4% |
(0.5%) |
Key take-outs from the earnings release include;
- Profit after tax increased by 20.3% to Kshs 3.4 bn from Kshs 2.8 bn in Q1’2021, driven by the 11.1% growth in total operating income to Kshs 13.1 bn, from Kshs 11.8 bn in Q1’2021. However, the performance was weighed down by the 4.5% increase in total operating expenses to Kshs 8.1 bn, from 7.8 bn in Q1’2021,
- Interest income rose by 10.4% to Kshs 12.2 bn, from Kshs 11.0 bn in Q1’2021 mainly driven by a 31.6% growth in interest income from government securities to Kshs 5.8 bn, from Kshs 4.4 bn in Q1’2021. However, the growth was weighed down by a 3.6% decline in interest income from loans and advances to Kshs 6.3 bn, from Kshs 6.5 bn in Q1’2021 coupled with a 14.2% increase in interest income from deposits and placements with banking institutions to Kshs 58.8 mn, from Kshs 51.5 mn in Q1’2021,
- Yield on interest-earning assets increased by 0.1% points to 2.6% in Q1’2022, from 2.5% in Q1’2021, attributable to the faster 6.0% increase in average interest-earning assets to Kshs 470.8 bn, from Kshs 444.0 bn in Q1’2021, which outpaced by the 5.8% increase in trailing interest income,
- NCBA Group’s Interest expense increased by 14.9% to Kshs 5.1 bn, from Kshs 4.4 bn in Q1’2021, mainly attributable to an 11.9% increase in interest expense on customer deposits to Kshs 4.8 bn, from Kshs 4.3 bn in Q1’2021. Cost of funds increased by 0.1% points to 1.1% in Q1’2022 from 1.0% in Q1’2021 owing to the 8.9% increase in trailing interest expense that outpaced the 4.5% growth in average interest bearing liabilities, an indication that the bank was unable to mobilize cheaper deposits,
- Net Interest Margin declined by 0.2% points to 5.8% in Q1’2022 from 6.0% recorded in Q1’2021, due to the slower 3.6% growth in trailing Net Interest Income, compared to the 6.0% growth seen in the average interest-earning assets,
- Total operating expenses increased by 4.5% to Kshs 8.1 bn in Q1’2022, from Kshs 7.8 bn in Q1’2021, largely driven by the 10.1% increase in staff costs to Kshs 2.2 bn, from Kshs 2.0 bn recorded in Q1’2021 and an 8.4% increase in other expenses to Kshs 3.4 bn from Kshs 3.2 bn. However, the increase in interest expenses was mitigated by a 4.3% decline in loan loss provision to Kshs 2.5 bn in Q1’2022, from Kshs 2.6 bn in Q1’2021,
- The balance sheet recorded an expansion with total assets growing by 8.4% to Kshs 587.4 bn in Q1’2022, from Kshs 542.1 bn in Q1’2021. This growth was largely driven by a 0.3% increase in net loans and advances to Kshs 243.9 bn, from Kshs 243.1 bn in Q1’2021 coupled with a 22.6% increase in government securities to Kshs 194.7 bn, from the Kshs 158.7 bn recorded in Q1’2021. Key to note the loan book shrunk marginally by 0.1% from Kshs 244.0 bn in Dec 2021. The subdued growth in the loan book is partly attributable to the bank’s cautious lending owing to the relatively high non-performing loans,
- Total liabilities rose by 8.5% to Kshs 507.1 bn in Q1’2022, from Kshs 467.5 bn in Q1’2021, driven by a 7.2% growth in customer deposits to Kshs 465.5 bn in Q1’2022, from Kshs 434.2 bn in Q1’2021, coupled with a 76.9% increase in Placements to the Kshs 9.3 bn recorded in Q1’2022, from Kshs 5.2 bn in Q1’2021. Deposits per branch declined by 8.2% to Kshs 4.5 bn, from Kshs 4.9 bn in Q1’2022, with the number of branches increasing by 15 to 104 branches in Q1’2021 from 89 branches in Q1’2021. In its continued branch expansion strategy, the group plans to open 12 more branches in Kenya,
- Gross non-performing loans (NPLs) rose by 14.1% to Kshs 45.1 bn in Q1’2022, from Kshs 39.6 bn in Q1’2021 taking the NPL ratio to 16.3% in Q1’2022, from 14.7% in Q1’2021. The deterioration in the group’s asset quality is mainly attributable to the faster 14.1% increase in NPLs that outpaced the 2.9% increase in gross loans,
- General loan loss provisions increased by 29.6% to Kshs 24.2 bn, from Kshs 18.7 bn in Q1’2021, higher than the 2.9% growth in gross NPLs, taking the NPL coverage to 72.6% in Q1’2022, from 65.0% in Q1’2021,
- NCBA Group is currently sufficiently capitalized with a core capital to risk weighted assets ratio of 17.8%, 7.3% points above the statutory requirement. In addition, the total capital to risk weighted assets ratio was 17.9%, exceeding the statutory requirement by 3.4% points. Adjusting for IFRS 9, the core capital to risk weighted assets and the total capital to risk weighted assets both came in at 18.6%,
For a comprehensive analysis, please see our NCBA Group Q1’2022 Earnings Note
Cytonn coverage:
|
Company |
Price as at 28/04/2022 |
Price as at 06/05/2022 |
w/w change |
YTD Change |
Year Open 2022 |
Target Price* |
Dividend Yield |
Upside/ Downside** |
P/TBv Multiple |
Recommendation |
|
Kenya Reinsurance |
2.2 |
2.2 |
1.4% |
(4.8%) |
2.3 |
3.2 |
4.6% |
50.4% |
0.2x |
Buy |
|
Jubilee Holdings |
264.0 |
265.0 |
0.4% |
(16.3%) |
316.8 |
381.7 |
5.3% |
49.3% |
0.5x |
Buy |
|
I&M Group*** |
18.2 |
18.0 |
(1.1%) |
(15.9%) |
21.4 |
25.4 |
8.3% |
49.3% |
0.5x |
Buy |
|
KCB Group*** |
37.5 |
36.3 |
(3.2%) |
(20.4%) |
45.6 |
50.5 |
8.3% |
47.6% |
0.7x |
Buy |
|
ABSA Bank*** |
10.0 |
9.9 |
(0.4%) |
(15.4%) |
11.8 |
13.4 |
11.1% |
46.1% |
1.0x |
Buy |
|
Liberty Holdings |
5.6 |
5.8 |
3.2% |
(17.8%) |
7.1 |
7.7 |
0.0% |
32.0% |
0.4x |
Buy |
|
Standard Chartered*** |
128.5 |
124.8 |
(2.9%) |
(4.0%) |
130.0 |
147.1 |
11.2% |
29.1% |
1.0x |
Buy |
|
Co-op Bank*** |
12.7 |
12.4 |
(2.8%) |
(5.0%) |
13.0 |
14.6 |
8.1% |
26.2% |
0.9x |
Buy |
|
Equity Group*** |
47.9 |
47.2 |
(1.6%) |
(10.6%) |
52.8 |
56.2 |
6.4% |
25.5% |
1.2x |
Buy |
|
NCBA*** |
26.0 |
25.0 |
(4.0%) |
(2.0%) |
25.5 |
28.2 |
12.0% |
25.0% |
0.6x |
Buy |
|
Diamond Trust Bank*** |
55.0 |
55.0 |
0.0% |
(7.6%) |
59.5 |
65.6 |
5.5% |
24.7% |
0.2x |
Buy |
|
Britam |
6.8 |
6.7 |
(0.9%) |
(11.4%) |
7.6 |
7.9 |
0.0% |
17.5% |
1.1x |
Accumulate |
|
Stanbic Holdings |
105.3 |
105.5 |
0.2% |
21.3% |
87.0 |
107.2 |
8.5% |
10.1% |
0.9x |
Accumulate |
|
Sanlam |
10.2 |
12.9 |
27.1% |
11.7% |
11.6 |
12.1 |
0.0% |
(6.5%) |
1.4x |
Sell |
|
CIC Group |
2.1 |
2.2 |
3.8% |
0.5% |
2.2 |
1.9 |
0.0% |
(13.6%) |
0.8x |
Sell |
|
HF Group |
3.0 |
3.0 |
1.0% |
(20.3%) |
3.8 |
2.5 |
0.0% |
(18.5%) |
0.2x |
Sell |
|
*Target Price as per Cytonn Analyst estimates **Upside/ (Downside) is adjusted for Dividend Yield ***For Disclosure, these are stocks in which Cytonn and/or its affiliates are invested in |
||||||||||
We are “Neutral” on the Equities markets in the short term. With the market currently trading at a premium to its future growth (PEG Ratio at 1.1x), we believe that investors should reposition towards value stocks with strong earnings growth and that are trading at discounts to their intrinsic value. We expect the discovery of new COVID-19 variants, the upcoming Kenyan general elections and the slow vaccine rollout to continue weighing down the economic outlook. On the upside, we believe that the relaxation of COVID-19 containment measures in the country will lead to improved investor sentiments.
- Industry Reports
During the week, the Kenya National Bureau of Statistics (KNBS) released the Economic Survey 2022, a report that analyses the performance of key sectors of the Kenyan economy. The key take-outs for the Real Estate sector from the report include;
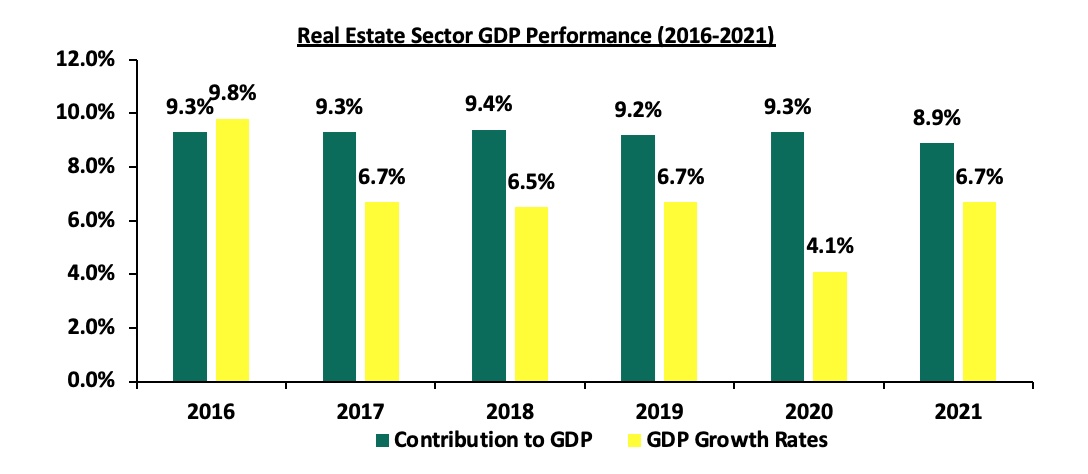
- The Real Estate Sector contribution to GDP came in at 8.9% in 2021, representing a 0.4% points decline from 9.3% recorded in 2020, attributed to the recovery of the sector following a tough economic environment caused by the pandemic. Real Estate sector GDP growth came in at 6.7% in 2021, a 2.6% point’s increase from 4.1% in 2020. This was attributed to resumption of economic activities that boosted Real Estate transactions. The graph below shows performance of Real Estate sector GDP from 2016 to 2021;
Source: Kenya National Bureau of Statistics
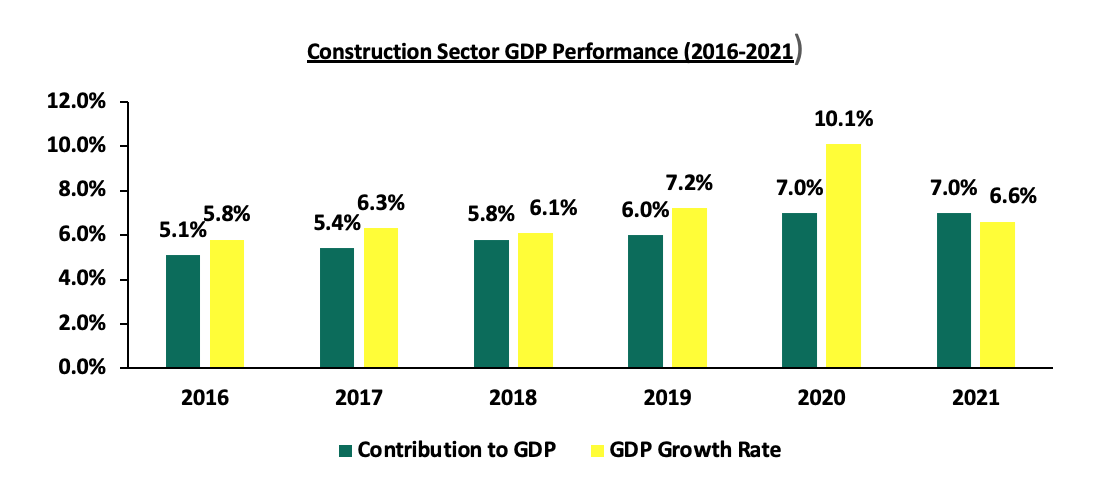
- The Construction sector’s contribution to GDP came in at 7.9% in 2021, representing a 0.2% points decline from 8.1% recorded in 2020. Additionally, the sectors GDP growth came in at 6.6% in 2021, a 3.5% points decline from 10.1% recorded in 2020. The growth was supported by increase in cement consumption which rose from 7.4 mn tonnes in 2020 to 9.1 mn tonnes in 2021 following focus on infrastructure activities, key among them being; construction of the Nairobi expressway and rehabilitation of Longonot-Malaba railway line. The graph below shows performance of the Construction sector GDP from 2016 to 2021;
Source: Kenya National Bureau of Statistics
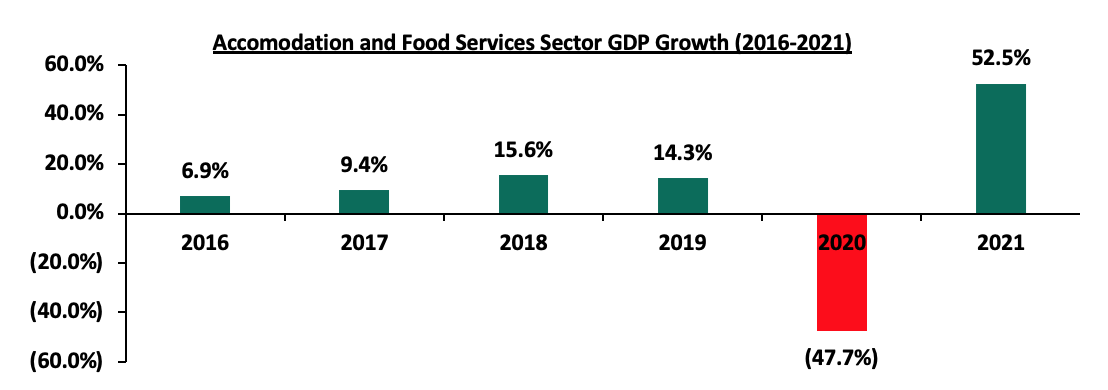
- Accommodation and Food Services Sector GDP grew by 52.5% in 2021, a 100.2% points increase from 47.7% decline in growth realized in 2020. This was attributed to the significant improvement in the hospitality sector performance 2021 despite the COVID-19 pandemic due to;
- The Construction sector’s contribution to GDP came in at 7.9% in 2021, representing a 0.2% points decline from 8.1% recorded in 2020. Additionally, the sectors GDP growth came in at 6.6% in 2021, a 3.5% points decline from 10.1% recorded in 2020. The growth was supported by increase in cement consumption which rose from 7.4 mn tonnes in 2020 to 9.1 mn tonnes in 2021 following focus on infrastructure activities, key among them being; construction of the Nairobi expressway and rehabilitation of Longonot-Malaba railway line. The graph below shows performance of the Construction sector GDP from 2016 to 2021;
-
-
-
- An increase in the number of international visitor arrivals to 692,938 in 2021, representing a 57.7% increase from 439, 447 in 2020,
- The relaxation of travel restrictions and the increased COVID-19 vaccination rates,
- An increase in the number of international conferences held increased to 292 in 2021 from 28 in 2020 while local conferences increased to 8,117 in 2021 from 1,176 in 2020,
- Improved number of hotel in operations which came in at 100.0% as at December 2021 from 97.0% at the start of the year in January 2021, and,
- Improved hotel bed occupancies which came in at 54.0% in December 2021 compared to 21.0% occupancy in January 2021 according to the Central Bank of Kenya. The graph below shows GDP growth rates in Accommodation and Food Services sector from 2016 to 2021;
-
-
Source: Kenya National Bureau of Statistics
The Real Estate sector in general is expected to continue recording improvements supported by the increase in activities across different themes. Focus on development projects such as affordable housing and infrastructure is expected to enhance performance of the construction sector. We also expect the path to recovery of the hospitality industry to continue gaining momentum as evidenced by the growth in the supporting sectors such as Accommodation and Restaurant services. However, travel bans from key tourism markets is expected to have negative effect on improving number of international arrivals.
- Retail Sector
During the week Naivas Supermarket, a local retail chain, announced plans to open a new outlet to be located at Safari Center in Naivasha by 13th May 2022. This will mark the fifth outlet to be opened by the retailer in 2022 and it plans to open another store in Meru town. Currently, Naivas operates 83 outlets, having opened 4 outlets so far this year, with the latest being at Kiambu Mall, along Kiambu Road. The decision to open the outlet in Naivasha is supported by;
- The need to step up competition and garner market domination against retailers such as QuickMart that has opened 3 outlets this year,
- Presence of a growing middle class population in the area that serves as a market for its products,
- Positive demographics with Naivasha having a population of 355,383 in 2019 according to the Kenya National Bureau of Statistics 2019 Census Report, hence presenting a good market for goods and services, and,
- Improved infrastructure such as Rironi-Nakuru-Mau Summit road which is under expansion and will facilitate accessibility and enhance supply chains.
In terms of performance, according our Kenya Retail Report 2021, Nakuru county, where Naivasha is categorized, recorded an average rental yield of 6.1%, 0.7% lower than the market average of 6.8% in 2021 with an average rent per SQFT of Kshs 59 compared to the market average of Kshs 118. The retailer is therefore leveraging on the affordability of retail space in the area which justifies its location choice. The table below shows the retail performance of the key urban areas in Kenya;
|
Summary of Retail Performance in Key Urban Areas in Kenya 2021 |
|||
|
Region |
Rent /SQFT(Kshs) 2021 |
Occupancy Rate 2021 |
Rental yield 2021 |
|
Mount Kenya |
128 |
81.7% |
7.9% |
|
Nairobi |
168 |
75.8% |
7.5% |
|
Mombasa |
119 |
77.6% |
6.8% |
|
Kisumu |
101 |
74.6% |
6.4% |
|
Eldoret |
131 |
80.8% |
6.3% |
|
Nakuru |
59 |
80.0% |
6.1% |
|
Average |
118 |
78.4% |
6.8% |
Source: Cytonn Research 2020
The table below shows a summary of the number of stores of the key local and international retailer supermarket chains in Kenya;
|
Main Local and International Retail Supermarket Chains |
||||||||||
|
Name of retailer |
Category |
Highest number of branches that have existed as at FY’ 2018 |
Highest number of branches that have existed as at FY’ 2019 |
Highest number of branches that have existed as at FY’ 2020 |
Highest number of branches that have existed as at FY’ 2021 |
Number of branches opened in 2022 |
Closed branches |
Current number of branches |
Number of branches expected to be opened |
Projected number of branches FY’2022 |
|
Naivas |
Local |
46 |
61 |
69 |
79 |
4 |
0 |
83 |
2 |
85 |
|
QuickMart |
Local |
10 |
29 |
37 |
48 |
3 |
0 |
51 |
0 |
51 |
|
Carrefour |
International |
6 |
7 |
9 |
16 |
0 |
0 |
16 |
0 |
16 |
|
Chandarana |
Local |
14 |
19 |
20 |
23 |
1 |
1 |
24 |
4 |
28 |
|
Cleanshelf |
Local |
9 |
10 |
11 |
12 |
0 |
0 |
12 |
0 |
12 |
|
Tuskys |
Local |
53 |
64 |
64 |
3 |
0 |
61 |
3 |
0 |
3 |
|
Game Stores |
International |
2 |
2 |
3 |
3 |
0 |
0 |
3 |
0 |
3 |
|
Uchumi |
Local |
37 |
37 |
37 |
2 |
0 |
35 |
2 |
0 |
2 |
|
Choppies |
International |
13 |
15 |
15 |
0 |
0 |
13 |
0 |
0 |
0 |
|
Shoprite |
International |
2 |
4 |
4 |
0 |
0 |
4 |
0 |
0 |
0 |
|
Nakumatt |
Local |
65 |
65 |
65 |
0 |
0 |
65 |
0 |
0 |
0 |
|
Total |
|
257 |
313 |
334 |
186 |
7 |
179 |
194 |
6 |
200 |
Source: Cytonn Research
We expect the retail sector to record improvement in performance attributed to; i) the rapid expansion drive by local and international retailers, ii) positive demographics evidenced by Kenya’s relatively high urbanization and population growth rates of 4.0% p.a and 2.3% p.a, respectively, against the global average of 1.8% p.a and 1.0% p.a, respectively, as at 2020, according to World Bank, and, iii) infrastructural developments opening areas for investments and accessibility. However, factors such as e-commerce driving down the need for retail spaces, and, oversupply of retail space currently at 1.7 mn SQFT in Kenya and 3.0 mn SQFT in NMA, continues to weigh down the overall performance of the sector.
- Infrastructure
During the week, the Principal Secretary for the Ministry of Transport, Infrastructure, Housing & Urban Development, Mr. Paul Maringa, announced that the government plans to launch the 27.1-km Nairobi Expressway by the end of May. The Kshs 88.0 bn road project kicked off in June 2020 as a Public Private Partnership project between the national government through the Kenya National Highways Authority (KENHA) and the China Road and Bridge Construction Corporation (CRBC) on a Build-Operate-Transfer (BOT) model, and is now complete. Nairobi Expressway will be Kenya’s first road to be tolled under a Public-Private Partnership and will comprise of 11 interchanges. The charges will be between Kshs 120 and Kshs 1,800 depending on the size of the vehicle and the distance covered. The highway will:
- Open up surrounding areas for investment opportunities,
- Boost property prices in the surrounding environs, and,
- Improve transport services and trade activities.
Other projects expected to be launched by August 2022 include; i) the 17.0 km Nairobi Western Bypass which is 99.0% complete, ii) the Athi River-Mlolongo-Mombasa exit, and, iii) the Kshs 6.5 bn Mombasa-Kwa Jomvu Road, which starts at the junction of Kenyatta Avenue and Digo Road in Mombasa CBD and runs to Makupa area connecting the Makupa Causeway into Changamwe.
With other major infrastructure projects such as the Standard Gauge Railway, LAPPSET project and Nairobi Commuter Rail Project among others still ongoing, we expect improved activities to be registered in the sector attributed to the Government’s aggressiveness to implement and conclude projects despite the effects of the pandemic. Additionally, the government plans to increase budgetary allocation to the infrastructure sector by 16.4% to 212.5 bn in FY’2022/23 from Kshs 182.5 bn in FY’2021/2022 according to the proposed FY’2022/23 Budget Estimates, highlighting that infrastructure remains a priority area for the current government. The graph below shows the budget allocation to the transport sector over last five financial years;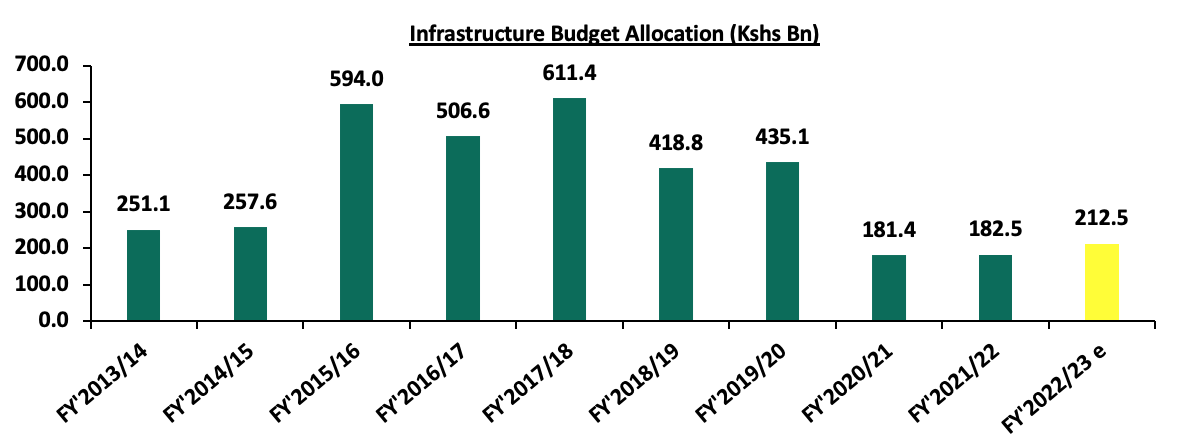
Source: National Treasury of Kenya
- Listed Real Estate
In the Nairobi Stock Exchange, the ILAM Fahari I-REIT closed the week trading at an average price of Kshs 5.8 per share, representing a 3.3% Week-to-Date (WTD) decline from Kshs 6.0 per share. On a Year-to-Date (YTD) and Inception-to-Date (ITD) basis, the REIT’s performance continues to be weighed down having realized a 9.4% and 71.0% decline, respectively, from Kshs 6.4 and Kshs 20.0 per share. The graph below shows Fahari I-REIT’s performance from November 2015 to May 2022: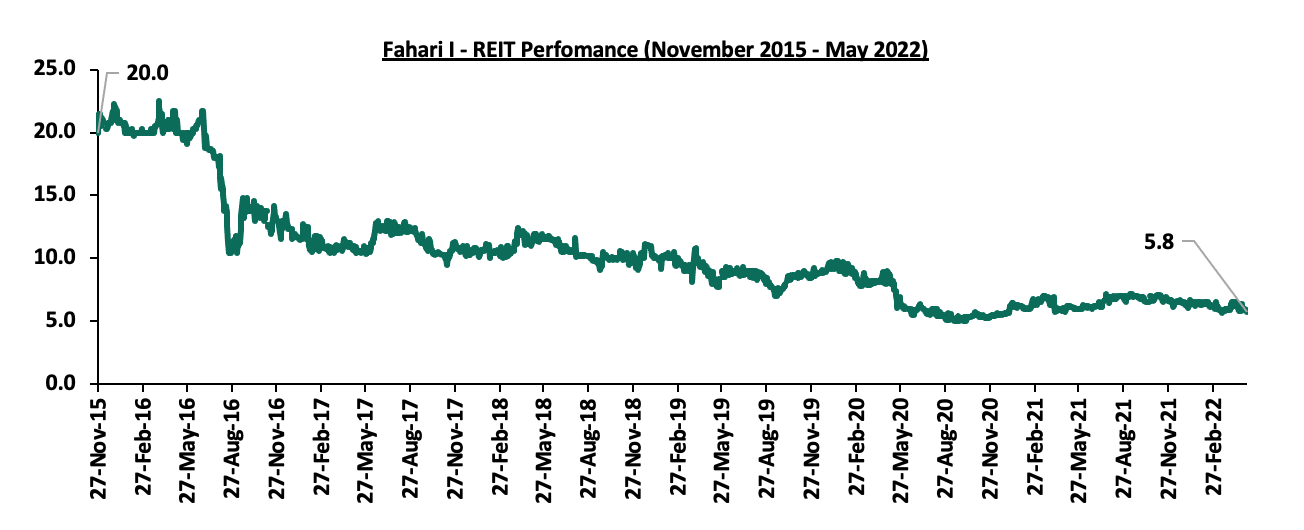
The Real Estate sector in 2022 is expected to be on an upward trajectory evidenced by increased activities in the construction and hospitality sectors and expansion by local and international retailers taking up space left by troubled retailers. However, the low investor appetite for Real Estate Investments Trusts (REITS), continues to be a challenge affecting Real Estate investments.
Focus of the Week : Status of Infrastructure in the Nairobi Metropolitan Area (NMA) - Roads, Water & Sewer Coverage
In December 2021, we released the Nairobi Metropolitan Area (NMA) Infrastructure Report 2021, which highlighted that there were 939.6 Km of ongoing road construction and rehabilitation projects valued at Kshs 162.4 bn. On the other hand, there were 99.7 Km road projects worth Kshs 4.3 bn completed in 2021. Both water and sewer connectivity increased by 1.0% points to 55.8% and 19.0% in 2020 from 54.8% and 18.0% in 2019, respectively in the NMA. Kenya’s electricity coverage also stood at 70.0%, which represents a 0.3% points increase from the 69.7% realized in 2019. These instances among many others signifies government’s efforts to better the country through infrastructure developments.
As a follow up to the aforementioned infrastructure report, we shall focus on highlighting the status of infrastructure in the Nairobi Metropolitan Area (NMA), with a major focus on roads, water and sewer network coverage. This is so because infrastructure continues to be a major priority in government’s economic agenda. Therefore, this topical will cover the following:
- Introduction,
- Infrastructure Trends in Kenya,
- The State of Infrastructure in the Nairobi Metropolitan Area (Roads, Water & Sewer),
- The Importance and Challenges of Infrastructure to the Real Estate Sector, and,
- Conclusion and Recommendation.
Section I: Introduction
Infrastructure refers to basic fundamental structures needed by a nation or entity in order to function properly. They include systems such as water, transport, energy, internet, sewer and drainage networks, among many others. These infrastructure systems are critical to a country’s performance and survival and their inadequacy lead to a stagnating economy. In Kenya, the government has aggressively initiated and implemented various financial strategies in order to support the development of infrastructure, as they are capital intensive. These financial strategies include: Public Private Partnerships (PPPs), issuing of infrastructure bonds, debt financing, and, massive Year on Year (YoY) budgetary allocation, among others.
For the specific infrastructure sectors, road construction projects continue to be the key beneficiary of Government’s expenditure. This is evident in the Kenya Roads Board’s Annual Public Roads Programme 2021/2022, which highlighted that the country’s road network coverage stood at 161,451 Km and valued at over Kshs 3.5 tn as at 2021, signifying heavy investment towards the sector. In the Nairobi Metropolitan Area (NMA), a total of 132.8 Km road networks worth Kshs 93.1 bn have been so far completed, between January 2021 and May 2022, whereas there are a total of 940.5 Km ongoing construction and rehabilitation projects worth Kshs 97.3 bn. (Key to note is that the completed projects are more costly compared to the projects in pipeline which have longer distance, as a result of the Nairobi Expressway project which costed Kshs 88.0 bn yet just 27.1 Km – Kshs 3.2 bn per Km compared to an average of Kshs 91.5 mn spent on the other completed projects).
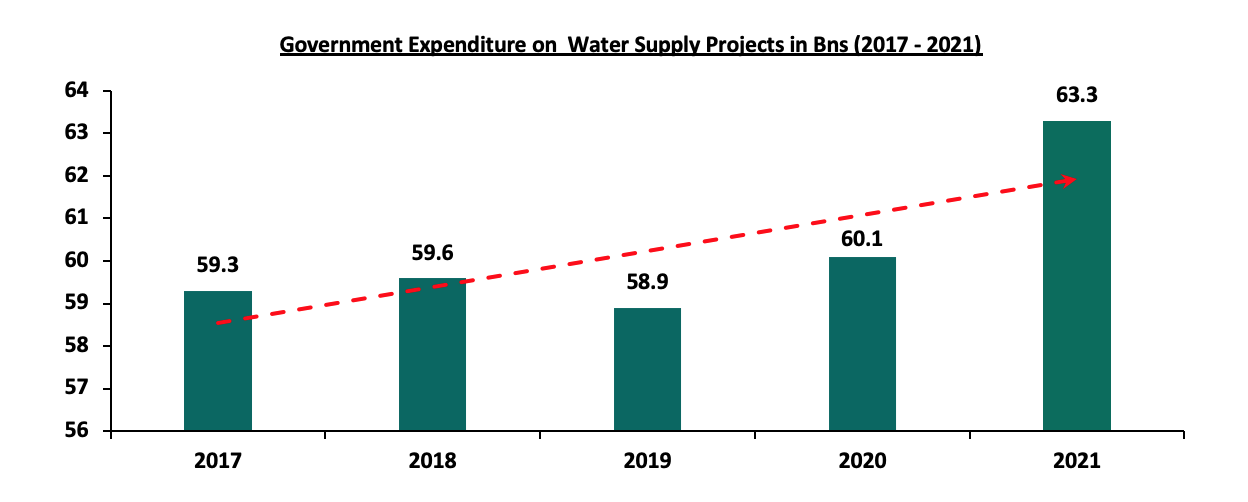
For water systems, the government spent a total of Kshs 63.3 bn towards the development of water supply projects in 2021, according to the Economic Survey 2022 report by the Kenya National Bureau of Statistics (KNBS). This is a 5.5% increase from the Kshs 60.1 bn that was spent in the 2020. In the NMA, water coverage currently stands at 55.8% as at 2020, which is a 1.0% points increase from the 54.8% recorded in 2019. For sewer systems, the current coverage is at 19.0% as at 2020 in the NMA, a 1.0% points increase from the 18.0% that was recorded in 2019, according to the Impact Report Issue No. 13 report by the Water Services Regulator Board (WASREB).
Section II: Infrastructure Trends in Kenya
In this section, we will discuss the various trends that have been shaping the development and performance of the infrastructure sector in Kenya. They include:
- Roll Out of Numerous Development and Rehabilitation Projects
Over the years, Kenyan infrastructure sector has had numerous projects initiated and implemented, in a bid to better the economy. This has mainly been enhanced by government’s aggressiveness and continued focus to develop the projects in various parts of the country especially road projects. Case in point, KNBS highlights that the government is expected to spend an estimated Kshs 207.2 bn for the FY’2021/22 on road projects, which is a 6.1% increase from the Kshs 195.3 bn that was spent for the FY’2020/21.
- Involvement of the Private Sector in the Infrastructure Projects
Infrastructure projects are always public monopolies developed for the use of citizens in a country. Therefore, the government is mandated with role of ensuring the availability of infrastructural facilities and equipment in the country. However, we have witnessed the private sector also partner with the government in order to develop the projects. Some of these private sector organizations include: China Road and Bridge Construction Corporation (CRBC), which was involved in the construction of the Nairobi Expressway, and, China Exim Bank which is involved in the construction of the Nairobi Western Bypass Project, among many others. Through their involvement, the infrastructure sector gets to benefit from additional financing for projects, as well as the construction of the planned projects. The involvement of private sector players also eases pressure on Kenya’s budget and borrowing needs.
- Green Infrastructure
Green infrastructure is an environmentally friendly technique that is slowly taking shape in the construction of infrastructure projects in Kenya. They mainly involve installation of plant boxes, heat absorbing pavements, and planting trees in the urban areas which in turn improve the quality of air in the areas. An example is the Nairobi Expressway project, whose design incorporates plant materials such as trees and flowers, and so far has been implemented.
- Financing Strategies:
-
- Budgetary Allocations:
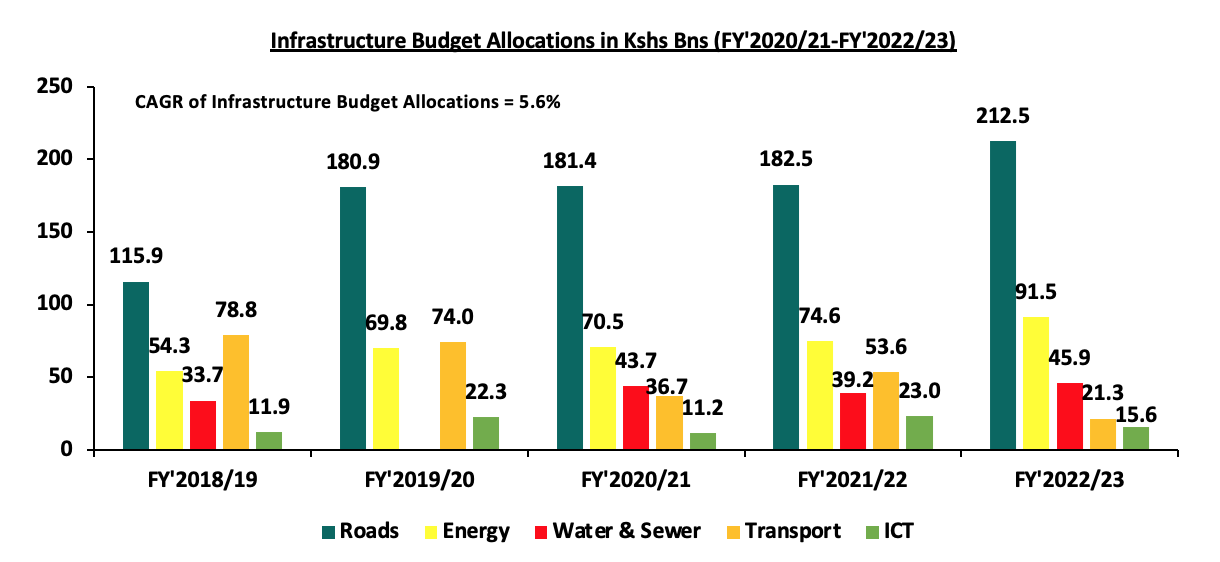
The Kenyan infrastructure sector has always been given much priority in the Year on Year (YoY) budget allocations. This is due to the capital-intensive nature of the infrastructural projects coupled with its direct impact on the economy through job creation and opening up different regions for business. In support of this, the yearly budget allocations for the sector grew by a 5.6% CAGR, with the total budget allocation for the FY’2022/23 coming in at Kshs 386.8 bn, from the Kshs 294.6 bn that was recorded for the FY’2018/19. The graph below shows the infrastructure sector budget allocation in the last five fiscal years;
Source: National Treasury of Kenya
-
- Roll Out of Infrastructure Bonds:
Infrastructure developments require massive funding in order to implement all through to completion and exit. This has therefore made the government to realize various avenues of getting finances to implement the projects besides the annual budget allocation, such as issuing of infrastructure bonds. In February 2022, the national government through the Central Bank of Kenya (CBK) floated the IFB1/2022/19 infrastructure bond worth Kshs 75.0 bn, which later realized an oversubscription rate of 176.3%. This comes barely six months after the Central Bank of Kenya (CBK) also floated the IFB1/2021/21 infrastructure bond worth Kshs 75.0 bn in September 2021, and later realized an oversubscription rate of 201.7%, signifying a high investor appetite for the bonds as well. The investor appetite is also attributable to the fact that infrastructure bond coupons are tax exempt thus offering better value for investors.
-
- Public Private Partnerships (PPPs):
As per our Public Private Partnerships topical, PPPs are generally agreements between the public sector and the private sector formed with a sole purpose of implementing public projects. This project partnership strategy has been realized to be a cost effective and technological way of implementing projects in Kenya, especially major infrastructure and housing projects. For the NMA infrastructure sector, various projects are currently underway with the Nairobi Expressway, which is a PPP project between the national government through the Kenya National Highways Authority (KENHA), and the China Road and Bridge Construction Corporation (CRBC) being the first project to be implemented using the strategy. Other projects include; i) the Western Bypass, ii) Nairobi Bulk Water Supply Project, iii) Nairobi Commuter Rail Project, iv) Kajiado – Imaroro and Ngong – Kiserian – Isinya roads project, and, v) Solid Waste Treatment in Nairobi City County Project, among many others.
-
- Debt Financing of Projects:
Infrastructural projects require colossal capital in order to implement all through to completion, whereas financial constraints continue to be a major challenge faced while executing the projects. Moreover funding sources such as budget allocations and infrastructure bonds are not enough to finance the projects. The government has therefore had to seek debt from international financial institutions such as World Bank in order to supplement the available funds for financing the projects. In order to ensure that the debt funds are utilized properly, it is vital for the government to ensure the undertaken projects are financially viable – that the project can generate sufficient revenues directly or indirectly to repay its financing costs. This is so because Kenya’s Public Debt is already currently standing at Kshs 8.2 tn as at December 2021, which 12.3% higher than the Kshs 7.3 tn recorded in December 2020, and current revenue collection serves to meet the country’s recurrent expenditure with little left for development spending.
Section III: State of Infrastructure in the Nairobi Metropolitan Area (NMA)
In this section we take a look at the current state of infrastructure in the Nairobi Metropolitan Area (NMA), which is a major beneficiary of the infrastructure developments implemented by the Government of Kenya. This is also supported by NMA’s high contribution to the country’s Gross Domestic Product, evidenced by the 37.3% of Gross County Product that it currently accounts for. The counties of focus within the NMA include; Nairobi, Kiambu, Machakos, and Kajiado Counties. Below is the analysis of the infrastructure provision;
- Roads
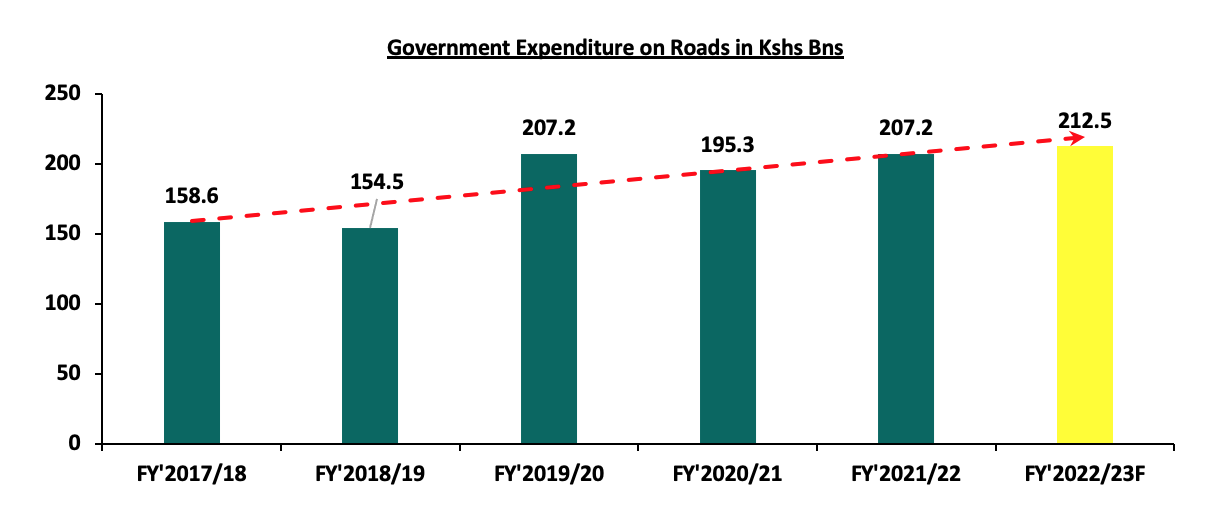
Roads are the most common mode of transport in Kenya, as evidenced by the Economic Survey 2022 report by the Kenya National Bureau of Statistics (KNBS). According to the report, the sector had the highest value output of Kshs 1.8 tn, compared to the overall transport and storage sector which recorded a value output of Kshs 2.3 tn, as at 2021. In terms of expenditure, the survey report highlights that the government is expected to spend an estimated total Kshs 207.2 bn for the FY’2021/22 on road projects, which is a 6.1% increase from the Kshs 195.3 bn recorded for the FY’2020/21. This is relatively higher compared to the Kshs 182.5 bn budget allocation towards the road sector in the FY’2021/22, indicating the much focus on the sector by the government. The graph below shows the Kenyan government’s expenditure on roads in the last six years;
Source: Kenya National Bureau of Statistics
In terms of performance in the Nairobi Metropolitan Area, a total of 132.8 Km road networks worth Kshs 93.1 bn have been so far completed, between 2021 and May 2022. This is an increase compared to the 97.7 Km roads worth Kshs 4.3 bn recorded in 2021. Some of the roads completed so far in 2022 include: 27.1 Km Nairobi Expressway, 4.5 Km Hunters-Githurai Missing Link, and, 3.5 Km Mugi Road, all located in Nairobi County. Below is a summary of completed road network coverage in the Nairobi Metropolitan Area (NMA) between January 2021 and May 2022;
|
Roads Completed in Nairobi Metropolitan Area in 2021-May 2022 |
||
|
County |
Coverage (KM) |
Cost (Kshs bns) |
|
Nairobi |
35.1 |
88.7 |
|
Kajiado |
70.0 |
3.0 |
|
Kiambu |
15.7 |
0.7 |
|
Machakos |
12.0 |
0.6 |
|
Total |
132.8 |
93.1 |
|
||
Source: KENHA, KeRRA, KURA
In addition to the aforementioned completed road projects, currently there are 940.5 Km ongoing construction and rehabilitation projects in the NMA worth Kshs 97.3 bn. This is a slight increase from the 939.6 Km projects worth Kshs 162.4 bn that was recorded in 2021, with some of the ongoing construction projects being; i) Athi River Machakos Turn Off, ii) Western By Pass, and, iii) Gatukuyu Matara Road, among many others. Below is a summary of the ongoing road network coverage in the NMA;
|
Summary of Nairobi Metropolitan Area Ongoing Road Projects |
|||
|
County |
Total Coverage (KM) |
Average Completion Status |
Total Cost (Kshs bns) |
|
Kiambu |
502.0 |
52.6% |
38.8 |
|
Machakos |
202.0 |
39.2% |
20.4 |
|
Kajiado |
142.4 |
57.5% |
7.3 |
|
Nairobi |
94.1 |
44.6% |
7.3 |
|
Average |
940.5 |
48.5% |
97.3 |
Source: KENHA, KURA, KeRRA,
- Water Supply
In 2021, the Government of Kenya spent a total of Kshs 63.3 bn towards the development of water supply projects, according to the Economic Survey 2022 report by the Kenya National Bureau of Statistics. This is a 5.5% increase from the Kshs 60.1 bn that was spent in the 2020, a sign of Government’s efforts to increase the supply of water in various parts of the country. The graph below shows Government’s expenditure on water supply projects in the last 5 years;
Source: Kenya National Bureau of Statistics
In the Nairobi Metropolitan Area’s (NMA), most sources of water originate from piped water systems and boreholes. In terms of water coverage performance, the Impact Report Issue No. 13 by the Water Services Regulator Board (WASREB) highlights the NMA’s average coverage increased by 1.0% points to 55.8% in 2020 from 54.8% recorded in 2019, due to increased development projects. Some of the completed water projects as at 2021 include: Muthua Community Water Supply Project, Kabiria Community Water Supply Project, Ruiru-Juja-Githurai Water Project, and, Kigoro Water Treatment Plant, among others.
In terms of coverage per County, Nairobi registered the highest water coverage at 79.0% compared to NMA’s average of 55.8%, as at 2020, due to presence of adequate water supply systems and networks. On the other hand, Kajiado recorded the least water coverage at 31.0%, which is also an 11.0% points decline from 42.0% that was recorded in 2019, attributed to inadequate water supply with the problem being compounded by the high population growth rate at 4.6% compared to Kenya’s 2.1%, according to the Kenya National Bureau of Statistics. The table below show the NMA water coverage as at 2020:
|
Nairobi Metropolitan Area Water Coverage as at 2020 |
||
|
County |
2020 |
2019 |
|
Nairobi |
79.0% |
77.0% |
|
Kiambu |
67.0% |
67.0% |
|
Machakos |
46.0% |
33.0% |
|
Kajiado |
31.0% |
42.0% |
|
Average |
55.8% |
54.8% |
Source: Water Service Regulatory Board
Below is a list of some of the water and sewer system companies within the Nairobi Metropolitan Area;
|
Nairobi Metropolitan Area Water and Sewer Systems Companies |
|||
|
Company |
County |
Company |
County |
|
Kiambu Water and Sewerage Company |
Kiambu |
Nairobi City Water & Sewerage Company |
Nairobi |
|
Thika Water and Sewerage Company |
Kiambu |
Runda Water Services Provider |
Nairobi |
|
Ruiru-Juja Water and Sanitation |
Kiambu |
Machakos Water and Sewerage Company |
Machakos |
|
Limuru Water and Sewerage Company |
Kiambu |
Mavoko Water and Sewerage Company |
Machakos |
|
Kikuyu Water and Sewerage company |
Kiambu |
Kangundo–Matungulu Water and Sewerage Company |
Machakos |
|
Gatundu Water and Sanitation Company |
Kiambu |
Mwala Water and Sanitation Company |
Machakos |
|
Karimenu Water and Sanitation Company |
Kiambu |
Oloolaiser Water and Sewerage Company |
Kajiado |
|
Kikuyu Water and Sewerage company |
Kiambu |
Nol-Turesh Loitokitok Water & Sanitation Company |
Kajiado |
|
Karuri Water and Sewerage Company |
Kiambu |
Olkejuado Water and Sewerage Company |
Kajiado |
Source; Water Service Regulatory Board
Despite the 1.0% increase in the water supply network in 2020, the overall NMA is not adequately supplied with water due to a myriad of setbacks, which include;
- Financial dependency on the National Government to deliver the projects. This is attributed to financial constraints at county levels, as a result of inadequate revenue collection by the county governments and some water service providers,
- Conflicts of decisions among County administrations and the Water Service Sector, leading to stalling of projects,
- Inadequate skilled personnel which in turn affects the managerial and operational efficiency of projects, and,
- Political influence that get directly involved in the day-to-day management and operations of the utilities, resulting in conflicts, and, misdirection of resources.
In order to curb these challenges and increase water supply in Kenya, the government through the Water Services Regulator Board (WASREB), came up with the YoY Water Governance Training Handbook in 2015. This is a report aimed at educating and guiding the public, as well as the stakeholders in the water services sector, on the best practices and matters relating to the water sector. In addition to this, there are various ongoing water supply projects in the Nairobi Metropolitan Area which include:
- Nairobi Bulk Water Supply Project, to service Nairobi city,
- Rehabilitation of Ndarugu and Thiririka Water Treatment Plant Project in Kiambu County,
- Karimenu and Karure Water Systems Development in Kiambu County,
- Westlands Water Development Project in Nairobi County,
- Mwala Constituency Water Project Phase 3 in Machakos County, and,
- Machakos Water Supply, among many others.
- Sewer Systems
In the Nairobi Metropolitan Area, sewer systems recorded an average network coverage 19.0% in 2020, a 1.0% points increase from the 18.0% that was recorded in 2019 according to the Impact Report Issue No. 13 report by the Water Services Regulator Board (WASREB). Nairobi County led with a 51.0% coverage whereas counties such as Kajiado had negligible connectivity, with majority of the population relying on sources such as pit latrines, septic tanks, and bio digesters. The table below shows the water and sewer coverage of various counties within the NMA as at 2020;
|
Nairobi Metropolitan Area Sewer Systems Coverage as at 2020 |
||
|
County |
Sewer Coverage 2020 |
Sewer Coverage 2019 |
|
Nairobi |
51.0% |
51.0% |
|
Kiambu |
11.0% |
10.0% |
|
Machakos |
14.0% |
11.0% |
|
Kajiado |
0.0% |
0.0% |
|
Average |
19.0% |
18.0% |
Source: Water Service Regulatory Board
The above data clearly depicts a big gap in the establishment of sewer systems in the Nairobi Metropolitan Area, with Kajiado’s negligible coverage causing an alarm. To curb the low network coverage, the government has initiated various sewer network projects in order to increase the infrastructure coverage in the Nairobi Metropolitan Area. Moreover, there exist various sewer line companies mandated with the task of developing and implementing sewer line projects in the NMA, as indicated in the previous infrastructure section (Water Supply Section). Some of the ongoing sewer infrastructure projects include;
- Solid Waste Treatment Project to service Nairobi city,
- Westlands Trunk Sewers Development Project in Nairobi County,
- Kilimani Trunk Sewers Development Project in Nairobi County,
- Kajiado and Kitengela Sewerage System Project,
- Mwala Constituency Sanitation Project Phase 3 in Machakos County, and,
- Machakos Sewerage Project, among many others.
Section IV: Importance of Roads, Water, and, Sewer Network Availability to the Real Estate Sector
Infrastructure development is of key importance in the performance of Kenya’s Real Estate sector. Below are the impacts of infrastructure availability towards the property sector;
- Boosting Property Investments: The availability of infrastructure such as roads and water among others helps boost property investments in the country through developments, as well as boosting the overall rates and prices of units and spaces,
- Promoting Accessibility to Properties: Establishment of roads and railway lines enhances the accessibility to various properties such as retail centres, residential units, tourism destination centres, and working areas, which in turn leads to increased demand for the properties and their overall performance,
- Reducing Development Costs: According to the Centre for Affordable Housing Finance in Africa, infrastructure accounts for approximately 14.0% of construction costs in Kenya, hence their presence eases the burden of construction to developers by reducing the costs which could otherwise be incurred by them,
- Recognition of Nairobi as a Regional Hub: The continued development of infrastructure facilities and developments has made Kenya’s Nairobi to be recognized globally as a regional hub. In turn, the country has witnessed various foreigners invest into the Kenyan property market, with some of the investors being; Eat n’ Go Limited, CCI Group of Companies, Unity Homes, Carrefour, Chicken Cottage, and, Simbisa Brand, among many others,
- Facilitates Trade Activities: Presence of infrastructure boosts commerce activities in an area. For example, good roads within an area would help in transportation of products from one area to another. Additionally, presence of electricity, water, sewer and drainage systems, among other infrastructure facilities, enhances the efficient operation of business activities in an area, contrary to an area with limited infrastructure,
- Promoting Tourism Activities & Foreign Investments: A well infrastructure-equipped economy not only boosts local investments but also foreign investments. In Kenya, Nairobi has mostly been recognized as a regional hub thereby attracting investments by foreigners, due to its strategic location and infrastructural availability. Some of the international entities include; Café Java, CCI Group of Companies, Hilton Hotel, among many others.
Additionally, availability of adequate infrastructure such as airports/airstrips, and roads, boosts tourism activities in the country by promoting accessibility into the country, as well as movement by tourists to various destinations,
- Improving Living Standards: Overall, the presence of infrastructure networks improves the living standards of citizens in a country, contrary to an area with inadequate infrastructure. This is so because infrastructure supply such as water is deemed a basic necessity for living hence lack of it is detrimental to an economy. Moreover, with the modern world of today, infrastructure networks such as electricity, and internet, are also considered basic requirements despite other people lacking it, and,
- Source of Employment Opportunity: For infrastructure to exist, there needs to be a project team to implement the projects such as; Architects, Project Managers, Construction Managers, Quantity Surveyors, Engineers, and, Contractors, among many others. This in turn creates employment opportunity to people or an entity.
Despite the above benefits, there are challenges associated with infrastructural developments to the property sector, hence the need to expand infrastructure services in the country. These challenges mainly originate from overpopulation in urban areas as a result of urbanization. In turn, this leads to; i) inadequate development space in certain areas, ii) degradation of existing public amenities and facilities, iii) traffic congestion, iv) reduction in the quality of life, and, v) chronic power and water shortages.
Section V: Conclusion & Recommendation
Infrastructure is the backbone of a country’s economy evidenced by the various benefits it is associated with such as: creation of employment opportunities, boosting investments in the country, promoting accessibility to various parts of the country, as well as boosting trade activities, among many others. As such the government of Kenya (GoK) has made it a bigger priority to focus on the implementation and delivery of infrastructural developments in order to improve the economy’s status and performance. Therefore, to gauge Real Estate investment opportunities based on infrastructure, we looked at the key infrastructural sectors and ranked them in terms of performance and availability as follows;
The points are 1-4, with 4 awarded to the Best Performing Area Based on Infrastructure Availability
|
County Ranking based on the State of Infrastructure Development January 2021 – May 2022 |
||||||
|
County |
Completed Roads |
Roads in Pipeline |
Water Connectivity |
Sewer Connectivity |
Average Points |
Rank |
|
Nairobi |
4 |
1 |
4 |
4 |
3.3 |
1 |
|
Kiambu |
2 |
4 |
3 |
2 |
2.8 |
2 |
|
Machakos |
1 |
3 |
2 |
3 |
2.3 |
3 |
|
Kajiado |
3 |
2 |
1 |
1 |
1.8 |
4 |
Based on the above infrastructure services, Nairobi tops as the best County for Real Estate developments such as the residential units, due to the presence of adequate completed road networks, and, adequate water and sewer connectivity. Some of the areas to invest in Nairobi County due to the presence adequate infrastructure include; Kilimani, Westlands, Upperhill, Gigiri, and Karen, among many others. Kiambu County follows closely in terms of infrastructure availability, with some of the best areas to implement Real Estate investments being; Ruiru, Kahawa Sukari, Juja, and, Thika, among others.
We expect the infrastructure sector of Kenya especially the Nairobi Metropolitan Area (NMA), to continue recording more construction and rehabilitation projects mainly supported by government’s aggressiveness on the same. However, financial constraints continue to remain a major factor impeding the progress of the projects as they require massive funds to establish. As such, the government should embark on implementing suitable project frameworks such as effective PPP strategies, and, efficient procurement strategies, among others, in order to curb project irregularities such as loss of funds.
Disclaimer: The views expressed in this publication are those of the writers where particulars are not warranted. This publication, which is in compliance with Section 2 of the Capital Markets Authority Act Cap 485A, is meant for general information only and is not a warranty, representation, advice or solicitation of any nature. Readers are advised in all circumstances to seek the advice of a registered investment advisor.

- Talk to us
- Kenya
- P.O Box 20695 - 00200, Nairobi, Kenya
- Cell +254709101200
- Tel +254709101200
- WhatsApp +254741676635
- United States
- +254709101200
- DOWNLOAD OUR APP
-


- Kenya
- 8th Floor, Pinetree Plaza, Kaburu Drive, Ngong Road, Nairobi, Kenya
- USA
- Suite 1150, 1775 Eye Street NW, USA, Washington DC 20006, USA
- Investments
- High Yield
- Private Equity
- Real Estate
- Real Estate
- RiverRun Estates
- Cytonn Towers
- The Ridge
- Taraji Heights
- The Alma