Is There a Real Estate Bubble in Kenya? & Cytonn Weekly #04/2020
By Research Team, Jan 26, 2020
Executive Summary
Fixed Income
During the week, T-bills remained oversubscribed, with the subscription rate coming in at 145.9%, up from 118.1% recorded the previous week, and higher than the YTD average of 111.2%. The oversubscription is attributable to improved liquidity in the market during the week supported mainly by government payments, which partly offset tax remittances. The Monetary Policy Committee (MPC) is set to meet on Monday, 27th January 2020, to review the prevailing macro-economic conditions and decide on the direction of the Central Bank Rate (CBR). We expect MPC to maintain the CBR at 8.5%, having lowered the CBR from 9.0% to 8.5% in their last meeting on 25th November, 2019. During the week, the Treasury released the Draft 2020 Budget Policy Statement, which highlights the current performance of the country’s economy and gives a medium-term outlook, in preparation for the 2020/21 Budget for comments from the general public;
Equities
During the week, the equities market was on a downward trend, with NASI, NSE 20, and NSE 25 recording declines of (0.8%), (1.0%), and (0.7%), respectively, taking their YTD performance to (0.9%), (0.4%), and (0.6%), for the NASI, NSE 20, and NSE 25, respectively. Jubilee Holdings announced plans to lay off 52 employees as the firm completes splitting of its insurance business in Kenya to increase efficiency and management focus and also comply with the revised 2010 Insurance Act, cap 487, which requires all composite companies to have separate entities, by separating short-term underwriting business from the long-term underwriting business. The Capital Markets Authority released the Q4'2019 Statistical Bulletin, highlighting the performance of the Equities market during the quarter under review;
Real Estate
During the week, the Kenyan Government’s affordable housing agenda received a major boost as United Kingdom based investor, United Kingdom Climate Investment (UKCI) pledged to invest GBP 30 mn (Kshs 3.9 bn) towards development of 10,000 green affordable homes in Kenya. In the retail sector, Amethis Finance, a Paris-based private equity fund, acquired a 30.0% stake in Naivas Limited for an undisclosed amount, while in the hospitality sector, PrideInn, a local hotel group, announced its first management facility, the five-star Azure Hotel located in Westlands;
Focus of the Week
In 2017 we reviewed the real estate industry and prepared two topical reports, Is There a Real Estate Bubble in Kenya? and What Real Estate Bubble?, addressing speculations that the property market was experiencing a bubble. Overall, we concluded that the Kenyan real estate market was still in its nascent stage and was just being institutionalized. This week, we revisit the topic by reviewing the current state of the market, and comparing it to two property markets that have previously experienced a property bubble, namely Poland and Japan, and finalize by giving our view on the same.
- Weekly Rates:
- Cytonn Money Market Fund closed the week at a yield of 11.2% p.a. To subscribe, just dial *809#;
- Cytonn High Yield Fund closed the week at a yield of 13.7% p.a. To subscribe, email us at sales@cytonn.com;
- David Kingoo, Senior Risk and Compliance Associate at Cytonn, attended an interview on K24, where he talked about the 2020 Economic Outlook. Watch David here
- David Gitau, Investment Analyst at Cytonn, attended an interview on KBC Channel 1, where he talked about the factors that grew our economy last year, the challenges faced and the factors that will drive the economy this year. Watch David here
- David Gitau, Investment Analyst at Cytonn, was interviewed by CNBC as they discussed the various economic developments taking place. Watch David here
- Michael Obaga, Financial Advisor, Cytonn Investments, attended an interview on K24 where they discussed money market funds and how investors stand to benefit from investing in one. Watch Michael here
- Cytonn Investments launched the Cytonn Affordable Investment Plan (CAHIP) on Tuesday 21st January 2020. CAHIP’s key objective is “Building a deposit towards your housing”; it is structured by Cytonn Investments and it aims to provide those saving towards home purchase an attractive investment proposition, compared to those currently available in the market. Read the event note here
- Phase 1 of The Alma is now 100% sold with early buyers having achieved up to 55% capital appreciation. We are now running a promotion in Phase 2: Buy a unit in Phase 2 with a 15-year payment plan and 0% deposit. For inquiries, please email us on clientservices@cytonn.com. The site is open between 8 am - 5 pm, 7-days a week for site visits;
- For an exclusive tour of Cytonn’s real estate developments, visit: Sharp Investor's Tour and for more information, email us at sales@cytonn.com;
- We continue to hold weekly workshops and site visits on how to build wealth through real estate investments. The weekly workshops and site visits target both investors looking to invest in real estate directly and those interested in high yield investment products to familiarize themselves with how we support our high yields. Watch progress videos and pictures of The Alma, Amara Ridge, and The Ridge;
- We continue to see very strong interest in our weekly Private Wealth Management Training (largely covering financial planning and structured products). The training is at no cost and is open only to pre-screened participants. We also continue to see institutions and investment groups interested in the training for their teams. Cytonn Foundation, under its financial literacy pillar, runs the Wealth Management Training. If interested in our Private Wealth Management Training for your employees or investment group, please get in touch with us through wmt@cytonn.com. To view the Wealth Management Training topics, click here;
- For recent news about the company, see our news section here;
- We have 10 investment-ready projects, offering attractive development and buyer targeted returns. See further details here: Summary of Investment-Ready Projects.
Money Markets, T-Bills & T-Bonds Primary Auction:
During the week, T-bills remained oversubscribed, with the subscription rate coming in at 145.9%, up from 118.1% recorded the previous week, and higher than the YTD average of 111.2%. The oversubscription is attributable to improved liquidity in the market during the week, supported mainly by government payments, which partly offset tax remittances. We note that the 364-day paper continued to receive the most interest from investors, having recorded the highest subscription rate of the 3 papers, at 217.1%. This is attributable to the market currently pricing that the government will be under pressure to meet its domestic borrowing target, and as such a bias to shorter-dated papers in order to avoid duration risk, which has seen most investors still keen on the primary fixed income market, finding the 364-day T-bill more attractive on a risk-adjusted return basis, compared to a two year bond with a yield of 10.4%. The yields on the 91-day, 182-day and 364-day papers increased by 4.7 bps, 4.5 bps and 1.7 bps to 7.3%, 8.2%, and 9.9%, respectively. The acceptance rate declined to 77.0%, from 80.1% recorded the previous week, with the government accepting Kshs 26.9 bn of the Kshs 35.0 bn worth of bids received.
During the month of January, the government reopened two bonds, FXD1/2019/5 and FXD1/2019/10, in a bid to raise Kshs 50.0 bn for budgetary support. The FXD1/2019/5 and FXD1/2019/10 had an effective tenor of 4.1-years and 9.1-years, and coupon rates of 11.3% and 12.4%, respectively, with the overall subscription rate coming in at 139.9%. Further to this, we note that there was pent up demand on the FXD1/2019/5, which received bids worth Kshs 44.5 bn of the Kshs 69.9 bn worth of bids received for both bonds, in line with our expectations that investors will be attracted to the shorter-term paper due to its relatively shorter tenor, thus, reduced duration risk, coupled with the high liquidity in the market. The yields came in at 11.5% and 12.5% for the 5-year and 10-year bonds, respectively, with the government accepting Kshs 63.7 bn out of the Kshs 69.9 bn worth of bids received, translating to an acceptance rate of 91.1%. We note that this was higher than the quantum of Kshs 50.0 bn for the issue, emphasizing the government’s aggressiveness in accepting money in an effort to meet its domestic borrowing target.
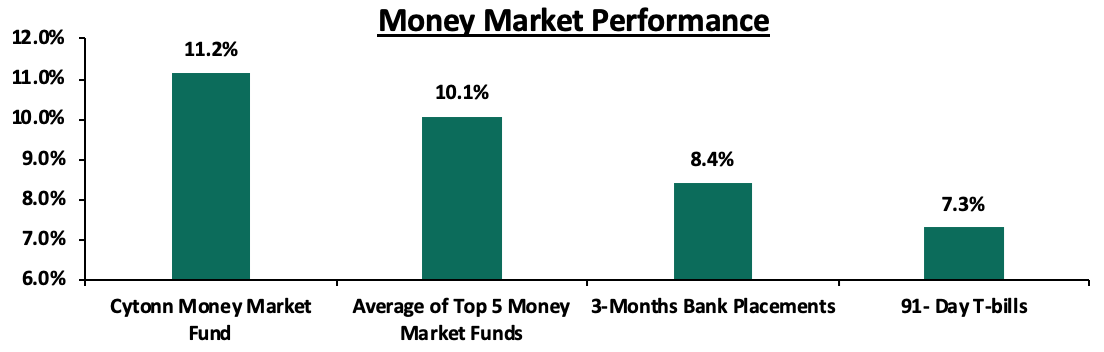
In the money markets, 3-month bank placements ended the week at 8.4% (based on what we have been offered by various banks), the 91-day T-bill came in at 7.3%, while the average of Top 5 Money Market Funds came in at 10.1%, unchanged from the previous week. The yield on the Cytonn Money Market increased marginally by 0.1% points to close at 11.2%, from the 11.1% recorded the previous week.
Liquidity:
During the week, the average interbank rate increased marginally to 3.9%, from 3.8% recorded the previous week. The average interbank rate is way below the 2019 average of 4.3%, an indication of the improved liquidity position in the money markets, supported by government payments and debt maturities, with commercial banks’ excess reserves coming in at Kshs 28.2 bn in relation to the 5.25% cash reserves requirement (CRR). The average interbank volumes increased by 17.6% to Kshs 13.2 bn, from Kshs 11.2 bn recorded the previous week.
Kenya Eurobonds:
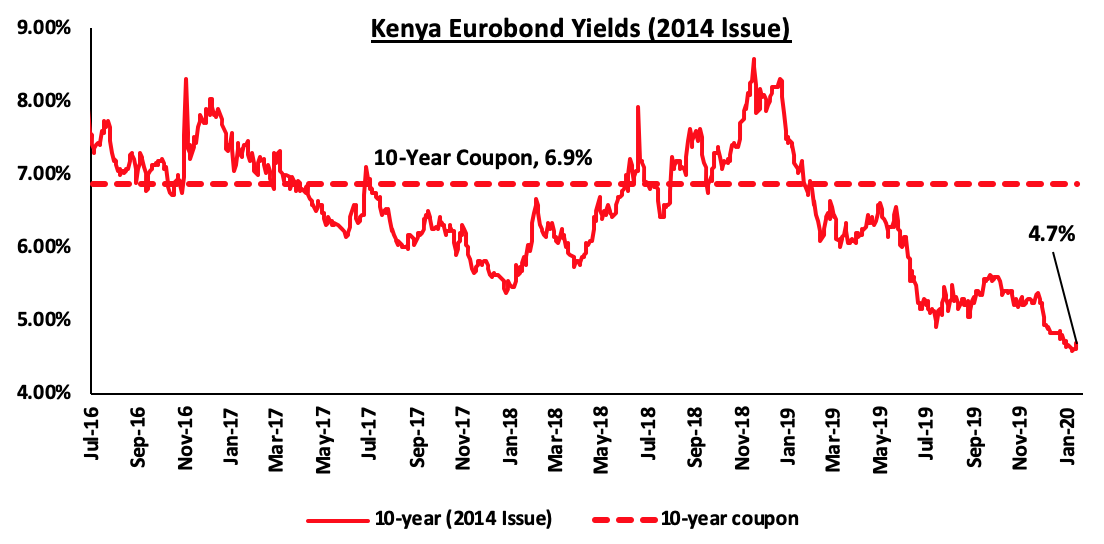
According to Reuters, the yield on the 10-year Eurobond issued in June 2014 increased marginally by 0.1% points to 4.7%, from 4.6% recorded the previous week.
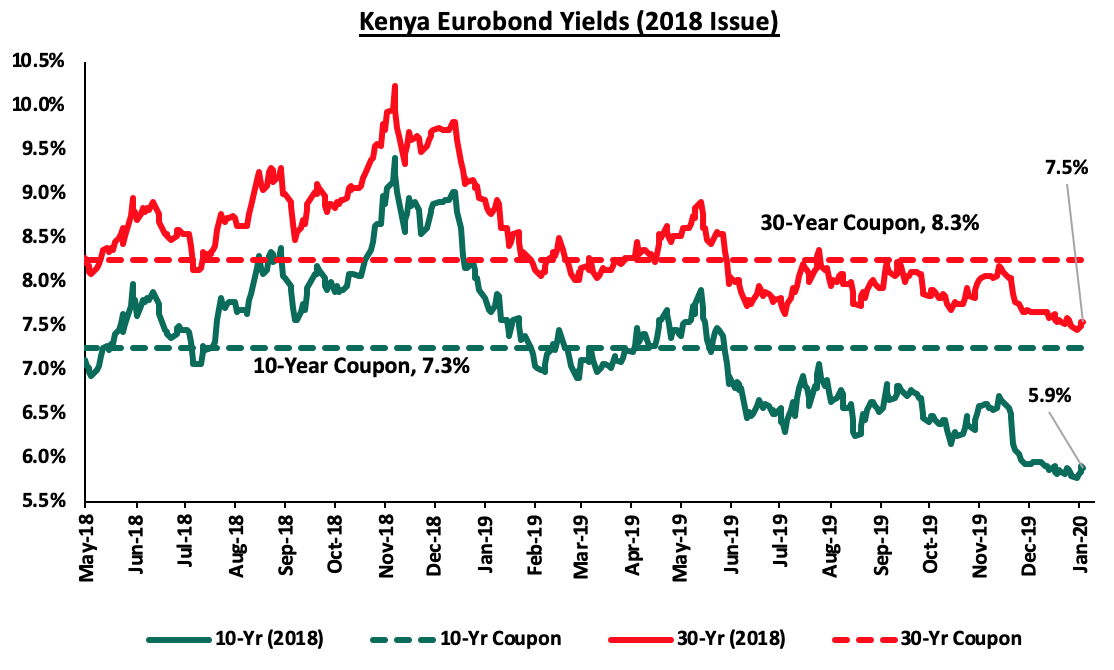
During the week, the yields on the 10-year Eurobond increased marginally to 5.9%, from 5.8% seen the previous week, while that of the 30-year Eurobond remained unchanged at 7.5%.
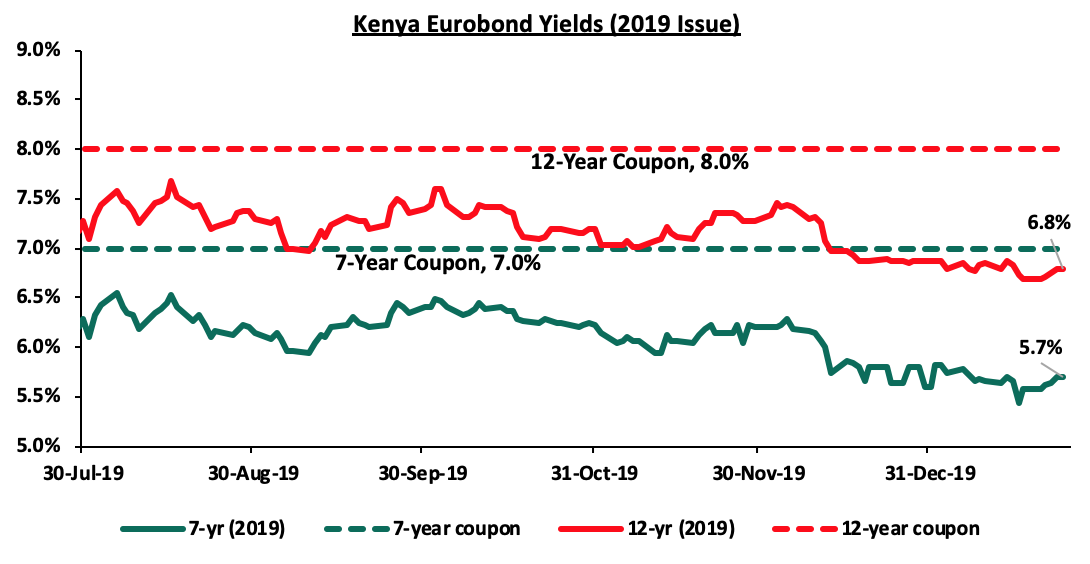
During the week, the yield on the 7-year Eurobond increased by 0.1% points to 5.7%, from 5.6% recorded the previous week. The yield on the 12-year Eurobond also increased by 0.1% points to 6.8%, from 6.7% recorded the previous week.
Kenya Shilling:
During the week, the Kenya Shilling appreciated marginally by 0.1% against the US Dollar to close at Kshs 100.9, from 101.0 recorded the previous week, mostly supported by dollar inflows from horticulture exports and offshore investors buying government debt. On an YTD basis, the shilling has appreciated by 0.4% against the dollar, in comparison to the 0.5% appreciation in 2019. In our view, the shilling should remain relatively stable against the dollar in the short term, with a bias to a 2.4% depreciation by the end of 2020, supported by:
- The narrowing of the current account deficit, with preliminary data indicating that Kenya’s current account deficit in Q3’2019 was equivalent to 8.2% of GDP, from 9.3% recorded in Q3’2018. This was mainly driven by the narrowing of the country’s merchandise trade deficit balance (a scenario where imports are greater than exports) by 6.7%, and a rise in secondary income transfers (transfers recorded in the balance of payments whenever an economy provides or receives goods, services, income or financial items) by 4.3%,
- Foreign capital inflows, with investors looking to participate in the domestic equities market, and,
- CBK’s supportive activities in the money market, such as repurchase agreements and selling of dollars.
We, however, expect pressure on the Kenyan shilling to arise from:
- Increased oil imports bill, as a result of the U.S - Iran diplomatic row, which has seen average crude oil prices increase by 9.9% to an eight-month high to USD 72.0 a barrel in Jan 2020, from USD 65.5 a barrel in December 2019, and,
- Subdued diaspora remittances growth following the close of the 10.0% tax amnesty window in July, which has seen cumulative diaspora remittances increase by a 3.7% in the 12-months to December 2019 to USD 2.8 bn, from USD 2.7 bn in 2018.
Monetary Policy:
The Monetary Policy Committee (MPC) is set to meet on Monday, 27th January 2020, to review the prevailing macro-economic conditions and decide on the direction of the Central Bank Rate (CBR). In their previous meeting held on 25th November 2019, the MPC lowered the CBR by 50 bps to 8.5% from 9.0%, citing that the economy was operating below its potential level concluding that there was room for accommodative monetary policy to support economic activity. This was in line with our expectations as per our MPC Note, with our view being informed by:
- The need to stimulate growth, with GDP growth in 2019 having slowed down averaging 5.6% in H1’2019 lower than 6.4% in H1’2018 and below the CBK’s estimated growth at 6.3%. With the plans of the continued fiscal consolidation by the Government, we believed that a further cut would be necessary to provide the required economic growth stimulus, further boosted by the repeal of the interest rate cap, which going forward was expected to provide more efficient transmission of monetary policy as opposed to the interest rate cap era,
- Inflation had remained contained and within the Government set target of 2.5%-7.5%, amid slowed economic growth, thus providing room for moderate stimulus through expansionary monetary policy, and,
- A further reduction of the Central Bank Rate (CBR), coupled up with the interest rate cap repeal would provide the requisite stimulus to private sector credit growth which had remained below the 5-year average, having grown by 6.3% in the 12 months to August 2019, below the 5-year average of 11.0%.
The Monetary Policy Committee also noted that the current account deficit had narrowed to 4.1% of GDP in the 12-months to September 2019 compared to 5.1% in September 2018, supported by strong growth in diaspora remittances. The decline was also partly attributable to higher receipts from the tourism and transport services as well as lower food and SGR-related equipment imports.
We expect the MPC to hold the CBR at 8.5%, with their decision being supported by:
- Inflation has remained contained and within the Government set target of 2.5%-7.5%, with inflationary pressure gradually easing off, due to improved agricultural production thus causing a decline in food prices which has a weight of 36.0% in the Consumer Price Index following favourable weather conditions,
- We foresee the Central Bank taking a wait and see approach as it observes the effects of the 50 bps rate cut done in the November 2019 meeting as there remains some opacity in terms of response from the banks and consumers. From the last MPC briefing, the Central Bank of Kenya (CBK) Governor indicated that following the interest rate cap repeal, re-learning by banks and consumers was essential so that the market can react appropriately to any monetary policy. The CBK Governor also indicated that they were re-calibrating their models so as to determine the effect of changes in the CBR on the other macro-economic indicators such as GDP and inflation over a certain period.
Based on this, we believe the MPC will hold the rates steady as they continue monitoring the market reactions of the previous cut.
For our detailed MPC analysis, please see our MPC Note for the 27th January 2020 meeting here.
Weekly Highlight:
During the week, the Treasury released the Draft 2020 Budget Policy Statement, which highlights the current performance of the country’s economy and gives a medium-term outlook, in preparation for the FY2020/21 Budget for comments from the general public. The Budget Policy Statement (BPS) is a government policy document that sets out the strategic priorities, policy targets as well as a summary of the government’s spending plans in preparation for the FY 2020/21 Budget. It is prepared by the National Treasury and submitted to the Cabinet for approval. Upon approval, the BPS is submitted for deliberations in Parliament where a resolution will be passed to adopt it, with or without amendments. The Cabinet Secretary will then take into account the resolutions passed by parliament in finalizing the budget for that Fiscal Year.
Below is a comparison of the FY’2019/20 budget and the projected FY’2020/21 budget as per the Draft 2020 BPS;
(All values in billions)
|
A Comparison of the FY’2019/20 Budget with the Projected FY’2020/21 Budget |
||||
|
FY'2018/2019 Budget Outturn |
FY'2019/2020 Supplementary 2019 |
FY'2020/2021 BPS |
% Change 2019/20 to 2020/21 |
|
|
Total Revenue |
1,698.8 |
2,084.2 |
2,133.5 |
2.4% |
|
External Grants |
19.7 |
41.8 |
43.1 |
3.0% |
|
Total Revenue & External Grants |
1,718.5 |
2,126.1 |
2,176.5 |
2.4% |
|
Recurrent Expenditure |
1,531.1 |
1,760.0 |
1,786.9 |
1.5% |
|
Development Expenditure & Net Lending |
541.9 |
730.8 |
576.0 |
(21.2%) |
|
County Governments + Contingencies |
360.7 |
383.4 |
381.0 |
(0.6%) |
|
Total Expenditure |
2,433.7 |
2,874.2 |
2,743.8 |
(4.5%) |
|
Fiscal Deficit Excluding Grants |
(734.9) |
(789.9) |
(610.3) |
(22.7%) |
|
Fiscal Deficit Including Grants |
(715.2) |
(748.1) |
(567.3) |
(24.2%) |
|
Deficit as % of GDP; |
|
|
|
|
|
Excluding Grants |
7.9% |
7.6% |
5.2% |
|
|
Including Grants |
7.7% |
7.2% |
4.9% |
|
|
Net Foreign Borrowing |
414.5 |
353.5 |
247.3 |
(30.0%) |
|
Net Domestic Borrowing |
303.7 |
300.7 |
318.9 |
6.0% |
|
Other Domestic Financing |
2.9 |
3.2 |
3.2 |
|
|
Total Borrowing |
721.1 |
657.4 |
569.4 |
(13.4%) |
|
GDP Estimate |
9,348.3 |
10,355.4 |
11,633.4 |
12.3% |
Source: The National Treasury
Key take-outs from the table include:
- The 2020 BPS points to a 4.5% decrease in Total Expenditure to Kshs 2.7 tn, from Kshs 2.9 tn in the FY’2019/2020 Supplementary Budget. This will mainly be driven by a 21.2% reduction in Development Expenditure & Net Lending, outlining the government’s efforts towards fiscal consolidation,
- Recurrent Expenditure is set to increase marginally by 1.5% to Kshs 1.79 tn, from Kshs 1.76 tn previously. This performance is expected as a result of the current fiscal pressure from the increasing debt & debt service obligations, but will be mitigated by the digitization of government services, which will help reduce public expenditure,
- Revenue is projected to increase slightly by 2.4% to Kshs 2.13 tn from Kshs 2.08 tn in FY 2019/20, compared to the 12.3% projected increase seen in the 2019 BPS. This is a more conservative approach from the previous years’ ambitious targets, with the performance being expected to be driven by revenue enhancement initiatives by the KRA such as the development of a mobile app to aid in collection of turnover tax,
- The budget deficit is projected to decline to Kshs 567.3 bn (4.9% of GDP) from the projected Kshs 748.1 bn (7.2% of GDP) in the FY’2019/20 supplementary budget, which will in effect reduce the country’s public debt requirements with the total borrowing requirement expected to decline by 24.2% to Kshs 567.3 bn from Kshs 748.1 bn, and,
- Debt financing for the FY’2020/21 budget is estimated to consist of 43% foreign debt, 56% domestic debt and 1% other domestic financing, compared to the 54% foreign debt and 46% domestic debt recorded in the FY 2019/20 Supplementary Budget.
In conclusion, the government has taken a keen focus on fiscal consolidation where we can see the significant reduction in the expenditure towards development, and the more realistic revenue targets that they have set. This will allow them to get a clear picture of the current fiscal framework, which will ultimately help make policies more effective. Similarly, the proposed debt restructuring will contribute significantly to reducing the fiscal deficit through the restructuring of expensive commercial loans to cheaper multi and bilateral loans. We, however, remain concerned about the country’s debt levels and are pessimistic about their ability to meet its revenue collection targets due to the levels of domestic debt maturities in FY’2019/20, currently at Kshs 493.0 bn, coupled with the historical underperformance of ordinary revenues, with the government having met 93.1% of its target as per the FY’2018/2019 budget outturn. There is more to be done in terms of revenue collection such as:
- The use of third party data to identify non-compliant taxpayers and their inclusion in the tax base, and,
- Detection of non-compliance, through the i-tax system by enhancement of investigations and intelligence capacity.
Inflation Projections:
We are projecting the Y/Y inflation rate for the month of January to come in within the range of 5.7% - 6.1%, compared to 5.8% recorded in December. The Y/Y inflation for the month of January is expected to rise due to the base effect. The M/M inflation is also expected to rise driven by:
- An increase in the food and non-alcoholic beverages index, which has a weighting of 36.0%, mainly driven by the higher food prices especially vegetables where a sack of kale now goes for Kshs 8,500, up from Kshs 2,500 in 2019, as well as tomato prices which have doubled from Kshs 4,500 in 2019 to Kshs 9,000,
- We also expect an increase in the transport index following the 1.6% and 0.6% increase in petrol and diesel prices, respectively, during the month, and,
- An increase in the housing, water, electricity, gas, and other fuels index following the 0.5% increase in kerosene prices to Kshs 102.3, from Kshs 101.8 in December 2019.
Going forward, we expect the inflation rate to remain within the government set range of 2.5% - 7.5%.
Rates in the fixed income market have remained relatively stable as the government rejects expensive bids. The government is 33.2% ahead of its domestic borrowing target, having borrowed Kshs 238.5 bn against a pro-rated target of Kshs 179.0 bn. We expect an improvement in private sector credit growth considering the repeal of the interest rate cap. This will result in increased competition for bank funds from both the private and public sectors, resulting in upward pressure on interest rates. Owing to this, our view is that investors should be biased towards short-term fixed-income securities to reduce duration risk.
Market Performance
During the week, the equities market was on a downward trend with NASI, NSE 20, and NSE 25 recording declines of (0.8%), (1.0%), and (0.7%), respectively, taking their YTD performance to (0.9%), (0.4%) and (0.6%), for the NASI, NSE 20, and NSE 25, respectively. The performance in NASI was driven by losses recorded by large-cap stocks such as Bamburi, Barclays and Co-operative bank of (8.4%), (3.0%) and (2.5%), respectively.
Equities turnover decreased by 29.9% during the week to USD 28.2 mn, from USD 40.2 mn recorded the previous week, taking the YTD turnover to USD 97.1 mn. Foreign investors remained net buyers for the week, with a net buying position of USD 1.6 mn, a 75.0% decrease from a net buying position of USD 6.6 mn recorded the previous week.
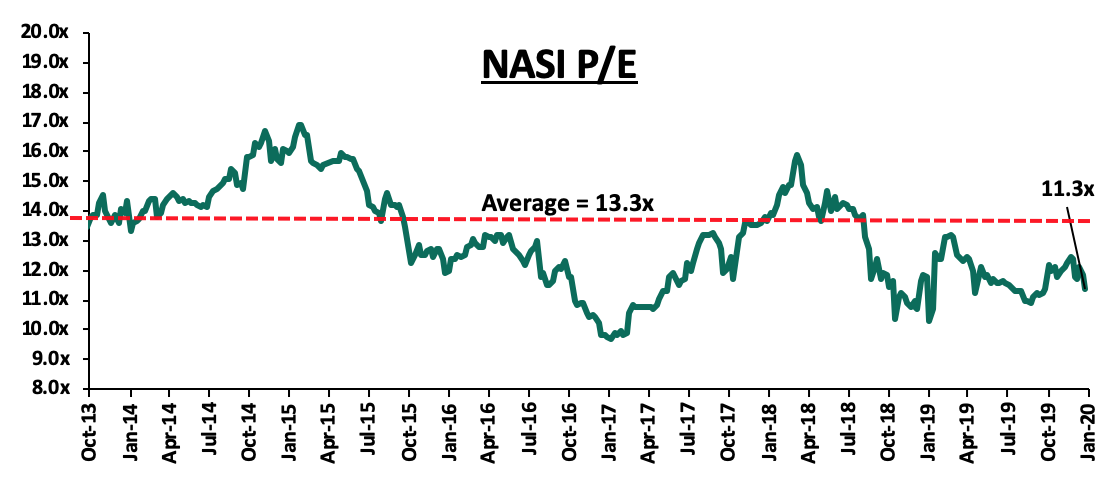
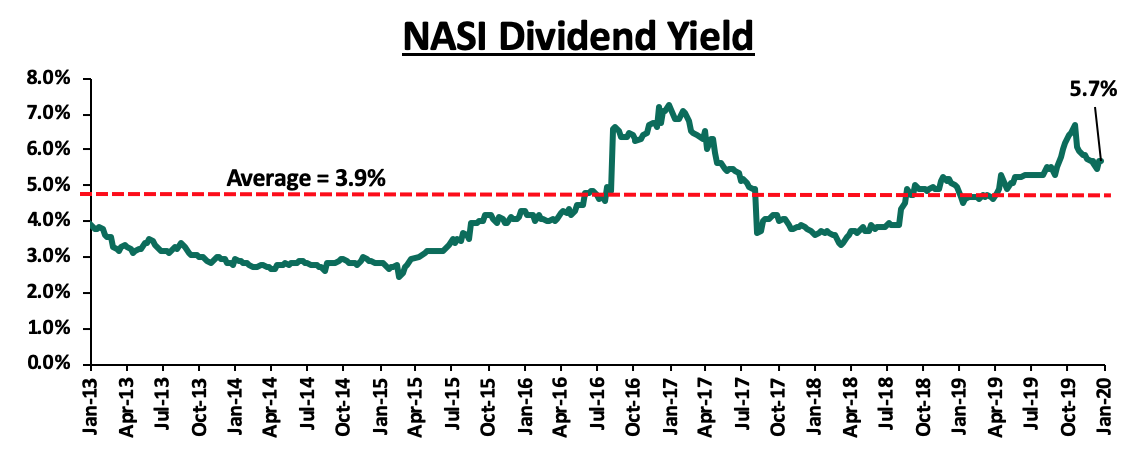
The market is currently trading at a price to earnings ratio (P/E) of 11.3x, 15.0% below the historical average of 13.3x, and a dividend yield of 5.7%, 1.8% points above the historical average of 3.9%. With the market trading at valuations below the historical average, we believe there is value in the market. The current P/E valuation of 11.3x is 16.6% above the most recent trough valuation of 9.7x experienced in the first week of February 2017, and 36.3% above the previous trough valuation of 8.3x experienced in December 2011. The charts below indicate the historical P/E and dividend yields of the market.
Weekly Highlight
During the week, Jubilee Holdings announced plans to lay off 52 employees as it completes splitting of its insurance business in Kenya to increase efficiency and management focus and to comply with the revised 2010 Insurance Act, cap 487, which requires all composite companies to have separate entities, by separating short-term underwriting business from the long-term underwriting business. The separation has led to the creation of two new companies, Jubilee Health Insurance offering medical covers and Jubilee General Insurance offering general insurance covers. In H1’2019 Jubilee’s net profits dropped marginally by 1.6% to Kshs 1.8 bn, from Kshs 1.9bn in H1’2018, attributable to a tough operating environment, which affected the top-line revenue, coupled with rising inefficiencies, consequently leading to declines in net income. Similarly in 2019, Sanlam Kenya PLC also undertook restructuring as part of a cost-cutting strategy aimed at trimming operating costs, as the company aimed to record a profitable performance following the depletion of earnings in 2018 to record a Kshs 2.0 bn loss. Over the last few years, companies have continued to face economic challenges that has seen them restructure their staffing, with others declaring redundancies, and others opting for outright closure. The table below shows some of the listed companies that have announced or undertook restructuring in the last one year. In our view, restructuring continues to be a major theme shaping various sectors’ business models into 2020, with companies adopting cost-saving measures to boost bottom-line performance, attributable to a tough business environment;
|
Kenya Listed Companies Restructuring |
||
|
Company |
Staff Retrenchment |
Date |
|
Jubilee Holdings |
52 |
Jan-20 |
|
East Africa Portland Cement |
800* |
Aug-19 |
|
Stanbic Bank of Kenya |
88 |
Aug-19 |
|
East Africa Breweries Limited |
100 |
Jul-19 |
|
Sanlam Kenya |
19 |
Sep-19 |
|
Mumias Sugar** |
All staff |
Nov-19 |
|
*EAPC declared all its staff redundant and required them to reapply under new terms **Mumias sugar was placed in receivership on 20th September 2019 |
||
During the week, the Capital Markets Authority released the Q4'2019 Statistical Bulletin, highlighting the performance of the Equities market during the quarter under review;
- During the quarter, four companies remained suspended, namely Atlas African Industries Ltd, Deacons East Africa Plc, ARM Cement Plc, and Mumias Sugar Company Ltd,
- There was increased trading at the bourse with equity turnover increasing by 27.0% to Kshs 45.0 bn in Q4’2019, from Kshs 35.4 bn in Q4’2018, attributable to the improved financial performance of listed commercial banks in the country, coupled with the repeal of the rate cap law in the last quarter of the year, which led to increased activity at the bourse,
- In Q4’2019, the NASI and the NSE 20, stood at 166.4 and 2,654.4 points, respectively, recording gains/(losses) of 18.5% and (6.3%), respectively, from 140.4 and 2,833.8 points, respectively, recorded in the same period of review in 2018. The gain recorded by NASI is attributable to the rallying of banking stocks following the removal of the interest rate cap,
- Foreign investor participation decreased by 12.1% points in Q4’2019 to 63.0%, from 75.1% in Q4’2018, attributable to investors shifting to developed markets following the announcement of the phase one U.S- China trade deal in the fourth quarter giving a boost to global equities,
- The derivatives market recorded a 44.1% decrease in trading with 205 contracts traded in Q4’2019, from 367 contracts traded in Q3’2019. Safaricom was the most liquid counter with 133 contracts followed by banking contracts (Equity at 35 and KCB Group at 27). The NEXT derivatives market is expected to provide new opportunities to investors enabling them to diversify, manage risk, and allocate capital efficiently, however, it remains extremely small with little activity, and,
- During the period under review, two medium-term notes and one corporate Infrastructure bond issued by Housing Finance, CIC Insurance, and Kengen, respectively, matured. Housing Finance issued a Kshs 3.0 bn medium-term note in October 2012 with a maturity date of October 2019. CIC’s medium term note worth Kshs 5.0 bn, issued in September 2014, matured in October 2019. Lastly, Kengen’s Infrastructure bond worth Kshs 14.1 bn was issued on November 2009 and matured in October 2019. The local corporate bond market has witnessed reduced activity, with the Acorn Green Bond being the only issued corporate bond in the last five years, attributable to defaults witnessed over the past five years by issuers such as ARM Cement, Nakumatt and Imperial Bank.
We maintain our view that to improve the performance of the equities market, the following should be addressed;
- Investors and Issuers Education- There remains the need for increased focus towards extensive investor education and public awareness initiatives, in order to boost domestic investor participation, either through saving, investing or borrowing, in order to grow the local capital market,
- Shifting Reliance Away from Bank Loans towards Capital Market Instruments - Banks are the primary source of business funding in the country, providing 95.0% of funding, with other alternative sources such as the capital markets providing a combined 5.0%, compared to developed markets where banks provide only 40.0% of the credit in the economy. Several SMEs have a poor understanding of the capital markets and are unaware of ways in which they can use them to raise funds. The first step towards achieving this would be investor education/ awareness campaigns in order to educate SMEs on how they can use the stock exchange better and build their confidence in the financial system of the capital markets,
- Reduce Minimum Amount Investable in all Real Estate Investment Trusts (REIT) - In order to attract capital into capital market vehicles such as Real Estate Investment Trusts (REIT’s) for real estate development, the minimum investment amount needs to be amended. The current regulations, which define the minimum subscription amount per investor at Kshs 5.0 mn for a Development REIT (D-REIT) is too high to attract significant interest from investors. An amount of Kshs 1.0 mn ensures the investor is sophisticated while also allowing a larger pool of investors to participate, and,
- Improve Market Access and Efficiency - In order to achieve efficiency, there is need for high quality and timely information, which is derived from better disclosures by listed companies. Borrowing from South Africa, we recommend that the NSE develop policies which will require listed firms to disclose corporate news and price sensitive information to the bourse before going to the media,
Universe of Coverage
|
Banks |
Price at 17/01/2020 |
Price at 24/01/2020 |
w/w change |
YTD Change |
Year Open |
Target Price* |
Dividend Yield |
Upside/ Downside** |
P/TBv Multiple |
Recommendation |
|
Kenya Reinsurance |
3.0 |
3.0 |
0.0% |
(1.0%) |
3.0 |
4.8 |
15.0% |
75.0% |
0.3x |
Buy |
|
Diamond Trust Bank |
117.0 |
116.8 |
(0.2%) |
7.1% |
109.0 |
189.0 |
2.2% |
64.1% |
0.6x |
Buy |
|
I&M Holdings*** |
58.3 |
57.5 |
(1.3%) |
6.5% |
54.0 |
75.2 |
6.8% |
37.6% |
1.0x |
Buy |
|
KCB Group*** |
51.8 |
51.8 |
0.0% |
(4.2%) |
54.0 |
64.2 |
6.8% |
30.8% |
1.4x |
Buy |
|
Jubilee Holdings |
360.0 |
360.0 |
0.0% |
2.6% |
351.0 |
453.4 |
2.5% |
28.4% |
1.2x |
Buy |
|
Sanlam |
17.5 |
17.3 |
(1.1%) |
0.6% |
17.2 |
21.7 |
0.0% |
25.4% |
0.7x |
Buy |
|
Co-op Bank*** |
16.0 |
15.6 |
(2.5%) |
(4.6%) |
16.4 |
18.1 |
6.4% |
22.4% |
1.3x |
Buy |
|
Equity Group*** |
51.3 |
51.5 |
0.5% |
(3.7%) |
53.5 |
56.7 |
3.9% |
14.0% |
1.9x |
Accumulate |
|
Standard Chartered |
204.5 |
205.0 |
0.2% |
1.2% |
202.5 |
211.6 |
9.3% |
12.5% |
1.5x |
Accumulate |
|
Barclays Bank*** |
13.5 |
13.1 |
(3.0%) |
(1.9%) |
13.4 |
13.0 |
8.4% |
7.6% |
1.7x |
Hold |
|
Stanbic Holdings |
112.8 |
100.8 |
(10.6%) |
(7.8%) |
109.3 |
103.1 |
4.8% |
7.1% |
1.1x |
Hold |
|
NCBA |
36.3 |
36.5 |
0.7% |
(0.9%) |
36.9 |
37.0 |
4.1% |
5.5% |
0.8x |
Hold |
|
Liberty Holdings |
10.4 |
10.4 |
(0.5%) |
0.0% |
10.4 |
10.1 |
4.8% |
2.1% |
0.9x |
Lighten |
|
CIC Group |
2.9 |
2.9 |
1.4% |
9.0% |
2.7 |
2.6 |
4.5% |
(5.2%) |
1.0x |
Sell |
|
HF Group |
6.1 |
5.7 |
(6.9%) |
(11.8%) |
6.5 |
4.2 |
0.0% |
(26.3%) |
0.2x |
Sell |
|
Britam |
9.2 |
9.2 |
0.4% |
2.7% |
9.0 |
6.8 |
0.0% |
(26.9%) |
0.9x |
Sell |
|
*Target Price as per Cytonn Analyst estimates **Upside/ (Downside) is adjusted for Dividend Yield ***Banks in which Cytonn and/ or its affiliates are invested in |
||||||||||
We are “Positive” on equities for investors as the sustained price declines have seen the market P/E decline to below its historical average. We expect increased market activity, and possibly increased inflows from foreign investors, as they take advantage of the attractive valuations, to support the positive performance.
- Residential Sector
During the week, United Kingdom Climate Investment (UKCI), a joint venture between the Green Investment Group, a UK-based specialist developer and investor of green infrastructure, and the United Kingdom Government’s Department for Business, pledged to invest GBP 30 mn (Kshs 3.9 bn) towards affordable green housing in Kenya, a major boost for the Kenyan Government’s affordable housing agenda. The pledge will be delivered through a locally managed vehicle that also seeks to raise between Kshs 8.0 bn and Kshs 25.0 bn, from Kenyan and international institutional investors, to be geared towards alleviating the affordable housing shortage, currently estimated at 2.0 mn units, while embedding green design standards and stimulating institutional investment in sustainable buildings locally. With the affordable housing initiative’s estimated total cost of Kshs 1.3 tn, the investment will provide a significant impetus to the programme, which aims to deliver 500,000 units by 2022. The government has thus far allocated a total of Kshs 16.5 bn from the 2018/19 and 2019/2020 budgets and a further Kshs 28.0 bn from the Supplementary Appropriation Bills of 2018 and 2019. Previously, the government also received similar support in 2018, from the United Nations Project Services (UNoPs), in which the UN subsidiary committed to deliver 100,000 low cost green homes across Kenya at an estimated cost of Kshs 64.7 bn. As such, we expect continued interest in Kenya’s investment scene particularly affordable housing owing to; (i) government’s investor-friendly incentives and regulations, (ii) a stable macroeconomic environment, and (iii) positive demographics characterised by an expanding middle class and rapid population growth, which have continued to sustain the demand for housing.
- Retail Sector
During the week, leading local retailer Naivas Limited signed a deal to sell 30.0% of its business to Paris-based private equity fund, Amethis Finance, for an undisclosed amount. The PE firm, which has presence across Africa in cities such as Accra, Abidjan, and Casablanca aims to grant entrepreneurs access to external growth opportunities, while improving their efficiency and governance, and therefore, we expect that the move will boost the local retailer’s expansion strategy that has seen it open 57 branches across the country, while also help it avoid corporate governance and management issues that have plagued retail giants such as Nakumatt, Choppies, and Uchumi. In our view, the move affirms the continued investor confidence by international players in Kenya’s retail sector signalling its positive outlook, which is largely driven by; (i) Kenya’s attractive economic projections as compared to global markets, with Kenya among the countries expected to spearhead growth in the Sub Saharan Africa (SSA) region with an expected GDP growth of 5.7%, as per the Cytonn Markets Outlook 2020, in comparison to SSA’s projections of 2.9%, (ii) strong domestic demand driven by the growing middle class population and rapid population growth, which has led to international retailers such as Mango and Skechers setting up shop in the region to satiate demand for quality international products, and (iii) a general improvement in ease of doing business in the region evidenced by Kenya’s move from position #61 in 2018 to #56 in 2019 on the Ease of Doing Business Index by World Bank .
For investors in retail real estate, the entry of foreign players boosts retail space performance and stabilizes uptake and thus, enhancing investor returns. As of 2019, the retail sector recorded average yield of 7.8% in comparison to the office and residential sectors with 7.5% and 5.0%, respectively, with markets such as Westlands and Karen offering relatively high returns of up to 10.3%.
|
Nairobi Retail Sector Performance by Nodes 2019 |
|||
|
Location |
Rent Kshs/SQFT FY' 2019 |
Occupancy FY’ 2019 |
Rental Yield FY' 2019 |
|
Westlands |
215 |
82.8% |
10.3% |
|
Karen |
222 |
80.0% |
9.5% |
|
Kilimani |
167 |
87.4% |
8.8% |
|
Ngong Road |
181 |
80.5% |
8.3% |
|
Kiambu Road |
180 |
67.6% |
7.2% |
|
Thika road |
173 |
72.8% |
7.1% |
|
Eastlands |
150 |
71.7% |
6.8% |
|
Mombasa road |
156 |
66.8% |
6.3% |
|
Satellite Towns |
136 |
73.3% |
5.9% |
|
Average |
176 |
75.9% |
7.8% |
|
· As of 2019, the retail sector posted average yield of 7.8%, with nodes such as Westlands, Karen, Kilimani and Ngong Road registering average yields of 10.3%, 9.5%, 8.8% and 8.3%, respectively |
|||
Source: Cytonn Research
- Hospitality Sector
PrideInn, a local hospitality group, revealed plans of undertaking its first management facility, Azure Hotel, a Kshs 1.2 bn five-star hotel with 164-rooms located in Westlands. Currently, PrideInn operates various own-facilities in Westlands, Nairobi and others in Mombasa. Overall, this plays testament to Westland’s attractiveness as a hospitality node, attributable to; (i) proximity to business nodes such as Kilimani, Central Business District (CBD), and Upperhill, enabled by relatively good road connectivity, (ii) availability of amenities such as the Westgate Mall, Sarit Centre, and other recreational amenities that help to attract visitors, and (iii) convenient accessibility to the main airports, that is, Jomo Kenyatta International Airport (JKIA) and Wilson Airport – and this is bound to improve further with the planned JKIA-James Gichuru Express Highway. The move also affirms Nairobi’s vibrant hospitality sector that is driven by; (i) Nairobi’s status as a key financial hub in Africa, which attracts business and Meeting, Incentives, Conferences and Exhibitions (MICE) travellers, (ii) relatively good infrastructure, and (iii) the government’s open sky policy that has enhanced the ease of movement for Africans, thereby attracting tourists and investors. According to Kenya National Bureau of Statistics (KNBS), international visitors reported in 2018 increased by 14.0% to 2.0 mn from 1.8 mn in 2017, and this is expected to increase in 2020. The graph below shows the growth of the number of in tourism earnings and tourist arrivals;
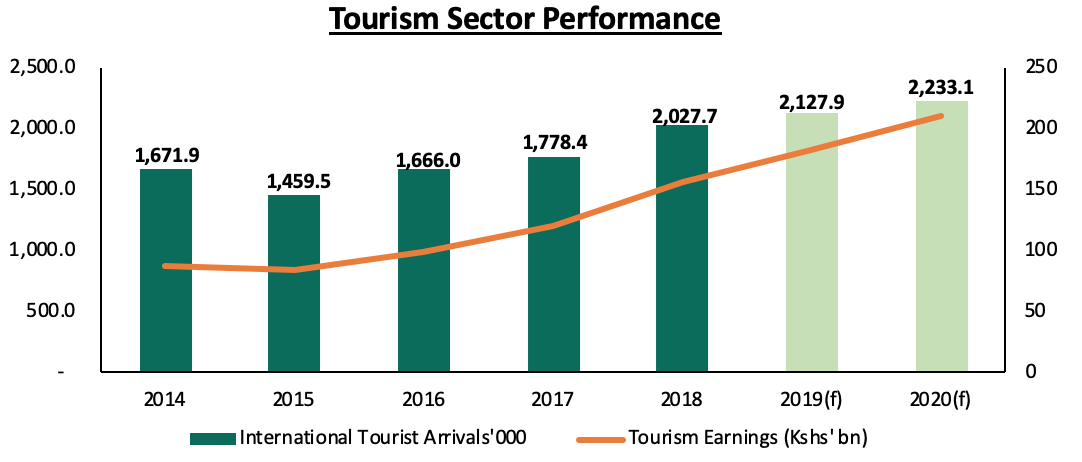
Source: Kenya National Bureau of Statistic
We expect the sector to remain vibrant in 2020 and based on the KNBS historical data, we expect that international arrivals will grow by 4.9% on average to 2.1 mn and 2.2 mn for 2019 and 2020, respectively, boosted by:
- The recent pledge by the UK government to abolish travel advisories on Kenya, which tend to have a grave impact on the economy and more so on the hospitality sector’s performance, and,
- The calm political environment and improved security, which have continued to boost tourists’ and investors’ confidence in the country.
Overall, we expect the real estate sector to continue improving with pockets of value in themes such as affordable housing, hospitality sector and select retail markets, boosted by; (i) rapid urbanization, growing middle class and thus, increased consumerism, (ii) Kenya’s attractive economic projections compared to global markets, with Kenya among the countries expected to spearhead growth in the Sub Saharan Africa (SSA) region with GDP growth expected to come in at 5.7% in comparison to SSA’s projections of 2.9%, and (iii) government’s investor-friendly incentives and regulations for real estate investors.
In 2017 we reviewed the real estate industry and prepared two topical pieces, Is There a Real Estate Bubble in Kenya? and What Real Estate Bubble?, addressing speculations that the property market was experiencing a bubble. According to the two topical reports, the Kenyan real estate market was still in its nascent stage and was just being institutionalized. The Kenyan market was thus, not experiencing a bubble but the normal real estate cycles of rising demand, peaking market, falling market then bottoming out. The rapid price increments witnessed were attributed to the real estate market being in the rising phase that was characterized by low supply and high demand leading to an increase in prices. This week, we revisit the topic by reviewing the current state of the market.
It is evident that the property market in Nairobi has been burgeoning, with buildings stretching far and beyond. In the recent years, the Nairobi Metropolitan Area has recorded increased development activities, and the same is evident throughout the country. According to Kenya National Bureau of Statistics (KNBS), the real estate sector grew by 4.8% on average from Q1’2019 to Q3’2019, 0.3% points higher than the growth rate recorded over the same period in 2018. In terms of performance, the sector continues to record relatively high returns with the 5-year average coming in at 20.1% p.a., compared to traditional assets at 8.7% p.a. This has been boosted by;
- The availability of development class land,
- Continued demand for both residential and commercial property,
- Positive demographics, with the population growing at an estimated rate of 2.2% p.a. compared to the global average of 1.2% p.a., in addition to a relatively high urbanization rate of 4.3% p.a. compared to the global average of 2.0% p.a.,
- Continued entry and expansion of multinationals companies, fueling the demand for commercial and residential space,
- The improved ease of doing business, with the World Bank ranking Kenya as #56 in their 2019 Ease of Doing Business Ranking, from #61 in 2018 out of 190 countries, and,
- The improving infrastructure, which has continued to open-up areas for development.
Despite the above, real estate firms have been reporting decline in residential units’ occupancy rates especially in the high-end market segment, while the commercial office and retail sector have continued to record an oversupply estimated at 5.6 mn and 2.8 mn SQFT, respectively. This has resulted in speculation that Kenya’s property market is having a bubble or headed there. With the aim of addressing the same, this week, we shall look into;
- Introduction – What is a Real Estate Bubble?,
- Case Studies (Poland and Japan Property Bubbles),
- Overview of the Current State of the Kenyan Real Estate Market, and,
- Conclusion.
- Introduction – What is a Real Estate Bubble?
A real estate bubble is defined as a run-up in property prices fueled by demand, speculation, and exuberant spending, bringing the sector to the point of collapse. It usually starts with an increase in demand for property, in the face of limited supply, which takes a relatively extended period to replenish and increase. Speculators bring in money into the market, further driving up demand. At some point, the demand decreases or stagnates at the same time supply increases, resulting in a sharp drop in prices, and the bubble bursts. A housing bubble has been witnessed in mature, first world economies such as Japan, Poland, United States of America, Australia and China.
A real estate bubble is characterized by;
- A Rapid Increase in Property Prices - The increase in prices is driven by speculation and impulsive pursuit driven by “investors” who want to accumulate property as they expect to reap from capital gains in future. Therefore, for a market to develop a bubble, there must be an impulsive buyer and a shallow market. As opposed to deep markets, which can absorb temporary supply shocks, a shallow market tends to react wildly to shortages or gluts in supply. Prices can shoot up quickly until they outperform other elements of the economy and then drop just as fast,
- Easy Access to Credit - Availability of cheap and affordable loans, which means inordinate credit growth in the market, increasing the demand for property, and thus, prices increase to unsustainable levels, and,
- Changes in the Credit Market - This is mainly in the form of an increase in interest rates leading to an increase in defaults levels and non-performing loans, which exposes the banking system. This results into reduced credit supply, and hence, demand suddenly falls leading to a sharp fall in prices, and loss of value for homeowners, speculators and lenders. At this point, the bubble is said to have burst.
- Case Studies
Having looked at what a real estate bubble is and its characteristics, we now shift our focus to case studies of Poland and Japan, which experienced property bubbles that eventually burst in 2008 and 1991, respectively. The two markets were mainly characterized by availability and affordability of credit, which resulted in a relatively high demand for property outstripping the supply.
- Poland Property Bubble
The property market in Poland experienced a housing boom following Poland’s ascension to the European Union in December 2002. Polish banks relaxed their financial regulations by making credit more readily available leading to historically low rates on the mortgage loans. The property boom was mainly driven by:
- Increase in Mortgage Tenors - Banks increased maximum mortgage loan tenors from 30 to 50-years, resulting in increased mortgage uptake by households,
- Foreign Currency Denominated Loans – A large proportion of mortgages were foreign currency-denominated in currencies and comprised about 22.0% of the total loan portfolio and more than half of the mortgages, according to the International Monetary Fund (IMF). Most of the foreign currency loans mainly comprised of Swiss Franc loans, which were preferred due to the Swiss currency devaluation between 2004 and 2008 and the Swiss Franc had lower average interest rates of 4.4% compared to the Polish Zloty of 8.7% as at 2008, and
- Government Interest Rate Subsidies – In order to mitigate exchange rate risks as a result of high uptake of foreign loans, the Polish government in 2005 subsidized interest payments on local currency loans for the first eight years of the loan for first time home buyers of new housing, resulting in 2.3% points decline in interest rates to 5.8% in Q2’2006, from 8.1% in Q1’2005. This led to increased mortgage loan uptake with speculators paying as much as 10% - 20% as deposits and taking up entire phases of off-plan developments.
As a result, residential prices rose rapidly with the average residential prices increasing by a 2-year CAGR of 13.1% between 2006 and 2008. According to REAS JLL, a real estate management services firm, residential prices in the Polish capital, Warsaw, rose by 23.0% in 2005, 28.0% in 2006, 45.0% in 2007, and 13.0% in 2008.
The residential market bubble was pricked during the global recession of 2008 as the country’s GDP growth rate declined by 1.5% while the residential market prices dropped by 13.8% between 2008 and 2013. This was attributed to a decline in the value of the local currency, the Zloty (PLN), which resulted in relatively high mortgage service costs, thus, borrowers were not able to service their mortgages.
- Japan Property Bubble
The Japanese asset price bubble lasted approximately 6-years from 1986 to 1991 during which real estate prices were greatly inflated with land recording an annual appreciation of approximately 42.0%, driven by speculation. In early 1992, this price bubble burst and Japan's economy stagnated and property prices deflated through to 2001 and the 10-year period was known as "Japan's Lost Decade". The bubble mainly impacted the Tokyo Metropolis and was characterized by; (i) rapid acceleration of real estate prices, resulting from overheated property transactions with the demand outstripping the supply, (ii) relatively low interest rates which encouraged uptake of mortgages and hence increased the demand for housing units in the market, and (iii) speculation regarding property prices.
The main causes of the bubble were;
- Financial Liberalization - In 1983, the United States and Japan Committee for Yen and U.S. Dollar was established to reduce the friction in exchange rate between the Japanese Yen and U.S. Dollar. Through this committee, the U.S. demanded Japan to deregulate and ease restrictions on financial and capital transactions. As a result, the restriction on future exchange transaction was removed and it became possible for not only banks but companies to be involved in currency trading. Later in the same year, regulation on converting foreign funds into Japanese Yen was also eliminated. The abolition of financial restrictions in Japan opened Japanese financial markets to those overseas, and the demand for Japanese Yen increased accordingly. At the same time, there was increasing number of loans by from banks to companies on real estate investment purpose,
- Excessive Monetary Easing Policy - Japan recorded a significant drop in short-term interest rates, notably between 1986 and 1987, with the Bank of Japan slashing the official discount rate from 5.0% (January 30, 1986) to 2.5% (February 23, 1987). As a result, money growth increased rapidly, from a growth of 8.0% for the period between 1985 to 1987 period, to 12.0% per annum by 1988. The lower rates encouraged uptake of mortgages and hence increased the demand for housing units in the market,
- Distortion of the Tax System - Minimal property taxes, in addition to expectations that land prices were likely to increase, fueled speculation and resulted in hoarding of land. For instance, given that capital gains on land were not taxed until the time of sale, offered more incentives for wealthy individuals to speculate on the asset price. In addition, land leasehold contracts automatically renew unless the landlord provides concrete reasoning to object. In the event of a dispute between the lessee and tenant, courts intervene and if the rent is set by the court, it meant landlords could not raise the rent more than the actual market price. Hence, rents are kept artificially low and thus, many landlords refused to rent out their land given the relatively low discount prices, but rather left the land deserted to reap huge capital gains should land prices increase later. This resulted in reduced land transactions and resultant decline in housing development, thus, unstainable demand for the available property, and,
- Changes in Bank Behavior - In the 1980’s, more Japanese opted to shift funding from banks to the capital markets, given that banks were not allowed to pay interest on deposits prior to the 1985 deregulation of interest rates on deposits and following the lift of a previous ban on fund-raising in the securities market. This left banks in a tight squeeze as banking spread grew smaller with the shrinking customer base, thus, banks were forced to aggressively promote loans to individuals and smaller firms backed by properties, and this resulted in a relatively high loan uptake with the value estimated to have grown by approximately 67.9% from 1984 to 1991.
The ultra-low interest rates and relatively high money supply in the market, fueled a housing bubble in Japan by driving demand for property which eventually outstripped the supply, and resulted in a significant rise in prices of property with land and residential properties recording an annual appreciation of approximately 42.0% and 10.0%, respectively. It eventually became too expensive for the general population to afford property, which resulted in lower demand hence, property prices declining tremendously. For instance, land values corrected throughout the 1990s, by approximately 70% by 2001, and the property bubble was said to have burst.
- Overview of the Current State of the Kenyan Real Estate Market
In the two case studies, real estate prices increase in response to the heightened demand and investment leading to a boom period which creates a period of irrational excitement with people demanding and taking credit to purchase houses.
For the Kenyan market, we believe this is not the case, and this is supported by;
- Inaccessibility and Unaffordability of Credit - In the Japanese market, at the time of the bubble, there was excessive lending with credit being extended to un-creditworthy individuals as long as one had property to use as collateral. In Kenya, there are stringent underwriting rules and credit is extended to only creditworthy individuals. Mortgages constitute 1.0% of banks loan portfolios, an indication that the current demand for real estate is not driven by access to credit. According to the CBK’s Bank Supervision Annual Report 2018, Kenya has few mortgages –with only 26,504 mortgage loans recorded by December 2018, slightly up from 26,187 recorded in December 2017, out of a population of 47.6 mn Kenyans as at 2019.
Additionally, In Poland, the interest rates averaged at approximately 5.8%, which was a 2.3% points decline from 8.1% in 2006, leading to increased mortgage loan uptake with speculators paying as much as 10% - 20% as deposits and taking up entire phases of off-plan developments. On the other hand, in the Kenyan market, interest rates on loans have remained relatively high, over the last couple of years averaging at approximately 13.5%, with the interest rate cap, and are expected to go even higher following the repeal of the cap in 2019. It is thus high enough to prevent excessive borrowing from financial institutions or individuals to fund speculative purchase of property that may result into unsustainable demand,
- The Huge Housing Deficit- Unlike in a bubble, where most of the demand is driven by speculators, Kenya has a genuine demand of approximately 2.0 mn housing units, and has been growing annually by approximately 200,000 units, according to the National Housing Corporation with majority of the demand mainly in the low and middle-income levels. Additionally, uptake of housing units remains relatively high at approximately 20.9% per annum on average, according to Cytonn Research, whereas, on the other hand, a bubble is characterized by poor property uptake of as low as 0% - 10.0%,
- Positive Demographics - Kenya has a relatively high annual population growth rate estimated at 2.2%, compared to the global average of 1.2%, while the annual urbanization rate has averaged at 4.3% over the last five years, compared to the global average of 2.0%. In addition, Kenya has also seen exponential middle-class growth, which comprises of people who are able to access financing for real estate acquisition and are able to construct their own homes. We expect this to enhance demand and thus, a resultant supply aimed at serving the population, thus deepening of the real estate market and enhancing its ability to absorb temporary supply shocks,
- Availability of Development Class Land - There is availability of development class land in Kenya especially in the satellite towns at relatively affordable prices and in bulk, and this continues to allow for development activities outside the Nairobi CBD, and thus cushion the real estate market from unsustainable demand for property that would otherwise cause the prices to skyrocket,
- Regulatory Measures - In the Kenyan market, there exists the Capital Gains Tax which pressurizes land owners to release land for development rather than hold on to it, while awaiting its appreciation. Other policy reforms include the adoption of a new valuation method in 2019 by the Nairobi County, which adjusted the land rates to 25.0% of the current property value as opposed to the previous unimproved site value based on the 1980 valuation roll. These measures continue to support real estate development and thus, eliminate the chances of the demand for property outdoing supply, and
- Entry and Expansion of Local Firms and Multinationals - The Kenya commercial office and retail market has continued to record entry and expansion of both local and international firms, resulting in the continued uptake of commercial spaces. Therefore, despite the current oversupply, which has continued to result in marginal decline in rental prices as landlords seek to attract tenants and maintain their occupancy rates, we do not anticipate property prices to drastically drop, as the continued entry and expansion of international retailers and multinationals continue to enhance uptake of commercial space and thus, cushion the sectors.
Currently there exists an oversupply of space in the commercial office and retail sectors estimated at 5.6 mn SQFT and 2.0 mn SQFT, respectively. We attribute the surplus to relatively low uptake of space as compared to the existing supply. However, the market has continued to witness increased entry and expansion of multinationals, local and international retailers, such as French Retailer Carrefour and South African Shoprite, who have continued to take up available retail space. In addition, the market has witnessed a slow-down in incoming supply with no new developments expected to come into the retail market in 2020 and thus, we expect the market to absorb the surplus supply in the short- term. For the residential market, in Kenya, there is a need for over 200,000 houses annually according to the National Housing Cooperative (NHC) with Nairobi experiencing deficit of about 120,000. Approximately 35,000 houses are constructed each year in Nairobi meaning there is an unmet demand of 85,000 houses annually in Nairobi and its metropolis. The demand clearly outweighs the supply indicating that there is no bubble in the market and no burst is likely to be experienced, at least in the medium to long term. The sector’s resilience will thus, be backed by fundamentals that determine the demand for real estate products. There could be oversupply in some markets, especially in the upper middle income areas. Investors should conduct proper market research to identify the pockets of value.
- Conclusion
In conclusion, real estate prices increase in response to the increased demand and investment leading to a boom period, which creates a period of irrational excitement with people demanding and taking credit to purchase houses. That said, we do not foresee a real estate bubble occurring in Kenya, as the market is still constrained by issues such as unavailability of credit and relatively high interest rates, tight credit underwriting standards, inaccessibility of mortgage financing and thus, there lacks the possibility of unsustainable demand that will supersede the current supply across all the sectors.
Currently, the sector is just experiencing the normal real estate cycles, and the rapid price increments and declines being witnessed are a result of low supply and high demand, and vice versa in select sectors. Therefore, the real estate market still has pockets of value:
- For direct long-term investors, the opportunity lies in; (a) differentiated concepts such as the shared offices, Grade A office spaces and serviced apartments which are in low supply and present attractive returns to investors, (b) land banking especially in satellite towns where land is available at affordable prices and in bulk in the wake of improving infrastructure, and (c) low to mid end residential market where there lies a huge demand,
Below is a summary of the specific themes and nodes:
|
The Key Areas of Opportunities by Theme in Real Estate Sector |
|||
|
Sector |
Themes |
Locations |
Reasons |
|
Residential Sector |
High-End (Detached) |
Runda, Karen |
Annual returns at 6.4% and 5.5%, respectively, against the high-end market average of 5.0% For speculative buyers, Karen and Kitisuru recorded the highest annual uptake in this segment with 21.0% and 21.8%, respectively, against the high-end market average of 19.9% |
|
Upper Mid-End (Detached) |
Runda Mumwe, Ridgeways/Garden Estate |
Relatively high uptake at 22.7% and 25.0%, respectively. The areas also have relatively low supply coupled by availability of development land in comparison to other upper mid-end areas such as Lavington and Lang’ata |
|
|
Upper Mid-End (Apartments) |
Parklands, Kileleshwa |
Relatively high annual returns of 7.5% and 7.1%, respectively, against upper mid-end market average of 6.1% |
|
|
Low-End (Detached) |
Athi River, Kitengela |
Relatively high returns averaging 7.1% and 7.0%, respectively, in comparison to the respective market average of 6.6% |
|
|
Low-End (Apartments) |
Thindigua, Ruaka, Athi River |
Relatively high annual returns and uptake of up to 8.2% and 21.0%, respectively |
|
|
Commercial Office Sector |
Grade A Offices |
Gigiri, Karen |
Relatively low supply, proximity to commercial hubs and high yields of 9.2% and 8.3%, respectively |
|
Serviced Offices |
Westlands |
Prime commercial hubs with high occupancy of 85.5% and yields of 15.8% |
|
|
Retail Sector |
Suburban Malls |
Counties such as Mt. Kenya Regions and Kiambu |
Mt. Kenya Regions and Kiambu with attractive yields at 8.6% and 8.0% and occupancy rates at 82.3% and 79.4%, respectively |
|
Mixed Use Developments (MUDs) |
MUD |
Kilimani, Limuru Road |
Affluent neighborhoods with high rental yield return of 9.1% and 8.0%, respectively |
|
Hospitality Sector |
Serviced Apartments |
Westlands & Parklands, Kilimani |
Relatively high rental yields of above 10.8% and 9.5%, respectively, compared to the market average of 7.6% |
|
Land Sector |
Satellite Towns |
Utawala and Limuru |
Relatively high capital appreciation of above 10.0% y/y, the provision of trunk infrastructure such as road networks and the growing demand for development land |
|
Suburbs |
Karen, Runda, Kitisuru and Kilimani |
Relatively high capital appreciation of above 10.0% y/y and proximity to amenities |
|
Source: Cytonn Research
- Alternative investment firms also offer other ‘sharp’ ways in the form of client-based structured products such as:
- A short to medium-term debt obligation issued to finance a project or multiple projects such as Cytonn Project Notes (CPN), and
- Real Estate Backed Medium-Term Notes (MTN), a debt note that usually matures in 5–10 years and is backed by cash flows from Real Estate projects.
Disclaimer: The views expressed in this publication are those of the writers where particulars are not warranted. This publication is meant for general information only and is not a warranty, representation, advice or solicitation of any nature. Readers are advised in all circumstances to seek the advice of a registered investment advisor.

- Talk to us
- Kenya
- P.O Box 20695 - 00200, Nairobi, Kenya
- Cell +254709101200
- Tel +254709101200
- WhatsApp +254741676635
- United States
- +254709101200
- DOWNLOAD OUR APP
-


- Kenya
- 8th Floor, Pinetree Plaza, Kaburu Drive, Ngong Road, Nairobi, Kenya
- USA
- Suite 1150, 1775 Eye Street NW, USA, Washington DC 20006, USA
- Investments
- High Yield
- Private Equity
- Real Estate
- Real Estate
- RiverRun Estates
- Cytonn Towers
- The Ridge
- Taraji Heights
- The Alma