Karen Investment Opportunity, & Cytonn Weekly #04/2019
By Cytonn Research Team, Jan 27, 2019
Executive Summary
Fixed Income
T-bills were over-subscribed during the week, with the overall subscription rate coming in at 170.2%, an increase from 161.4% recorded the previous week. The over-subscription in all the auctions since the beginning of the year has partly been attributed to the improved liquidity in the market, driven by debt maturities as well as government payments. There was a mixed performance in subscription rates across the board with the 91-day and 182-day papers falling to 123.8% and 107.3% from 180.8% and 138.8% recorded the previous week, respectively, while the 364-day paper subscription rates improved to 251.7% from 176.2% recorded the previous week. The Monetary Policy Committee (MPC) is set to meet on Monday, 28th January 2019, to review the prevailing macro-economic conditions and make a decision on the direction of the Central Bank Rate (CBR). We are of the view that the MPC will adopt a wait and see approach given the macroeconomic environment is relatively stable and as such, we expect the Central Bank Rate (CBR) to be retained at 9.0%;
Equities
During the week, the equities market was on an upward trend with NASI, NSE 20 and NSE 25 gaining by 0.8%, 2.0% and 0.8%, respectively, taking their YTD performance to 4.3%, 2.6% and 4.9%, for NASI, NSE 20 and NSE 25, respectively. During the week, the Capital Markets Authority (CMA) and the Nairobi Securities Exchange (NSE) suspended a law that allowed listed companies to buy back their own shares from the capital markets with the regulators noting that the law would erode market liquidity, provide a window for companies to manipulate share prices and generally stiffle activity at the bourse;
Private Equity
In the financial services sector, Britam Asset Managers bought an undisclosed stake worth Kshs 1.4 bn in electricity-producing company Gulf Energy, through New York-based Everstrong Capital, in a bid to diversify its portfolio into the energy sector. In fundraising, (i) Holland-based Goodwell Investments has pumped USD 2.0 mn in Kenyan firm Copia, which provides a goods catalogue and delivery services to remote (underserved) customers. The investment will aid Copia in growing its market share while expanding its services to more countries in the African continent; and (ii) Andela, which builds engineering teams with African developers, has concluded a Series D funding exercise that raised USD 100.0 mn, to be used for talent development and deployment of new resources to enhance developer performance for customers;
Real Estate
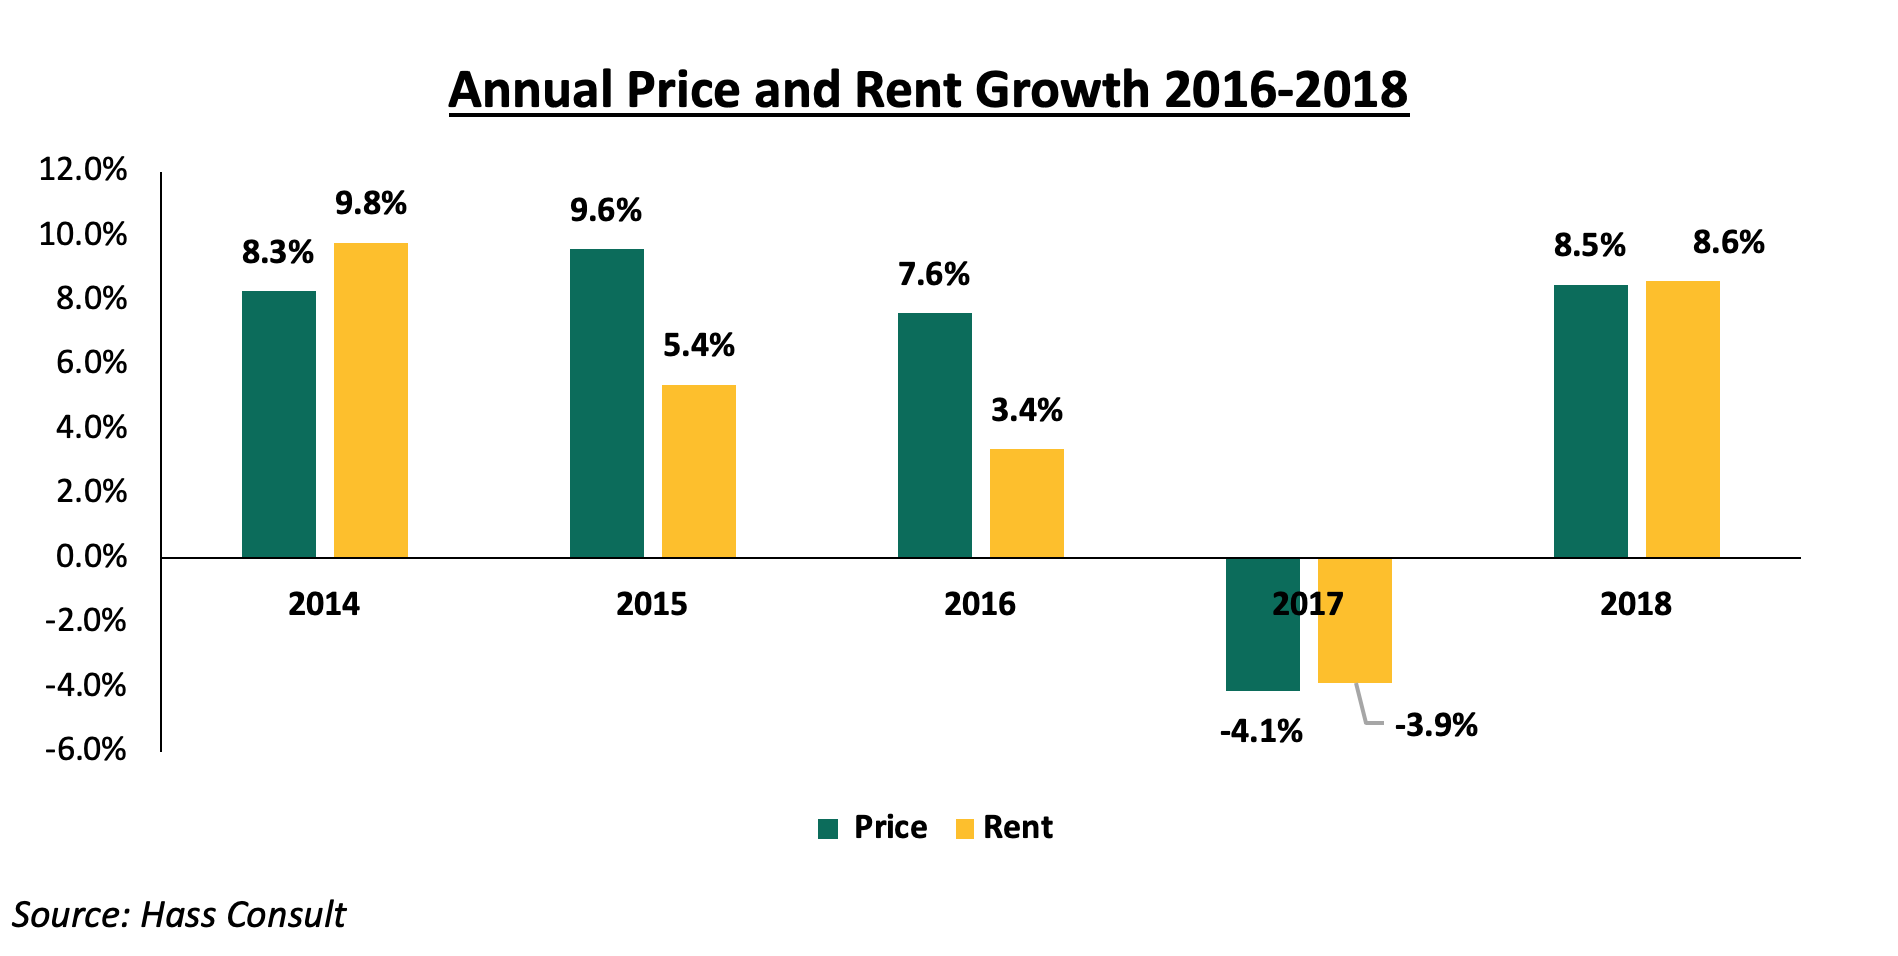
This week, Hass Consult released their House Price and Land Index Q4’2018. According to the report, land price growth in Nairobi softened in 2018 with Nairobi suburbs and Satellite Towns recording an annual growth of 1.1% and 3.7%, respectively, compared to 2017’s increase of 3.3% and 5.4%, respectively. House prices and rents increased by 8.5% and 8.6%, respectively, compared to the depreciation registered in 2017 of 4.1% and 3.9%, respectively, as apartments registered an 8-year high in rents increase of 15.9%. Also during the week, the Kenyan Government announced the inclusion of high income-earners of Kshs 100,000 and above, in the affordable housing initiative;
Focus of the Week
In this week’s topical, we update our research findings on the Karen real estate market by looking at the factors that have contributed to its attractiveness to investors and analyzing the potential returns to investors in the area. We have expanded our coverage of Karen’s real estate performance by also looking at the commercial office and retail sectors. From Cytonn Research conducted in December 2018, the average total returns in the Karen residential market came in at 8.8% (rental yield of 4.1% and price appreciation of 4.7%), against high-end market’s average of 6.4%, while the office and retail sectors registered average rental yields at 9.2% and 11.0%, respectively, against the Nairobi office and retail market averages of 8.1% and 9.0%.
- As announced in November 2018, Cytonn High Yield Solutions LLP, the Cytonn affiliate that offers investors high yield returns through investment grade real estate will be reducing its rates by 2% across the board; this will be effective February 1, 2019. To maintain the current rates, kindly contact your financial advisor to rollover your investments before February 1, 2019;
- Following the completion and handover of Amara Ridge, we have now launched Applewood, our Kshs 2.5 bn residential development located in Miotoni, Karen. This signature development shall comprise luxury homes, each sitting on 1/2 acre. We invite you to the exhibition of Applewood which will be at the Amara Ridge Clubhouse (Location pin: https://goo.gl/maps/B3GVnu8pHyn) from 9:00 am to 5:00 pm daily and will end on 28th Feb 2019.
Call 0709 101 000 or email resales@cytonn.com to reserve a villa! See Video here; - We continue to hold weekly workshops and site visits on how to build wealth through real estate investments. The weekly workshops and site visits target both investors looking to invest in real estate directly and those interested in high yield investment products to familiarize themselves with how we support our high yields. Watch progress videos and pictures of The Alma, Amara Ridge, and The Ridge. Key to note is that our cost of capital is priced off the loan markets, where all-in pricing ranges from 16.0% to 20.0%, and our yield on real estate developments ranges from 23.0% to 25.0%, hence our top-line gross spread is about 6.0%. If interested in attending the site visits, kindly register here;
- We continue to see very strong interest in our weekly Private Wealth Management Training (largely covering financial planning and structured products). The training is at no cost and is open only to pre-screened participants. We also continue to see institutions and investment groups interested in the training for their teams. Cytonn Foundation, under its financial literacy pillar, runs the Wealth Management Training. If interested in our Private Wealth Management Training for your employees or investment group, please get in touch with us through wmt@cytonn.com. To view the Wealth Management Training topics, click here;
- For recent news about the company, see our news section here;
- We have 10 investment-ready projects, offering attractive development and buyer targeted returns of around 23.0% to 25.0% p.a. See further details here: Summary of Investment-Ready Projects;
- We continue to beef up the team with ongoing hires for Financial and Real Estate Advisors for our offices in Nairobi, Nakuru, Kisumu, and Nyeri. Visit the Careers Section on our website to apply.
T-Bills & T-Bonds Primary Auction:
T-bills were over-subscribed during the week, with the overall subscription rate coming in at 170.2%, an increase from 161.4% recorded the previous week. The over-subscription in all the auctions since the beginning of the year has partly been attributed to the improved liquidity in the market, driven by debt maturities as well as government payments. There was mixed performance in subscription rates across the board with the 91-day and 182-day papers falling to 123.8% and 107.3% from 180.8% and 138.8% recorded the previous week, respectively, while the 364-day paper subscription rates improved to 251.7% from 176.2% recorded the previous week. The yields on the 91-day paper remained unchanged from the previous week at 7.1%, while yields on the 182-day and 364-day papers declined to 8.8% and 9.9% from 8.9% and 10.0% recorded the previous week, respectively. The acceptance rate declined to 65.0%, from 73.6% recorded the previous week, with the government accepting Kshs 26.5 bn of the Kshs 40.8 bn worth of bids received.
This week, the Kenyan Government issued two bonds; issue number FXD 1/2019/2 and issue number FXD 1/2019/15, with tenors of 2.0-years and 15.0-years, both with market determined coupon rates. The government was seeking to raise Kshs 40.0 bn from the two bonds for budgetary support. The two bond issues were over-subscribed with an overall subscription rate of 254.9% with bids worth Kshs 102.0 bn received against the Kshs 40.0 bn on offer. The 2-year bond had a better performance with total bids of Kshs 76.9 bn compared to Kshs 25.1 bn worth of bids for the 15-year bond, an indication of the high demand in the shorter-term papers. The government accepted Kshs 38.5 bn out of the Kshs 102.0 bn worth of bids received against Kshs 40.0 bn on offer, translating to an acceptance rate of 37.7%, indicating that bids were largely not within ranges the Central Bank of Kenya (CBK) deemed acceptable. The average accepted yield for the 2-years and 15-years issue came in at 10.7% and 12.9%, respectively. This was within target of our expectation of between 10.7% - 10.9% and 12.6% - 12.9% for the 2-year and 15-year bonds, respectively.
We are of the view that the continued issuance of medium to long-term domestic securities is well guided as lengthening the average maturity will reduce the potential rollover risks in the medium term. The issuance of medium to long-term securities have however been having a lacklustre performance, which we attribute to the saturation of long-end offers, leading to a relatively flat yield curve on the long-end and the government will need to offer more incentive for the long-term bonds by increasing the yields to attract investors.
Liquidity:
The average interbank rate rose to 3.2%, from 2.7% the previous week, while the average volumes traded in the interbank market rose by 12.2% to Kshs 14.8 bn, from Kshs 13.2 bn the previous week. The higher interbank rate points to tightening liquidity conditions experienced during the start of the week as the market recovered from tax payments due on 20th of every month. Despite the rise in the interbank rate, the money market remained relatively liquid with commercial banks recording excess reserves of Kshs 21.9 bn in relation to the 5.25% cash reserves requirements (CRR) supported by government payments and debt redemptions.
Kenya Eurobonds:
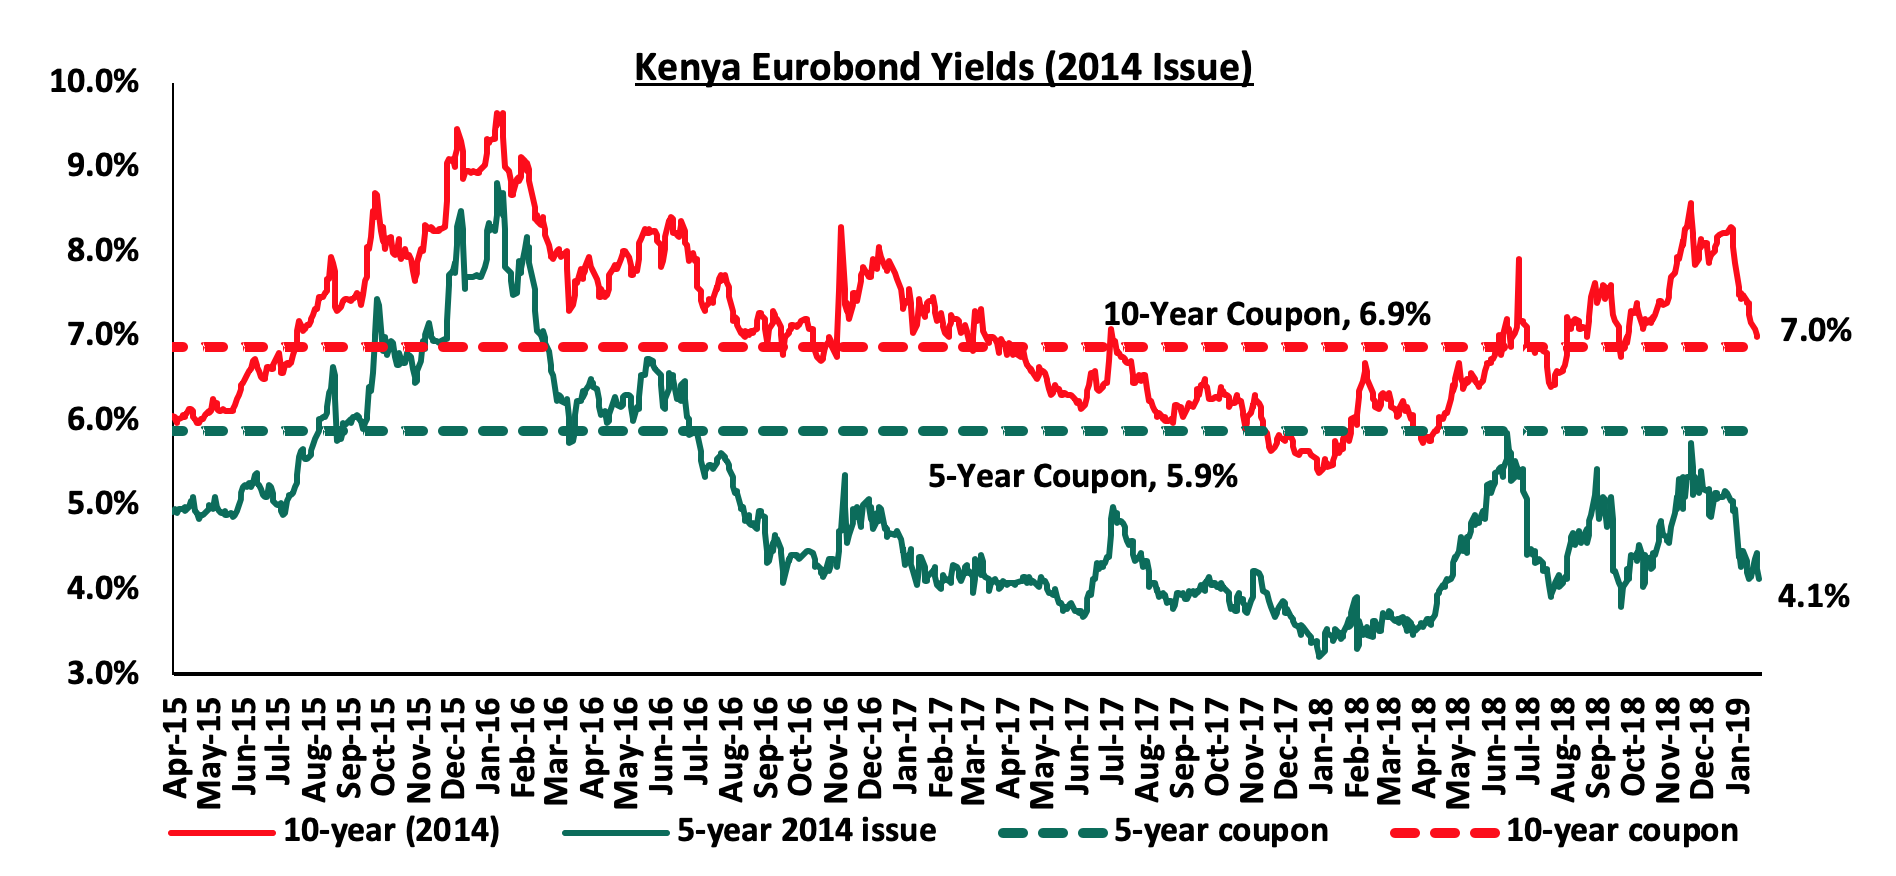
According to Bloomberg, the yields on the 5-year Eurobond issued in 2014 remained unchanged at 4.1% while the 10-year Eurobond declined by 0.3% points to 7.0% from 7.3% the previous week. Since the mid-January 2016 peak, yields on the Kenyan Eurobonds have declined by 2.6% points and 4.7% points for the 10-year and 5-year Eurobonds, respectively, an indication of the relatively stable macroeconomic conditions in the country. Key to note is that these bonds have 0.4-years and 5.4-years to maturity for the 5-year and 10-year, respectively.

For the February 2018 Eurobond issue, during the week, the yields on both the 10-year and 30-year Eurobonds declined by 0.3% points and 0.2% points to 7.6% and 8.8% from 7.9% and 9.0% the previous week, respectively. Since the issue date, the yield on the 10-year Eurobond has increased by 0.4% points while that of the 30-year Eurobonds has increased by 0.5% points.
Kenya Shilling:
During the week, the Kenya Shilling appreciated by 0.6% against the US Dollar, to close at Kshs 101.1, from Kshs 101.7 recorded the previous week, which was attributed to inflows from diaspora remittances, which subdued the thin oil importer demand. The Kenya Shilling has appreciated against the US Dollar by 0.7% year to date, and in our view the shilling should remain relatively stable to the dollar in the short term, supported by:
- The narrowing of the current account deficit to 5.3% in the 12-months to September 2018, from 6.5% in September 2017, attributed to improved agriculture exports, increased diaspora remittances and strong receipts from tourism,
- Improving diaspora remittances, which increased by 38.6% in 2018 to USD 2.7 bn, from USD 1.9 bn recorded in 2017. The rise is due to; (a) increased uptake of financial products by the diaspora due to financial services firms, particularly banks, targeting the diaspora, and (b) new partnerships between international money remittance providers and local commercial banks making the process more convenient,
- CBK’s activities in the money market, such as repurchase agreements and selling of dollars, and,
- High levels of forex reserves, currently at USD 8.1 bn, equivalent to 5.3-months of import cover, compared to the one-year average of 5.1-months and above the EAC Region’s convergence criteria of 4.5-months of imports cover.
Monetary Policy Committee Meeting:
The Monetary Policy Committee (MPC) is set to meet on Monday, 28th January 2019, to review the prevailing macro-economic conditions and make a decision on the direction of the Central Bank Rate (CBR). Key factors that will shape MPC’s decision include:
- Inflation that has averaged 4.7% in 2018 compared to 8.0% experienced in 2017, and is expected to remain within the government target of 2.5%-7.5%, anchored by lower food prices, reflecting favorable weather conditions, the decline in international oil prices, and the downward revision in electricity tariffs,
- The currency that gained by 1.3% since the last meeting on 27th November 2018 to Kshs 101.1 from Kshs 102.5, supported by improved diaspora remittances coupled with thin dollar demand from oil importers, and,
- The macroeconomic environment that has remained relatively stable despite the low private sector credit growth, which recorded a recovery in 2018, rising to an average of 3.4% in the 10 months to October from an average of 2.3% recorded in a similar period in 2017. This pointing to a recovery albeit slow and still way below the 5-year average of 12.4%.
We are of the view that the MPC will adopt a wait and see stance given the macroeconomic environment is relatively stable. We expect the MPC to hold the Central Bank Rate (CBR) at 9.0% with their decision being supported by:
- Inflationary pressure expected to be muted in 2019, anchored by the declining food prices due to the improved weather conditions as well as a decline in fuel prices due to lower global prices with Petrol, Diesel and Kerosene prices having already declined by 8.2%, 8.9% and 3.3%, respectively for the period effective 15th January- 14th February, 2019,
- The stability of the Kenyan Shilling, being among the best performing currencies in 2018, having gained by 1.8% against the dollar which saw the IMF reclassifying it, from a floating arrangement to stabilized arrangement. The Kenyan Shilling is expected to remain stable having gained by 0.7% YTD in 2019 reflecting a more stable economic environment,
- The Government is currently behind its domestic borrowing schedule having borrowed Kshs 113.0 bn against its pro-rated target of Kshs 173.0 bn. As such, we believe the MPC will maintain the CBR at the current rate with a bias to further easing in order to access domestic debt at cheaper rates. This however might have adverse effects of further crowding out of the private sector, and,
- Private sector credit growth has recorded a recovery, rising to an average of 3.4% in the 10 months to October from an average of 2.3% recorded in a similar period in 2017, with growth coming in at 4.4% in October 2018 from 3.9% recorded in September, but still remains below the 5-year average of 12.4%.
The key concern however remains the effectiveness of monetary policy with the interest rate cap still in place. The Monetary Policy Committee through its assessment of the impacts of the interest rate cap noted that it has weakened the transmission of monetary policy decisions. In particular, the transmission of changes in the CBR to growth and inflation takes longer compared to the period before implementation of the interest rate cap.
For a comprehensive analysis, read our MPC Note
Inflation Projection:
We are projecting the inflation rate for the month of January to range between 3.8% - 4.2% from 5.7% recorded in December. We expect the y/y inflation to decline mainly driven by:
- The 8.2% decline in petrol prices to Kshs 104.2 from Kshs 113.5 per litre, while diesel prices declined by 8.9% to Kshs 102.2 from Kshs 112.3 per litre from the previous month. The changes in prices have been attributed to the decrease in average landing costs of imported super petrol by 14.9% to USD 590.9 per ton in December from USD 694.2 per ton in November. Landing costs for diesel also decreased by 14.7% to USD 616.0 per ton in December from USD 722.2 per ton in November,
- A marginal decline in the food and non-alcoholic index for the month of January due to a decline in prices of several food items, which outweighed the increase in others, and,
- A decline in housing, water, electricity, gas and other fuels index, as kerosene prices declined by 3.3% to Kshs 101.7 in January, from Kshs 105.2 in December. Also the effects of the lower costs in prices of electricity as from November 2018, which saw the cost of consumption of 50 KWh of electricity declining by 31.4% to Kshs 758 from Kshs 1,105 in October 2018.
Rates in the fixed income market have remained stable as the government rejects expensive bids despite being 11.5% behind its domestic borrowing target for the current financial year, having borrowed Kshs 158.2 bn against a pro-rated target of Kshs 178.7 bn. However, a budget deficit that is likely to result from depressed revenue collection creates uncertainty in the interest rate environment as any additional borrowing from the domestic market goes to plug the deficit. Despite this, we do not expect upward pressure on interest rates due to increased demand on government securities, driven by improved liquidity in the market owing to the relatively high debt maturities. Our view is that investors should be biased towards medium-term fixed income instruments to reduce duration risk associated with long-term debt, coupled with the relatively flat yield curve on the long-end due to saturation of long-term bonds.
Market Performance
During the week, the equities market was on an upward trend with NASI, NSE 20 and NSE 25 gaining by 0.8%, 2.0%, and 0.8%, respectively, taking their YTD performance to 4.3%, 2.6% and 4.9%, for NASI, NSE 20 and NSE 25, respectively. The gain in NASI was mainly driven by gains in large cap stocks such as East African Breweries Limited (EABL), Co-operative Bank of Kenya, KCB Group and Equity Group, which gained by 11.0%, 8.6%, 2.8% and 1.7%, respectively.
Equities turnover declined by 5.4% during the week to USD 32.9 mn, from USD 34.7 mn the previous week, taking the YTD turnover to USD 96.8 mn. Foreign investors remained net sellers for the week, with a net selling position of USD 0.3 mn, which is a 85.3% decrease from last week’s net selling position of USD 2.2 mn.
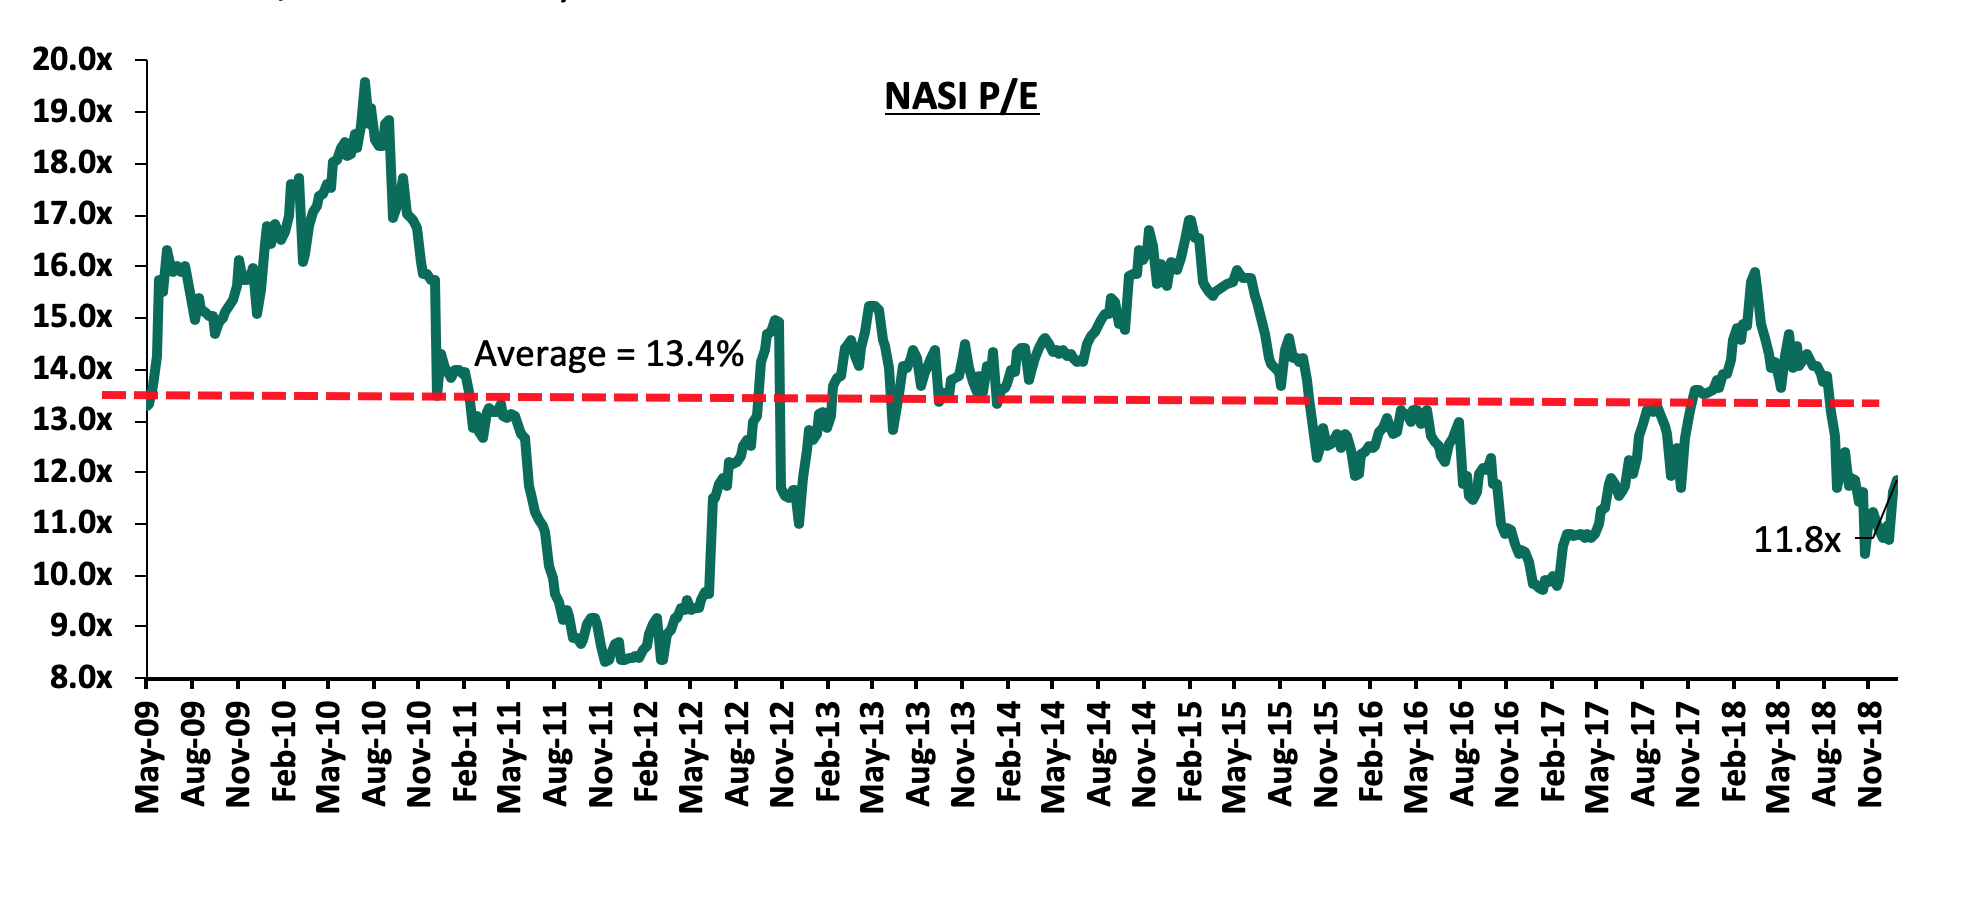
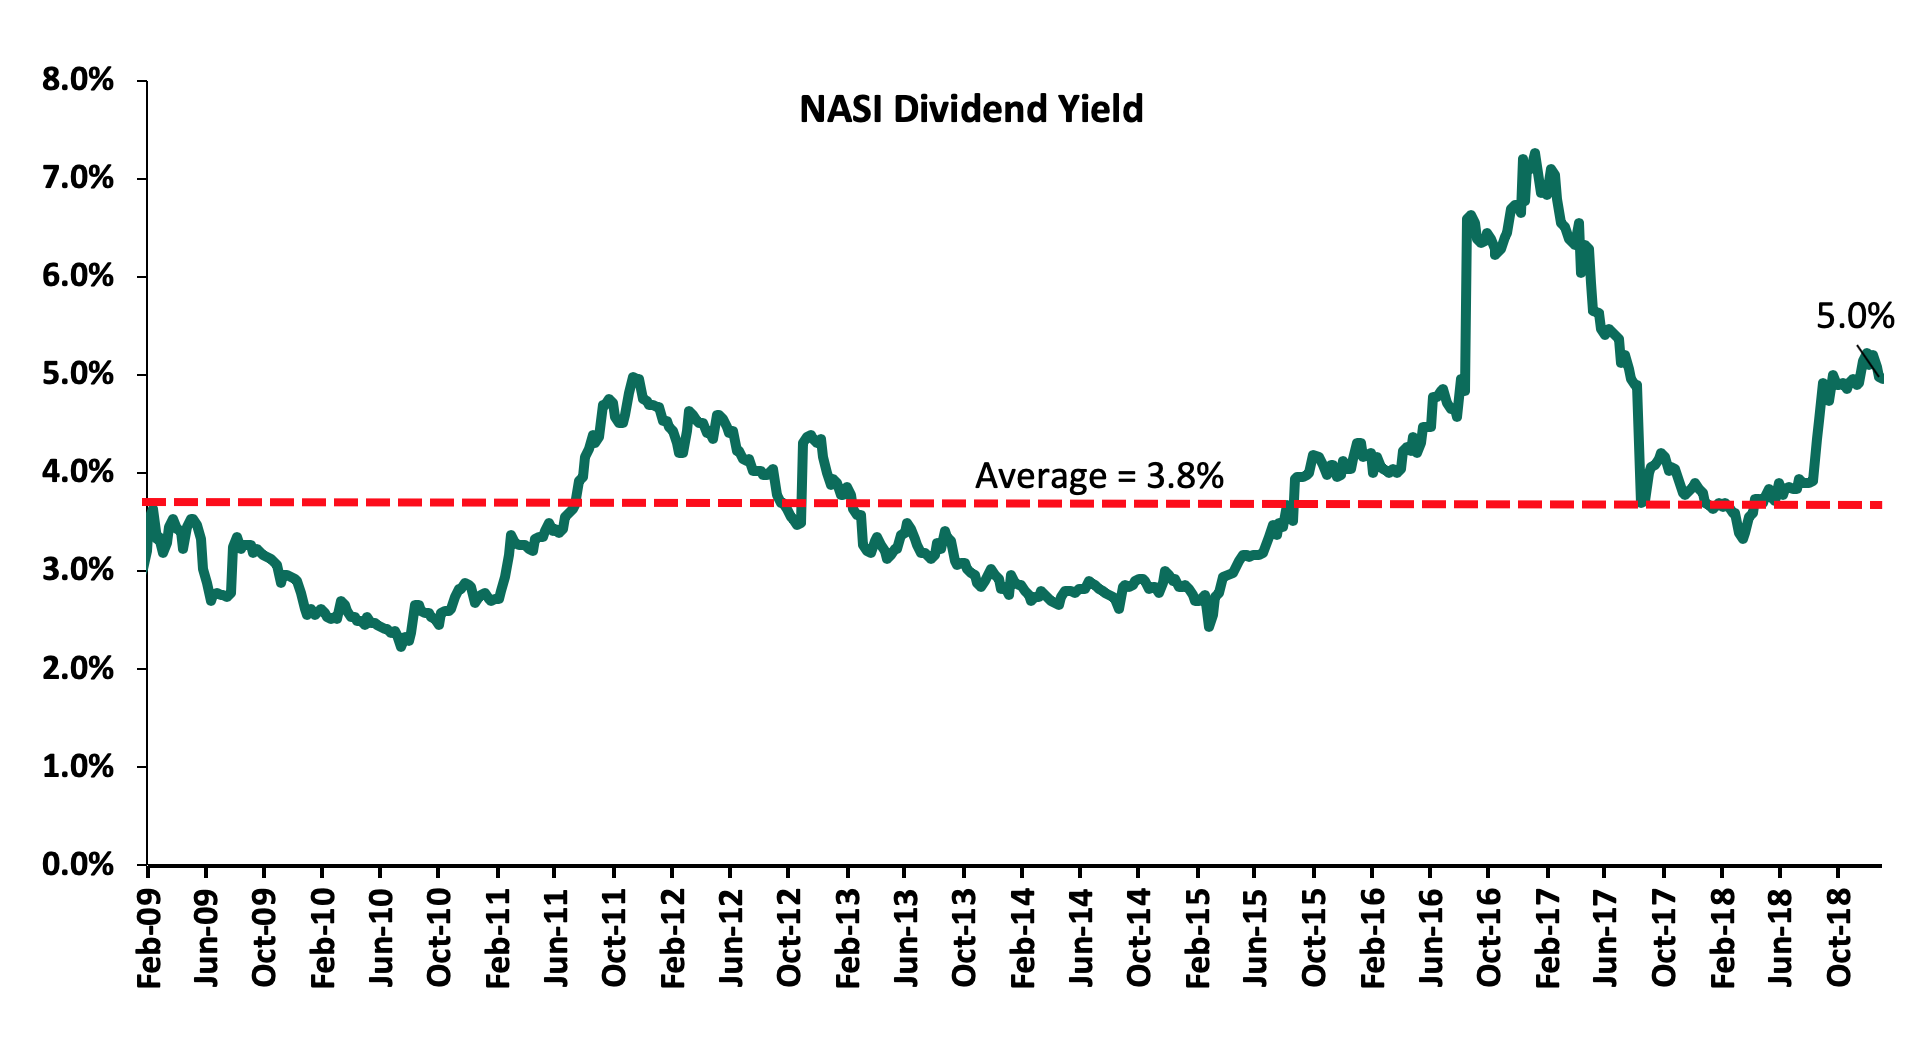
The market is currently trading at a price to earnings ratio (P/E) of 11.8x, 13.8% below the historical average of 13.4x, and a dividend yield of 5.0%, above the historical average of 3.8%. With the market trading at valuations below the historical average, we believe there is value in the market. The current P/E valuation of 11.8x is 21.6% above the most recent trough valuation of 9.7x experienced in the first week of February 2017, and 42.2% above the previous trough valuation of 8.3x experienced in December 2011. The charts below indicate the historical P/E and dividend yields of the market.
Weekly Highlights
The Capital Markets Authority (CMA) and the Nairobi Securities Exchange (NSE) have moved to fully suspend a law that allowed listed companies to buy back their own shares from the capital markets. The regulators noted that the law would erode market liquidity, provide a window for companies to manipulate share prices and generally stiffle activity at the bourse. Share buy-backs, a trading strategy that is common in Europe and the United States, are suitable for listed companies trading below book values and wish to enhance the share price and earnings per share while maintaninig policy on issuing of dividends and retained earnings. In the US, Apple Inc. spent USD 20.8 bn in share buy-back programs in Q3’2018, highighting a surge in stock buy-back in S&P 500 companies, with the total buyback authorization reaching USD 754.0 bn by the close of Q3’2018. The share buy-back law in Kenya, enacted in September 2015 as part of the New Companies Act, was suspended in November the same year after regulators noted that there was need for further work relating to mitigating against challenges expected to be brought about by the new law especially with regards to stiffling liquidity in the market. In our view, the new move is likely to lock out well-capitalized firms such as Safaricom Plc and East African Breweries Ltd, who in the past expressed a desire to repurchase shares in the market, from reducing the number of minority-held shares in the market and require them to find other avenues of improving their net asset value.
Co-op Bank, through its joint leasing partner Super Group, a South African logistics firm, announced that it concluded a deal with the Government to provide 125 vehicles, worth over Kshs. 890.0 mn, which is part of an agreement to provide 412 vehicles to the state. Through the joint venture, Co-op Bank aims to leverage on Super Goup’s capabilities in product structuring, technology and customer risk management while at the same time, Super Group will tap into the bank’s large customer base of over 8 million clients. The partnership will target collaboration of the two entities in undertaking infrastructure projects, exploration and mining activites, government leasing, and ICT. Through the joint venture, Co-op Bank is likely to stamp its presence in the leasing market, a move that will enhance the bank’s diversification strategy on growing its non-funded income that stood at Kshs. 10.6 bn in Q3’2018, a growth of 4.3% from Kshs 10.1 in Q3’2017. Co-op Bank reported a funded to non-funded income ratio of 67:33 in Q3’2018 compared to an industry average of 66:35. The broad move by the government to lease state vehicles with the aim of enhancing the cost-efectiveness of acquiring government assets, is likely to expand the leasing market paving way to new entrants including banks seeking to tap into the opportunites at hand. Banks have been making forays in various segments to grow their fee income, to try and mitigate the impact of compressed Net Interest Margins (NIMs) whose growth declined from 9.6% in 2016 to 8.3% in 2017, in the wake of the interest rate capping regime. Despite the recent push by various stakeholders to amend the Banking (Amendment) Act 2015 that is likely to improve credit growth and consequently improve interest income for banks, we expect that banks will continue diversifying their income sources by focusing on the Non-Funded Income (NFI) which include; venturing in bancassurance and transactional income from alternative channels, as the cap on interest rates remains in place.
Universe of Coverage
|
Universe of Coverage |
||||||||
|
Banks |
Price as at 18/1/2019 |
Price as at 25/1/2019 |
w/w change |
YTD Change |
Target Price* |
Dividend Yield |
Upside/Downside** |
P/TBv Multiple |
|
Diamond Trust Bank |
150.0 |
150.0 |
0.0% |
(4.2%) |
283.7 |
1.7% |
90.9% |
0.9x |
|
Ghana Commercial Bank*** |
4.5 |
4.5 |
0.0% |
(2.2%) |
7.7 |
8.4% |
80.0% |
1.1x |
|
Access Bank |
5.6 |
5.6 |
0.0% |
(17.6%) |
9.5 |
7.1% |
76.8% |
0.4x |
|
NIC Bank |
29.7 |
29.7 |
0.0% |
6.7% |
48.8 |
3.4% |
68.0% |
0.8x |
|
Zenith Bank*** |
21.5 |
21.5 |
0.0% |
(6.7%) |
33.3 |
12.6% |
67.5% |
1.0x |
|
KCB Group |
38.8 |
38.8 |
0.0% |
3.6% |
61.3 |
7.7% |
65.7% |
1.2x |
|
UBA Bank |
7.3 |
7.7 |
5.5% |
0.0% |
10.7 |
11.0% |
50.0% |
0.5x |
|
I&M Holdings |
94.3 |
95.0 |
0.8% |
11.8% |
138.6 |
3.7% |
49.6% |
1.0x |
|
Co-operative Bank |
14.0 |
15.2 |
8.6% |
5.9% |
19.9 |
5.3% |
36.6% |
1.3x |
|
CRDB |
140.0 |
135.0 |
(3.6%) |
(10.0%) |
207.7 |
0.0% |
53.9% |
0.5x |
|
Equity Group |
39.3 |
40.0 |
1.7% |
14.6% |
56.2 |
5.0% |
45.7% |
1.9x |
|
Ecobank |
7.5 |
7.2 |
(3.6%) |
(4.0%) |
10.7 |
0.0% |
49.0% |
1.6x |
|
CAL Bank |
1.0 |
0.9 |
(12.1%) |
(11.2%) |
1.4 |
0.0% |
60.9% |
0.7x |
|
Stanbic Bank Uganda |
30.0 |
30.0 |
0.0% |
(3.2%) |
36.3 |
3.9% |
24.8% |
2.1x |
|
Guaranty Trust Bank |
32.0 |
34.5 |
8.0% |
0.1% |
37.1 |
7.0% |
14.5% |
2.2x |
|
Union Bank Plc |
6.8 |
6.2 |
(8.9%) |
9.8% |
8.2 |
0.0% |
32.5% |
0.6x |
|
HF Group |
5.8 |
6.1 |
5.5% |
10.5% |
6.6 |
5.7% |
13.6% |
0.2x |
|
Barclays |
11.7 |
11.4 |
(2.6%) |
3.7% |
12.5 |
8.8% |
18.9% |
1.5x |
|
SBM Holdings |
6.1 |
6.1 |
0.0% |
2.3% |
6.6 |
4.9% |
12.5% |
0.9x |
|
Bank of Kigali |
278.0 |
278.0 |
0.0% |
(7.3%) |
299.9 |
5.0% |
12.9% |
1.5x |
|
Standard Chartered |
195.8 |
194.3 |
(0.8%) |
(0.1%) |
196.3 |
6.4% |
7.5% |
1.6x |
|
Stanbic Holdings |
95.0 |
92.0 |
(3.2%) |
1.4% |
92.6 |
2.4% |
3.1% |
0.9x |
|
Bank of Baroda |
135.0 |
135.0 |
0.0% |
(3.6%) |
130.6 |
1.9% |
(1.4%) |
1.2x |
|
FBN Holdings |
7.3 |
7.7 |
4.8% |
(3.8%) |
6.6 |
3.3% |
(10.1%) |
0.4x |
|
Standard Chartered |
21.1 |
21.4 |
1.5% |
1.9% |
19.5 |
0.0% |
(9.1%) |
2.7x |
|
National Bank |
5.2 |
5.3 |
2.3% |
(0.8%) |
4.9 |
0.0% |
(7.2%) |
0.4x |
|
Stanbic IBTC Holdings |
47.0 |
47.0 |
0.0% |
(2.0%) |
37.0 |
1.3% |
(20.0%) |
2.4x |
|
Ecobank Transnational |
14.0 |
15.0 |
7.1% |
(11.8%) |
9.3 |
0.0% |
(38.1%) |
0.5x |
|
*Target Price as per Cytonn Analyst estimates **Upside / (Downside) is adjusted for Dividend Yield ***Banks in which Cytonn and/or its affiliates are invested in ****Stock prices indicated in respective country currencies |
||||||||
We are “Positive” on equities for investors as the sustained price declines has seen the market P/E decline to below its historical average. We expect increased market activity, and possibly increased inflows from foreign investors, as they take advantage of the attractive valuations, to support the positive performance.
Britam Asset Managers has bought a 40.0% stake worth Kshs 1.4 bn in a local electricity producer, Gulf Energy, through a New York-based energy investment vehicle Everstrong Capital as the company seeks to diversify its investments beyond traditional investments. According to the Chief Executive Officer, Kenneth Kaniu, the investment will help achieve diversification of returns across asset classes, as well as currency, hence mitigating exchange rate risks. This is because returns from the power plant will be in form of hard currency, and Kenya’s cost of power is priced in US Dollars, due to the existence of the foreign exchange levy in electricity bills sent to homes and businesses. Power producers get compensated for expenditure done in foreign currency such as repayment of loans and equipment bought abroad, making the sector attractive to international investors. Gulf Energy supplied 8.0 mn kilowatt hours (KWh) of electricity to Kenya Power worth Kshs 3.5 bn in the year to June 2018. The 80.2-megawatt, USD 112.0 mn thermal plant in Athi River, started operations in 2014 and has a 20-year Power Purchase Agreement with Kenya Power. In making the investment, the asset management company is playing a role in the provision of long-term capital into the Kenyan power sector. In our view, the investment will boost the returns of Britam Asset Managers as it diversifies into the power industry, as it stands to benefit from stable returns for the remaining 16-year investment horizon.
Dutch impact investor Goodwell Investments has made a USD 2.0 mn (Kshs 203.0 mn) investment in Nairobi-based consumer goods catalogue and delivery service Copia for an undisclosed stake. Copia, a Silicon Valley start-up launched in Kenya in 2013, uses technology and a network of more than 3,000 local agents to deliver goods and services to about 40,000 “underserved consumers” in rural Kenya. Copia enables households to access goods that would otherwise be difficult to obtain without travelling to a major city. Pre-paid orders made through the firm take on average two to three days to be delivered. Copia has grown tremendously since 2013, with 3,000 agents and executing 80,000 orders a month. It serves 40,000 customers, translating to a 28.0% market share in Kenya. The Dutch investor has set its sights on continental expansion following the capital injection, as it estimates that Copia’s total addressable market could comprise several emerging markets in Sub-Saharan Africa, Latin America and Asia as well, representing a potential purchasing power of over USD 5.0 tn a year. Goodwell also holds a stake in Lidya, an online provider of working capital loans to small businesses in Nigeria, and MFS Africa, which touts itself as “Africa’s largest and fastest growing mobile money aggregator and interoperability platform”.
Andela, a Silicon Valley corporation launched in 2014 to identify and train software developers in Africa, has concluded a USD 100.0 mn (Kshs 10.3 bn) Series D funding, raising the firm’s venture funding to USD 180.0 mn (Kshs 18.1 bn). Generation Investment Management led the round, with input from existing funders including the Chan Zuckerberg Initiative, GV, Spark Capital, and CRE Venture Capital. Andela, which identifies and moulds engineering expertise, has since hired 1,100 developers worldwide and integrated them into key companies such as Safaricom. The funds will be used to expand Andela’s performance by accelerating the growth of its trade in technology through talent development. The New York-based form had previously raised USD 24.0 mn (Kshs 2.4 bn) in 2016, which was used to identify and grow developers for deployment in multinational companies. The software company will likely continue to deploy new resources to offer developer performance to its 200 customers. Currently, Andela has bases in African countries including Kenya, Nigeria, Uganda and Rwanda.
Despite the recent slowdown in growth, we maintain a “Positive” outlook on private equity investments in Africa, as evidenced by the increasing investor interest, which is attributed to; (i) economic growth, which is projected to improve in Africa’s most developed PE markets, (ii) attractive valuations in Sub Saharan Africa’s private markets compared to its public markets, and (iii) attractive valuations in Sub Saharan Africa’s markets compared to global markets. Going forward, the increasing investor interest, stable macro-economic and political environment will continue to boost deal flow into African markets.
I. Industry Reports
Hass Consult, a local real estate agency, released their house price and land index for Q4’2018. The main take-outs from the Land Index include:
- Land price growth in Nairobi’s suburbs softened in 2018, recording an annual growth of 1.1% compared to 3.3% in 2017, whereas prices in Satellite Towns rose by 3.7% in 2018, 2.6% points higher than land in Nairobi suburbs, albeit 1.7% points lower than 5.4% in 2017. The softening is attributed to a shift in land pricing from speculation and sentiment to effective demand needs,
- Overall, Mlolongo registered the highest land q/q price growth at 4.6%, from Kshs 24.6 mn per acre to Kshs 26.4 mn per acre, attributable to increased preference for development, driven by the ease of accessibility into the area through Mombasa Road and the growing demand for property in the area by middle-income households,
- Juja posted the highest annual price growth at 16.4% from an average Kshs 11.4 mn per acre in 2017 to Kshs 13.3 mn per acre in 2018. The growth is attributable to improved infrastructure, and demand for development land, which is relatively more affordable,
- Among Nairobi suburbs, Gigiri registered the highest annual growth in land prices with an annual appreciation of 10.6% attributed to the ongoing commercial and residential development in the area.
Going forward, we anticipate continued land price growth especially in Satellite Towns, driven by the expected rolling out of affordable housing projects and the continued infrastructural development that continues to open up areas for development. As per our outlook the investment opportunity in the Nairobi Metropolitan Area land sector being is in Satellite Towns such as Ruaka, Utawala, Ruiru and Thika, which posted relatively high capital appreciation of 16.2%, 17.5%, 4.7%, 7.7% y/y, respectively.
According to the House Sales and Rental Index, overall, the Nairobi Metropolitan Area registered annual increase in prices and rents of 8.5% and 8.6%, respectively, compared to the depreciation registered in 2017 of 4.1% and 3.9%. Other key take-outs were as follows:
- Apartments registered the strongest growth in rental prices at 15.9%, which is the highest increase in eight years, attributable to a decline in the development pace for apartments in Nairobi and the surrounding areas in the last two-years, correcting the previous mismatch between supply and demand, thereby boosting rental rates especially in Q4’2018,
- On the other hand, semi-detached and detached units registered an average increase in rents of 8.2% attributed to weakening demand especially as the global economy negatively affects the rate of expatriates who drive the market for temporary accommodations,
- On the sale price index, detached units registered the highest price appreciation at an average of 9.6% in comparison to apartments with 2.9%. This is attributed to growing demand for detached units in upmarket areas whereas the slow apartment prices growth is attributed to weak mortgage and home loan support for first-time buyers,
- In Nairobi suburbs, Nyari and Karen registered the highest annual price growth among low-rise areas with 11.2% and 7.0%, respectively, while Westlands and Kileleshwa were leading in the high-rise markets with 7.8% and 6.8%, respectively,
- In Satellite Towns, Ngong and Kitengela registered the highest annual price increase with 16.7% and 10.2%, respectively,
- According to the report, apartments with appealing facilities and meeting customer needs continue to sell strongly with the negatively affected markets being in those with oversupplies.
According to Cytonn Research, however, 2018-recorded subdued performance with returns of 8.9% (rental yields of 4.7% and capital appreciation of 4.2%) compared to 2017 with 10.3% (Rental yields of 5.1% and capital appreciation of 5.2%). Our outlook for the sector remains neutral with selected markets continuing to exhibit positive returns and thus investors ought to exercise prudence in identifying market opportunities.
II. Residential Sector
Following the signed deal between the Kenyan Government and United Nations Project Services (UnoPs) in 2018, in which the UN subsidiary is set to deliver 100,000 low-cost homes across Kenya at an estimated cost of Kshs 64.7 bn, the organization kick started the initiative during the week by injecting Kshs 1.0 bn into the project and vowing to seek the remaining Kshs 63.7 bn from other organizations. Once complete, the project will provide a significant impetus to the Kenyan Government’s affordable housing initiative, which aims to deliver 500,000 units by 2022, by catering for 20.0% of the planned units. We commend the additional funding, especially as project financing remains one of the key challenges to the affordable housing initiative. Overall, the affordable housing initiative is set to cost Kshs 1.3 tn where the government so far has allocated Kshs 6.5 bn from the 2018/19 budget and further Kshs 21.0 bn from the Supplementary Appropriation Bill No. 2 of 2018 towards the programme.
On the other hand, the Government of Kenya announced relaxation of affordable housing regulations to include high income-earners of Kshs 100,000 and above. Previously, the allocation was as below:
- Social Housing - Designated for individuals earning up to Kshs 14,999 monthly, accounting for 2.6% of the formal income earners (KNBS),
- Low-Cost Housing - Designated for individuals earning between Kshs 15,000 and Kshs 49,999 monthly, accounting for 71.8% of the formal income earners, and,
- Mortgage-Gap Housing - Designated for individuals earning between Kshs 50,000 and Kshs 100,000 monthly, accounting for 22.6% of the formal income earners.
With the new regulations, however, income-earners of Kshs 100,000 and above, who as per KNBS data make up approximately 2.9% of the working population in Kenya will be able to take up affordable housing units. This will be through the Housing Fund and government-availed mortgages to be repaid in 15-years at 7.0% p.a., whereas low-income earners will acquire the houses through tenant purchase schemes. In our view, the new redefined guidelines will enable inclusion of middle-income individuals who earn above Kshs 100,000 but still cannot afford to service a mortgage at prevailing market rates for mid-end and high-end properties costing above Kshs 7.0 mn. For example, an individual earning net income of Kshs 120,000 using a maximum of 40% of their income to pay instalments can only afford a mortgage of Kshs 3.9 mn at an interest rate of 13.5% for 20-years. With the government housing expected to cost between Kshs 600,000 and Kshs 3.0 mn, and assuming homebuyers will use 40.0% of their net income on monthly mortgage payments, only an individual earning a net income of Kshs 70,000 p.m. would be able to purchase the Kshs 3.0 mn units, at an interest rate of 7.0% for 15 years. The new regulations will provide an opportunity for more individuals to access the houses under the affordable programme and thus encourage buy-in from employees who are expected to contribute 1.5% of their income to the National Housing Development Fund. The government, however, should introduce a clear allocation criteria and a maximum qualifying income limit in order to limit purchases to prospective homeowners as opposed to speculative buyers and to ensure equitable allocation based on income and need. In our view, at the proposed the mortgage interest rate of 7.0% and the repayment period of 15-years, the qualifying cut should be at individuals earning a net income of Kshs 150,000 p.m. for a unit costing as much as Kshs 6.6 mn.
Erdemann properties launched their residential development in Ngara on approximately 5.6-acres (Costs undisclosed). The project dubbed “River Estate’’ will have eight 34-storey blocks of one and two bedroom apartments with price points of Kshs 6.0 mn, and Kshs 8.5 mn, respectively. With 340 units on each block, the project aims to house 2,720 residents as well as the rehabilitation of key roads in Ngara Estate such as Jadongo Road. Ngara as an investment location has been particularly ideal for residential development due to (i) proximity to main commercial hubs such as the CBD and Westlands, (ii) relatively high plot ratios that allow for densification, and (iii) availability of rehabilitative land as owned by the government and/or government corporations. We expect to see more private developers developing such projects going forward, especially with the intensified focus on local and global housing shortage. However, the key challenges that continue to limit developers are the restrictive land costs, relatively high cost of capital and insufficient access to the same.
We expect continued increase in activities in the real estate sector, supported by: (i) relatively high residential demand currently at 2.0 mn units, and growing at an annual rate of 200,000, and (ii) improved infrastructural developments, which will open up areas for development.
Following the successful completion and handover of “Amara Ridge”, Cytonn’s flagship project located in Karen near the Bomas of Kenya, Cytonn Real Estate has now launched “Applewood”, a signature gated community development comprising of 18 luxury homes in Miotoni, Karen, seated on 10.4-acres. In this week’s topical, we update our research findings on the Karen real estate market by looking at the factors that have contributed to its attractiveness to investors and analyzing the potential returns to investors in the area. We have expanded our coverage of Karen’s real estate performance by also looking at the commercial office and retail sectors. From Cytonn Research conducted in December 2018, the average total returns in the Karen residential market came in at 8.8% (rental yield of 4.1% and price appreciation of 4.7%), while the office and retail sectors registered average rental yields at 9.2% and 11.0%, respectively.
In our analysis of the investment opportunity in Karen, we shall cover the following:
- Overview of Karen
- Real Estate Performance in Karen (Residential, Office and Retail)
- Karen Investment Opportunity
- Overview of Karen
Karen is a high-end neighborhood in Nairobi located approximately 16 km South West of the Nairobi CBD. Previously, it was predominantly a residential area but relaxation of zoning regulations has seen an increase in commercial developments, the most notable ones being The Hub Mall along Dagoretti Road, Galleria Mall at the junction of Magadi and Lang’ata Road and the recently opened, Karen Waterfront along Lang’ata Road. We have seen land values in the area growing at a 7-year Compounded Annual Growth Rate (CAGR) of 12.2% since 2011, from an average of Kshs 25.0 mn per acre in 2011 to Kshs 55.8 mn per acre in 2018, fueled by increased demand for property in the area.
The main factors that have made Karen an attractive area for real estate development include:
- Good Transport Network – Karen is accessible by main roads such as Ngong Road, Lang’ata Road and is served by the Southern Bypass, which was completed during the second half of 2016. The ongoing dualling of Ngong Road, currently in its second phase of development, that will see some feeder roads in Karen, such as Karen Road, expanded, is likely to further improve accessibility of the area,
- Relaxation of Zoning Regulations – Zoning regulations have been relaxed in Karen to allow for commercial in some nodes and single dwelling up to a half an acre in some areas thus increasing real estate activity and increasing property values. From our research, land prices in Karen have grown by a 7-year CAGR of 12.2% between 2011 and 2018, from Kshs 25.0 mn per acre in 2011 to Kshs 55.8 mn per acre in 2018,
- High-end Schools – Karen’s appeal to wealthy individuals is also driven by the presence of some of the most elite international schools in the country such as Banda School, Gems Cambridge, Brookhouse, and Hillcrest. In 2018, Knight Frank’s Wealth Report listed Karen as one of the top investment hotspots globally,
- Serene Environment - With the continued relaxation of zoning regulations and increased development activity, many high-end areas are losing their appeal to high net worth individuals. Karen, located at the foothills of Ngong Hills and in close proximity to forests such as Ngong Sanctuary Forest and Oloolua Forest has maintained its appealing environmental serenity, and,
- Recreational Facilities – Karen has a unique historical heritage preserved in museums such as the Karen Blixen Museum. It also hosts the Bomas of Kenya, the Giraffe Manor, Karen Country Club and malls including The Hub and Galleria, making the place an ideal home for individuals seeking exclusivity, luxury and convenience.
- Real Estate Performance in Karen
In evaluating Karen Market performance, we will look at the following key metrics:
- Plinth Area: Research on the size of the units found in the market allows us to gauge the current offering, and put into consideration the home buyer’s preferences for sizes of houses
- Prices: Research on prices will be used in comparison of the products in the market over a given time period and allow us to demonstrate capital appreciation
- Rental Rates: Research on rental income allows us to inform potential investors on the current rental rates in other developments and also inform the investors on the rental yield they can gain from buying houses in Karen
- Annual Uptake: This allows the investor to appreciate the rate at which available homes are sold over a specific period. This helps them gauge on whether it is profitable to invest in a given area
- Occupancy: Refers to the units rented out in a development and therefore, indicates the product uptake of an area
- Rental Yield: Informs on the returns investors get from a property based on the monthly rental income and hence, the time it will take for an investor to get back the money invested
- Price Appreciation: Shows the return on real estate investments though the annual increase in the value of a property/land
- Total Returns: This shows the returns investors get back from a real estate investment (Rental yield+ Price Appreciation)
- Residential Market
The Karen residential scene has notably changed over the years with more gated communities being delivered to the market. In terms of land for development, Karen remains relatively affordable for developers in the high-end market, with the price per acre averaging at Kshs 55.8 mn as at 2018 in comparison to Runda, Kitisuru, and Rosslyn with Kshs 68.8 mn, Kshs 77.3 mn, and Kshs 100.0 mn per acre, respectively. In terms of performance, five bedroom units recorded the highest annual uptake and annual returns in Karen with an average of 27.6% and 10.9%, respectively, in comparison to four bedroom units with 20.8% and 5.5%, respectively, as high-income investors and homeowners prefer large units.
(All Values in Kshs Unless Stated Otherwise)
|
Karen Residential Research 2018 |
||||||||||||
|
Typology |
Plinth Area |
Average Price 2017 |
Average Price 2018 |
Average Rent 2018 |
Average Price per SQM 2018 |
Average Rent per SQM 2018 |
Annual Uptake 2018 |
Occupancy |
Rental Yield 2018 |
Price Appreciation 2018 |
Total Annual Returns 2018 |
|
|
4- Bedroom |
437 |
80.0m |
84.8m |
326,250 |
180,723.6 |
618.4 |
20.8% |
71.5% |
4.4% |
1.1% |
5.5% |
|
|
5- Bedroom |
510 |
93.4m |
98.2m |
373,750 |
198,348.3 |
864.9 |
27.6% |
76.2% |
4.0% |
6.9% |
10.9% |
|
|
Average |
474 |
86.7m |
91.5m |
350,000 |
189,535.9 |
741.6 |
24.2% |
73.8% |
4.1% |
4.7% |
8.8% |
|
|
||||||||||||
Source: Cytonn Research
In comparison to other high-end markets, Karen recorded average total returns to investors of 8.8% in comparison to the residential high-end market average of 6.4% and relatively high annual uptake of 24.2% against the market’s average of 20.7%.
(All Values in Kshs Unless Stated Otherwise)
|
High-End Residential Performance 2018 |
|||||||
|
Location |
Average Price per SQM |
Average Rent per SQM |
Average Annual Uptake |
Average Occupancy |
Average Rental Yield |
Average Price Appreciation |
Average Annual Total Returns |
|
Kitisuru |
184,097.5 |
834.9 |
22.0% |
71.7% |
4.8% |
4.1% |
8.9% |
|
Karen |
192,053.7 |
790.9 |
24.2% |
73.8% |
4.1% |
4.7% |
8.8% |
|
Runda |
211,486.5 |
810.5 |
19.8% |
57.7% |
2.9% |
5.5% |
8.4% |
|
Lower Kabete |
174,350.4 |
438.9 |
21.8% |
89.5% |
2.8% |
4.2% |
7.0% |
|
Rosslyn |
175,737.1 |
754.7 |
15.9% |
71.3% |
3.3% |
(4.2%) |
(0.9%) |
|
Average |
187,545.0 |
726.0 |
20.7% |
72.8% |
3.6% |
2.9% |
6.4% |
|
|||||||
Source: Cytonn Research
- Commercial Office
Karen’s commercial office sector continues to be bolstered by the area’s relatively good infrastructure, exclusivity enabled by the restricted zoning regulations thereby attracting differentiated office concepts such as serviced offices and compact office buildings, which attract high-end clientele and premium rental rates. Notable office developments in Karen include the Watermark Business Park, Blixen Court, Nairobi Office Park, The Stables, African Reit and Symbion at The Hub.
Grade C offices recorded the highest rental yields at 10.5% in comparison to Grade A and B, which registered 8.6% and 9.2%, respectively. This is attributable to the period under which majority Grade C offices have been in the market, which is more than Grade A and B, allowing them longer periods of tenure hence high occupancies and rental yields. Overall, Karen recorded an increase in office rental yields from 8.1% in 2017 to 9.2% in 2018, owing to increased occupancy rates from 88.0% in 2017, to 88.6% in 2018.
(All Values in Kshs Unless Stated Otherwise)
|
Karen Commercial Office Performance |
|||||||
|
Office Grade |
Average rent Per SQFT |
Average Rental Yield 2017 |
Average Occupancy 2017 |
Average Occupancy 2018 |
Average Rental Yield 2018 |
Y/Y Change in Occupancy 2018 |
Y/Y Change in Rental Yield 2018 |
|
Grade A |
122.0 |
8.3% |
83.0% |
86.7% |
8.6% |
3.7% |
0.3% |
|
Grade B |
120.0 |
9.4% |
87.6% |
85.5% |
9.5% |
(2.1%) |
0.1% |
|
Grade C |
116.0 |
9.6% |
93.5% |
97.5% |
10.5% |
4.0% |
0.9% |
|
Average |
118.0 |
*8.1% |
88.0% |
88.6% |
9.2% |
1.9% |
0.4% |
|
|||||||
Source: Cytonn Research
In 2018, Karen office market recorded average rental yields of 9.2%, 1.3% points higher than the Nairobi office average of 8.1% with average occupancy rates coming in at 88.6% in comparison to Nairobi office market average of 83.3%. The average rent per SQFT in Karen’s office market is Kshs 118.0, 15.3% higher than the overall Nairobi office market average of Kshs 102.3.
(All Values in Kshs Unless Stated Otherwise)
|
Nairobi Commercial Office Performance 2018 |
|||||
|
Location |
Price Kshs/ SQFT FY’2018 |
Rent Kshs/SQFT FY’ 2018 |
Occupancy FY’2018(%) |
Rental Yield (%) FY’2018 |
|
|
Gigiri |
13,833.3 |
141.0 |
88.3% |
10.5% |
|
|
Karen |
13,666.0 |
118.0 |
88.6% |
9.2% |
|
|
Westlands |
12,050.0 |
109.7 |
82.1% |
9.0% |
|
|
Parklands |
12,493.8 |
102.1 |
86.0% |
8.4% |
|
|
Upperhill |
12,559.5 |
99.8 |
80.7% |
7.9% |
|
|
Kilimani |
13,525.2 |
98.9 |
88.3% |
8.0% |
|
|
Nairobi CBD |
12,424.8 |
88.8 |
88.3% |
7.6% |
|
|
Thika Road |
12,516.7 |
86.3 |
81.5% |
6.7% |
|
|
Msa Road |
11,400.0 |
78.8 |
65.6% |
5.8% |
|
|
Average |
12,572.9 |
102.3 |
83.3% |
8.1% |
|
|
|||||
Source: Cytonn Research
- Retail Market
Karen’s retail sector has grown exponentially a 2-year CAGR of 98.9% from 0.2 mn SQFT in 2016 to 0.8 mn SQFT in 2018. The growth has been driven by relatively good infrastructure particularly with the increased access, the affluent residents, as well as its proximity to upper mid-end neighborhoods such as Kilimani and Lavington. Malls in Karen include Galleria, The Hub, Karen Crossroads, Karen Waterfront and the soon-to-be opened, The Well. Mall developers in Karen benefit from the huge interest shown by international retailers such as Carrefour, LC Waikiki and Game, who have set up shop in the area, attracting other retailer’s due to the footfall they attract. Neighborhood malls registered relatively high rental yields of 12.8% on average in comparison to community malls with 10.2%. This is attributable to high occupancy rates with neighborhood malls registering an average of 98.0% against community malls with 85.7%.
(All Values in Kshs Unless Stated Otherwise)
|
Karen Retail Performance |
|||||||
|
Classification |
Current Average Rent Per SQM |
Average Occupancy Rate 2017 |
Average Rental yield 2017 |
Average Occupancy 2018 |
Average Rental Yield 2018 |
Y/Y Change in Occupancy Rates |
Y/Y Change in Rental Yields |
|
Neighborhood |
237 |
90.0% |
10.9% |
98.0% |
12.8% |
9.0% |
1.9% |
|
Community |
222 |
76.0% |
10.2% |
85.7% |
10.2% |
(10.3%) |
0.0% |
|
Average |
225 |
83.0% |
10.4% |
88.8% |
11.0% |
(13.8%) |
0.9% |
|
|||||||
Source: Cytonn Research
In comparison to the overall retail market, Karen posted average rental yields of 11.0% compared to the market average of 9.0%, which is also an increase of 0.6% points from 10.4% posted in 2017. This is attributable to increased occupancy in 2018 at 88.8%, 5.8% points increase from 83.0% in 2017.
(All Values in Kshs Unless Stated Otherwise)
|
Summary of Nairobi's retail Performance - 2018 |
|||
|
Location |
Rent Kshs/SQFT 2018 |
Occupancy Rate 2018 |
Rental yield 2018 |
|
Westlands |
219.2 |
88.2% |
12.2% |
|
Karen |
224.9 |
88.8% |
11.0% |
|
Kilimani |
167.1 |
97.0% |
10.7% |
|
Ngong Road |
175.4 |
88.8% |
9.7% |
|
Thika Road |
177.3 |
75.5% |
8.3% |
|
Kiambu Road |
182.8 |
69.5% |
8.1% |
|
Mombasa Road |
161.5 |
72.4% |
7.9% |
|
Satellite Towns |
142.1 |
73.7% |
6.7% |
|
Eastlands |
153.3 |
64.8% |
6.8% |
|
Average |
178.2 |
79.8% |
9.0% |
|
|||
Source: Cytonn Research
- Performance Summary
The table below shows a summary of returns for Karen’s real estate sector. Average annual total returns from the residential sector came in at 8.8%, with retail and office sectors posting average rental yields of 11.0% and 9.2%, respectively, whereas Karen’s capital appreciation currently stands at 12.2%
|
Karen Real Estate Performance Summary |
||
|
Real Estate Sector |
Rental Yield |
Price Appreciation |
|
Residential |
4.1% |
4.7% |
|
Commercial Office |
9.2% |
|
|
Retail |
11.0% |
|
|
Land |
|
12.2% |
|
Average |
8.1% |
8.5% |
|
||
Source: Cytonn Research
- Karen Investment Opportunity
Our outlook for Karen’s residential sector is positive with a neutral outlook for commercial office and retail sectors. Therefore, our outlook for the overall real estate investment sector in Karen is neutral with a bias to positive as shown in the table below:
|
Thematic Performance Review and Investment Opportunity Outlook |
|||
|
Theme |
Performance |
Investment Opportunity |
Outlook |
|
Residential |
|
|
Positive |
|
Commercial Office |
|
|
Neutral |
|
Retail |
|
|
Neutral |
Conclusion
We expect real estate performance in Karen to continue on an upward trend as the area continues to register improved performance across themes such as retail and residential as well as attracting high demand across all real estate sectors in comparison to other nodes in each given theme. Additionally, the availability of affordable land for development in comparison to other high-end areas as well as continued infrastructural improvements such as the ongoing dualling of Ngong Road, is set to sustain demand from investors and buyers. For residential sector, Karen recorded relatively high annual uptake of 24.2% compared to the overall Nairobi residential market average of 22.8%; the Karen office sector registered occupancy of 88.6% on average in comparison to the Nairobi office market average of 83.3%, whereas the retail sector registered average occupancy of 88.8%, in comparison to the Nairobi retail market average of 79.8%, attesting to Karen’s attractiveness as a real estate investment opportunity.
For more details on our projects in Karen, please see Applewood, Situ Village, and Amara Ridge.
Disclaimer: The Cytonn Weekly is a market commentary published by Cytonn Asset Managers Limited, “CAML”, which is regulated by the Capital Markets Authority, CMA and the Retirement Benefits Authority, RBA. However, the views expressed in this publication are those of the writers where particulars are not warranted. This publication is meant for general information only, and is not a warranty, representation, advice or solicitation of any nature. Readers are advised in all circumstances to seek the advice of a registered investment advisor.

- Talk to us
- Kenya
- P.O Box 20695 - 00200, Nairobi, Kenya
- Cell +254709101200
- Tel +254709101200
- WhatsApp +254741676635
- United States
- +254709101200
- DOWNLOAD OUR APP
-


- Kenya
- 8th Floor, Pinetree Plaza, Kaburu Drive, Ngong Road, Nairobi, Kenya
- USA
- Suite 1150, 1775 Eye Street NW, USA, Washington DC 20006, USA
- Investments
- High Yield
- Private Equity
- Real Estate
- Real Estate
- RiverRun Estates
- Cytonn Towers
- The Ridge
- Taraji Heights
- The Alma