Kenya FY’2020 Listed Insurance Report, & Cytonn Weekly #21/2021
By Cytonn Research Team, May 30, 2021
Executive Summary
Fixed Income
During the week, T-bills remained oversubscribed, but the overall subscription rate dropped to 152.4%, from 162.0% recorded the previous week. The demand for the 364-day paper persisted, as it recorded the highest bids worth Kshs 23.8 bn against the offered Kshs 10.0 bn, translating to a subscription rate of 238.2%, a decrease from the 241.3% recorded the previous week. Investors’ continued interest in the 364-day paper is mainly attributable to the paper’s attractive return of 9.2%, which is higher than the rate for most bank placements. The yields on all the three papers declined; with the 91-day, 182-day and 364-day paper declining by 1.6 bps, 8.8 bps and 12.8 bps, to 7.1%, 7.9% and 9.2%, respectively.
During the week, the National Treasury gazetted the revenue and net expenditures for the first ten months of FY’2021/2021, highlighting that Total revenue collected as at the end of April 2021 amounted to Kshs 2.2 tn, equivalent to 74.1% of the revised FY’2020/2021 target of Kshs 2.9 tn. The total expenditure amounted to Kshs 2.2 tn in the 10 months leading to the end of April 2021, equivalent to 73.6% of the revised FY’2020/2021 budget of Kshs 2.9 tn and 88.3% of the 10-months prorated expenditure estimates.
We are projecting the y/y inflation rate for May 2021 to remain stable within the range of 5.6% - 5.9%, compared to 5.8% recorded in April 2021.
The National Treasury and Planning announced that it had presented the Finance Bill 2021 to Parliament and one of the key note is that the overall budget for FY’2021/2022 total expenditure is projected to increase Kshs 3.6 tn from Kshs 2.9 tn in the financial year 2020/2021 as the government tries to balance between stimulating economic recovery and responding to the health challenges of the COVID-19 pandemic.
Equities
During the week, the equities market was on an upward trajectory, with NSE 20, NASI and NSE 25 gaining by 0.2%, 4.2% and 3.5% respectively. This week’s performance took their YTD performance to gains of 13.6% and 8.9%, for NASI and NSE 25, respectively, and a loss of 0.5% for NSE 20. The equities market performance was driven by gains recorded by stocks such as EABL, Safaricom and ABSA which gained by 7.0%, 5.9% and 4.6%, respectively. The gains were however weighed down by losses recorded by stocks such as Bamburi, Diamond Trust Bank (DTB-K) and BAT which lost by 7.2%, 5.9 and 1.3%, respectively. During the week, Safaricom Plc announced that the Ethiopian Communications Authority (ECA) had approved a bid for an Ethiopia Telco License which was submitted by a consortium including Safaricom, Vodacom Group Ltd, Vodafone Group Plc (UK), CDC Group Plc and Sumitomo Corporation. During the week, KCB Group, I&M Holdings, Equity Group, NCBA Group, Diamond Trust Bank Kenya (DTB-K), Standard Chartered Bank Kenya, and HF Group released their Q1’2021 financial results;
Real Estate
During the week, the Central Bank of Kenya (CBK), released the Bank Supervision Annual Report 2020, highlighting that the residential mortgage market recorded a 3.7% decline in the number of mortgage loans accounts in the market, to 26,971 in December 2020 from 27,993 in December 2019. In the hospitality sector, Kenya Airports Authority announced that JKIA passenger movement registered a 24.1% decline in the month of March 2021, to 279,413 passengers from 368,279 passengers in the same period last year;
Focus of the Week
Following the release of FY’2020 results by insurance companies, this week we analyze the performance of the 5 listed insurance companies in the country, identify the key factors that influenced their performance, and give our outlook for the insurance sector going forward;
Investment Updates:
- Weekly Rates:
- Cytonn Money Market Fund closed the week at a yield of 10.56%. To invest, just dial *809#;
- Cytonn High Yield Fund closed the week at a yield of 14.48% p.a. To invest, email us at sales@cytonn.com and to withdraw the interest you just dial *809#;
- We continue to offer Wealth Management Training daily, from 9:00 am to 11:00 am, through our Cytonn Foundation. The training aims to grow financial literacy among the general public. To register for any of our Wealth Management Trainings, click here;
- If interested in our Private Wealth Management Training for your employees or investment group, please get in touch with us through wmt@cytonn.com;
- Cytonn Insurance Agency acts as an intermediary for those looking to secure their assets and loved ones’ future through insurance namely; Motor, Medical, Life, Property, WIBA, Credit and Fire and Burglary insurance covers. For assistance, get in touch with us through insuranceagency@cytonn.com;
- Cytonn Unit Trust Scheme will hold a virtual Annual General Meeting (AGM) on Friday 11th June 2021 from 8.00 AM to 10.30 AM. Register for the AGM by dialing *483*506# or by clicking this link Here . Registration for the AGM opened on Saturday, 22nd May 2021 at 9:00 am and will close on Wednesday, 9th June 2021 at 11.00 a.m.
Real Estate Updates:
- For an exclusive tour of Cytonn’s real estate developments, visit: Sharp Investor's Tour, and for more information, email us at sales@cytonn.com;
- Phase 3 of The Alma is now ready for occupancy. To rent please email properties@cytonn.com;
- We have 10 investment-ready projects, offering attractive development and buyer targeted returns. See further details here: Summary of Investment-ready Projects;
For recent news about the group, see our news section here.
Money Markets, T-Bills & T-Bonds Primary Auction:
During the week, T-bills remained oversubscribed, but the overall subscription rate dropped; coming in at 152.4%, from 162.0% recorded the previous week. The demand for the 364-day paper persisted, as it recorded the highest bids worth Kshs 23.8 bn against the offered Kshs 10.0 bn, translating to a subscription rate of 238.2%, a decrease from the 241.3% recorded the previous week. Investors’ continued interest in the 364-day paper is mainly attributable to the paper’s attractive return of 9.2% which is higher than the rate being offered by most bank. The subscription rate for the 182-day paper increased to 103.1%, from 101.1% recorded the previous week, receiving bids worth Kshs 10.3 bn against the Kshs 10.0 bn offered. The subscription rate for the 91-day paper declined to 61.2%, from 116.1% recorded the previous week, with the paper receiving bids worth Kshs 2.4 bn against the offered amounts of Kshs 4.0 bn. The yields on all the three papers declined; with the 91-day, 182-day and 364-day paper declining by 1.6 bps, 8.8 bps and 12.8 bps, to 7.1%, 7.9% and 9.2%, respectively. The government continued to reject expensive bids, accepting Kshs 20.6 bn out of the Kshs 36.6 bn worth of bids received, translating to an acceptance rate of 56.3%.
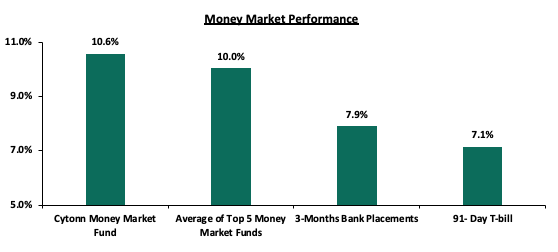
In the money markets, 3-month bank placements ended the week at 7.9% (based on what we have been offered by various banks), while the yield on the 91-day T-bill declined marginally by 1.6 bps to 7.1%. The average yield of the Top 5 Money Market Funds remained unchanged at 10.0%, similar to what was recorded the previous week. The yield on the Cytonn Money Market Fund remained unchanged at 10.6%, similar to what was recorded the previous week. The table below shows the Money Market Fund Yields for Kenyan Fund Managers as published on 28th May 2021:
|
Money Market Fund Yield for Fund Managers as published on 28th May 2021 |
|||
|
Rank |
Fund Manager |
Daily Yield |
Effective Annual Rate |
|
1 |
Cytonn Money Market Fund |
10.04% |
10.56% |
|
2 |
Nabo Africa Money Market Fund |
9.74% |
10.18% |
|
3 |
Zimele Money Market Fund |
9.56% |
9.91% |
|
4 |
GenCapHela Imara Money Market Fund |
9.45% |
9.91% |
|
5 |
Alphafrica Kaisha Money Market Fund |
9.22% |
9.62% |
|
6 |
CIC Money Market Fund |
9.05% |
9.38% |
|
7 |
Madison Money Market Fund |
8.90% |
9.31% |
|
8 |
Sanlam Money Market Fund |
8.79% |
9.19% |
|
9 |
Co-op Money Market Fund |
8.52% |
8.90% |
|
10 |
Dry Associates Money Market Fund |
8.27% |
8.60% |
|
11 |
British-American Money Market Fund |
8.27% |
8.59% |
|
12 |
Apollo Money Market Fund |
8.43% |
8.50% |
|
13 |
ICEA Lion Money Market Fund |
8.00% |
8.33% |
|
14 |
NCBA Money Market Fund |
8.03% |
8.33% |
|
15 |
Old Mutual Money Market Fund |
7.27% |
7.52% |
|
16 |
AA Kenya Shillings Fund |
6.23% |
6.41% |
Liquidity:
During the week, liquidity in the money market tightened, with the average interbank rate increasing marginally to 5.0%, from 4.9% recorded the previous week, partly attributable to tax remittances which partly offset Government payments. The average interbank volumes declined by 3.4% to Kshs 9.2 bn, from Kshs 9.5 bn recorded the previous week.
Kenya Eurobonds:
During the week, the yields on all Eurobonds declined, with the yields on the 10-year Eurobond issued in June 2014, 10-year bond issued in 2018, 30-year bond issued in 2018, 7-year bond issued in 2019 and 12-year bond issued in 2019 declining to 3.1%, 5.3%, 7.3%, 4.7% and 6.2%, from 3.2%, 5.6%, 7.5%, 4.8% and 6.4%, respectively. The decline in the yields was partly attributable to improved investor confidence, following the recent announcement by the International Monetary Fund (IMF) that it has reached a staff-level agreement with Kenya to enable the nation access a loan of USD 410.0 mn (Kshs 44.4 bn) to aid in stabilizing Kenya’s economy and create a sustainable growth path. Below is a summary of the performance:
|
Kenya Eurobond Performance |
|||||
|
|
2014 |
2018 |
2019 |
||
|
Date |
10-year issue |
10-year issue |
30-year issue |
7-year issue |
12-year issue |
|
31-Dec-2020 |
3.9% |
5.2% |
7.0% |
4.9% |
5.9% |
|
30-April-2021 |
3.2% |
5.7% |
7.7% |
5.0% |
6.7% |
|
20-May-21 |
3.2% |
5.6% |
7.5% |
4.8% |
6.4% |
|
21-May-21 |
3.1% |
5.4% |
7.4% |
4.7% |
6.3% |
|
24-May-21 |
3.1% |
5.4% |
7.4% |
4.7% |
6.2% |
|
25-May-21 |
3.1% |
5.4% |
7.4% |
4.7% |
6.2% |
|
26-May-21 |
3.0% |
5.3% |
7.3% |
4.7% |
6.2% |
|
27-May-21 |
3.1% |
5.3% |
7.3% |
4.7% |
6.2% |
|
Weekly Change |
(0.1%) |
(0.3%) |
(0.1%) |
(0.1%) |
(0.1%) |
|
MTD Change |
(0.2%) |
(0.4%) |
(0.3%) |
(0.3%) |
(0.4%) |
|
YTD Change |
(0.8%) |
0.1% |
0.3% |
(0.2%) |
0.3% |
Source: Reuters
Kenya Shilling:
During the week, the Kenyan shilling appreciated against the US dollar by 0.6% to close at Kshs 107.5, from Kshs 108.2 recorded the previous week, mainly due to adequate supply of dollars from exporters amid a drop in demand from commodity importers. On a YTD basis, the shilling has appreciated by 1.5% against the dollar, in comparison to the 7.7% depreciation recorded in 2020. Despite the recent appreciation of the shilling, we expect the shilling to remain under pressure in 2021 as a result of:
- Rising uncertainties in the global market due to the Coronavirus pandemic, which has seen investors continue to prefer holding their investments in dollars and other hard currencies and commodities, and,
- Demand from merchandise traders as they beef up their hard currency positions in anticipation for more trading partners reopening their economies globally,
The shilling is however expected to be supported by:
- The Forex reserves, currently at USD 7.5 bn (equivalent to 4.6-months of import cover), which is above the statutory requirement of maintaining at least 4.0-months of import cover, and the EAC region’s convergence criteria of 4.5-months of import cover,
- The stable current account position which is estimated to be at a deficit of 5.2% of GDP in the 12 months to April 2021 and is projected to remain at the same level in 2021, and,
- Improving diaspora remittances evidenced by a 43.8% y/y increase to USD 299.3 mn in April 2021, from USD 208.2 mn recorded over the same period in 2020, has cushioned the shilling against further depreciation.
Weekly Highlights:
- Revenue and Net Exchequer for FY’2020/2021
During the week, the National Treasury gazetted the revenue and net expenditures for the first ten months of FY’2021/2021, ending on 30th April 2021. Below is a summary of the performance:
|
FY'2020/2021 Budget Outturn - As at 30th April 2021 |
|||
|
Amounts in Kshs billions unless stated otherwise |
|||
|
Item |
12-months Revised Estimates |
10-months Actual |
Percentage Achieved |
|
Opening Balance |
48.0 |
48.0 |
100.0% |
|
Tax Revenue |
1,469.7 |
1,190.6 |
81.0% |
|
Non-Tax Revenue |
124.3 |
81.0 |
65.2% |
|
External Loans & Grants |
418.8 |
112.5 |
26.9% |
|
Domestic Borrowings |
853.8 |
729.6 |
85.4% |
|
Other Domestic Financing |
28.5 |
19.6 |
68.7% |
|
Total Revenue |
2,943.2 |
2,181.3 |
74.1% |
|
Recurrent Exchequer issues |
1,084.4 |
826.0 |
76.2% |
|
CFS Exchequer Issues |
1,073.7 |
841.1 |
78.3% |
|
Development Expenditure & Net Lending |
401.4 |
258.2 |
64.3% |
|
County Governments +Contingencies |
383.6 |
239.8 |
62.5% |
|
Total Expenditure |
2,943.2 |
2,165.1 |
73.6% |
|
Fiscal Deficit excluding Grants |
(418.8) |
(96.4) |
23.0% |
|
Total Borrowing |
1,272.6 |
842.1 |
66.2% |
The key take-outs from the report include:
- Total revenue collected as at the end of April 2021 amounted to Kshs 2.2 tn, equivalent to 74.1% of the revised target of Kshs 2.9 tn and is 88.9% of the prorated estimates. Cumulatively, Tax revenues amounted to Kshs 1.2 tn, equivalent to 81.0% of the target of Kshs 1.5 tn,
- The total expenditure amounted to Kshs 2.2 tn, equivalent to 73.6% of the revised budget of Kshs 2.9 tn and is 88.3% of the prorated expenditure estimates. Additionally, the net disbursements to recurrent and development expenditures came in at Kshs 826.0 bn and Kshs 258.2 bn, which is 76.2% and 64.3% of their respective FY’2020/2021 targets, respectively,
- Consolidated Fund Services (CFS) Exchequer issues lagged behind the revised target of Kshs 1.1 tn after amounting to Kshs 0.8 tn, equivalent to 78.3% of the target. The cumulative public debt servicing cost amounted to Kshs 764.7 bn which is 79.8% of the revised estimates of Kshs 958.4 bn, and,
- Total Borrowings as at the end of April 2021 amounted to Kshs 0.8 tn, equivalent to 66.2% of the revised target of Kshs 1.3 tn. The cumulative domestic borrowing amounted to Kshs 853.8 bn comprising of adjusted Net domestic borrowings of Kshs 491.9 bn and Internal Debt Redemptions (Roll-overs) of Kshs 362.0 bn. On the other hand, external loans and grants amounted to Kshs 112.5 tn, which is 73.1% behind its target of Kshs 418.8 tn.
The revenue underperformance was expected given the ravaging effects of the COVID-19 pandemic on the economy for most parts of 2020. However, the recent reversal of the tax incentives introduced earlier in 2020 has helped improve tax revenue collections, as seen by reported revenue out-performances in the first four months of 2021.
Additionally, the Government received USD 410.0 mn (Kshs 44.4 bn) from the recently announced IMF credit facility in May 2021 to help in stabilizing Kenya’s economy and create a sustainable growth path. Looking at tax revenue, we expect revenue collection to slow down in the remaining two months owing to the COVID-19 related movement restrictions that were put in place during the month of April and a relatively subdued but recovering business environment. In our view, we expect the government to fall short of its revenue target as it currently has Kshs 96.4 bn in deficits. With less than two months before the end of the current fiscal year, we believe that the government will continue to borrow aggressively in the domestic market and in turn might lead to an upward pressure on the yield curve.
- Inflation Projection
We are projecting the y/y inflation rate for May 2021 to remain stable within the range of 5.6% - 5.9%, compared to 5.8% recorded in April 2021. The key drivers include:
- Fuel prices have remained stable in the last two months as the prices for diesel and kerosene remained unchanged for the period mid-March to mid-June 2021, according to the monthly price releases by the Energy and Petroleum Regulatory Authority (EPRA), and,
- Food prices have remained relatively stable during the month given the favourable weather and an improvement in agricultural output. Key to note, in the month of April 2021, food and non-alcoholic beverages increased by 6.4%, more than any other commodity group on the back of increases in prices of tomatoes, cabbages and potatoes among other food items.
Going forward, we expect the inflation rate to remain within the government set range of 2.5% - 7.5%.
- Finance Bill 2021
Recently, the Cabinet Secretary for the National Treasury announced that they had presented the Finance Bill 2021 to Parliament for consideration. Some of the key points, including our take on each, include;
- The Finance Bill 2021 proposes to remove the limitation of the carried forward tax loss; the limitation is currently at 9 years. In Kenya, currently, a business that records a loss does not pay tax but instead the tax payable may be carried forward to the subsequent years as a deduction. Therefore, the business pays less tax in the subsequent years up to 9 years should the business be profitable. The removal of this limitation is likely to have minimal effect on revenue collection levels especially in light of the fact that the Minimum Tax came into law in 1st January 2021,
- The Finance Bill 2021 has proposed to add the definition of “Infrastructure bond” in the Income Tax Act. Infrastructure bonds are Government bonds issued to raise money for specific projects e.g. road, a telecommunication network or water system. Infrastructure bonds are attractive to investors owing to their interest income tax exempt nature; however, the definition of infrastructure bonds is not explicit in the current laws,
- The Finance Bill, wishes to introduce insurance relief on contributions into the National Health Insurance Fund (NHIF), which is a statutory scheme in Kenya. The insurance relief will have an upper limit of 15.0% of the monthly NHIF contributions. This proposed change is likely to have a positive and widespread effect due to the fact that all who work in the formal sector have to contribute to NHIF and they will all enjoy the tax relief - the total number of people to benefit is estimated at around 3.1 million Kenyans,
- The Finance Bill also seeks to amend the Retirement Benefits Act by defining clearly the registration requirements for a corporate trustee in Kenya. The Bill also proposes to grant the Authority powers to extend the compliance period for schemes to file their annual audited accounts. Currently schemes have up to 6 months after a financial year to conduct and audit and file returns with the Retirement Benefits Authority. Additionally, the Bill seeks to amend the definition of a retirement scheme to include post-retirement medical funds. In our view, the proposed amendments on the Retirement Benefits Act and Regulations, will have minimal impact as the new proposals are already market practice; however, the proposals will serve to have the practices enshrined in law, and,
- The Finance Bill 2021 seeks to amend the definition of a broker in the Insurance Act to provide for regulation of foreign reinsurance companies including non-resident brokers in Kenya, by the Insurance Regulatory Authority (IRA). The Bill also proposes inclusion of an annual fee payable by registered insurers effective 1st January 2022. This is likely to see more standardization in the insurance industry and help IRA raise more funds to carry out its functions.
Overall, the Finance Bill 2021 is aimed at increasing revenue partly by encouraging manufacturing and industrial activities and increasing tax rates as seen in the case of ordinary bread.
Rates in the fixed income market have remained relatively stable due to the high liquidity in the money markets, coupled with the discipline by the Central Bank as they reject expensive bids. The government is 4.1% behind of its prorated borrowing target of Kshs 506.6 bn having borrowed Kshs 485.8 bn. In our view, due to the current subdued economic performance brought about by the effects of the COVID-19 pandemic, the government will record a shortfall in revenue collection having collected Kshs. 1,190.6 bn as at 10 months to April 2021, compared to Kshs 1,224.8 bn prorated target collection for FY’2020/2021, thus leading to a larger budget deficit than the projected 7.5% of GDP. The high deficit and the lower credit rating from S&P Global to 'B' from 'B+' will mean that the government might be forced to borrow more from the domestic market which will ultimately create uncertainty in the interest rate environment. In our view, investors should be biased towards short-term fixed income securities to reduce duration risk.
During the week, the equities market was on an upward trajectory, with NSE 20, NASI and NSE 25 gaining by 0.2%, 4.2% and 3.5% respectively. This week’s performance took their YTD performance to gains of 13.6% and 8.9%, for NASI and NSE 25, respectively, and a loss of 0.5% for the NSE 20. The equities market performance was driven by gains recorded by stocks such as EABL, Safaricom and ABSA which gained by 7.0%, 5.9% and 4.6%, respectively. The gains were however weighed down by losses recorded by stocks such as Bamburi, Diamond Trust Bank (DTB-K) and BAT which lost by 7.2%, 5.9 and 1.3%, respectively.
Equities turnover increased by 56.7% to USD 46.3 mn, from USD 29.6 mn recorded the previous week, taking the YTD turnover to USD 509.3 mn. Foreign investors turned net buyers during the week, with a net buying position of USD 7.2 mn, from last week’s net selling position of USD 15.1 mn, taking the YTD net selling position to USD 15.7 mn.
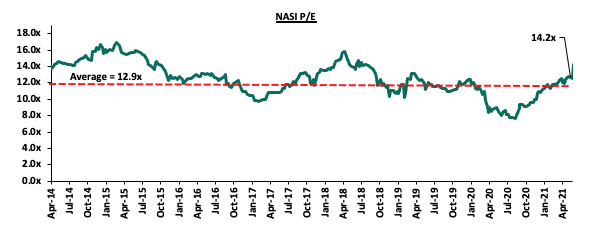
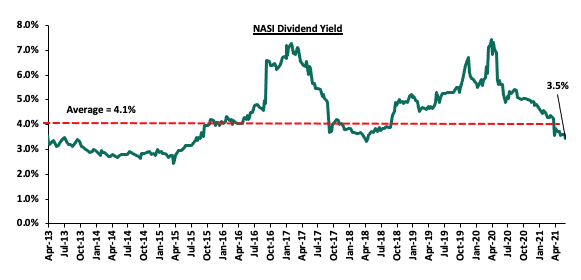
The market is currently trading at a price to earnings ratio (P/E) of 14.2x, which is 10.2% above the 12-year historical average of 12.9x, and a dividend yield of 3.5%, 0.6% points below the historical average of 4.1%. NASI’s high P/E ratio of 14.2x is mainly attributable to the price rally seen during the week by most stocks and it’s the highest it has been since July 2018 when the market was trading at a P/E ratio of 14.3x. Key to note, NASI’s PEG ratio currently stands at 1.6x, an indication that the market is trading at a premium to its future earnings growth. Basically, a PEG ratio greater than 1.0x indicates that the market may be overvalued while a PEG ratio less than 1.0x indicates that the market is undervalued. The current P/E valuation of 14.2x is 84.8% above the most recent trough valuation of 7.7x experienced in the first week of August 2020. The charts below indicates the historical P/E and dividend yields of the market.
Weekly Highlight:
During the week, Safaricom Plc announced that the Ethiopian Communications Authority (ECA) had approved a bid for an Ethiopia Telco License which was submitted by a consortium including Safaricom, Vodacom Group Ltd, Vodafone Group Plc (UK), CDC Group Plc and Sumitomo Corporation. The consortium’s financial bid of USD 850.0 mn (Kshs 91.8 bn) will allow the consortium to operate a telecommunications network in Ethiopia, but will not include a license to operate mobile money. The term of the license will be 15 years with the right to apply for an additional 15 years. Safaricom will own 55.7% shareholding of the consortium, with Sumitomo, CDC and Vodacom having a shareholding of 27.2%, 10.9% and 6.2%, respectively. Key to note, MTN’s bid of USD 600.0 mn for the second Ethiopian license was deemed not sufficient and hence rejected by the ECA
In our view, the consortium, which plans to begin operations in 2022, will generate an additional revenue stream for Safaricom and reduce the company’s reliance on the Kenyan market. The joint bid also means that the venture will be less capital intensive for Safaricom since the four companies will share costs, although Safaricom, as the majority shareholder, will bear the greater cost. Ethiopia, with a population of 112.0 mn people according to World Bank data, presents an untapped market for internet connectivity, with 66.0% of the population being covered by mobile network but do not have mobile internet access. For more information on the bid, see our Cytonn Monthly – April 2021.
Earnings Releases
During the week, KCB Group, Equity Group, I&M Holdings, NCBA Group, Diamond Trust Bank Kenya (DTB-K), Standard Chartered Bank Kenya, and HF Group released their Q1’2021 financial results. Below is a summary of their performance;
- KCB Group
Key Ratios
|
KCB Group Q1’2021 Key Highlights |
|||||
|
Balance Sheet |
|||||
|
Balance Sheet Items |
Q1’2020 (Kshs bn) |
Q1’2021 (Kshs bn) |
y/y change |
||
|
Net Loans and Advances |
553.9 |
597.1 |
7.8% |
||
|
Government Securities |
202.6 |
212.1 |
4.7% |
||
|
Total Assets |
947.1 |
977.5 |
3.2% |
||
|
Customer Deposits |
740.4 |
749.4 |
1.2% |
||
|
Deposits per Branch |
2.2 |
2.1 |
(1.9%) |
||
|
Total Liabilities |
811.5 |
830.0 |
2.3% |
||
|
Shareholders’ Funds |
135.5 |
147.5 |
8.8% |
||
|
Income Statement |
|||||
|
Income Statement Items |
Q1’2020 (Kshs bn) |
Q1’2021 (Kshs bn) |
y/y Change |
||
|
Net Interest Income |
15.1 |
16.7 |
11.1% |
||
|
Net non-Interest Income |
7.9 |
6.3 |
(20.0%) |
||
|
Total Operating income |
23.0 |
23.0 |
0.4% |
||
|
Loan Loss provision |
(2.90) |
(2.86) |
(1.3%) |
||
|
Total Operating expenses |
(14.0) |
(13.9) |
(0.8%) |
||
|
Profit before tax |
8.9 |
9.1 |
2.2% |
||
|
Profit after tax |
6.3 |
6.4 |
1.8% |
||
|
Core EPS |
1.95 |
1.98 |
1.8% |
||
|
Income Statement Ratios |
Q1’2020 |
Q1’2021 |
% point Change |
||
|
Yield from interest-earning assets |
10.8% |
10.9% |
0.1% |
||
|
Cost of funding |
2.8% |
2.6% |
(0.2%) |
||
|
Net Interest Margin |
8.1% |
8.4% |
0.3% |
||
|
Non-Performing Loans (NPL) Ratio |
11.1% |
14.9% |
3.8% |
||
|
NPL Coverage |
61.3% |
61.6% |
0.3% |
||
|
Cost to Income With LLP |
61.1% |
60.4% |
(0.7%) |
||
|
Loan to Deposit Ratio |
74.8% |
79.7% |
4.9% |
||
|
Cost to Income Without LLP |
48.5% |
48.0% |
(0.5%) |
||
|
Return on average equity |
20.1% |
13.9% |
(6.2%) |
||
|
Return on average assets |
3.1% |
2.0% |
(1.1%) |
||
|
Equity to Assets |
15.2% |
14.7% |
(0.5%) |
||
|
Capital Adequacy Ratios |
|||||
|
Ratios |
Q1’2020 |
Q1’2021 |
% point Change |
||
|
Core Capital/Total Liabilities |
17.1% |
19.2% |
2.1% |
||
|
Minimum Statutory ratio |
8.0% |
8.0% |
0.0% |
||
|
Excess |
9.1% |
11.2% |
2.1% |
||
|
Core Capital/Total Risk Weighted Assets |
17.1% |
18.2% |
1.1% |
||
|
Minimum Statutory ratio |
10.5% |
10.5% |
0.0% |
||
|
Excess |
6.6% |
7.7% |
1.1% |
||
|
Total Capital/Total Risk Weighted Assets |
19.0% |
21.8% |
2.8% |
||
|
Minimum Statutory ratio |
14.5% |
14.5% |
0.0% |
||
|
Excess |
4.5% |
7.3% |
2.8% |
||
Key take-outs from the earnings release include;
- Core earnings per share rose by 1.8% to Kshs 1.98, from Kshs 1.95 in Q1’2020, not in line with our projections of a 14.9% increase to Kshs 2.24. The performance was driven by a 0.4% growth in total operating income to Kshs 23.04 bn, from Kshs 22.95 bn in Q1’2020, and a 0.8% decline in total operating expenses to Kshs 13.9 bn, from Kshs 14.0 bn in Q1’2020,
- Interest income grew by 8.7% to Kshs 22.0 bn, from Kshs 20.2 bn in Q1’2020, mainly driven by a 12.9% increase in interest income from government securities which increased to Kshs 6.0 bn, from Kshs 5.3 bn in Q1’2020, coupled with a 7.9% increase in interest income from loans and advances, which increased to Kshs 15.8 bn from Kshs 14.7 bn in Q1’2020,
- The Yield on Interest-Earning Assets (YIEA) increased to 10.9% from 10.8% in Q1’2020, attributable to the faster 16.4% growth in trailing interest income, which outpaced the 14.8% growth in average interest earning assets,
- Interest expense rose by 1.8% to Kshs 5.24 bn, from Kshs 5.15 bn in Q1’2020, following a 51.1% rise in Interest expense on deposits and placements to Kshs 0.7 bn, from Kshs 0.5 bn in Q1’2020. The growth in interest expense was however mitigated by the 3.2% decline in Interest expense on customer deposits to Kshs 4.5 bn, from Kshs 4.7 bn in Q1’2020. Cost of funds declined marginally by 0.2% points to 2.6% from 2.8% recorded in Q1’2020,
- Total operating expenses decreased by 0.8% to Kshs 13.9 bn, from Kshs 14.0 bn in Q1’2020, largely driven by a 1.3% decline in Loan Loss Provisions (LLP) to Kshs 2.86 bn, from Kshs 2.90 bn in Q1’2020. Staff costs increased by 4.2% to Kshs 6.1 bn from Kshs 5.8 bn in Q1’2020,
- The balance sheet recorded an expansion as total assets grew by 3.2% to Kshs 977.5 bn, from Kshs 947.1 bn in Q1’2020. The growth was supported by a 7.8% loan book expansion to Kshs 597.1 bn, from Kshs 553.9 bn in Q1’2020, coupled with a 4.7% increase in government securities to Kshs 212.1 bn, from Kshs 202.6 bn in Q1’2020. Notably, the lender disclosed that they restructured 18.8% of the total loan book amounting to Kshs 102.5 bn. Of the restructured loans, the Real Estate Sector accounted for the highest amount of restructured loans at Kshs 29.6 bn during the period,
- Total liabilities rose by 2.3% to Kshs 830.0 bn, from Kshs 811.5 bn in Q1’2020, driven by a 63.7% rise in borrowings to Kshs 36.0 bn, from Kshs 22.0 bn in Q1’2020. Customer deposits increased by 1.2% to Kshs 749.4 bn from Kshs 740.4 bn, with customer deposits from NBK amounting to Kshs 99.1 bn in Q1’2021,
- Deposits per branch decreased by 1.9% to Kshs 2.1 bn from Kshs 2.2 bn in Q1’2020, with the number of branches increasing to 355 at the end of Q1’2021, from 344 in Q1’2020, due to the group increasing 10 branches in Kenya, 2 branches in South Sudan and 1 branch in Rwanda. The group however closed 2 branches in Uganda during the period,
- Gross non-performing loans increased by 48.1% to Kshs 98.0 bn in Q1’2021, from Kshs 66.2 bn in Q1’2020. Consequently, the NPL ratio rose to 14.9% in Q1’2021, from 11.1% in Q1’2020, attributable to the faster 48.1% growth in Non-Performing Loans, which outpaced the 7.8% growth in loans. The rise in non-performing loans was mainly attributable to the poor performance from the Corporate segment, MSME segment, mortgage segment and Check-Off loans recording NPL ratios of 19.3%, 13.6%, 9.6% and 2.8%, respectively,
- Loan Loss Provisions (LLP) decreased by 1.3% y/y to Kshs 2.86 bn in Q1’2021, from Kshs 2.90 bn in Q1’2020. The NPL coverage on the other hand improved to 61.6% in Q1’2021, from 61.3% in Q1’2020, as general Loan Loss Provisions increased by 52.3% to Kshs 47.1 bn, from Kshs 30.9 bn in Q1’2020, attributable to the deterioration in the group’s asset quality with the NPL ratio rising to 14.9% from 11.1% in Q1’2020, and,
- KCB Group remains sufficiently capitalized with a core capital to risk-weighted assets ratio of 18.2%, 7.7% points above the statutory requirement. In addition, the total capital to risk-weighted assets ratio came in at 21.8%, exceeding the statutory requirement by 7.3% points. Adjusting for IFRS 9, the core capital to risk-weighted assets stood at 18.3%, while total capital to risk-weighted assets came in at 21.9%.
For a comprehensive analysis, please see our KCB Group Q1’2021 Earnings Note
- Equity Group
|
Equity Group Q1’2021 Key Highlights |
|||
|
Balance Sheet |
|||
|
Balance Sheet items |
Q1’2020 (Kshs bns) |
Q1’2021 (Kshs bns) |
y/y change |
|
Government Securities |
157.6 |
183.0 |
16.1% |
|
Net Loans and Advances |
379.2 |
487.7 |
28.6% |
|
Total Assets |
693.2 |
1,066.4 |
53.8% |
|
Customer Deposits |
499.3 |
789.9 |
58.2% |
|
Deposits Per Branch |
1.7 |
2.4 |
41.3% |
|
Total Liabilities |
576.8 |
926.0 |
60.5% |
|
Shareholders’ Funds |
115.3 |
133.9 |
16.1% |
|
Income Statement |
|||
|
Income Statement Items |
Q1’2020 (Kshs bns) |
Q1’2021 (Kshs bns) |
y/y change |
|
Net Interest Income |
11.5 |
14.8 |
28.4% |
|
Net non-Interest Income |
8.3 |
10.9 |
30.7% |
|
Total Operating income |
19.9 |
25.7 |
29.3% |
|
Loan Loss provision |
(3.1) |
(1.3) |
(59.3%) |
|
Total Operating expenses |
(12.9) |
(14.0) |
8.7% |
|
Profit before tax |
7.0 |
11.7 |
67.1% |
|
Profit after tax |
5.3 |
8.7 |
63.8% |
|
Core EPS |
1.4 |
2.3 |
63.8% |
|
Key Ratios |
|||
|
Ratios |
Q1’2020 |
Q1’2021 |
% point change |
|
Yield from interest-earning assets |
11.0% |
10.3% |
(0.7%) |
|
Cost of funding |
3.0% |
2.8% |
(0.2%) |
|
Net Interest Margin |
8.2% |
7.6% |
(0.6%) |
|
Non- Performing Loans (NPL) Ratio |
11.2% |
12.1% |
0.9% |
|
NPL Coverage |
45.8% |
55.5% |
9.7% |
|
Cost to Income with LLP |
64.7% |
54.4% |
(10.3%) |
|
Loan to Deposit Ratio |
75.9% |
61.7% |
(14.2%) |
|
Return on Average Assets |
3.3% |
2.7% |
(0.6%) |
|
Return on Average Equity |
20.7% |
18.9% |
(1.8%) |
|
Equity to Assets |
16.2% |
14.2% |
(2.0%) |
|
Capital Adequacy Ratios |
|||
|
Ratios |
Q1'2020 |
Q1'2021 |
% point change |
|
Core Capital/Total Liabilities |
21.9% |
15.8% |
(6.1%) |
|
Minimum Statutory ratio |
8.0% |
8.0% |
0.0% |
|
Excess |
13.9% |
7.8% |
(6.1%) |
|
Core Capital/Total Risk Weighted Assets |
17.5% |
14.2% |
(3.3%) |
|
Minimum Statutory ratio |
10.5% |
10.5% |
0.0% |
|
Excess |
7.0% |
3.7% |
(6.1%) |
|
Total Capital/Total Risk Weighted Assets |
21.0% |
18.0% |
(3.0%) |
|
Minimum Statutory ratio |
14.5% |
14.5% |
0.0% |
|
Excess |
6.5% |
3.5% |
(3.0%) |
Key take-outs from the earnings release include;
- Core earnings per share increased by 63.8% to Kshs 2.3, from Kshs 1.4 recorded in Q1’2020, better than our projections of a 15.2% increase to Kshs 1.6. The performance was driven by a 29.3% growth in total operating income to Kshs 25.7 bn, outpacing the 8.7% growth in total operating expenses.
- Interest income increased by 31.9% to Kshs 20.3 bn, from Kshs 15.4 bn in Q1’2020 driven by a 31.5% increase in interest income on loans and advances to Kshs 14.2 bn, from Kshs 10.8 bn in Q1’2020, and a 30.1% increase in interest income from government securities to Kshs 5.9 bn, from Kshs 4.5 bn in Q1’2020,
- he Yield on Interest-Earning Assets (YIEA), however, declined to 10.3%, from 11.0% in Q1’2020, as the average interest-earning assets grew faster by 36.9% to Kshs 767.2 bn, from Kshs 560.4 bn in Q1’2020 compared to the 27.6% increase in trailing interest income,
- Interest expense rose by 42.4% to Kshs 5.5 bn, from Kshs 3.9 bn in Q1’2020, following a 47.6% increase in interest expense on customer deposits to Kshs 4.2 bn, from Kshs 2.8 bn in Q1’2020, coupled with an 137.0% increase in interest expense on deposits and placements from banking institutions to Kshs 0.3 bn, from Kshs 0.1 bn in Q1’2020. Cost of funds, on the other hand, declined marginally by 0.2% points to 2.8%, from 3.0% in Q1’2020, owing to the faster 38.2% growth in average interest-bearing liabilities, which outpaced the 30.2% growth in the trailing interest expense,
- Total operating expenses grew by 8.7% to Kshs 14.0 bn in Q1’2021, from Kshs 12.9 bn recorded in Q1’2020, mainly driven by the 24.5% increase in Staff Costs to Kshs 4.0 bn, from Kshs 3.2 bn. On the other hand, Loan Loss Provisions declined by 59.3% to Kshs 1.3 bn, from Kshs 3.1 bn recorded in Q1’2020. The reduced provision level was on the back of increased business activities during the quarter driven by the gradual recovery of the operating environment,
- The balance sheet recorded an expansion as Total Assets increased by 53.9% to Kshs 1,066.4 bn, from Kshs 693.2 bn recorded in Q1’2020. This growth was largely driven by a 28.6% increase in the loan book to Kshs 487.7 bn, from Kshs 379.2 bn recorded in Q1’2020, coupled with a 26.8% growth in Investment in government securities to Kshs 169.9 bn, from Kshs 142.4 bn recorded in Q1’2020. The remarkable expansion in the balance sheet is partly attributable to the consolidation of the Congolese lender, Banque Commerciale Du Congo (BCDC) for the 66.5% stake acquisition in August 2020,
- Total liabilities rose by 60.5% to Kshs 926.0 bn, from Kshs 576.8 bn in Q1’2020, driven by a 58.2% increase in customer deposits to Kshs 789.9 bn, from Kshs 499.3 bn in Q1’2020. Key to note, the strong growth in customer deposits is mainly attributable to the acquisition of BCDC, with the subsidiary contributing Kshs 265.9 bn to the total deposits,
- Deposits per branch increased by 41.3% to Kshs 2.4 bn, from Kshs 1.7 bn in Q1’2020, with the number of branches increasing by 36 to 336 branches in Q1’2021, from 300 in Q1’2020, with Equity BCDC contributing 26 additional branches,
- Gross Non-Performing Loans (NPLs) increased by 42.2% to Kshs 63.5 bn in Q1’2021, from Kshs 44.6 bn recorded in Q1’2020. The NPL ratio rose to 12.1% in Q1’2021, from 11.2% recorded in Q1’2020, attributable to the faster 42.2% growth in Gross Non-Performing Loans (NPLs), compared to the 30.8% increase in gross loans,
- The general Loan Loss Provisions increasing by 82.4% to Kshs 27.5 bn, from Kshs 15.1 bn in Q1’2020, higher than the 42.2% rise in the Gross Non-Performing Loans, the NPL coverage improved to 55.5%, from 45.8% in Q1’2020, an indication of sufficient provisioning, and,
- Equity Group is currently sufficiently capitalized with a core capital to risk-weighted assets ratio of 14.2%, 3.7% points above the statutory requirement. In addition, the total capital to risk-weighted assets ratio was 18.0%, exceeding the statutory requirement by 3.5% points. Adjusting for IFRS 9, the core capital to risk-weighted assets stood at 14.3% while total capital to risk-weighted assets came in at 18.1%.
For a comprehensive analysis, please see our Equity Group Q1’2021 Earnings Note
- I&M Holdings
|
I&M Holdings Q1’2021 Key Highlights |
|||
|
Balance Sheet |
|||
|
Balance Sheet Items |
Q1’2020 (Kshs bn) |
Q1’2021 (Kshs bn) |
y/y change |
|
Government Securities |
54.1 |
102.4 |
89.5% |
|
Net Loans and Advances |
182.9 |
193.2 |
5.6% |
|
Total Assets |
336.0 |
364.4 |
8.5% |
|
Customer Deposits |
240.7 |
263.1 |
9.3% |
|
Deposits per branch |
3.6 |
4.0 |
11.0% |
|
Total Liabilities |
273.3 |
294.9 |
7.9% |
|
Shareholders’ Funds |
59.3 |
65.6 |
10.5% |
|
|
|
|
|
|
Income Statement |
|||
|
Income Statement Items |
Q1’2020 (Kshs bn) |
Q1’2021 (Kshs bn) |
y/y change |
|
Net Interest Income |
3.5 |
4.3 |
23.4% |
|
Net non-Interest Income |
2.2 |
1.8 |
(17.7%) |
|
Total Operating income |
5.7 |
6.1 |
7.4% |
|
Loan Loss provision |
(0.6) |
(0.8) |
36.7% |
|
Total Operating expenses |
(3.0) |
(3.6) |
18.0% |
|
Profit before tax |
2.5 |
2.7 |
7.0% |
|
Profit after tax |
1.7 |
1.9 |
13.5% |
|
Core EPS |
2.0 |
2.3 |
13.5% |
|
Key Ratios |
|||
|
Income statement ratios |
Q1'2020 |
Q1'2021 |
% point change |
|
Yield from interest-earning assets |
10.1% |
9.4% |
(0.7%) |
|
Cost of funding |
4.7% |
4.4% |
(0.3%) |
|
Net Interest Margin |
5.8% |
5.4% |
(0.4%) |
|
Non-Performing Loans (NPL) Ratio |
11.3% |
11.9% |
0.6% |
|
NPL Coverage |
58.8% |
61.1% |
2.3% |
|
Cost to Income With LLP |
52.9% |
58.0% |
5.1% |
|
Loan to Deposit Ratio |
76.0% |
73.4% |
(2.6%) |
|
Cost to Income Without LLP |
43.1% |
45.7% |
2.6% |
|
Return on average equity |
17.5% |
13.3% |
(4.2%) |
|
Return on average assets |
3.0% |
2.4% |
(0.6%) |
|
Equity to assets |
17.2% |
17.8% |
0.6% |
|
Capital Adequacy Ratios |
Q1'2020 |
Q1'2021 |
% Points change |
|
Core Capital/Total Liabilities |
21.8% |
22.3% |
0.5% |
|
Minimum Statutory ratio |
8.0% |
8.0% |
0.0% |
|
Excess |
13.8% |
14.3% |
0.5% |
|
Core Capital/Total Risk Weighted Assets |
16.8% |
18.1% |
1.3% |
|
Minimum Statutory ratio |
10.5% |
10.5% |
0.0% |
|
Excess |
6.3% |
7.6% |
1.3% |
|
Total Capital/Total Risk Weighted Assets |
21.1% |
21.6% |
0.5% |
|
Minimum Statutory ratio |
14.5% |
14.5% |
0.0% |
|
Excess |
6.6% |
7.1% |
0.5% |
Key take-outs from the earnings release include;
- Core earnings per share increased by 13.5% to Kshs 2.3, from Kshs 2.0 in Q1’2020 driven by a 23.4% increase in Net Interest Income to Kshs 4.3 bn, from Kshs 3.5 in Q1’2020,
- Interest income rose by 10.2% to Kshs 7.1 bn, from Kshs 6.5 bn in Q1’2020. This was driven by a 104.9% growth in interest income from government securities to Kshs 2.1 bn, from Kshs 1.0 bn in Q1’2020. The growth in interest income was however weighed down by a 68.8% decline in interest income from placements to Kshs 46.2 mn, from Kshs 147.9 mn in Q1’2020, coupled with a 4.7% decline in interest income from loans and advances to Kshs 5.1 bn, from Kshs 5.3 bn in Q1’2020,
- The Yield on Interest-Earning Assets (YIEA) declined to 9.4% from 10.1% in Q1’2020, largely attributable to the faster 11.1% growth in average interest earning assets which outpaced the 3.6% growth in trailing Interest Income,
- Interest expense declined by 5.2% to Kshs 2.8 bn, from Kshs 3.0 bn in Q1’2020, following a 9.6% decline in Interest expense on deposits to Kshs 2.4 bn, from Kshs 2.6 bn in Q1’2020. The decline in interest expense was however weighed down by a 46.1% growth in the interest expense on placements to Kshs 248.9 mn, from Kshs 170.3 mn in Q1’2020. Cost of funds declined by 0.3% points to 4.4% from 4.7% recorded in Q1’2020, following a 9.7% increase in average interest bearing liabilities, which outpaced the 2.1% increase in trailing interest expense,
- Total operating expenses rose by 18.0% to Kshs 3.6 bn from Kshs 3.0 bn in Q1’2020, largely driven by a 36.7% increase in Loan Loss Provisions (LLP) to Kshs 0.8 bn, from Kshs 0.6 bn in Q1’2020, on account of the poor operating environment brought about by COVID-19 which has adversely affected individuals and businesses’ ability to repay loans. Staff costs on the other hand, remained relatively unchanged at Kshs 1.2 bn during the period,
- The balance sheet recorded an expansion as total assets grew by 8.5% to Kshs 364.4 bn, from Kshs 336.0 bn in Q1’2020. The growth was supported by an 89.5% increase in government securities to Kshs 102.4 bn, from Kshs 54.1 bn in Q1’2020, coupled with a 5.6% loan book expansion to Kshs 193.2 bn, from Kshs 182.9 bn in Q1’2020. The increased allocation to government securities seen during the period was partly attributable to the elevated credit risk associated with lending to customers following the adverse effects of the ongoing pandemic on the operating environment,
- Total liabilities rose by 7.9% to Kshs 294.9 bn, from Kshs 273.3 bn in Q1’2020, driven by a 9.3% rise in customer deposits to Kshs 263.1 bn, from Kshs 240.7 bn in Q1’2020. The growth was however mitigated by a 22.3% decline in placements liabilities to Kshs 10.2 bn, from Kshs 13.2 bn in Q1’2020,
- Deposits per branch increased by 11.0% to Kshs 4.0 bn from Kshs 3.6 bn in Q1’2020, with the number of branches declining to 66 from 67 branches in Q1’2020,
- Gross non-performing loans increased by 11.3% to Kshs 24.7 bn in Q1’2021, from Kshs 22.2 bn in Q1’2020. Consequently, the NPL ratio, rose to 11.9% in Q1’2021, from 11.3% in Q1’2020, attributable to the faster 11.3% increase in Gross Non-Performing Loans, which outpaced the 6.3% growth in gross loans,
- The NPL coverage on the other hand improved to 61.1% in Q1’2021, from 58.8% in Q1’2020, as general Loan Loss Provisions increased by 24.4% to Kshs 11.2 bn from Kshs 9.0 bn in Q1’2020, and,
- I&M Holdings Plc remains sufficiently capitalized with a core capital to risk-weighted assets ratio of 18.1%, 7.6% points above the statutory requirement. In addition, the total capital to risk-weighted assets ratio came in at 21.6%, exceeding the statutory requirement by 7.1% points. Adjusting for IFRS 9, the core capital to risk-weighted assets stood at 18.1%, while total capital to risk-weighted assets came in at 21.7%.
For a comprehensive analysis, please see our I&M Holdings Q1’2021 Earnings Note
- Diamond Trust Bank Kenya (DTB-K)
|
Diamond Trust Bank (DTB-K) Q1’2021 Key Highlights |
|||
|
Balance Sheet |
|||
|
Balance Sheet items |
Q1’2020 (Kshs bns) |
Q1’2021 (Kshs bns) |
y/y change |
|
Government Securities |
128.2 |
138.4 |
7.9% |
|
Net Loans and Advances |
201.3 |
205.8 |
2.3% |
|
Total Assets |
385.0 |
417.3 |
8.4% |
|
Customer Deposits |
272.8 |
301.8 |
10.6% |
|
Deposits Per Branch |
2.0 |
2.3 |
10.6% |
|
Total Liabilities |
318.1 |
346.9 |
9.0% |
|
Shareholders’ Funds |
61.0 |
64.0 |
4.8% |
|
Income Statement |
|||
|
Income Statement Items |
Q1’2020 (Kshs bns) |
Q1’2021 (Kshs bns) |
y/y change |
|
Net Interest Income |
4.7 |
5.0 |
6.2% |
|
Net non-Interest Income |
1.6 |
1.6 |
(1.9%) |
|
Total Operating income |
6.3 |
6.5 |
4.1% |
|
Loan Loss provision |
0.4 |
0.7 |
67.7% |
|
Total Operating expenses |
3.3 |
3.5 |
6.1% |
|
Profit before tax |
3.0 |
3.0 |
1.3% |
|
Profit after tax |
2.0 |
2.1 |
0.5% |
|
Core EPS |
7.3 |
7.3 |
0.5% |
|
Key Ratios |
|||
|
Ratios |
Q1’2020 |
Q1’2021 |
% point change |
|
Yield from interest-earning assets |
9.8% |
9.0% |
(0.8%) |
|
Cost of funding |
4.5% |
4.0% |
(0.5%) |
|
Net Interest Margin |
5.7% |
5.3% |
(0.4%) |
|
Non- Performing Loans (NPL) Ratio |
8.0% |
10.6% |
2.6% |
|
NPL Coverage |
42.1% |
46.5% |
4.4% |
|
Cost to Income with LLP |
52.9% |
54.0% |
1.1% |
|
Loan to Deposit Ratio |
73.8% |
68.2% |
(5.6%) |
|
Return on average assets |
1.9% |
0.9% |
(1.1%) |
|
Return on average equity |
12.6% |
5.7% |
(6.9%) |
|
Equity to Assets |
15.4% |
15.6% |
0.2% |
|
Capital Adequacy Ratios |
|||
|
Ratios |
Q1'2020 |
Q1'2021 |
% point change |
|
Core Capital/Total Liabilities |
23.7% |
22.8% |
(0.9%) |
|
Minimum Statutory ratio |
8.0% |
8.0% |
0.0% |
|
Excess |
15.7% |
14.8% |
(0.9%) |
|
Core Capital/Total Risk Weighted Assets |
19.3% |
20.8% |
1.5% |
|
Minimum Statutory ratio |
10.5% |
10.5% |
0.0% |
|
Excess |
8.8% |
10.3% |
1.5% |
|
Total Capital/Total Risk Weighted Assets |
21.0% |
22.4% |
1.4% |
|
Minimum Statutory ratio |
14.5% |
14.5% |
0.0% |
|
Excess |
6.5% |
7.9% |
1.4% |
Key take-outs from the earnings release include;
- The bank’s core earnings per share increased marginally by 0.5% to Kshs 7.34, from Kshs 7.30 in Q1’2020 driven by the 6.1% increase in total operating expenses, which outpaced the 4.1% increase in total operating income to Kshs 6.5 bn from Kshs 6.3 bn in Q1’2020,
- Interest income increased by 4.8% to Kshs 8.3 bn, from Kshs 8.0 bn in Q1’2020 driven by a 58.5% increase in Interest income from deposit placements to Kshs 41.9 mn, from Kshs 26.4 mn in Q1’2020 coupled with a 13.5% increase in interest income from government securities to Kshs 3.5 bn from Kshs 3.1 bn in Q1’2020. On the other hand, interest income from loans and advances declined by 1.1% to Kshs 4.76 bn, from Kshs 4.82 bn in Q1’2020,
- The Yield on Interest-Earning Assets (YIEA)declined to 9.0% from 9.8% in Q1’2020, attributable to the 4.9% increase in average interest-earning assets to Kshs 347.9 bn, from Kshs 331.7 bn in Q1’2020, which outpaced the 3.6% decline in trailing interest income,
- Interest expense rose by 2.9% to Kshs 3.4 bn, from Kshs 3.3 bn in Q1’2020, following a 5.5% increase in interest expense on customer deposits to Kshs 2.9 bn, from Kshs 2.8 bn in Q1’2020. The increase was however mitigated by a 24.9% decline in interest expense on placement liabilities to Kshs 143.7 mn, from Kshs 191.4 mn in Q1’2020, coupled with a 4.0% decline in other interest expenses to Kshs 286.5 mn, from Kshs 298.3 mn in Q1’2020. Cost of funds, declined by 0.5% points to 4.0% from 4.5% in Q1’2020, owing to the 5.1% decline in trailing interest expenses coupled with a faster 8.7% growth in interest-bearing liabilities, an indication that the bank was able to mobilize cheaper deposits,
- Total operating income increased by 4.1% to Kshs 6.5 bn, from Kshs 6.3 bn in Q1’2020 mainly driven by a 6.2% increase in the Net Interest Income (NII) to Kshs 5.0 bn, from Kshs 4.7 bn in Q1’2020. This was however weighed down by a 1.9% decline in Non-Funded Income (NFI) to Kshs 1.56 bn, from Kshs 1.59 bn in Q1’2020,
- The balance sheet recorded an expansion as Total Assets increased by 8.4% to Kshs 417.3 bn, from Kshs 385.0 bn recorded in Q1’2020. This growth was largely driven by 12.6% increase in government securities to Kshs 138.4 bn, from Kshs 128.2 bn in Q1’2020, coupled with a 2.3% growth in net loans to Kshs 205.8 bn, from Kshs 201.3 bn in Q1’2020
- Total liabilities grew by 9.0% to Kshs 346.9 bn, from Kshs 318.1 bn in Q1’2020, driven by a 44.6% increase in borrowings to Kshs 21.8 bn, from Kshs 15.1 bn in Q1’2020, following the additional debts the bank acquired to finance its operations and boost liquidity during the period, coupled with a 10.6% increase in customer deposits to Kshs 301.8 bn from Kshs 272.8 bn in Q1’2020,
- Deposits per branch increased by 10.6% to Kshs 2.3 bn, from Kshs 2.0 bn despite the number of branches remained unchanged at 134 in Q1’2021. However, the number of branches is set to decline as the bank plans to shut down six branches from July 2021 owing to its rising operational costs,
- Gross Non-Performing Loans (NPLs) rose by 38.1% to Kshs 22.9 bn in Q1’2021, from Kshs 16.6 bn recorded in Q1’2020. Consequently, the NPL ratio rose to 10.6% from 8.0% recorded in Q1’2020, due to the faster 38.1% growth in gross NPLs which outpaced the 3.9% growth in gross loans,
- General Loan Loss Provisions increased by 124.4% to Kshs 10.1 bn from Kshs 4.5 bn in Q1’2020. Consequently, the NPL coverage (having added interest in suspense) increased to 46.5% in Q1’2021, from 42.4% in Q1’2020, owing to the faster 124.4% increase in general provisions, which outpaced the 38.1% growth in Gross NPLs, and,
- Diamond Trust Bank is currently sufficiently capitalized with a core capital to risk-weighted assets ratio of 20.8%, 10.3% points above the statutory requirement. In addition, the total capital to risk-weighted assets ratio was 22.4%, exceeding the 14.5% statutory requirement by 7.9% points. Adjusting for IFRS 9, the core capital to risk-weighted assets stood at 21.3%, while total capital to risk-weighted assets came in at 22.9%.
For a comprehensive analysis, please see our Diamond Trust Bank (DTB-K) Q1’2021 Earnings Note
- NCBA Group
|
NCBA Group Q1’2021 Key Highlights |
|||
|
Balance Sheet |
|||
|
Balance Sheet items |
Q1’2020 (Kshs bns) |
Q1’2021 (Kshs bns) |
y/y change |
|
Government Securities |
136.5 |
157.1 |
15.1% |
|
Net Loans and Advances |
245.9 |
243.1 |
(1.1%) |
|
Total Assets |
509.6 |
542.1 |
6.4% |
|
Customer Deposits |
390.5 |
434.2 |
11.2% |
|
Deposits Per Branch |
5.6 |
6.2 |
11.2% |
|
Total Liabilities |
440.8 |
467.5 |
6.1% |
|
Shareholders’ Funds |
68.6 |
74.4 |
8.5% |
|
Income Statement |
|||
|
Income Statement Items |
Q1’2020 (Kshs bns) |
Q1’2021 (Kshs bns) |
y/y change |
|
Net Interest Income |
5.5 |
6.6 |
19.9% |
|
Net non-Interest Income |
5.4 |
5.2 |
(3.3%) |
|
Total Operating income |
10.9 |
11.8 |
8.3% |
|
Loan Loss provision |
3.8 |
2.6 |
(30.1%) |
|
Total Operating expenses |
8.3 |
7.8 |
(6.5%) |
|
Profit before tax |
2.4 |
3.9 |
60.2% |
|
Profit after tax |
1.6 |
2.8 |
73.8% |
|
Core EPS |
1.0 |
1.7 |
73.8% |
|
Key Ratios |
|||
|
Ratios |
Q1’2020 |
Q1’2021 |
% point change |
|
Yield from interest-earning assets |
6.3% |
10.0% |
3.7% |
|
Cost of funding |
3.1% |
4.2% |
1.1% |
|
Net Interest Margin |
3.3% |
5.9% |
2.6% |
|
Non- Performing Loans (NPL) Ratio |
14.5% |
14.7% |
0.2% |
|
NPL Coverage |
54.5% |
65.0% |
10.5% |
|
Cost to Income with LLP |
76.1% |
65.6% |
10.5% |
|
Loan to Deposit Ratio |
63.0% |
56.0% |
(7.0%) |
|
Return on average assets |
1.5% |
1.1% |
(0.4%) |
|
Return on average equity |
10.7% |
8.1% |
(2.6%) |
|
Equity to Assets |
13.9% |
13.6% |
(0.3%) |
|
Capital Adequacy Ratios |
|||
|
Ratios |
Q1'2020 |
Q1'2021 |
% point change |
|
Core Capital/Total Liabilities |
17.4% |
15.6% |
(1.8%) |
|
Minimum Statutory ratio |
8.0% |
8.0% |
0.0% |
|
Excess |
9.4% |
7.6% |
(1.8%) |
|
Core Capital/Total Risk Weighted Assets |
17.9% |
18.2% |
0.3% |
|
Minimum Statutory ratio |
10.5% |
10.5% |
0.0% |
|
Excess |
7.4% |
7.7% |
0.3% |
|
Total Capital/Total Risk Weighted Assets |
18.5% |
18.3% |
(0.2%) |
|
Minimum Statutory ratio |
14.5% |
14.5% |
0.0% |
|
Excess |
4.0% |
3.8% |
(0.2%) |
Key take-outs from the earnings release include;
- Core earnings per share rose by 73.8% to Kshs 1.7, from Kshs 1.0 in Q1’2020, driven by the 8.3% growth in total operating income to Kshs 11.8 bn, from Kshs 10.9 bn in Q1’2020 coupled with the 6.5% decline in total operating expenses to Kshs 7.8 bn, from 8.3 bn in Q1’2020,
- Interest income rose by 8.1% to Kshs 11.0 bn, from Kshs 10.2 bn in Q1’2020 mainly driven by i) 14.7% growth in interest income from government securities to Kshs 4.4 bn, from Kshs 3.8 bn in Q1’2020, ii) 5.4% rise in interest income from loans and advances to Kshs 6.5 bn, from Kshs 6.1 bn in Q1’2020. However, the growth was weighed down by a 61.5% decline in interest income from deposits and placements with banking institutions to Kshs 51.5 mn, from Kshs 133.7 mn in Q1’2020,
- The Yield on Interest-Earning Assets (YIEA) increased by 3.7% points to 10.0% in Q1’2021, from 6.3% in Q1’2020, attributable to the slower 9.3% increase in average interest-earning assets to Kshs 450.9 bn, from Kshs 412.4 bn in Q1’2020, which was outpaced by the 72.3% increase in trailing interest income,
- Interest expense declined by 5.7% to Kshs 4.4 bn, from Kshs 4.7 bn in Q1’2020, mainly attributable to an 88.9% decline in interest expense on deposits and placements from banking institutions to Kshs 12.3 mn, from Kshs 111.2 mn in Q1’2020. The decline was weighed down by a 3.5% increase in interest expense on customer deposits to Kshs 4.3 bn, from Kshs 4.2 bn in Q1’2020.
- Cost of funds increased by 1.1% point to 4.2% from 3.1% in Q1’2020 owing to the 47.5% increase in trailing interest expense that outpaced the 6.7% growth in average interest bearing liabilities. This points out that the Bank was unable to mobilize cheaper deposits,
- Total operating income rose by 8.3% to Kshs 11.8 bn in Q1’2021, from Kshs 10.9 bn in Q1’2020. This was due to a 19.9% increase in Net Interest Income (NII) to Kshs 6.6 bn, from Kshs 5.5 bn recorded in Q1’2020. This was however weighed down by a 3.3% decline in Non-Funded Income (NFI) to Kshs 5.2 bn, from the Kshs 5.4 bn recorded in Q1’2020,
- The balance sheet recorded an expansion with total assets growing by 6.4% to Kshs 542.1 bn, fromKshs 509.6 bn in Q1’2020. This growth was largely driven by a 93.1% increase in bank placements to Kshs 57.2 bn, from Kshs 29.6 bn in Q1’2020 coupled with a 15.1% increase in government securities to Kshs 157.1 bn, from the Kshs 136.5 bn recorded in Q1’2020. On the other hand, the loan book contracted by 1.1% to Kshs 243.1 bn, from Kshs 245.9 bn in Q1’2020, partly attributable to the bank’s cautious lending due to elevated credit risk emanating from the subdued operating environment,
- Total liabilities rose by 6.1% to Kshs 467.5 bn, from Kshs 440.8 bn in Q1’2020, driven by an 11.2% growth in customer deposits to Kshs 434.2 bn, from Kshs 390.5 bn in Q1’2020,
- Deposits per branch increased by 11.2% to Kshs 6.2 bn, from Kshs 5.6 bn in Q1’2021, with the number of branches remaining unchanged at 70,
- Gross non-performing loans (NPLs) rose by 1.9% to Kshs 39.6 bn in Q1’2021, from Kshs 38.8 bn in Q1’2020 taking the NPL ratio to 14.7% in Q1’2021, from 14.5% in Q1’2020. The deterioration in the group’s asset quality is mainly attributable to the faster 1.9% increase in NPLs that outpaced the 0.7% increase in gross loans,
- With the General loan loss provisions increasing by 35.6% to Kshs 18.7 bn, from Kshs 13.8 bn in Q1’2020, higher than the 1.9% growth in gross NPLs, the NPL coverage rose to 65.0% in Q1’2021, from 54.5% in Q1’2020, and,
- NCBA Group is currently sufficiently capitalized with a core capital to risk weighted assets ratio of 18.2%, 7.7% above the statutory requirement. In addition, the total capital to risk weighted assets ratio was 18.3%, exceeding the statutory requirement by 3.8%. Adjusting for IFRS 9, the core capital to risk weighted assets stood at 18.4%, while total capital to risk weighted assets came in at 18.6%.
For a comprehensive analysis, please see our NCBA Group Q1’2021 Earnings Note
- Standard Chartered Bank Kenya
|
Standard Chartered Bank Kenya Q1’2021 Key Highlights |
|||
|
Balance Sheet |
|||
|
Balance Sheet items |
Q1’2020 (Kshs bns) |
Q1’2021 (Kshs bns) |
y/y change |
|
Government Securities |
95.0 |
102.4 |
7.8% |
|
Net Loans and Advances |
125.5 |
117.9 |
(6.1%) |
|
Total Assets |
311.5 |
339.3 |
8.9% |
|
Customer Deposits |
243.6 |
265.2 |
8.9% |
|
Deposits per branch |
6.8 |
7.4 |
8.9% |
|
Total Liabilities |
261.6 |
286.4 |
9.4% |
|
Shareholders’ Funds |
49.8 |
52.9 |
6.1% |
|
Income Statement |
|||
|
Income Statement Items |
Q1’2020 (Kshs bns) |
Q1’2021 (Kshs bns) |
y/y change |
|
Net Interest Income |
4.7 |
4.6 |
(2.8%) |
|
Net non-Interest Income |
2.2 |
2.5 |
11.1% |
|
Total Operating income |
7.0 |
7.1 |
1.7% |
|
Loan Loss provision |
0.4 |
0.4 |
(3.5%) |
|
Total Operating expenses |
4.0 |
3.7 |
(9.0%) |
|
Profit before tax |
2.9 |
3.4 |
16.6% |
|
Profit after tax |
2.0 |
2.4 |
18.9% |
|
Core EPS |
5.3 |
6.3 |
18.9% |
|
Key Ratios |
|||
|
Ratios |
Q1’2020 |
Q1’2021 |
% point change |
|
Yield from interest-earning assets |
9.4% |
8.1% |
(1.3%) |
|
Cost of funding |
2.4% |
1.6% |
(0.8%) |
|
Net Interest Margin |
7.2% |
6.7% |
(0.6%) |
|
Non- Performing Loans (NPL) Ratio |
14.2% |
16.4% |
2.2% |
|
NPL Coverage |
78.1% |
81.1% |
3.0% |
|
Cost to Income with LLP |
58.1% |
52.0% |
(6.1%) |
|
Loan to Deposit Ratio |
51.5% |
44.4% |
(7.1%) |
|
Return on average assets |
2.6% |
1.8% |
(0.8%) |
|
Return on average equity |
15.8% |
11.3% |
(4.5%) |
|
Equity to Assets |
16.1% |
15.8% |
(0.3%) |
|
Capital Adequacy Ratios |
|||
|
Ratios |
Q1'2020 |
Q1'2021 |
% point change |
|
Core Capital/Total Liabilities |
15.1% |
15.1% |
0.0% |
|
Minimum Statutory ratio |
8.0% |
8.0% |
0.0% |
|
Excess |
7.1% |
7.1% |
0.0% |
|
Core Capital/Total Risk Weighted Assets |
15.0% |
15.9% |
0.9% |
|
Minimum Statutory ratio |
10.5% |
10.5% |
0.0% |
|
Excess |
4.5% |
5.4% |
0.9% |
|
Total Capital/Total Risk Weighted Assets |
18.0% |
18.3% |
0.3% |
|
Minimum Statutory ratio |
14.5% |
14.5% |
0.0% |
|
Excess |
3.5% |
3.8% |
0.3% |
Key take-outs from the earnings release include;
- Core earnings per share increased by 18.9% to Kshs 6.3, from Kshs 5.3 recorded in Q1’2020, not in line with our projections of a 29.2% increase to Kshs 6.9. The increase was mainly driven by a 9.0% decline in total operating expenses to Kshs 3.7 bn, from Kshs 4.0 bn recorded in Q1’2020, coupled with a 1.7% increase in total operating income to Kshs 7.1 bn, from Kshs 7.0 bn recorded in Q1’2020,
- Interest income declined by 9.0% to Kshs 5.6 bn, from Kshs 6.1 bn in Q1’2020 driven by a 9.0% decline in interest income on loans and advances to Kshs 2.9 bn, from Kshs 3.2 bn in Q1’2020, coupled with a similar 9.0% decline in interest income from government securities to Kshs 2.3 bn, from Kshs 2.5 bn in Q1’2020. The decline in interest income was however mitigated by a 10.1% growth in interest income from deposits and placements with banking institutions to Kshs 0.4 bn, from Kshs 0.3 bn in Q1’2020
- The Yield on Interest-Earning Assets (YIEA), declined to 8.1%, from 9.4% in Q1’2020, attributable to the faster 7.4% growth in the average interest-earning assets, which outpaced the 7.3% decline in the interest income,
- Interest expense declined by 30.2% to Kshs 1.0 bn, from Kshs 1.4 bn in Q1’2020, following a 26.5% decline in interest expense on customer deposits to Kshs 0.9 bn, from Kshs 1.2 bn in Q1’2020, coupled with a 53.4% decline in other interest expenses to Kshs 0.1 bn, from Kshs 0.2 bn in Q1’2020. Cost of funds, on the other hand, declined by 0.8% points to 1.6%, from 2.4% in Q1’2020, owing to a 7.0% growth in average interest-bearing liabilities coupled with a 27.4% decline in the trailing interest expense,
- Total operating income rose by 1.7% to Kshs 7.1 bn, from Kshs 7.0 bn recorded in Q1’2020. This was driven by an 11.1% increase in Non-Funded Income (NFI) to Kshs 2.5 bn, from Kshs 2.2 bn in Q1’2020, which was weighed down by a 2.8% decline in Net Interest Income (NII) to Kshs 4.6 bn, from Kshs 4.7 bn in Q1’2020,
- The balance sheet recorded an expansion as total assets grew by 8.9% to Kshs 339.3 bn, from Kshs 311.5 bn in Q1’2020. This growth was largely driven by a 62.7% increase in placements from banking institutions to Kshs 78.7 bn, from Kshs 48.4 bn in Q1’2020, coupled with a 7.8% growth in investment in government and other securities to Kshs 102.4 bn, from Kshs 95.0 bn recorded in Q1’2020. The loan book, however, decreased by 6.1% to Kshs 117.9 bn, from Kshs 125.5 bn recorded in Q1’2020, indicating the bank’s risk averseness and hesitancy to lend due to the credit risks involved,
- Total liabilities rose by 9.4% to Kshs 286.4 bn, from Kshs 261.6 bn in Q1’2020, driven by an 8.9% increase in customer deposits to Kshs 265.2 bn, from Kshs 243.6 bn in Q1’2020, coupled with an increase of 69.0% in placements held to Kshs 1.2 bn in Q1’2021, from Kshs 0.7 bn in Q1’2020
- Deposits per branch rose by 8.9% to Kshs 7.4 bn, from Kshs 6.8 bn in Q1’2020 with the number of branches remaining unchanged at 36,
- Gross Non-Performing Loans (NPLs) increased by 11.3% to Kshs 22.3 bn in Q1’2021, from Kshs 20.0 bn recorded in Q1’2020. Consequently, the NPL ratio rose to 16.4%, from 14.2% recorded in Q1’2020. The asset quality deterioration is attributable to the 11.3% growth in Gross Non-Performing Loans (NPLs), coupled with a 3.7% decline in gross loans,
- General Loan Loss Provisions increased by 12.5% to Kshs 8.8 bn, from Kshs 7.8 bn in Q1’2020. The NPL coverage thus increased to 81.1%, from 78.1% in Q1’2020, as the provisions (after adding back interest suspense) increased by 15.7% in Q1’2021, outpacing the 11.3% rise in the Gross Non-Performing Loans during the same period. The increase in the NPL Coverage to 81.1% in Q1’2021, from 78.1% in Q1’2020, suggests sufficient provisioning, and,
- Standard Chartered is currently sufficiently capitalized with a core capital to risk-weighted assets ratio of 15.9%, 5.4% points above the statutory requirement. In addition, the total capital to risk-weighted assets ratio was 18.3%, exceeding the statutory requirement by 3.8% points. Adjusting for IFRS 9, the core capital to risk-weighted assets stood at 16.0% while total capital to risk-weighted assets came in at 18.4%.
For a comprehensive analysis, please see our Standard Chartered Bank Kenya Q1’2021 Earnings Note
- HF Group
|
HF Group Q1’2021 Key Highlights |
|||
|
Balance Sheet |
|||
|
Balance Sheet items |
Q1’2020 (Kshs bns) |
Q1’2021 (Kshs bns) |
y/y change |
|
Government Securities |
5.0 |
5.7 |
13.4% |
|
Net loans |
38.4 |
35.8 |
(6.9%) |
|
Total Assets |
56.6 |
53.9 |
(4.7%) |
|
Customer Deposits |
38.0 |
37.2 |
(2.1%) |
|
Deposits per branch |
1.73 |
1.69 |
(2.1%) |
|
Total Liabilities |
46.4 |
45.7 |
(1.6%) |
|
Shareholder's Funds |
10.2 |
8.3 |
(18.9%) |
|
Income Statement |
|||
|
Income Statement Items |
Q1’2020 (Kshs bns) |
Q1’2021 (Kshs bns) |
y/y change |
|
Net Interest Income |
0.6 |
0.5 |
(18.3%) |
|
Net non-Interest Income |
0.3 |
0.1 |
(46.7%) |
|
Total Operating income |
0.8 |
0.6 |
(27.0%) |
|
Loan Loss provision |
(0.1) |
(0.1) |
(45.8%) |
|
Total Operating expenses |
(0.8) |
(0.8) |
(4.8%) |
|
Profit before tax |
0.0 |
(0.2) |
N/A |
|
Profit after tax |
(0.0) |
(0.2) |
N/A |
|
Core EPS |
(0.0) |
(0.5) |
N/A |
|
Key Ratios |
|||
|
Ratios |
Q1’2020 |
Q1’2021 |
% point change |
|
Yield from interest-earning assets |
11.2% |
9.3% |
(1.9%) |
|
Cost of funding |
6.5% |
5.1% |
(1.3%) |
|
Net Interest Margin |
4.5% |
4.1% |
(0.5%) |
|
Non- Performing Loans (NPL) Ratio |
27.3% |
24.7% |
(2.6%) |
|
NPL Coverage |
52.2% |
64.7% |
12.5% |
|
Cost to Income with LLP |
99.2% |
129.3% |
30.1% |
|
Loan to Deposit Ratio |
101.1% |
96.2% |
(4.9%) |
|
Return on average assets |
0.1% |
(3.4%) |
(3.5%) |
|
Return on average equity |
0.5% |
(20.4%) |
(20.9%) |
|
Capital Adequacy Ratios |
|||
|
Ratios |
Q1'2020 |
Q1'2021 |
% point change |
|
Core Capital/Total Liabilities |
14.4% |
7.4% |
(7.0%) |
|
Minimum Statutory ratio |
8.0% |
8.0% |
0.0% |
|
Excess |
6.4% |
(0.7%) |
(7.0%) |
|
Core Capital/Total Risk Weighted Assets |
12.4% |
6.4% |
(6.0)% |
|
Minimum Statutory ratio |
10.5% |
10.5% |
0.0% |
|
Excess |
1.9% |
(4.1%) |
(6.0%) |
|
Total Capital/Total Risk Weighted Assets |
13.7% |
9.9% |
(3.8%) |
|
Minimum Statutory ratio |
14.5% |
14.5% |
0.0% |
|
Excess |
(0.8%) |
(4.7%) |
(3.8%) |
Key take-outs from the earnings release include;
- HF Group recorded a loss per share of Kshs 0.50 in Q1’2021, higher than the loss per share of Kshs 0.002 recorded in Q1’2020, which was not in-line with our expectations of a Kshs 0.42 loss per share. This variance can be attributed to a higher 46.7% decline in Non-Funded Income to Kshs 0.1 bn from Kshs 0.3 bn in Q1’2020. The performance of the group can be attributed to a 27.0% decline in total operating income to Kshs 0.6 bn, from Kshs 0.8 bn in Q1’2020, coupled with a slow 4.8% decrease in total operating expenses to Kshs 0.79 bn, from Kshs 0.83 bn seen in Q1’2020,
- Interest income declined by 18.7% to Kshs 1.0 bn, from Kshs 1.2 bn in Q1’2020 driven by a 24.3% decline in interest income from loans and advances to Kshs 0.8 bn, from Kshs 1.1 bn in Q1’2020. Interest income on government securities, however, recorded a 41.9% rise to Kshs 0.2 bn, from Kshs 0.1 bn in Q1’2020,
- The Yield on Interest-Earning Assets (YIEA) decreased to 9.3%, from 11.2% in Q1’2020, due to a 19.5% decrease in trailing interest income compared to the 3.4% decline in the average interest-earning assets (IEA),
- Interest expense declined by 19.0% to Kshs 0.5 bn, from Kshs 0.7 bn in Q1’2020, driven by a 38.7% decline in other interest expenses to Kshs 90.7 mn, and a 20.5% decline in interest expense from customer deposits to Kshs 0.4 bn, from Kshs 0.5 bn in Q1’2020. Interest expense on Deposits and placements from other banks grew by 112.1% to Kshs 59.7 mn, from Kshs 28.1 mn recorded in Q1’2020. Cost of funds declined to 5.1% in Q1’2021, from 6.5% as recorded in Q1’2020,
- Total Operating Income declined by 27.0% to Kshs 0.6 bn in Q1’2021, from Kshs 0.8 bn in Q1’2020, attributable to the 46.7% decline in Non-Funded Income (NFI) to Kshs 0.1 bn, from Kshs 0.3 bn recorded in Q1’2020, coupled with the 18.3% dip in Net Interest Income (NII) to Kshs 0.5 bn, from Kshs 0.6 bn recorded in Q1’2020,
- The company’s balance sheet recorded a contraction as total assets declined by 4.7% to Kshs 53.9 bn, from Kshs 56.5 bn in Q1’2020. This is attributable to a 6.9% decline in the loan book to Kshs 35.8 bn, from Kshs 38.4 bn recorded in Q1’2020, and an 18.7% decline in placements to Kshs 0.8 bn in Q1’2021, from Kshs 0.9 bn. This contraction in the loan book was however mitigated by a 13.4% rise in government securities to Kshs 5.7 bn, from the Kshs 5.0 bn recorded in Q1’2020,
- Total liabilities also decreased by 1.6% to Kshs 45.7 bn in Q1’2021, from Kshs 46.4 bn in Q1’2020, driven by a 12.4% decline in borrowings to Kshs 5.1 bn, from Kshs 5.8 bn in Q1’2020, and a 2.1% decline in customer deposits to Kshs 37.2 bn in Q1’2021, from Kshs 38.0 bn in Q1’2020. There was however a 121.8% increase in placements to Kshs 1.5 bn in Q1’2021, from Kshs 0.7 bn in Q1’2021,
- Deposits per branch decreased by 2.1% to Kshs 1.69 bn, from Kshs 1.73 bn in Q1’2020, with the number of branches remaining unchanged at 22,
- Gross non-performing loans (NPLs) declined by 14.0% to Kshs 10.5 bn, from Kshs 12.2 bn recorded in Q1’2020. Consequently, the NPL ratio improved to 24.7% from the 27.3% recorded in Q1’2020, following the faster 14.0% decline in NPLs that outpaced the 4.9% decline in gross loans which came in at Kshs 42.6 bn in Q1’2021, from Kshs 44.8 bn recorded in Q1’2020,
- General loan loss provisions increased by 23.2% to Kshs 3.6 bn in Q1’2021, from Kshs 2.9 bn in Q1’2020. The NPL coverage thus improved to 64.7% in Q1’2021, from 52.2% owing to the faster 23.2% increase in general loan loss provisions which outpaced the 14.0% decline in gross NPLs, and,
- HF Group remains undercapitalized with a core capital to risk-weighted assets ratio of 6.4%, 4.1% points below the statutory requirement of 10.5%. In addition, the total capital to risk-weighted assets ratio came in at 9.9%, below the statutory requirement by 4.7% points. Adjusting for IFRS 9, the core capital to risk-weighted assets stood at 8.1%, while total capital to risk-weighted assets came in at 11.6%.
For a comprehensive analysis, please see our HF Group Q1’2021 Earnings Note
Asset Quality
The table below is a summary of the asset quality for the companies that have released
|
Q1’2020 NPL Ratio** |
Q1’2021 NPL Ratio* |
Q1’2020 NPL Coverage** |
Q1’2021 NPL Coverage* |
% point change NPL Ratio |
% point change NPL Coverage |
|
|
Stanbic Bank |
12.1% |
15.10% |
59.3% |
63.9% |
3.0% |
4.6% |
|
KCB |
11.1% |
14.9% |
61.3% |
61.6% |
3.8% |
0.3% |
|
SCBK |
14.2% |
16.4% |
78.1% |
81.1% |
2.2% |
3.0% |
|
Equity Group |
11.2% |
12.1% |
45.8% |
55.5% |
0.9% |
9.7% |
|
Co-op Bank |
10.8% |
16.9% |
54.8% |
58.4% |
6.1% |
3.6% |
|
DTB-K |
8.0% |
10.6% |
42.4% |
46.5% |
2.6% |
4.1% |
|
ABSA |
8.1% |
7.5% |
64.5% |
74.3% |
(0.6%) |
9.8% |
|
NCBA Group |
14.5% |
14.7% |
54.5% |
65.0% |
0.2% |
10.5% |
|
I&M Holdings |
11.3% |
11.9% |
58.8% |
61.1% |
0.6% |
2.3% |
|
HF Group |
27.3% |
24.70% |
52.2% |
64.7% |
(2.6%) |
12.5% |
|
Mkt Weighted Average |
11.4% |
13.5% |
57.4% |
62.1% |
2.1% |
4.7% |
|
*Market cap weighted as at 28/05/2021 **Market cap weighted as at 02/06/2020 |
||||||
Key take-outs from the table include;
- Asset quality for the listed banks deteriorated during the period of review, with the weighted average NPL ratio rising by 2.1% points to a market cap weighted average of 13.5%, from an average of 11.4% in Q1’2020. The deterioration in asset quality was as a result of increased non-performing loans due to the increased credit risk as the economy slowed down due the Covid-19 pandemic, and,
- NPL Coverage for the listed banks increased to a market cap weighted average of 62.1% in Q1’2021, from 57.4% recorded in Q1’2020, as the banks increased their provisioning levels to proactively manage risks given the tough economic conditions occasioned by the pandemic. We expect the higher provisional requirements to subdue profitability in the medium term across the banking sector on account of the tough business environment. Additionally, we expect banks to continue over-provisioning, albeit at a slower rate than in 2020.
Summary Performance
The table below highlights the performance of the banks that have released so far, showing the performance using several metrics, and the key take-outs of the performance;
|
Bank |
Core EPS Growth |
Interest Income Growth |
Interest Expense Growth |
Net Interest Income Growth |
Net Interest Margin |
Non-Funded Income Growth |
NFI to Total Operating Income |
Growth in Total Fees & Commissions |
Deposit Growth |
Growth in Government Securities |
Loan to Deposit Ratio |
Loan Growth |
Return on Average Equity |
|
Stanbic |
23.1% |
0.5% |
(7.3%) |
5.0% |
6.1% |
19.3% |
46.7% |
(8.5%) |
10.6% |
42.3% |
69.5% |
(2.4%) |
13.2% |
|
KCB |
1.80% |
8.7% |
1.8% |
11.1% |
8.4% |
(20.0%) |
27.4% |
(26.5%) |
1.2% |
4.7% |
79.7% |
7.8% |
13.9% |
|
SCBK |
18.9% |
(9.0%) |
(30.2%) |
(2.8%) |
6.7% |
11.1% |
35.1% |
11.7% |
8.9% |
7.8% |
44.4% |
(6.1%) |
11.3% |
|
Equity |
63.8% |
31.9% |
42.4% |
28.4% |
7.6% |
30.7% |
42.3% |
21.5% |
58.2% |
16.1% |
61.7% |
28.6% |
18.9% |
|
Co-op |
(3.7%) |
27.6% |
19.8% |
30.7% |
8.6% |
(9.2%) |
32.0% |
(15.7%) |
16.0% |
43.4% |
75.7% |
8.0% |
12.3% |
|
DTB-K |
0.50% |
4.8% |
2.9% |
6.2% |
5.3% |
(1.9%) |
23.9% |
(20.5%) |
10.6% |
7.9% |
68.2% |
2.3% |
5.7% |
|
ABSA |
23.7% |
(0.3%) |
17.6% |
5.9% |
7.0% |
(3.9%) |
32.0% |
7.4% |
7.7% |
1.1% |
84.9% |
7.5% |
13.6% |
|
NCBA |
73.8% |
8.1% |
(5.7%) |
19.9% |
5.9% |
(3.3%) |
44.3% |
(8.1%) |
11.2% |
15.1% |
56.0% |
(1.1%) |
8.1% |
|
I&Ms |
13.5% |
10.2% |
(5.2%) |
23.4% |
5.4% |
(17.7%) |
29.7% |
(5.3%) |
9.3% |
89.5% |
73.4% |
5.6% |
13.3% |
|
HF |
N/A |
(18.7%) |
(19.0%) |
(18.3%) |
4.1% |
(46.7%) |
22.0% |
(36.2%) |
(2.1%) |
13.4% |
96.2% |
(6.9%) |
(20.4%) |
|
Q1'21 Mkt Weighted Average* |
28.6% |
14.8% |
13.1% |
17.3% |
7.4% |
3.4% |
35.4% |
(2.5%) |
22.0% |
18.2% |
69.1% |
11.1% |
14.1% |
|
Q1'20 Mkt Weighted Average** |
(7.4%) |
8.2% |
11.4% |
7.4% |
7.2% |
15.9% |
22.7% |
24.5% |
14.3% |
14.9% |
74.1% |
14.1% |
17.2% |
|
*Market cap weighted as at 28/05/2021 |
|||||||||||||
|
**Market cap weighted as at 02/06/2020 |
|||||||||||||
Key takeaways from the table above include:
- The listed banks recorded a 28.6% weighted average growth in core Earnings per Share (EPS), compared to a weighted average decline of 7.4% in Q1’2020 for the entire listed banking sector. The performance is largely skewed by the strong performance from NCBA and equity bank.,
- The Banks have recorded a weighted average deposit growth of 22.0%, faster than the 14.3% growth recorded in Q1’2020,
- Interest expense grew at a faster pace by 13.1%, compared to the 11.4% growth in Q1’2020 while cost of funds declined, coming in at a weighted average of 2.5% in Q1’2021, from 3.0% in Q1’2020, owing to the faster growth in average interest-bearing liabilities, an indication that the listed banks were able to mobilize cheaper deposits,
- Average loan growth came in at 11.1%, lower than the 14.1% growth recorded in Q1’2020. The loan growth was also slower than the 18.2% growth in government securities, an indication of the banks’ preference of investing in Government securities as opposed to lending due to the elevated credit risk occasioned with the pandemic. The faster growth in government securities could also be attributed to cautious lending by banks in a bid to reduce cost of risk as well as mitigate further deterioration of the asset quality,
- Interest income grew by 14.8%, compared to a growth of 8.2% recorded in Q1’2020. Notably, the Yield on Interest Earning Assets (YIEA) increased to 10.2%, from the 9.8% recorded in Q1’2020, an indication of the increased allocation to higher-yielding government securities by the sector during the period. Consequently, the Net Interest Margin (NIM) now stands at 7.4%, 0.2% points higher than the 7.2% recorded in Q1’2020 for the whole listed banking sector, and,
- Non-Funded Income grew by 3.4%, compared to the 15.9% growth recorded in Q1’2020. This can be attributable to a slower growth in the fees and commission which declined by 2.5% compared to a growth of 24.5% in Q1’2020.
Universe of Coverage
Below is a summary of our universe of coverage and the recommendations:
|
Company |
Price at 21/5/2021 |
Price at 28/5/2021 |
w/w change |
YTD Change |
Year Open 2021 |
Target Price* |
Dividend Yield |
Upside/ Downside** |
P/TBv Multiple |
Recommendation |
|
I&M Holdings*** |
23.4 |
21.6 |
(7.7%) |
(52.0%) |
44.9 |
29.9 |
10.4% |
49.2% |
0.3x |
Buy |
|
Diamond Trust Bank*** |
63.8 |
60.0 |
(5.9%) |
(21.8%) |
76.8 |
84.3 |
0.0% |
40.5% |
0.3x |
Buy |
|
Standard Chartered*** |
131.5 |
130.0 |
(1.1%) |
(10.0%) |
144.5 |
164.4 |
8.1% |
34.5% |
0.9x |
Buy |
|
Stanbic Holdings |
81.0 |
79.5 |
(1.9%) |
(6.5%) |
85.0 |
99.4 |
4.8% |
29.8% |
0.8x |
Buy |
|
Jubilee Holdings |
280.0 |
280.0 |
0.0% |
1.5% |
275.8 |
330.9 |
3.2% |
21.4% |
0.6x |
Buy |
|
Co-op Bank*** |
12.3 |
12.2 |
(0.8%) |
(3.2%) |
12.6 |
13.6 |
8.2% |
20.2% |
0.8x |
Buy |
|
KCB Group*** |
41.0 |
42.4 |
3.4% |
10.4% |
38.4 |
49.8 |
2.4% |
19.8% |
1.0x |
Accumulate |
|
Liberty Holdings |
7.4 |
7.0 |
(4.9%) |
(8.6%) |
7.7 |
8.4 |
0.0% |
19.3% |
0.5x |
Accumulate |
|
NCBA*** |
24.9 |
25.5 |
2.4% |
(4.3%) |
26.6 |
28.4 |
5.9% |
17.5% |
0.6x |
Accumulate |
|
Equity Group*** |
41.5 |
43.0 |
3.6% |
18.6% |
36.3 |
49.5 |
0.0% |
15.1% |
1.3x |
Accumulate |
|
Sanlam |
11.3 |
11.0 |
(2.7%) |
(15.4%) |
13.0 |
12.4 |
0.0% |
12.7% |
1.0x |
Accumulate |
|
ABSA Bank*** |
9.1 |
9.5 |
4.6% |
0.0% |
9.5 |
10.2 |
0.0% |
7.1% |
1.1x |
Hold |
|
HF Group |
3.6 |
3.9 |
6.4% |
22.6% |
3.1 |
3.8 |
0.0% |
(1.3%) |
0.2x |
Sell |
|
Britam |
7.3 |
7.2 |
(0.3%) |
3.4% |
7.0 |
6.7 |
0.0% |
(7.5%) |
1.3x |
Sell |
|
CIC Group |
2.1 |
2.1 |
0.5% |
1.4% |
2.1 |
1.8 |
0.0% |
(15.9%) |
0.7x |
Sell |
|
*Target Price as per Cytonn Analyst estimates **Upside/ (Downside) is adjusted for Dividend Yield ***For Disclosure, these are stocks in which Cytonn and/or its affiliates are invested in. Key to note, I&M Holdings YTD share price change is mainly attributable to counter trading ex-bonus issue. |
||||||||||
We are “Neutral” on the Equities markets in the short term. With the market currently trading at a premium to its future growth (PEG Ratio at 1.6x), we believe that investors should reposition towards companies with a strong earnings growth and are trading at discounts to their intrinsic value. Additionally, we expect the recent discovery of new strains of COVID-19 coupled with the introduction of strict lockdown measures in major economies to continue dampening the economic outlook.
- Industry reports
During the week, the Central Bank of Kenya (CBK), released the Bank Supervision Annual Report 2020, highlighting that the residential mortgage market recorded a 3.7% decline in the number of mortgage loans accounts in the market, to 26,971 in December 2020 from 27,993 in December 2019. The overall value of mortgage loans outstanding therefore registered a 2.1% decline from Kshs 237.7 bn in December 2019 to Kshs 232.7 bn in December 2020. The performance decline of the mortgage market was mainly attributed to repayment defaults and fewer mortgage loans advanced by banks due to the effect of the Covid-19 depressed economy.
The graph below shows the number of mortgage loan accounts in Kenya over the last 10 years;
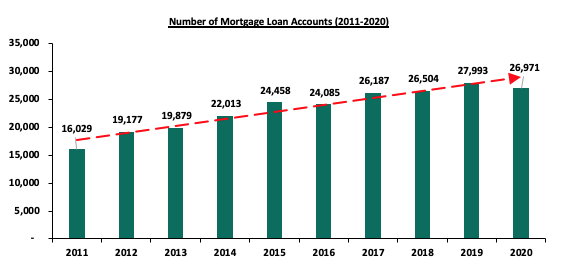
Source: Central Bank of Kenya (CBK)
Development of the mortgage market in Kenya continues to face impediments such as i) high interest rates currently at 10.9%, ii) low income levels leading to low mortgage affordability, iii) high initial costs when taking mortgages, and, iv) high property and development costs. However, according to CBK’s report, the average mortgage loan size increased from Kshs 8.5 mn in 2019 to Kshs 8.6 mn in 2020, with the government having made efforts to avail relatively affordable mortgage facilities through the Kenya Mortgage and Refinance Company (KMRC) as banks tightened credit standards to the mortgage market.
The graph below shows the average mortgage loan size from 2011 to 2020;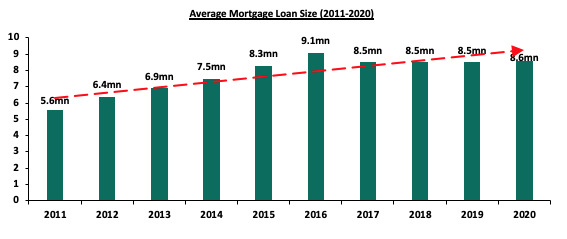
Source: Central Bank of Kenya (CBK)
With an average mortgage size of Kshs 8.6 mn, an average interest rate of 10.9% and a maximum tenor of 20 years, one is required to make monthly repayments of approximately Kshs 88,183 per month which is unaffordable assuming a gross salary of Kshs 50,000 per month. Given the above, the Kenya mortgage to GDP ratio has continued to lag behind at 2.2% as of 2020 compared to countries such as Namibia and South Africa at 25.5% and 19.9%, respectively as shown in the graph below;
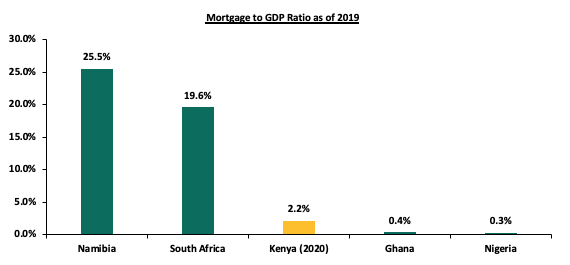
Source: Centre of Affordable Housing Africa
We expect continued subdued performance of the mortgage market, however activities in the mortgage market will be boosted by the government’s efforts through operationalization of the Kenya Mortgage Refinance Company (KMRC), having been allocated Kshs 4.2 bn in March 2021 to finance the Affordable Housing Program aimed at increasing home ownership in Kenya.
- Hospitality
During the week, Kenya Airports Authority announced that JKIA passenger movement registered a 24.1% decline in the month of March 2021, to 279,413 passengers from 368,279 passengers in the same period last year. The trend was also observed at the Moi International Airport (MIA) in Mombasa, where the passenger movement declined by 8.8% to 71,180 passengers from 78,056 passengers in March 2020. The declines were attributed to travel bans and restrictions geared towards curbing the spread of Covid-19. Data from the Kenya National Bureau of Statistics indicates that arrivals though JKIA and MIA declined by 25.5% from 47,038 in January 2021 to 35,052 in February 2021.
The graph below shows the number of international arrivals in Kenya from January 2020 to February 2021;
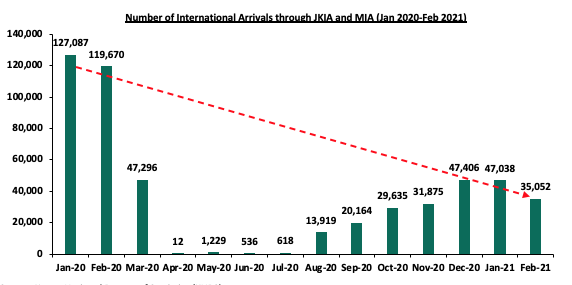
Source: Kenya National Bureau of Statistics (KNBS)
With the decline of international arrivals, the hospitality sector performance continues to be affected due to its reliance on the tourism sector, as well as the reduction in the Meetings, Incentives, Conferences, and Exhibitions (MICE). Moreover, the lower allocation of the government’s budget to the Ministry of Tourism from Kshs 20.4 bn in FY’2020/21 to Kshs 18.1 bn in FY’2021/22 is expected to impede the sector’s performance even more.
- Statutory Reviews
During the week, Nairobi’s City Hall announced plans to conduct public participation into the New Draft Valuation Roll, on 16th June 2021 in the 17 sub-counties in Nairobi, to pave way for its roll-out, since being tabled before the Nairobi County Assembly in February. The public participation forum will inform the final percentage to be charged as rates on all ratable properties in Nairobi. This announcement follows the government’s plan to replace the outdated Valuation for Rating Act of 1956 and the Rating Act of 1963, in a bid to determine new land rates and ensure inclusion of more property owners into the tax bracket. Some of the provisions under the new draft valuation roll are; i) that the new land rates be set between 0.10% and 0.12% of the current value of undeveloped land which will boost the cost of levies, ii) that ratable properties that were not captured in the old valuation roll of 1980 be captured in the new records, and, iii) that the Geographic Information System (GIS) be introduced to replace the slow and cumbersome manual data management system. The GIS is a computer based system that will allow collection, organization, manipulation and analysis of data that is related to a particular location. The system will minimize the cost and complexity of preparing the valuation roll and allow more efficient collection of land rates.
City Hall is seeking to cash in on the sharp appreciation of land prices in Nairobi over the past two decades due to an increase in real estate deals in the capital, with our Cytonn Q1’2021 Markets Review, indicating that land prices in the Nairobi Metropolitan Area registered an annualized capital appreciation of 2.8% y/y. Property owners currently pay land rates at 25.0% of the unimproved site value based on the 1980 valuation roll which has led City Hall to miss out on revenue from the appreciation of plots.
In our view, the bringing up to date of the property valuation roll will; i) boost revenue collection by county governments by tapping into the rise in property values, and, ii) improve land information records through the updated valuation to capture the correct property values. The government through the Ministry of Lands has been undertaking other projects that will improve property transactions such as; i) digitization of land records through the National Lands Information Management System (NLIMS) to improve on transparency in land transactions and make them more efficient, iii) introducing a titling program that targets to resolve land ownership disputes that have contributed to locking out land owners and businesses from accessing credit facilities from financial institutions, iv) working on a new Land Valuation Index to guide land valuations for investment and other purposes across the country, and, v) decentralization of services by the Ministry of Lands by the construction of new Land Registries in Kitui, Mbeere, Bomet and Ol Kalou.
We expect the measures the government is putting in place to improve the transparency, ease and confidence in land transactions carried out in the country. These improvements are also expected to improve the accuracy of land records and enhance revenue collection which the county governments can utilize for development in areas such as infrastructure thus boosting the prospects of the real estate sector in Kenya.
We expect the real estate sector to continue being affected by challenges such as poor mortgage uptake, reduced international arrivals and inadequate regulatory framework for land valuations. However, we expect government efforts in addressing the issues will lead to increased activities and improved performance in the long run.
Following the release of the FY’2020 results by Kenyan insurance firms, the Cytonn Financial Services Research Team undertook an analysis on the financial performance of the listed insurance companies and the key factors that drove the performance of the sector. In this report, we assess the main trends in the sector, and areas that will be crucial for growth and stability going forward, seeking to give a view on which insurance firms are the most attractive and stable for investment. As a result, we shall address the following:
- Insurance Penetration in Kenya
- Key Themes that Shaped the Insurance Sector in FY’2020,
- Industry Highlights and Challenges,
- Performance of The Listed Insurance Sector in FY’2020, and,
- Conclusion & Outlook of the Insurance Sector.
Section I: Introduction
Insurance uptake in Kenya remains low compared to other key economies with the insurance penetration in at 2.4% according to 2020 Financial Stability Report by Central Bank of Kenya (CBK). The low penetration level, which is below the global average of 7.2%, is attributable to the fact that insurance uptake is still seen as a luxury and mostly taken when it is necessary or a regulatory requirement.
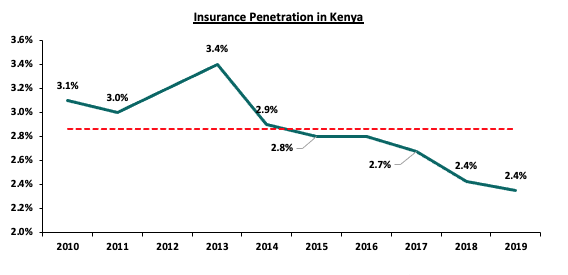
The chart below shows the insurance penetration in other economies across Africa:
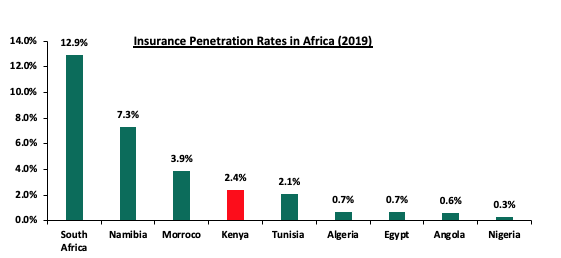
Section II: Key Themes that Shaped the Insurance Sector in FY’2020
FY’2020 was marked by the global social and economic shocks from the COVID-19 pandemic. Amid this operating environment, the insurance sector was impacted through i) increased insurance claims at 52.7% in Q4’2020 against 48.8% in Q4’2019, ii) reduction in premiums, and, iii) the poor performance in the stock market as evidenced by the NASI index declining by 8.6% in 2020. The Kenyan economy contracted in both Q2’2020 and Q3’2020 by 5.7% and 1.1%, respectively, with the financial services sector and insurance sector registering a reduced growth by to 5.3% in Q3’2020, from 7.6% growth in Q3’2019.
Key highlights from the industry performance:
- Convenience and efficiency through adoption of alternative channels for both distribution and premium collection such as Bancassurance and improved agency networks,
- Advancement in technology and innovation making it possible to make premium payments through mobile phones,
- A growing middle class, whose previously increasing disposable income was driving demand for insurance products and services, was affected by the Pandemic due to job losses and reduced sources of income, and,
- Lower investments income, mostly from the poor performance by some of the companies in the equities segment of the Capital Markets,
On valuations, listed insurance companies are trading at a price to book (P/Bv) of 0.8x, lower than listed banks at 0.9x, their 15-year historical averages of 1.5x. This two sectors are attractive for long-term investors supported by the strong economic fundamentals.
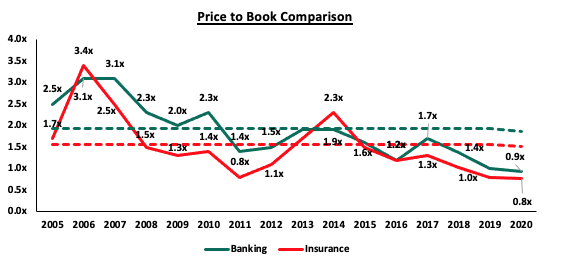
In the last five years, the life insurance market in Kenya has experienced growth in both the level of direct premiums as well as in the equity held by the industry constituents shaped by the following themes;
The key themes that have driven the insurance sector include:
- Technology and Innovation
Although the industry has been slow in adopting digital trends, the onset of the COVID-19 pandemic in FY’2020 saw the adoption of digital distribution of insurance products as a matter of necessity. Consequently, many insurance companies increasingly took advantage of the available digital channels to drive growth and increase insurance penetration in the country. The current number of mobile data subscribers, according to Communications Authority of Kenya (CAK), stands at 40.9 mn and is expected to grow to 60.0 mn subscribers in 5 years. The high mobile penetration implies that Mobile phones offer a new way of distributing insurance products to the younger generation of consumers and those consumers that have not been served through traditional distribution methods. Given that the process of handling and inspecting claims manually is cumbersome and imperfect, the use of Artificial Intelligence (AI) assists in investigating the legitimacy of claims and identifying those that are fraudulent. An example is Liberty Holdings which has been using AI to rollout e-policy documents, self-services for retail customers and collect customer feedback.
- Regulation
To ensure that the sector benefits from a globally competitive financial services sector, the regulator has been working through regulation implementations to address some of the perennial, as well as emerging problems in the sector. The COVID-19 environment proved challenging especially on the regulatory front, as it was a balance between remaining prudent as an underwriter and adhering to the set regulations given the negative effect the pandemic. Regulations used for the insurance sector in Kenya include the Insurance Act cap 487 and its accompanying schedule and regulations. In FY’2020, regulation remained a key aspect affecting the insurance sector and the key themes in the regulatory environment include;
- IFRS 9 - IAS 39, Financial Instruments Recognition and Measurement was replaced with IFRS 9, Financial Instruments to address the classification and measurement of financial instruments, impairment, and hedge accounting. The guidelines recommends an entity to measure the loss allowance at an amount equal to lifetime expected credit losses for receivables. Many insurance companies are now using a simplified loss rate approach in determining the provisions for premium receivables, with some opting to delay implementation of IFRS 9 to January 2022. IFRS 9 will enable insurance companies to develop appropriate models for their customer debtors and develop plans that will help them lower their credit risk in the future,
- IFRS 17- The standard establishes the principle for recognition, measurement, presentation and disclosure of insurance contracts with the objective of ensuring insurance companies provide relevant information that faithfully represents the contracts. However, as a way to protect the insurance industry from the negative effects of the pandemic the International Accounting Standards Board (IASB), the international body responsible for setting up financial reporting standards deferred its implementation to be effective from January 2023 or earlier. The standard, having replaced IFRS 4, is expected to give better information on profitability by providing more insights about current and future profitability of insurance contracts. Separation of financial and insurance results in the income statement will allow for better analysis of core performance for the entities and allow for better comparability of insurance companies,
- Risk Based Supervision - IRA has been implementing risk-based supervision through guidelines that require insurers to maintain a capital adequacy ratio of at least 200.0% of the minimum capital by 2020. The regulation requires insurers to monitor the capital adequacy and solvency margins on a quarterly basis, with the main objective being to safeguard the insurer’s ability to continue as a going concern and provide shareholders with adequate returns. We expect more mergers within the industry as smaller companies struggle to meet the minimum capital adequacy ratios. We also expect insurance companies to adopt prudential practices in managing risk and reduction of premium undercutting in the industry as insurers will now have to price risk appropriately, and,
- Capital Raising and share purchase
The move to a risk based capital adequacy framework will likely lead to capital raising initiatives mostly by the small players in the sector to shore up their capital. With the new capital adequacy assessment framework, capital is likely to be critical to ensuring stability and solvency of the sector to ensure the businesses are a going concern. In September 2020, Jubilee Holdings announced a strategic transaction with Allianz, a German multinational Underwriter and asset manager for the sale of 66.0% stake in the general business excluding medical for a total consideration of Kshs 10.8 bn. We expect that this amount will be ploughed back in to the company as part of the capital boost to grow other business lines. For more information, please see our analysis on the same on Cytonn Q3’2020 Markets Review
Section III: Industry Highlights and Challenges
Following the stable growth achieved by the insurance sector over the last decade, we expect the sector to transition into a more stable sector on the back of an improving economy and heightened regulations, which will enhance the capacity of the sector to sustain profitability. The following activities were undertaken by the Insurance Regulatory Authority (IRA), in line with their mandate of regulating and promoting development of the insurance sector;
- Industry Circulars
In FY’2020, IRA issued 11.0 circulars ranging from COVID-19 Insurance Business Impact Template in Q2, Reporting of fire and engineering risks with sums insured above KES 1 billion and group life business. For example, in Q4’2020 the authority issued a circular numbered IC & RE 07/2020 to insurance companies, reinsurance companies and reinsurance brokers on dealings with reinsurers and reinsurance brokers that are not registered under the Insurance Act.
- Recently Developed or Repackaged Insurance Products
In FY’2020, 31.0 new or repackaged insurance products were filed by various insurance companies and approved by IRA. The onset of COVID-19 accelerated the repackaging of insurance products where 11 or 35.5% of the 31 products were medical plans, while life products accounted for 15 or 48.4% of the total repackaged products.
Industry Challenges:
- Fraud: Insurance fraud is an intentional deception committed by an applicant or policy holder for financial gain. Recent years have seen an increase in fraudulent claims especially in medical and motor insurance, with estimates indicating that one in every five medical claims are fraudulent mainly through inflated medical bills and hospitals making patients take unnecessary tests. In the whole of 2020, 143.0 fraud cases were reported, with 16.8% being motor accident injury claims and 16.1% being theft by agents. The sector has been adopting the use of block chain and artificial intelligence to curb fraud within the sector, as well as most companies setting up their own assessment centres across the country so as to better determine the actual compensation,
- Premium Undercutting: Premium undercutting is the practice where an insurance company secretly offers clients unrealistically low premiums in order to gain competitive advantage and to protect their market share. This is a major driver of underwriting losses suffered by the industry. The regulator has recently announced that they are engaging a consultant to relook at the industry premium pricing, after a previous attempt was stopped through a court order. Some industry players have argued price fixing will kill innovation and that the industry players should be left free to set their own prices, and,
- Regional regulators: Subsidiaries of Kenyan insurance companies are facing challenges in the areas of operation. For instance, in Tanzania, insurance brokers are required to be at least two-thirds (67.0%) owned and controlled by citizens of Tanzania. In Kenya, regulation on capital has made it difficult for smaller insurance companies to continue operating without increasing their capital or merging in order to raise their capital base.
Section IV: Performance of the Listed Insurance Sector in FY’2020
The table below highlights the performance of the listed insurance sector, showing the performance using several metrics, and the key take-outs of the performance.
|
Listed Insurance Companies FY'2020 Earnings and Growth Metrics |
||||||||
|
Insurance |
Core EPS Growth |
Net Premium growth |
Claims growth |
Loss Ratio |
Expense Ratio |
Combined Ratio |
ROaE |
ROaA |
|
Jubilee Insurance |
1.7% |
3.3% |
3.4% |
101.3% |
56.3% |
157.6% |
12.3% |
3.0% |
|
Liberty |
(2.0%) |
(2.9%) |
(0.4%) |
55.2% |
45.9% |
101.1% |
8.1% |
1.7% |
|
CIC |
(192.3%) |
(3.2%) |
(0.9%) |
71.4% |
50.1% |
121.5% |
(3.9%) |
(0.8%) |
|
Britam |
(357.2%) |
0.5% |
20.8% |
85.7% |
78.5% |
164.2% |
(39.2%) |
(6.9%) |
|
Sanlam |
(168.4%) |
21.3% |
18.5% |
83.7% |
54.2% |
137.9% |
(4.8%) |
0.3% |
|
*FY'2020 Weighted Average |
(157.9%) |
1.6% |
9.5% |
88.1% |
62.9% |
151.1% |
(9.4%) |
(1.3%) |
|
**FY'2019 Weighted Average |
6.4% |
10.2% |
16.3% |
79.4% |
56.8% |
136.2% |
11.9% |
3.3% |
|
*Market cap weighted as at 25/05/2021 |
|
|||||||
|
**Market cap weighted as at 17/07/2020 |
|
|||||||
The key take-outs from the above table include;
- Core EPS growth recorded a weighted decline of 157.9%, compared to a weighted growth of 6.4% in FY’2019. The decline in earnings was attributable to reduced premiums during the period following negative effects to the sector from the COVID-19 pandemic, coupled with losses recorded in the equities markets and low yields from government papers,
- The premiums grew at slower pace 1.6% in FY’2020, compared to a growth of 10.2% in FY’2019, while claims also grew at a slower rate of 9.5% in FY’2020, from the 16.3% recorded in FY’2019 on a weighted average basis,
- The loss ratio across the sector increased to 88.1% in FY’2020, from 79.4% in FY’2019, owing to increased claims from perennial challenges facing the industry such as fictitious claims and increased benefit payments from the life business owing to job layoffs,
- The expense ratio increased to 62.9% in FY’2020, from 56.8% in FY’2019, owing to an increase in operating expenses,
- The insurance core business still remains unprofitable, with a combined ratio of 151.1% as at FY’2020, compared to 136.2% in FY’2019, and,
- On average, the insurance sector has delivered a Return on Average Equity of (1.3%), a decline from 3.3% in FY’2019.
Based on the Cytonn FY’2020 Insurance Report, we ranked insurance firms from a franchise value and from a future growth opportunity perspective with the former getting a weight of 40.0% and the latter a weight of 60.0%.
For the franchise value ranking, we included the earnings and growth metrics as well as the operating metrics shown in the table below in order to carry out a comprehensive review:
|
Bank |
Loss Ratio |
Expense Ratio |
Combined Ratio |
Return on Average Capital Employed |
Tangible Common Ratio |
|
Jubilee Holdings |
101.3% |
56.3% |
157.6% |
12.3% |
24.2% |
|
Sanlam Kenya |
83.7% |
54.2% |
137.9% |
(4.8%) |
5.1% |
|
Liberty Holdings |
55.2% |
45.9% |
101.1% |
8.1% |
19.2% |
|
Britam Holdings |
85.7% |
78.5% |
164.2% |
(39.2%) |
11.2% |
|
CIC Group |
71.4% |
50.1% |
121.5% |
4.1% |
19.2% |
|
Weighted Average FY'2020 |
98.7% |
56.5% |
155.2% |
10.1% |
22.9% |
The Intrinsic Valuation is computed through a combination of valuation techniques, with a weighting of 40.0% on Discounted Cash-flow Methods, 35.0% on Residual Income and 25.0% on Relative Valuation. The overall FY’2020 ranking is as shown in the table below:
|
Insurance Company |
Franchise Value Score |
Intrinsic Value Score |
Weighted Score |
FY'2020 Ranking |
FY'2019 Ranking |
|
Liberty Holdings |
15 |
2 |
7.2 |
1 |
3 |
|
Jubilee Holdings |
19 |
1 |
8.2 |
2 |
1 |
|
Sanlam Kenya |
22 |
3 |
10.6 |
3 |
4 |
|
CIC Group |
20 |
5 |
11.0 |
4 |
5 |
|
Britam Holdings |
29 |
4 |
14.0 |
5 |
2 |
Major Changes from the FY’2020 Ranking are;
- Liberty Holdings improved to position 1 in FY’2020 from position 3 in FY’2019 mainly due to improvements in the franchise score following resilient earnings in FY’2020,
- Sanlam Insurance improved to position 3 in FY’2020 from position 4 in FY’2019 mainly due to improvements in both the franchise and intrinsic value scores,
- CIC Group improved to position 4 in FY’2020 from position 5 in FY’2019, mainly due to an improvement in franchise scores, as the expense and returns on equity remained unchanged,
- Jubilee Holdings whose rank declined to position 2 in FY’2020 from position 1 in FY’2019, on the back of a weak franchise score, driven by the deterioration in its Loss and expense ratios, and,
- Britam Holdings whose rank declined to position 5 in FY’2020 from position 2 in FY’2019, on the back of a weak franchise score, driven by the deterioration in its expense ratio to 78.5% in FY’2020 from 62.2% in FY’2019
Section V: Conclusion & Outlook of the Insurance Sector
The sector was suffering from declining penetration even before the pandemic and this was worsened by the interruptions caused by the pandemic. However, the sector continues to undergo transition where traditional models have been disrupted, mainly on the digital transformation and regulation front. We expect a moderate growth in premiums as underwriters come up with products suited to the pandemic period mostly in the medical and life businesses. On the other hand, the recovery and opening up of logistical barriers currently at play will see an increased uptake of motor vehicle and marine insurance. We are of the view that insurance companies have a lot they can do in order to register considerable growth and improve the level of penetration in the country to the 2019 continental average of 7.2%, some of this include:
- We expect continued partnerships with other financial services players including Fund managers who have ventured into offering insurance linked products as well as the current bancassurance relationship with Banks. Insurance companies will still want to leverage on the penetration of bank products to also push insurance products. Integration of mobile money payments to allow for policy payments is also expected to continue because of convenience which it provides and also mobile phone penetration in the country is high therefore insurance companies will want to leverage this to improve penetration,
- Technology and innovation capabilities are set to continue being the key anchors of growth for Sub-Saharan Africa in the coming years. The COVID-19 pandemic has challenged the underwriters to be more innovative in product pricing and premium calculations which will be underpinned by continued technological deployment. We also expect to see the distribution of more insurance products move online as the world embraces social distancing and the traditional face-to-face selling method will be used less, and,
- We also expect that there will be increased regulation in the sector as insurers adjust their insurance contract recognition methods in preparation to the coming into effect of IFRS17 in January of 2023 or earlier. The push by the regulator to have the desired capital adequacy levels will see increased consolidations as most capital buffers were eroded due to the pandemic.
- We also expect most underwriters to consider growing their investment income through diversifying their investments by moving to some non-traditional asset classes. For example the FY’2020 saw Jubilee Holdings invest Kshs 4.2 bn in Bujagali power plant in Uganda, thus increasing the ownership stake to 18.2% from 8.8%. The need for diversification has been necessitated by the slow growth in premiums against an increase in underwriting expenses.
For the FY’2020 Insurance Report, please download it here
Disclaimer: The views expressed in this publication are those of the writers where particulars are not warranted. This publication is meant for general information only and is not a warranty, representation, advice or solicitation of any nature. Readers are advised in all circumstances to seek the advice of a registered investment advisor.

- Talk to us
- Kenya
- P.O Box 20695 - 00200, Nairobi, Kenya
- Cell +254709101200
- Tel +254709101200
- WhatsApp +254741676635
- United States
- +254709101200
- DOWNLOAD OUR APP
-


- Kenya
- 8th Floor, Pinetree Plaza, Kaburu Drive, Ngong Road, Nairobi, Kenya
- USA
- Suite 1150, 1775 Eye Street NW, USA, Washington DC 20006, USA
- Investments
- High Yield
- Private Equity
- Real Estate
- Real Estate
- RiverRun Estates
- Cytonn Towers
- The Ridge
- Taraji Heights
- The Alma