Kenya H1’2022 Listed Insurance Report, & Cytonn Weekly #41/2022
By Cytonn Research, Oct 16, 2022
Executive Summary
Fixed Income
During the week, T-bills were oversubscribed, with the overall subscription rate coming in at 116.7%, up from the 110.0% recorded the previous week. The oversubscription was partly attributable to the eased liquidity in the money market, with the average interbank rate easing to 5.0% from 5.3% recorded in the previous week. Investor’s preference for the shorter 91-day paper persisted, with the paper receiving bids worth Kshs 10.2 bn against the offered Kshs 4.0 bn, translating to a subscription rate of 253.8% from 452.2% recorded the previous week. The subscription rate for the 364-day and 182-day papers also increased to 39.2% and 139.5% from 14.3% and 68.8% respectively, recorded the previous week. The yields on the government papers were on upward trajectory, with the yields on the 364-day, 182-day and 91-day papers increasing by 0.5 bps, 1.7 bps and 2.2 bps to 9.9%, 9.7% and 9.1%, respectively;
During the week, the National Treasury gazetted the revenue and net expenditures for the first quarter of FY’2022/2023, closing 30th September 2022, highlighting that the total revenue collected as at the end of September 2022 amounted to Kshs 486.0 bn, equivalent to 90.8% of the prorated estimates of Kshs 535.4 bn for the first three months of FY’2022/2023. The total expenditure amounted to Kshs 679.3 bn, equivalent to 76.7% of the prorated estimates of Kshs 886.2 bn;
Also during the week, the Energy and Petroleum Regulatory Authority (EPRA) released their monthly statement on the maximum retail fuel prices in Kenya effective 15th October 2022 to 14th November 2022. Key to note, prices of Super Petrol, Diesel and Kerosene prices declined by 0.6%, 1.2% and 0.7% to Kshs 178.3 per litre, Kshs 163.0 per litre and Kshs 146.9 per litre from Kshs 179.3 per litre, Kshs 165.0 per litre and Kshs 147.9 per litre, respectively;
The Kenya National Bureau of Statistics (KNBS) released the Quarterly Gross Domestic Product Report noting that the Kenyan economy recorded a 5.2% growth in Q2’2022, lower than the 11.0% growth in Q2’2021. Additionally, the Kenya National Bureau of Statistics released the Quarterly Balance of Payments report for Q2’2022 report highlighting that Kenya’s balance of payments position recorded a surplus of Kshs 10.9 bn, a decline of 93.9% from a surplus of Kshs 179.8 bn recorded in Q2’2021, and a 109.0% increase from a deficit of Kshs 120.6 bn recorded in Q1’2022;
According to the International Monetary Fund’s World Economic Outlook October 2022, global economic growth for 2022 is projected at 3.2%, unchanged from the July 2022 forecasts, but 0.4% lower than the projections in the World Economic Outlook April 2022. The Kenyan economy is projected to grow at 5.3% in 2022, 0.4% points lower than the projected 5.7% in April 2022;
Equities
During the week, the equities market was on an upward trajectory with NASI, NSE 20 and NSE 25 increasing by 2.8%, 1.4% and 3.0%, respectively, taking their YTD performance to losses of 22.3%, 11.2% and 16.8%, for NASI, NSE 20 and NSE 25, respectively. The equities market performance was mainly driven by gains recorded by large-cap stocks such as EABL, Bamburi, Safaricom and Standard Chartered Bank of 24.1%, 3.8%, 3.2%, and 2.6% respectively. The 24.1% gain in EABL was driven by increased trading, following an announcement of plans by Diageo Kenya to acquire additional stake in EABL Plc at Kshs 192.0, a 39.1% premium on the Kshs 138.0 share price as at 13th October 2022. The gains were however weighed down by losses recorded by banking stocks such as NCBA Group, KCB Group and DTB-K of 4.5%, 2.0% and 1.0% respectively;
Also during the week, Diageo UK, through Diageo Kenya, its wholly owned indirect subsidiary, announced that it served notice on East African Breweries Plc (EABL) of its intention to acquire an additional 15.0% stake to bring its shareholding in EABL to 65.0%, through a tender offer made to minority shareholders. Additionally, recently, Fitch Ratings, a global credit rating agency, affirmed Sanlam Life Insurance Limited’s (Sanlam Life), an Insurance provider in Kenya, an Insurer Financial Strength (IFS) rating and Issuer Default Rating (IDR) at ‘B’ and its holding Company Sanlam Kenya Plc’s (Sanlam Kenya) IDR at ‘B-‘;
Real Estate
During the week, the Kenya National Bureau of Statistics (KNBS) released the Q2’2022 GDP Report highlighting that the Real Estate Sector grew by 5.5% in the period under review, 0.6% and 1.9% points lower than the 6.1% and 7.4% growth recorded in Q1’2022 and Q2’2021, respectively. Under statutory reviews, the Retirement Benefits Authority (RBA) announced plans to have pension managers publish data on the number of Kenyans who use their retirement savings to purchase homes by January 2023, after having reviewed the Retirement and Benefits Act. For Real Estate Investment Trusts, Fahari I-REIT closed the week trading at an average price of Kshs 7.0 per share on the Nairobi Stock Exchange, while Acorn D-REIT and I-REIT closed the week trading at Kshs 23.8 and Kshs 20.8 per unit, respectively, on the Unquoted Securities Platform as at 7th October 2022;
Focus of the Week
Following the release of H1’2022 results by insurance companies, this week we analyse the performance of the 5 listed insurance companies in Kenya, identify the key factors that influenced their performance, and give our outlook for the insurance sector going forward;
Investment Updates:
- Weekly Rates:
-
- Cytonn Money Market Fund closed the week at a yield of 10.7%. To invest, dial *809# or download the Cytonn App from Google Playstore here or from the Appstore here;
- Cytonn High Yield Fund closed the week at a yield of 13.93% p.a. To invest, email us at sales@cytonn.com and to withdraw the interest, dial *809# or download the Cytonn App from Google Playstore here or from the Appstore here;
- We continue to offer Wealth Management Training every Wednesday and every third Saturday of the month, from 9:00 am to 11:00 am, through our Cytonn Foundation. The training aims to grow financial literacy among the general public. To register for any of our Wealth Management Trainings, click here;
- If interested in our Private Wealth Management Training for your employees or investment group, please get in touch with us through wmt@cytonn.com;
- Any CHYS and CPN investors still looking to convert are welcome to consider one of the five projects currently available for assignment, click here for the latest term sheet;
- Cytonn Insurance Agency acts as an intermediary for those looking to secure their assets and loved ones’ future through insurance namely; Motor, Medical, Life, Property, WIBA, Credit and Fire and Burglary insurance covers. For assistance, get in touch with us through insuranceagency@cytonn.com;
- Cytonnaire Savings and Credit Co-operative Society Limited (SACCO) provides a savings and investments avenue to help you in your financial planning journey. To enjoy competitive investment returns, kindly get in touch with us through clientservices@cytonn.com;
- For an exclusive tour of Cytonn’s real estate developments, visit: Sharp Investor's Tour, and for more information, email us at sales@cytonn.com;
- Phase 3 of The Alma is now ready for occupation and the show house is open daily. To rent please email properties@cytonn.com;
- We have 8 investment-ready projects, offering attractive development and buyer targeted returns; See further details here: Summary of Investment-ready Projects;
- For Third Party Real Estate Consultancy Services, email us at rdo@cytonn.com;
- For recent news about the group, see our news section here;
Hospitality Updates:
- We currently have promotions for Staycations. Visit cysuites.com/offers for details or email us at sales@cysuites.com;
During the week, T-bills were oversubscribed, with the overall subscription rate coming in at 116.7%, from the 110.0% recorded the previous week. The oversubscription was partly attributable to the eased liquidity in the money market, with the average interbank rate decreasing to 5.0% from 5.3% recorded in the previous week. Investor’s preference for the shorter 91-day paper persisted, with the paper receiving bids worth Kshs 10.2 bn against the offered Kshs 4.0 bn, translating to a subscription rate of 253.8% from 452.2% recorded the previous week. The subscription rate for the 364-day and 182-day papers also increased to 39.2% and 139.5% from 14.3% and 68.8% respectively, recorded the previous week. The yields on the government papers were on upward trajectory, with the yields on the 364-day, 182-day and 91-day papers increasing by 0.5 bps, 1.7 bps and 2.2 bps to 9.9%, 9.7% and 9.1%, respectively.
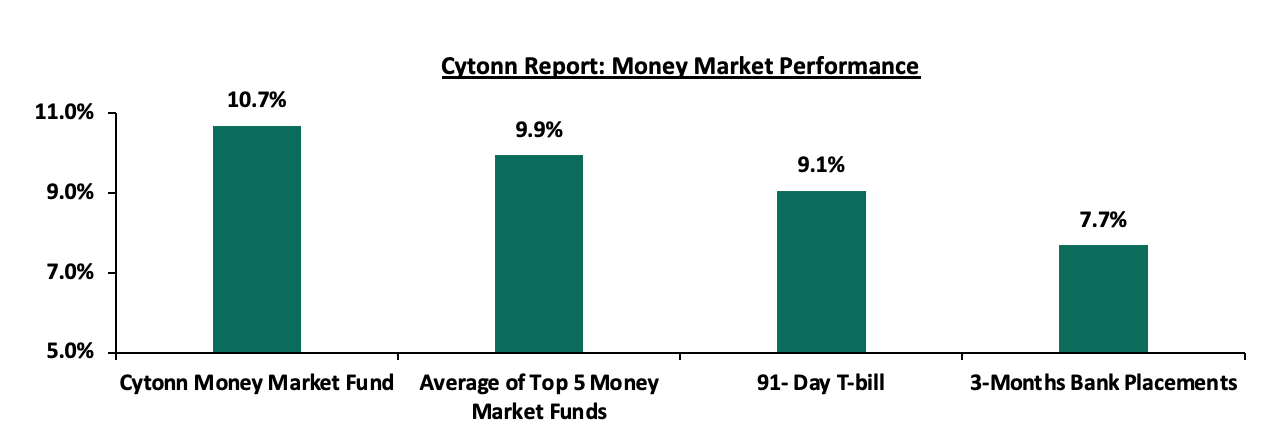
In the money markets, 3-month bank placements ended the week at 7.7% (based on what we have been offered by various banks), while the yield on the 91-day T-bill increased by 2.2 bps to 9.1%. The average yield of the Top 5 Money Market Funds and yield of the Cytonn Money Market Fund increased by 0.1 bps and 0.4 bps to 9.9% and 10.7%, respectively.
The table below shows the Money Market Fund Yields for Kenyan Fund Managers as published on 14th October 2022:
|
Cytonn Report: Money Market Fund Yield for Fund Managers as published on 14th October 2022 |
||
|
Rank |
Fund Manager |
Effective Annual Rate |
|
1 |
Cytonn Money Market Fund |
10.7% |
|
2 |
GenCap Hela Imara Money Market Fund |
10.0% |
|
3 |
Zimele Money Market Fund |
9.9% |
|
4 |
NCBA Money Market Fund |
9.7% |
|
5 |
Dry Associates Money Market Fund |
9.5% |
|
6 |
Sanlam Money Market Fund |
9.5% |
|
7 |
Old Mutual Money Market Fund |
9.4% |
|
8 |
Madison Money Market Fund |
9.3% |
|
9 |
Nabo Africa Money Market Fund |
9.3% |
|
10 |
Apollo Money Market Fund |
9.2% |
|
11 |
Co-op Money Market Fund |
9.2% |
|
12 |
CIC Money Market Fund |
9.1% |
|
13 |
Orient Kasha Money Market Fund |
8.8% |
|
14 |
ICEA Lion Money Market Fund |
8.5% |
|
15 |
AA Kenya Shillings Fund |
8.0% |
|
16 |
British-American Money Market Fund |
7.7% |
Source: Business Daily
Liquidity:
During the week, liquidity in the money markets eased, with the average interbank rate declining to 5.0% from 5.3% recorded the previous week, partly attributable to government payments that offset tax remittances. The average interbank volumes traded declined by 24.4% to Kshs 13.3 bn from Kshs 17.6 bn recorded the previous week.
Kenya Eurobonds:
During the week, the yields on Eurobonds were on an upward trajectory, an indication of rising risk concerns over the economy by investors on the back of persistent inflationary pressures. The yield on the 12-year Eurobond issued in 2021 increased the most by 0.7% points to 13.2% from 12.5% recorded in the previous week. The table below shows the summary of the performance of the Kenyan Eurobonds as of 13th October 2022;
|
Cytonn Report: Kenya Eurobond Performance |
||||||
|
|
2014 |
2018 |
2019 |
2021 |
||
|
Date |
10-year issue |
10-year issue |
30-year issue |
7-year issue |
12-year issue |
12-year issue |
|
3-Jan-22 |
4.4% |
8.1% |
8.1% |
5.6% |
6.7% |
6.6% |
|
30-Sep-22 |
17.6% |
14.7% |
14.0% |
15.6% |
14.7% |
13.2% |
|
7-Oct-22 |
16.0% |
13.9% |
13.2% |
14.8% |
14.0% |
12.5% |
|
10-Oct-22 |
16.0% |
13.9% |
13.2% |
14.8% |
14.0% |
12.5% |
|
11-Oct-22 |
15.9% |
13.9% |
13.2% |
14.8% |
13.9% |
12.5% |
|
12-Oct-22 |
16.0% |
13.9% |
13.2% |
15.0% |
14.0% |
12.5% |
|
13-Oct-22 |
16.1% |
14.0% |
13.3% |
15.2% |
14.1% |
13.2% |
|
Weekly Change |
0.1% |
0.1% |
0.1% |
0.4% |
0.1% |
0.7% |
|
MTD Change |
(1.5%) |
(0.7%) |
(0.7%) |
(0.4%) |
(0.6%) |
0.1% |
|
YTD Change |
11.7% |
5.9% |
5.2% |
9.6% |
7.4% |
6.6% |
Source: Central Bank of Kenya (CBK)
Kenya Shilling:
During the week, the Kenyan shilling depreciated by 0.1% against the US dollar to close the week at Kshs 121.0, from Kshs 120.9 recorded the previous week, partly attributable to increased dollar demand from the oil and energy sectors against a slower supply of hard currency. On a year to date basis, the shilling has depreciated by 6.9% against the dollar, higher than the 3.6% depreciation recorded in 2021. We expect the shilling to remain under pressure in 2022 as a result of:
- High global crude oil prices on the back of persistent supply chain bottlenecks coupled with high demand as most economies gradually recover,
- An ever-present current account deficit estimated at 5.2% of GDP in the 12 months to August 2022, same as that was recorded in a similar period in 2021, and,
- The aggressively growing government debt which continues to put pressure on forex reserves given that 68.1% of Kenya’s debt was US Dollar denominated as of July 2022.
The shilling is however expected to be supported by:
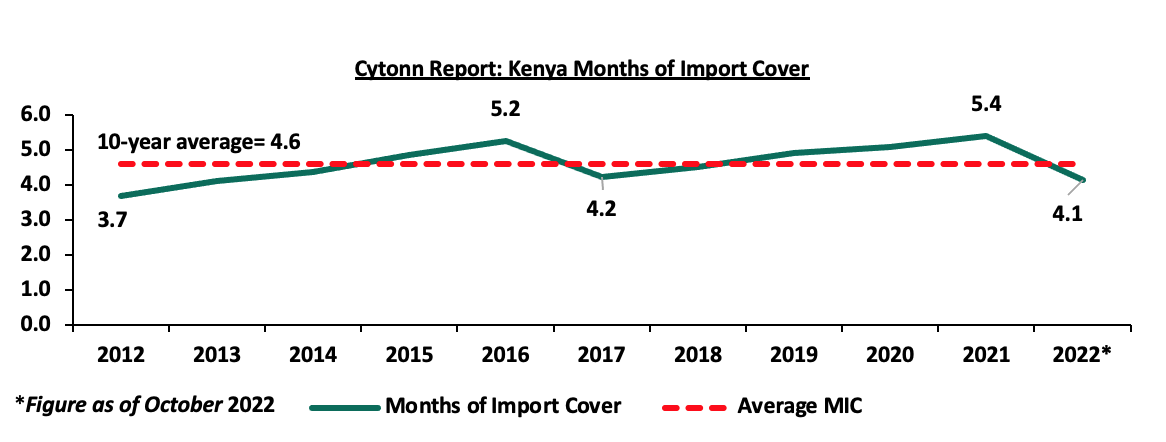
- Sufficient Forex reserves currently at USD 7.3 bn (equivalent to 4.1 months of import cover), which is above the statutory requirement of maintaining at least 4.0-months of import cover, however it’s important to note that Forex reserves have dropped by 17.0% on YTD from USD 8.8 bn to the current USD 7.3 bn. The chart below summarizes the evolution of Kenya months of import cover over the last 10 years.
- Significant diaspora remittances standing at a cumulative USD 4.0 bn as of September 2022, representing a 14.3% y/y increase from USD 3.5 bn recorded over the same period in 2021.
Weekly Highlights:
- Fuel Prices
During the week, the Energy and Petroleum Regulatory Authority (EPRA) released their monthly statement on the maximum retail fuel prices in Kenya effective 15th October 2022 to 14th November 2022. Super Petrol, Diesel and Kerosene prices declined by 0.6%, 1.2% and 0.7% to Kshs 178.3 per litre, Kshs 163.0 per litre and Kshs 146.9 per litre from Kshs 179.3 per litre, Kshs 165.0 per litre and Kshs 147.9 per litre, respectively. Key to note, this is the first time since the October 2021 that fuel prices have declined. The decline in the fuel prices was attributable to:
- Fuel subsidies of Kshs 18.2 and Kshs 27.5 per litres of diesel and kerosene respectively, retained after the partial subsidy removal in the month of September 2022,
- The 9.8% decrease in the Free On Board(FOB) price of Murban crude oil to USD 106.0 per barrel from USD 117.5 per barrel in the month of August 2022, and,
- A decline in the average landed costs of 10.6%, 6.9% and 1.8% to USD 726.8, USD 884.5 and USD 883.2 in September 2022 from USD 812.9, USD 949.7, USD 899.6 per cubic metres of Super Petrol, Diesel and Kerosene in August 2022, respectively.
However, the Kenyan shilling continued to depreciate against the US dollar, having declined by 2.7% to Kshs 123.9 in September 2022 from Kshs 120.6 in August, raising the cost of importing fuel, weighing down the country’s foreign reserves.
Following a decline in the average landed costs of imported fuel, fuel prices in Kenya have declined for the first time since October 2021, despite the partial removal of the fuel subsidies in September 2022 by the new administration after noting that the subsidies were unsustainable. We have maintained that the subsidy program is unsustainable and is a burden to the country’s expenditure. Going forward, we expect the current administration to completely do away with the fuel subsidy program and adjust the domestic fuel prices to ease pressure on expenditure and consequently reduce the need for excessive borrowing. However, we expect the cost of fuel to increase in the short-term, following the Organization of the Petroleum Exporting Countries (OPEC) decision to reduce their crude oil production by 2.0 million barrels per day effective November 2022, in a move that will stifle global oil supply. Consequently, we expect the cost of living to remain elevated given that fuel is a major contributor to Kenya’s inflation. Additionally, the business environment is expected to remain unfavorable because of the decline in consumer spending.
- Revenue and Net Exchequer for FY’2022/2023
The National Treasury gazetted the revenue and net expenditures for the first quarter of FY’2022/2023, ending 30th September 2022. Below is a summary of the performance:
|
Cyton Report: FY'2022/2023 Budget Outturn - As at 30th September 2022 |
|||||
|
Amounts in Kshs billions unless stated otherwise |
|||||
|
Item |
12-months Original Estimates |
Actual Receipts/Release |
Percentage Achieved |
Prorated |
% achieved of prorated |
|
Opening Balance |
|
0.6 |
|
|
|
|
Tax Revenue |
2,071.9 |
465.2 |
22.5% |
518.0 |
89.8% |
|
Non-Tax Revenue |
69.7 |
20.2 |
29.0% |
17.4 |
116.0% |
|
Total Revenue |
2,141.6 |
486.0 |
22.7% |
535.4 |
90.8% |
|
External Loans & Grants |
349.3 |
86.2 |
24.7% |
87.3 |
98.7% |
|
Domestic Borrowings |
1,040.5 |
95.7 |
9.2% |
260.1 |
36.8% |
|
Other Domestic Financing |
13.2 |
13.4 |
101.5% |
3.3 |
405.9% |
|
Total Financing |
1,403.0 |
195.3 |
13.9% |
350.8 |
55.7% |
|
Recurrent Exchequer issues |
1,178.4 |
276.1 |
23.4% |
294.6 |
93.7% |
|
CFS Exchequer Issues |
1,571.8 |
264.8 |
16.8% |
393.0 |
67.4% |
|
Development Expenditure & Net Lending |
424.4 |
68.1 |
16.0% |
106.1 |
64.1% |
|
County Governments + Contingencies |
370.0 |
70.3 |
19.0% |
92.5 |
76.0% |
|
Total Expenditure |
3,544.6 |
679.3 |
19.2% |
886.2 |
76.7% |
|
Fiscal Deficit excluding Grants |
1,403.0 |
193.3 |
13.8% |
350.8 |
55.1% |
|
Total Borrowing |
1,389.8 |
181.9 |
13.1% |
347.4 |
52.3% |
The Key take-outs from the release include;
- Total revenue collected as at the end of September 2022 amounted to Kshs 486.0 bn, equivalent to 22.7% of the original estimates of Kshs 2,141.6 bn for FY’2022/2023 and is 90.8% of the prorated estimates of Kshs 535.4 bn. We note that the government has not been able to meet its prorated revenue targets three months into the FY’2022/2023 partly attributable to the deterioration of the business environment following the elevated inflationary pressures that have seen consumers continue to cut on spending. Cumulatively, tax revenues amounted to Kshs 465.2 bn, equivalent to 22.5% of the original estimates of Kshs 2,071.9 bn and 89.8% of the prorated estimates of Kshs 518.0 bn,
- Total financing amounted to Kshs 195.3 bn, equivalent to 13.9% of the original estimates of Kshs 1,403.0 bn and is equivalent to 55.7% of the prorated estimates of Kshs 350.8 bn. Additionally, domestic borrowing amounted to Kshs 95.7 bn, equivalent to 9.2% of the original estimates of Kshs 1,040.5 bn and is 36.8% of the prorated estimates of Kshs 260.1 bn,
- The total expenditure amounted to Kshs 679.3 bn, equivalent to 19.2% of the original estimates of Kshs 3,544.6 bn, and is 76.7% of the prorated target expenditure estimates of Kshs 886.2 bn. Additionally, the net disbursements to recurrent expenditures came in at Kshs 276.1 bn, equivalent to 23.4% of the original estimates of Kshs 1178.4 bn and 93.7% of the prorated estimates of Kshs 294.6 bn,
- Consolidated Fund Services (CFS) Exchequer issues came in at Kshs 264.8 bn, equivalent to 16.8% of the original estimates of Kshs 1,571.8 bn, and are 67.4% of the prorated amount of Kshs 393.0 bn. The cumulative public debt servicing cost amounted to Kshs 237.0 bn which is 17.0% of the original estimates of Kshs 1,393.1 bn, and is 68.0% of the prorated estimates of Kshs 348.3 bn. Additionally, the Kshs 237.0 bn debt servicing cost is equivalent to 48.8% of the actual revenues collected as at the end of September 2022, further emphasizing on how much public debt weighs on the country’s expenditure, and,
- Total Borrowings as at the end of September 2022 amounted to Kshs 181.9 bn, equivalent to 13.1% of the original estimates of Kshs 1,389.8 bn for FY’2022/2023 and are 52.3% of the prorated estimates of Kshs 374.4 bn. The cumulative domestic borrowing target of Kshs 1,040.5 bn comprises of adjusted Net domestic borrowings of Kshs 579.1 bn and Internal Debt Redemptions (Roll-overs) of Kshs 461.4 bn.
As expected, the revenue performance for the third month of the FY’2022/2023 reflects the economic uncertainties that emanated from the elevated inflationary pressures. The slow-down in economic environment is expected to persist in the short term as consumers continue to cut on spending. As such, we believe that the performance of revenue collection in the coming months will be largely determined by how soon the country’s business environment stabilizes and how fast the new regime implements its economic growth related initiatives. However, risks lie on the downside given the high global commodity prices coupled with the persistent supply bottlenecks which continue to weigh on the economy.
- Kenya Q2’2022 GDP growth
The Kenya National Bureau of Statistics (KNBS) released the Q2’2022 Quarterly Gross Domestic Product Report, highlighting that the Kenyan economy recorded a 5.2% growth in Q2’2022, lower than the 11.0% growth recorded in Q2’2021, pointing towards sustained economic recovery. The performance was largely supported by significant growth recorded in sectors like Mining and Quarrying (22.6%), Accommodation and Food Services activities (22.0%), Financial and Insurance (11.6%) and transportation and storage (7.1%), among others. The key take-outs from the report include;
- Sectoral Contribution to Growth - The biggest gainer in terms of sectoral contribution to GDP was Financial and Insurance sector, increasing by 0.5% points to 8.8% from 8.3% in Q2’2021, while Agriculture and Forestry was the biggest loser, declining by 1.5% points to 19.4% in Q2’2022, from 20.9% in Q2’2021. Mining and Quarrying sector recorded the highest growth rate in Q2’2022 growing by 22.6% compared to the 10.9% growth recorded in Q2’2021. The chart below shows the top contributors to GDP by sector in Q2’2022:
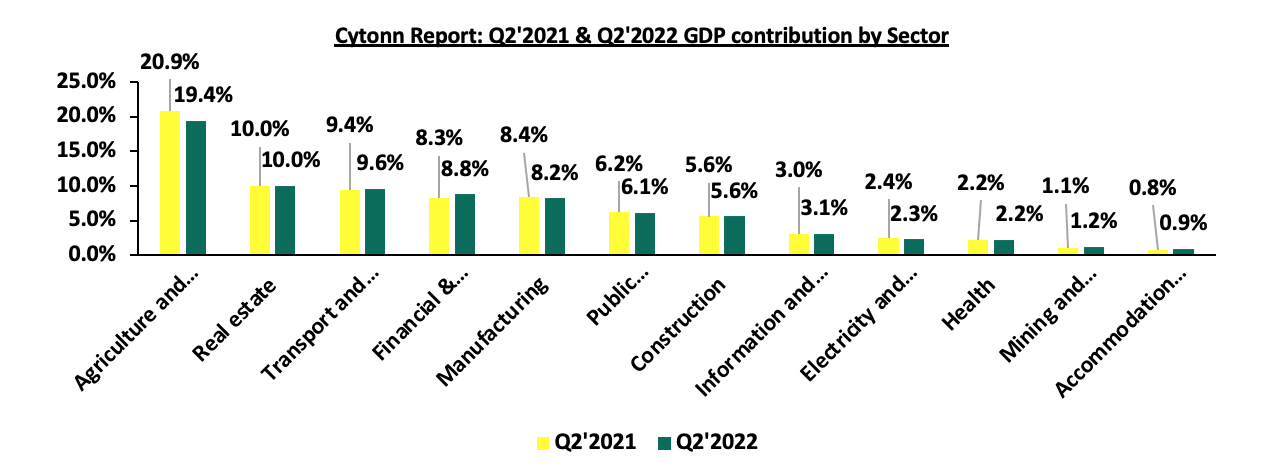
Source: KNBS Q2’2022 and Q2’2021 GDP Report
- Continued subdued Growth in the Agricultural Sector – Agriculture, Forestry and Fishing activities recorded a decline of 2.1% in Q2’2022 compared to a contraction of 0.5% in Q2’2021. The continued contraction was primarily attributable to unfavorable weather conditions experienced during the period. The sector's poor performance was reflected by declines recorded in horticultural exports, tea, coffee and milk production,
- Slower growth in the manufacturing sector - The manufacturing sector reported a growth of 3.6% in Q2’2022 compared to a 11.3% growth in a similar period of review in 2021. Similarly, the sectoral contribution declined by 0.2% points to 8.2%, from 8.4% in Q2’2021, and,
- Recovery in the Accommodation and Food services sector - The sector recorded 22.0% growth in Q2’2022 compared to a 6.2% growth recorded in Q2’2021. The growth witnessed in Q2’2022 is mainly attributable to the relaxation of most of the Covid -19 restrictions globally, which saw the number of visitor’s arrival through Jomo Kenyatta international Airport and Moi international Airport increasing by 147.1% to 279,981 up from 113,307 recorded in Q2’2021. Additionally, the sectoral contribution increased to 0.9% from 0.5% recorded in Q2’2021. The chart below shows the different sectoral GDP growth rates for Q2’2022:
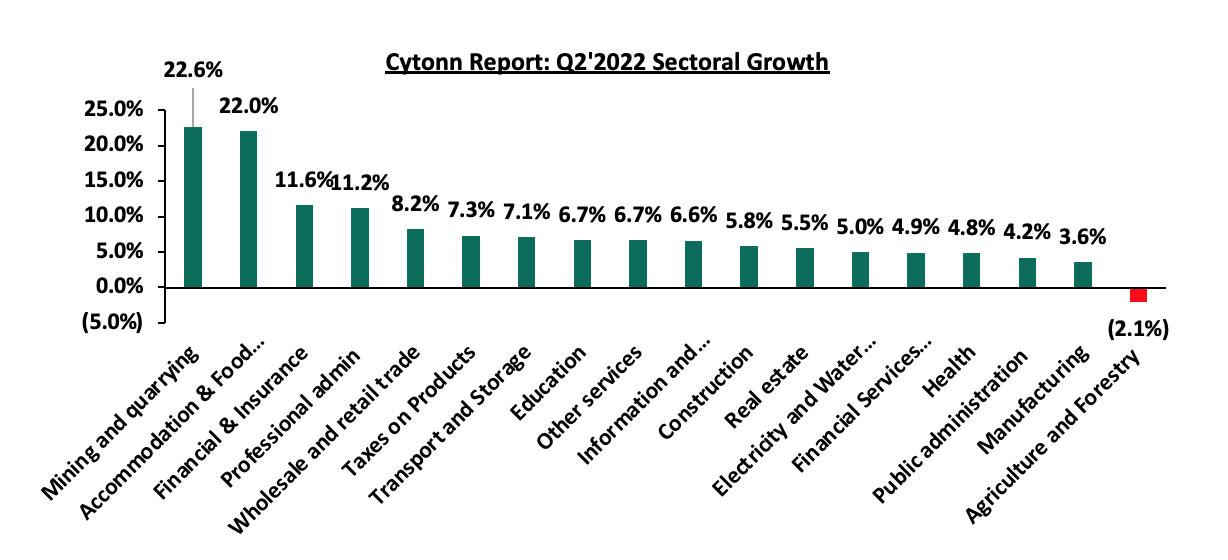
Source: KNBS Q2’2022 GDP Report
In the near-term, we expect the economy to grow at a slower pace on the back of elevated inflationary pressures with September 2022 inflation coming in at 9.2%, well above the Central Bank of Kenya target range of 2.5% - 7.5%. Further, the hiking of the Central Bank Rate (CBR) by the CBK Monetary Policy Committee in a bid to curb inflation and maintain price stability is expected to slow economic growth. However, we expect that recent fiscal policies such as subsidizing costs of crucial farm inputs such as fertilizers will support growth in the Agricultural sector, which remains as Kenya’s largest contributor to GDP as well as food prices being a major contributor to headline inflation.
- Kenya Q2’2022 Balance of Payments
The Kenya National Bureau of Statistics released the Quarterly Balance of Payments report for Q2’2022 report highlighting that Kenya’s balance of payments position recorded a surplus of Kshs 10.9 bn, a significant decline of 93.9% from a surplus of Kshs 179.8 bn recorded in Q2’2021, however, it was a 109.0% increase from a deficit of Kshs 120.6 bn in Q1’2022. The performance was mainly attributable to widening of the current account deficit by 9.8% to Kshs 174.4 bn from Kshs 158.9 bn recorded in Q2’2021. The deterioration was however mitigated by a 10.4% contraction of the financial account deficit to Kshs 253.0 bn, from Kshs 282.6 bn in Q2’2021. The table below shows the breakdown of the various balance of payments components, comparing Q2’2022 and Q2’2021:
|
Cytonn Report: Quarterly Balance of Payments |
|||||
|
Item |
Q1’2021 |
Q1'2022 |
Q2’2021 |
Q2'2022 |
y/y % Change |
|
Current Account Balance |
(157.5) |
(95.0) |
(158.9) |
(174.4) |
(9.8%) |
|
Capital Account Balance |
7.8 |
7.4 |
7.4 |
4.9 |
(33.8%) |
|
Financial Account Balance |
(107.3) |
(92.2) |
(282.6) |
(253.0) |
(10.4%) |
|
Net Errors and Omissions |
17.0 |
(125.2) |
48.7 |
(72.7) |
(249.1%) |
|
Balance of Payments |
(25.3) |
(120.6) |
179.8 |
10.9 |
(93.9%) |
All values in Kshs bns
Key take-outs from the table include;
- The current account deficit (value of goods and services imported exceeds the value of those exported) expanded by 9.8% to Kshs 174.4 bn, from Kshs 158.9 bn in Q2’2021, mainly attributable to 34.6% increase in the merchandise trade balance deficit to Kshs 365.6 bn, from Kshs 271.6 bn recorded in Q2’2021,
- The financial account balance deficit (the difference between the foreign assets purchased by domestic buyers and the domestic assets purchased by the foreign buyers) contracted by 10.4% to Kshs 253.0 bn, from a deficit of Kshs 282.6 bn in Q2’2021. Also, the stock of gross official reserves declined by 6.8% to stand at Kshs 1,001.0 bn, from 1,069.1 bn in Q2’2021, and,
- Consequently, the Balance of Payments (BoP) position declined to a surplus of Kshs 10.9 bn from a surplus of Kshs 179.8 bn in Q2’2022, mainly due to the 9.8% in the widening in current account deficit and 33.8% decline in capital account balance.
Current Account Balance
Kenya’s current account deficit increased by 9.8% to Kshs 174.4 bn in Q2’2022, from Kshs 158.9 bn recorded in Q2’2021 and an 83.6% increase from a deficit of Kshs 95.0 bn in Q1’2022, driven by:
- The widening of the merchandise trade (a scenario where imports are greater than exports of goods resulting to a negative net foreign investment) by 34.6% to Kshs 365.6 bn in Q2’2022, from Kshs 271.6 bn in Q2’2021,
- A 366.9% increase in the services trade balance (the difference between imports and exports of services) to Kshs 59.3 bn, from Kshs 12.7 bn in Q2’2021, and,
- A 12.9% increase in the secondary income balance (the transactions recorded in the secondary income account pertain to those current transfers between residents and non-residents that directly affect the level of gross national disposable income and thus influence the economy’s ability to consume goods and services), to Kshs 183.5 bn, from Kshs 162.6 bn in Q2’2021.
The table below shows the breakdown of the various current account components, comparing Q2’2021 and Q2’2022:
|
Cytonn Report: Quarterly Current Account Balance |
|||||
|
Item |
Q1’2021 |
Q1’2022 |
Q2’2021 |
Q2’2022 |
% Change |
|
Merchandise Trade Balance |
(281.4) |
(333.4) |
(271.6) |
(365.6) |
34.6% |
|
Service Trade Balance |
11.2 |
98.9 |
12.7 |
59.3 |
366.9% |
|
Primary Income Balance |
(41.7) |
(44.6) |
(62.5) |
(51.6) |
(17.4%) |
|
Secondary Income (Transfers) Balance |
154.5 |
184.1 |
162.6 |
183.5 |
12.9% |
|
Current Account Balance |
(157.5) |
(95.0) |
(158.9) |
(174.4) |
9.8% |
All values in Kshs bns
During the period of review, the Kenya shilling remained under pressure, depreciating by 9.2% y/y to close the quarter at Kshs 117.8, from Kshs 107.9 at the end of Q2’2021. However, the shilling was supported by the sufficient forex reserves held by the Central Bank of Kenya which stood at Kshs 8.0 bn at the end of Q2’2022. Going forward we expect relative stability in the business environment in fourth quarter in 2022, following the culmination of the election period. However, for the country to sufficiently improve the Balance of Payments, there needs to be emphasis on reducing imports, especially agricultural imports by being self-sufficient, as well as adopting policies that encourage more exports.
- IMF World Economic Outlook October 2022
According to the International Monetary Fund(IMF)’s World Economic Outlook October 2022, global economic growth for 2022 is projected at 3.2%, unchanged from the July 2022 forecasts, but 0.4% lower than the projections in the World Economic Outlook April 2022. Additionally, the growth is significantly lower than the 6.0% growth recorded in 2021, with the main drivers behind the slower growth stemming from the elevated inflationary pressures around the globe and the subsequent reactionary tightening of monetary policies by Central Banks around the globe. Further, the pre-existing supply chain constraints arising from the COVID-19 pandemic have not only persisted but have been worsened by effects of Russia’s invasion of Ukraine and frequent lockdowns in China to curb the spread of COVID-19.
Growth in the advanced economies is projected to come in at 1.1% in 2022, lower than the 2.4% growth recorded in 2021 and 0.9% points lower than the projected growth of 2.0% in April 2022. The slowdown is majorly attributed to downward revision in US and European economies mainly due to a decline in real disposable income and high interest rates, both which have resulted in decrease in consumer demand. China economic growth is projected to decline to 3.2% in 2022, the lowest growth it ever recorded in more than four decades excluding the COVID-19 crisis in 2020. The downward revision comes on the back of persistent lockdowns aimed at curbing the spread of COVID-19, as well as a slump in the property market.
In the Sub-Saharan Africa, the economy is projected to expand by 3.6% in 2022, from 4.7% recorded in 2021 and 0.2% points decline from July projections. The weaker outlook is majorly attributable to decreased trade partners, tighter financial and monetary conditions and impending debt crisis. Closer to home, the Kenyan economy is projected to grow at 5.3%, 0.4% points lower than the projected 5.7% in April 2022 and lower than the growth of 5.0% in 2021. The table below shows the updated projections according to various organizations:
|
Cytonn Report: Kenya Economy Growth Projections 2022 |
||
|
No |
Organisation |
2022 GDP projections |
|
1. |
International Monetary Fund |
5.3% |
|
2. |
National Treasury |
6.0% |
|
3. |
World Bank |
5.5% |
|
4. |
S&P Global |
4.5% |
|
5. |
Cytonn Investments Management PLC |
4.0% |
|
Average |
5.1% |
|
Source: Cytonn Research
Going forward, the stability in the global economy is largely pegged on how quickly the supply chain is restored, as well as how quickly the persistent and broadening inflationary pressures are brought under control.
Rates in the Fixed Income market have remained relatively stable due to the relatively ample liquidity in the money market. The government is 7.3% behind its prorated borrowing target of Kshs 169.4 bn having borrowed Kshs 157.0 bn of the Kshs 581.7 bn borrowing target for the FY’2022/2023. We expect sustained gradual economic recovery as evidenced by the revenue collections of Kshs 486.0 bn in the FY’2022/2023, equivalent to a 22.7% of its target of 2.1 tn. Despite the performance, we believe that the projected budget deficit of 5.7% is relatively ambitious given the downside risks and deteriorating business environment occasioned by high inflationary pressures. We however expect the support from the IMF and World Bank to finance some of the government projects and thus help maintain a stable interest rate environment since the government is not desperate for cash. Owing to this, our view is that investors should be biased towards short-term fixed-income securities to reduce duration risk.
Market Performance:
During the week, the equities market was on an upward trajectory with NASI, NSE 20 and NSE 25 increasing by 2.8%, 1.4% and 3.0%, respectively, taking their YTD performance to losses of 22.3%, 11.2% and 16.8%, for NASI, NSE 20 and NSE 25, respectively. The equities market performance was mainly driven by gains recorded by large-cap stocks such as EABL, Bamburi, Safaricom and Standard Chartered Bank of 24.1%, 3.8%, 3.2%, and 2.6% respectively. The 24.1% gain in EABL was driven by increased trading, following an announcement of plans by Diageo Kenya to acquire additional stake in EABL Plc at Kshs 192.0, a 39.1% premium on the Kshs 138.0 share price as at 13th October 2022. The gains were however weighed down by losses recorded by banking stocks such as NCBA Group, KCB Group and DTB-K of 4.5%, 2.0% and 1.0% respectively.
During the week, equities turnover declined by 57.3% to USD 8.8 mn from USD 20.7 mn recorded the previous week, taking the YTD turnover to USD 685.8 mn. Additionally, foreign investors turned net buyers, with a net buying position of USD 1.4 mn, from a net selling position of USD 13.6 mn recorded the previous week, taking the YTD net selling position to USD 176.4 mn.
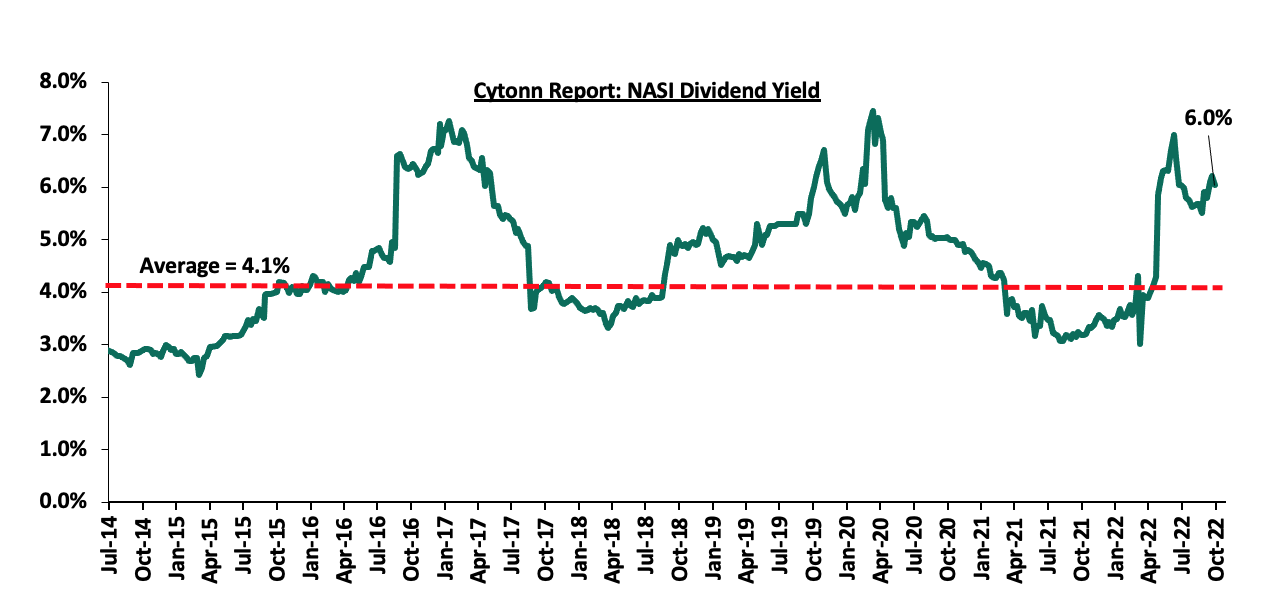
The market is currently trading at a price to earnings ratio (P/E) of 6.8x, 46.0% below the historical average of 12.7x, and a dividend yield of 6.0%, 1.9% points above the historical average of 4.1%. Key to note, NASI’s PEG ratio currently stands at 0.9x, an indication that the market is undervalued relative to its future growth. A PEG ratio greater than 1.0x indicates the market may be overvalued while a PEG ratio less than 1.0x indicates that the market is undervalued.
The charts below indicate the historical P/E and dividend yields of the market;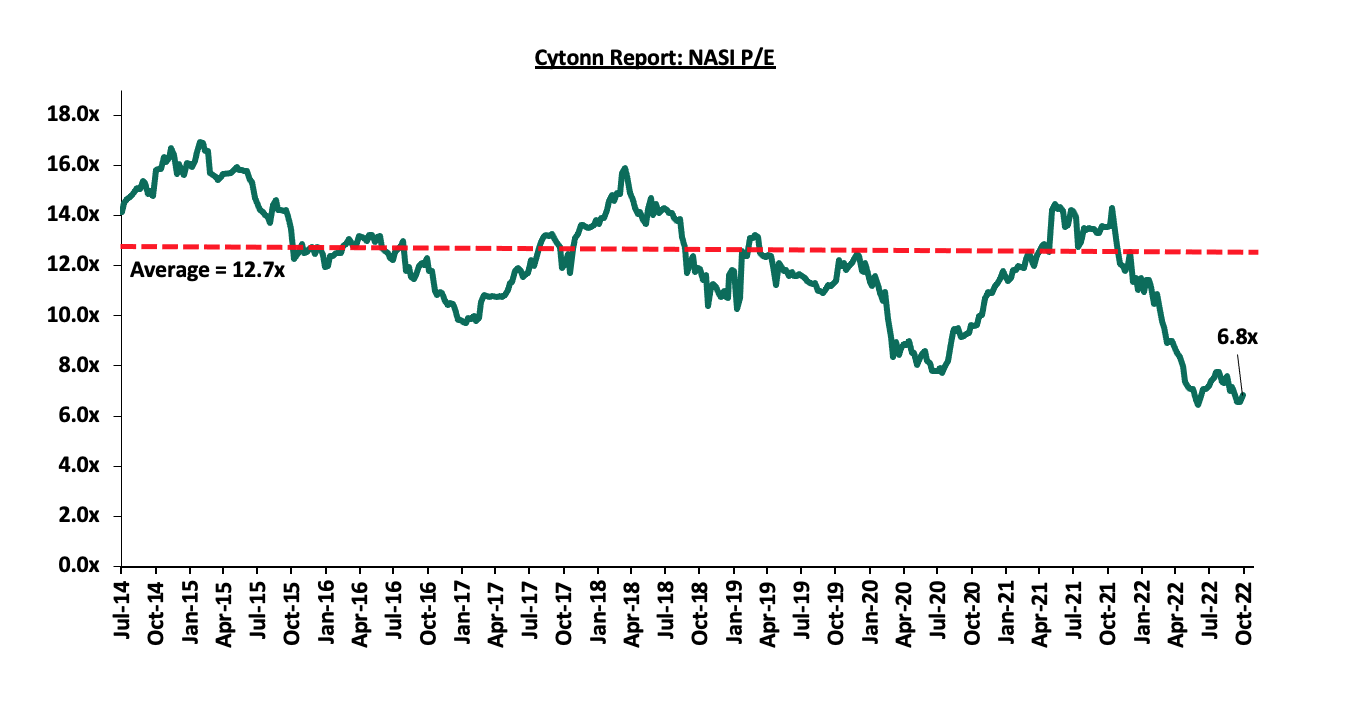
Weekly Highlights:
- Diageo Kenya Plc announces plans to increase its stake in EABL Plc
During the week, Diageo UK, through Diageo Kenya, its wholly owned indirect subsidiary, announced that it served notice on East African Breweries Plc (EABL) of its intention to acquire an additional 15.0% stake to bring its shareholding in EABL to 65.0%, through a tender offer made to minority shareholders. Diageo will apply to the Capital Markets Authority (CMA), for an exemption from the requirement to make a Take-over Offer, and EABL will remain listed in the Nairobi Stock Exchange (NSE). In the terms of the transaction;
- Diageo intends to acquire additional 118.4 mn shares, which will bring its total shareholding at EABL Plc to 514.0 mn shares, representing 65.0% shareholding, from the current 395.6 mn shares, representing 50.0% shareholding, The Table below shows the current shareholding in EABL Plc;
Cytonn Report: EABL Plc Shareholders
No
Name
Number of shares (mn)
Percentage
1.
Diageo Kenya Limited
395.6
50.0
2.
Standard Chartered Nominees Non-Resd A/C KE004667
22.9
2.9
3.
Standard Chartered Nominees Non-Resd A/C KE10085
20.8
2.6
4.
Kenya Commercial Bank Nominees RESD A/C 915B
11.0
1.4
5.
Standard Chartered Nominees RESD A/C KE111401
8.3
1.0
6.
Stanbic Nominees LTD R6631578
7.9
1.0
7.
Standard Chartered Nominees RESD A/C KE003534
7.4
0.9
8.
Stanbic Nominees LTD A/C NR1031461
6.5
0.8
9.
Stanbic Nominees LTD A/C NR3530153-1
5.6
0.7
10
Others
304.8
38.7
Total
790.8
100.0
Source: EABL Annual Report for the year ending 30th June 2022 - Diageo will purchase each share at Kshs 192.0, which represents a 39.1% premium on the EABL’s stock price of Kshs 138.0 a day before the announcement,
- The tender offer if approved by the concerned regulatory bodies will open on 30th January 2023 and close in two phases; with the first offer closing on 17th February 2023 and the second closing on 10th March 2023.
As per results for the year ended on 30th June 2022, EABL had an Earnings per share of Kshs 15.0. Using the closing trading price of Kshs 138.0 on 13th October 2022, a day prior to the announcement, this translated to a P/E multiple of 9.2x. The tender price of Kshs 192.0 will represent a P/E multiple of 12.8x. Additionally, the tender price represents an implied Total Enterprise value to unadjusted EBITDA multiple of 5.7x.
The move by Diageo to increase its shareholding in EABL reflects the strategic importance of EABL to the group, being a manufacturing sector market leader in the East African region. EABL continues to exhibit a strong financial performance evidenced by a Profit After Tax (PAT) of Kshs 15.6 bn in the year ended 30th June 2022, representing a 123.7% increase from Kshs 7.0 bn recorded in the year ended 30th June 2022. Using the average equity and assets of EABL, Return on average Equity came in at 75.5%, from 48.3% recorded in the year ended 30th June 2021, while its return on average Assets increased to 14.8% from 7.4% in the ended 30th June 2021. The Group also announced a final dividend per share of Kshs 7.25, adding to the interim dividend per share of Kshs 3.75 issued in H1’2021. We expect the proposed tender offer to continue to support EABL’s share price which rallied by 23.2% to Kshs 170.0 on 14th October, from Kshs 138.0 on 13th October 2022. Key to note, the stock rallied to a YTD gain of 2.7%, reversing the YTD loss of 16.6% as at 13th October 2022.
Further, we expect granting of the exemption by the CMA under the Take-over Regulations, 2002, to continue to allow majority shareholders to increase their stake by offering tender offers to existing shareholders without having to carry out a full takeover. If approved, Diageo would follow in the steps of Standard Africa Holdings Limited which was granted an exemption to increase it’s shareholding in Stanbic Holdings to 75.0%. For more information, please see our Cytonn Weekly #7 2022.
- Sanlam Kenya Credit Ratings
Recently, Fitch Ratings, a global credit rating agency, affirmed Sanlam Life Insurance Limited’s (Sanlam Life), an Insurance provider in Kenya, an Insurer Financial Strength (IFS) rating and Issuer Default Rating (IDR) at ‘B’ and its holding Company Sanlam Kenya Plc’s (Sanlam Kenya) IDR at ‘B-‘. The table below summarizes the ratings;
|
Cytonn Report: Fitch Sanlam Kenya Credit Ratings |
||
|
Rating |
June 2022 |
Oct 2022 |
|
IFS&IDR (Sanlam Life Kenya) |
B |
B |
|
IFS&IDR (Sanlam Kenya Plc.) |
B- |
B- |
|
Standalone Credit Quality(Sanlam Kenya Plc) |
b- |
ccc+ |
|
National Long Rating (Sanlam Life Kenya) |
AA- |
AA- |
|
National Long Term Rating(Sanlam Kenya(Plc) |
A+ |
A+ |
|
Outlook |
Negative |
Stable |
Source: Fitch Ratings
According to Fitch Ratings, both Sanlam Life and Sanlam Kenya Plc’s ratings were moved from Rating Watch Negative and assigned positive outlooks mainly due to the financial backing and support accorded by Sanlam Group (South Africa). Key to note, the group guarantees Sanlam Kenya’s external debt and recently extended a credit facility of Kshs 1.1 bn. Further, Sanlam Kenya continues to hold strategic importance to its parent company, given Kenya’s position as a financial hub in East Africa, and its role in the Sanlam Group’s Pan-African Strategy. However, key concerns include Sanlam Kenya’s weak standalone assessment driven by accumulated losses. In H1’2021, Sanlam Kenya reported an increase in the group’s net loss by 82.1% to Kshs 288.8 mn, adding to a loss of 542.4 mn in FY’2021. Additionally, Sanlam Kenya exhibited weak financial leverage evidenced by deterioration of its financial leverage ratio to 93.0% in H1’2022 from 83.0% in H1’2021, mainly driven by an increase in debt by Kshs 1.1 bn though guaranteed by the parent company.
Despite affirmation of the credit ratings and stable outlook by Fitch Ratings, we are of the opinion that Sanlam Kenya’s weak financial performance underscores the current unprofitability of core insurance business in Kenya. We expect the Insurance players to continuously look into portfolio optimization, product innovation and leveraging on technology and partnerships to enable them to return to profitability. However, we expect the expected joint venture announced by Sanlam Plc and Allianz SE in May 2022 will therefore increase the financial support to Sanlam Kenya and the combined operations will increase its market share in an industry that continues to suffer from low insurance penetration, which came in at a paltry 2.2% in 2021.
Universe of coverage:
|
Company |
Price as at 07/10/2022 |
Price as at 14/10/2022 |
w/w change |
YTD Change |
Target Price* |
Dividend Yield |
Upside/ Downside** |
P/TBv Multiple |
Recommendation |
|
KCB Group*** |
39.6 |
38.8 |
(2.0%) |
(14.8%) |
53.5 |
7.7% |
45.6% |
0.6x |
Buy |
|
Equity Group*** |
44.5 |
44.1 |
(0.9%) |
(16.4%) |
59.7 |
6.8% |
42.1% |
1.0x |
Buy |
|
Co-op Bank*** |
11.9 |
12.0 |
1.3% |
(7.7%) |
15.6 |
8.3% |
38.3% |
0.7x |
Buy |
|
ABSA Bank*** |
11.0 |
11.2 |
1.8% |
(5.1%) |
14.9 |
1.8% |
35.4% |
1.0x |
Buy |
|
Kenya Reinsurance |
2.0 |
2.0 |
1.0% |
(12.7%) |
2.5 |
5.0% |
30.5% |
0.2x |
Buy |
|
I&M Group*** |
16.9 |
17.0 |
0.6% |
(20.6%) |
20.5 |
8.8% |
29.6% |
0.4x |
Buy |
|
Jubilee Holdings |
240.0 |
240.0 |
0.0% |
(24.2%) |
305.9 |
0.4% |
27.9% |
0.4x |
Buy |
|
Diamond Trust Bank*** |
49.4 |
48.9 |
(1.0%) |
(17.8%) |
59.5 |
6.1% |
27.8% |
0.2x |
Buy |
|
Liberty Holdings |
5.2 |
5.5 |
5.8% |
(22.4%) |
6.8 |
0.0% |
23.2% |
0.4x |
Buy |
|
Standard Chartered*** |
134.8 |
138.3 |
2.6% |
6.3% |
155.0 |
10.1% |
22.2% |
0.9x |
Buy |
|
CIC Group |
2.0 |
1.9 |
(5.0%) |
(12.4%) |
2.3 |
0.0% |
22.1% |
0.7x |
Buy |
|
NCBA*** |
32.0 |
30.5 |
(4.5%) |
19.8% |
35.2 |
6.6% |
21.8% |
0.7x |
Buy |
|
Sanlam |
9.9 |
9.9 |
(0.6%) |
(14.5%) |
11.9 |
0.0% |
20.5% |
1.0x |
Buy |
|
Britam |
5.9 |
6.0 |
3.1% |
(20.1%) |
7.1 |
0.0% |
17.9% |
1.0x |
Accumulate |
|
HF Group |
3.3 |
3.1 |
(6.3%) |
(18.2%) |
3.6 |
0.0% |
15.1% |
0.2x |
Accumulate |
|
Stanbic Holdings |
97.0 |
97.3 |
0.3% |
11.8% |
99.9 |
9.3% |
12.0% |
0.8x |
Accumulate |
|
Target Price as per Cytonn Analyst estimates **Upside/ (Downside) is adjusted for Dividend Yield ***For Disclosure, these are stocks in which Cytonn and/or its affiliates are invested in |
|||||||||
We are “Neutral” on the Equities markets in the short term due to the current adverse operating environment and huge foreign investor outflows, and, “Bullish” in the long term due to current cheap valuations and expected global and local economic recovery.
With the market currently trading at a discount to its future growth (PEG Ratio at 0.9x), we believe that investors should reposition towards value stocks with strong earnings growth and that are trading at discounts to their intrinsic value. We expect the current high foreign investors sell-offs to continue weighing down the economic outlook in the short term.
- Industry Report
During the week, the Kenya National Bureau of Statistics (KNBS) released the Q2’2022 GDP Report, and the key take-outs related to the Real Estate sector were as outlined below:
- Gradual Growth in the Real Estate Sector - The Real Estate Sector grew by 5.5% in the period under review, 0.6% and 1.9% points lower than the 6.1% and 7.4% growth recorded in Q1’2022 and Q2’2021, respectively. The decline in performance was mainly attributed to increased cost of construction materials hindering optimum investments, coupled with the looming uncertainties revolving around the general election. The graph below shows Real Estate sector growth rates from Q1’2020 to Q2’2022;
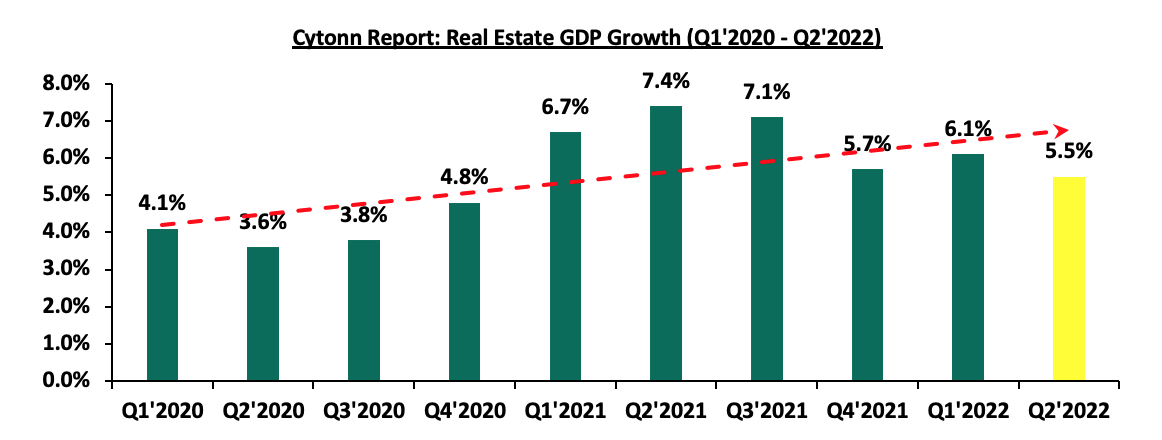
Source: Kenya National Bureau of Statistics (KNBS)
- Slower Growth in the Construction Sector - The Construction Sector grew by 5.8% in Q2’2022, 1.0% point lower than the 6.8% growth recorded in Q2’2021. The performance was also a 0.6% q/q decline, from the 6.4% growth recorded in Q1’2022. The decline was driven by the rising cost of construction materials coupled with the completion of major development projects in the country such as the Nairobi Expressway. The graph below shows the construction sector growth rate from Q1’2020-Q2’2022;
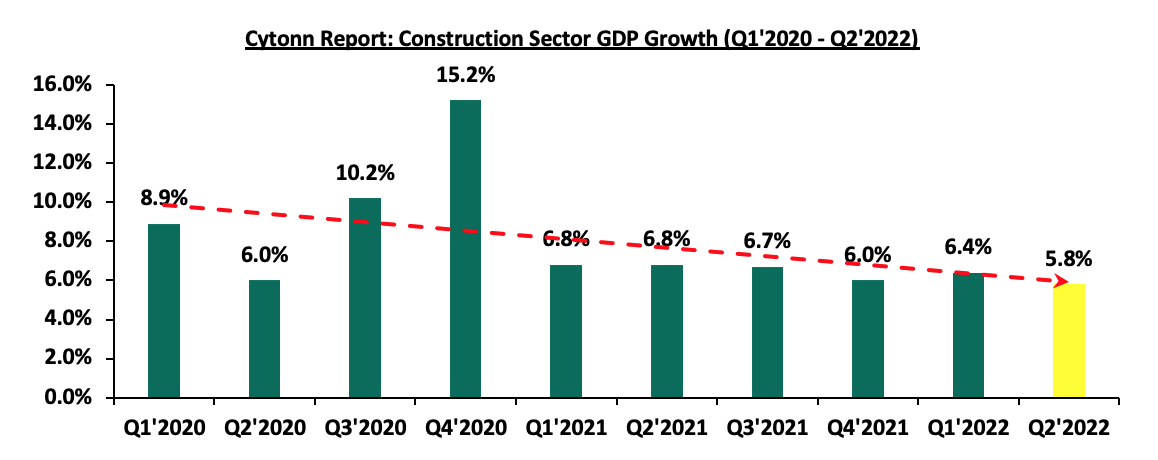
Source: Kenya National Bureau of Statistics
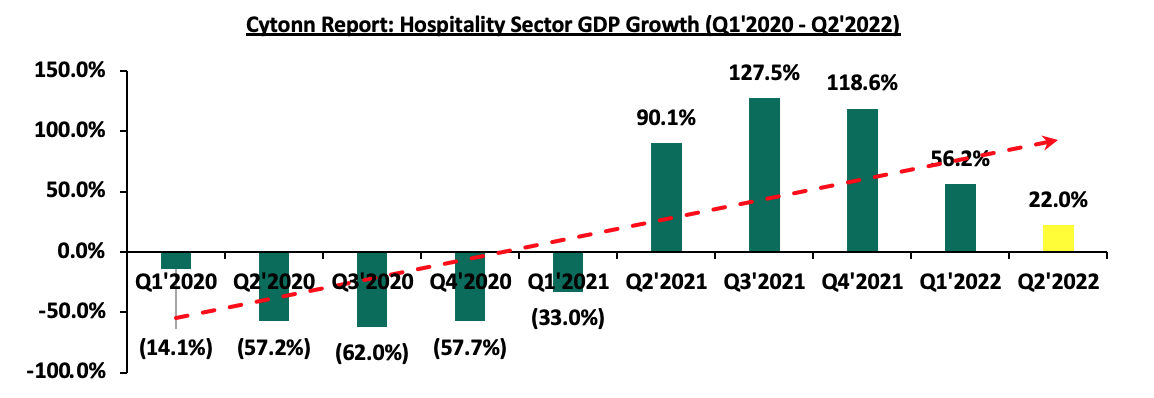
- Sustained Recovery in the Accommodation and Food Service Sector - The Accommodation and Restaurant services grew by 22.0% in Q2’2022, from the 90.1% and 56.2% growth recorded in Q2’2021 and Q1’2022, respectively. The decline was mainly driven by the persistent inflationary pressures that has seen food inflation increase to 12.8% in Q2’2022 from 9.2% in Q1’2022. However, the sector’s performance continues to be cushioned by the rising tourism activities. The number of visitors arriving into the country came in at 279,981 in Q2’2022 from 113,307 visitors in Q1’2022. The graph below shows the Accommodation and Restaurant Sector growth rate from Q1’2020-Q2’2022;
Source: Kenya National Bureau of Statistics
Kenya’s Real Estate sector is expected to gain momentum supported by the peaceful post-electioneering period which we expect to continue improving investors’ confidence in the sector, coupled with the continuous recovery of the hospitality sector, and more development activities particularly in the residential sector. However, the elevated inflationary pressures on the hospitality and construction sectors is expected to weigh on the optimum performance of the Real Estate sector.
- Statutory Reviews
During the week, the Retirement Benefits Authority (RBA) announced plans to have pension managers publish data on the number of Kenyans who use their retirement savings to purchase homes by January 2023, after having reviewed the Retirement and Benefits Act. The law was amended in 2020 in order to allow pensioners to use 40.0% of their savings to purchase homes, in a bid to boost the uptake of affordable homes and in turn the low home ownership rate in Kenya, currently at 23.0% in the urban areas. Through this, RBA aims to track the uptake of homes under the policy whose implementation has been delayed as pension managers continue to learn and familiarize with the process. Additionally, the uptake of homes under the scheme has been low as the number of individuals exiting the scheme increases owing to setbacks such as i) lengthy application processes which require a lot of documentation, ii) high taxes on withdrawals of the pension advance, iii) inadequate advance which does not cover stamp duty and legal fees thus requiring additional funds, iv) a decline in the disposable income hence lower contributions, and, iv) limiting caveats on the property title preventing owners from selling houses once purchased, among others.
With the implementation of the policy, we expect it to provide accurate information regarding the number of applications and the rate of uptake of housing units by Kenyans through their retirement savings. This will clarify the state of activities in the Real Estate sector and consequently allow better decision making by stakeholders and thereby foster the growth and performance of the sector as a whole. However, the above challenges continue to reduce the level of uptake of housing units, and therefore hamper the optimal operation of the pension advance provision. It is also not clear how RBA is planning on tackling the issues revolving around the scheme in a bid to boost its attractiveness to Kenyans.
- Real Estate Investment Trusts (REITs)
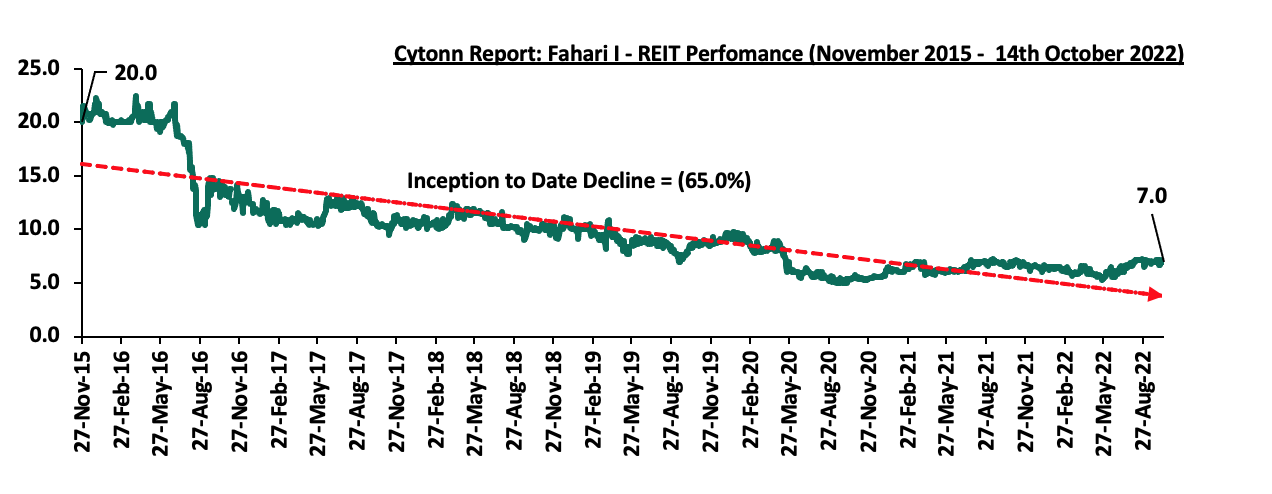
In the Nairobi Stock Exchange, ILAM Fahari I-REIT closed the week trading at an average price of Kshs 7.0 per share, representing an 11.8% Year-to-Date (YTD) increase. However, the performance was a 65.0% Inception-to-Date (ITD) decline from Kshs 20.0. The graph below shows Fahari I-REIT’s performance from November 2015 to 14th October 2022:
In the Unquoted Securities Platform, Acorn D-REIT and I-REIT closed the week at Kshs 23.8 and Kshs 20.8 per unit, respectively, as at 7th October 2022. The performance represented a 19.0% and 4.0% gain for the D-REIT and I-REIT, respectively, from the Kshs 20.0 inception price. The volumes traded for the D-REIT and I-REIT came in at 5.5 mn and 14.5 mn shares, respectively, with a turnover of Kshs 116.9 mn and Kshs 300.3 mn, respectively, since its Inception in February 2021.
We expect the performance of Kenya’s Real Estate sector to improve owing to the anticipated increase in the construction activities particularly in the residential sector driven by private and government’s efforts to provide housing units to citizens, the continuous recovery of the hospitality sector, as well as the enforcement of regulations aimed at tracking and providing clarification on the performance of select property sectors. However, setbacks such as inflationary pressures in the economy, coupled with the minimal investor appetite for REITs still pose a challenge to the optimum performance of Kenya’s property market.
Following the release of the H1’2022 results by Kenyan insurance firms, the Cytonn Financial Services Research Team undertook an analysis on the financial performance of the listed insurance companies and the key factors that drove the performance of the sector. The report is themed ‘’Improved Efficiency Cushions Insurance Sector’s Core Earnings Growth”, where we assess the main trends in the sector, and areas that will be crucial for growth and stability going forward, seeking to give a view on which insurance firms are the most attractive and stable for investment. As a result, we shall address the following:
- Insurance Penetration in Kenya
- Key Themes that Shaped the Insurance Sector in H1’2022,
- Industry Highlights and Challenges,
- Performance of The Listed Insurance Sector in H1’2022, and,
- Conclusion & Outlook of the Insurance Sector.
Section I: Insurance Penetration in Kenya
Insurance uptake in Kenya remains low compared to other key economies with the insurance penetration coming in at 2.2% as at 2021, according to the Central Bank of Kenya’s Kenya Financial Sector Stability Report 2022. The low penetration rate, which is below the global average of 7.0%, is attributable to the fact that insurance uptake is still seen as a luxury and mostly taken when it is necessary or a regulatory requirement. Key to note, Insurance penetration remained unchanged at 2.2% in 2021, same as what was recorded in 2020, despite the economic recovery that saw an improved business environment highlighting the low insurance uptake in the country.
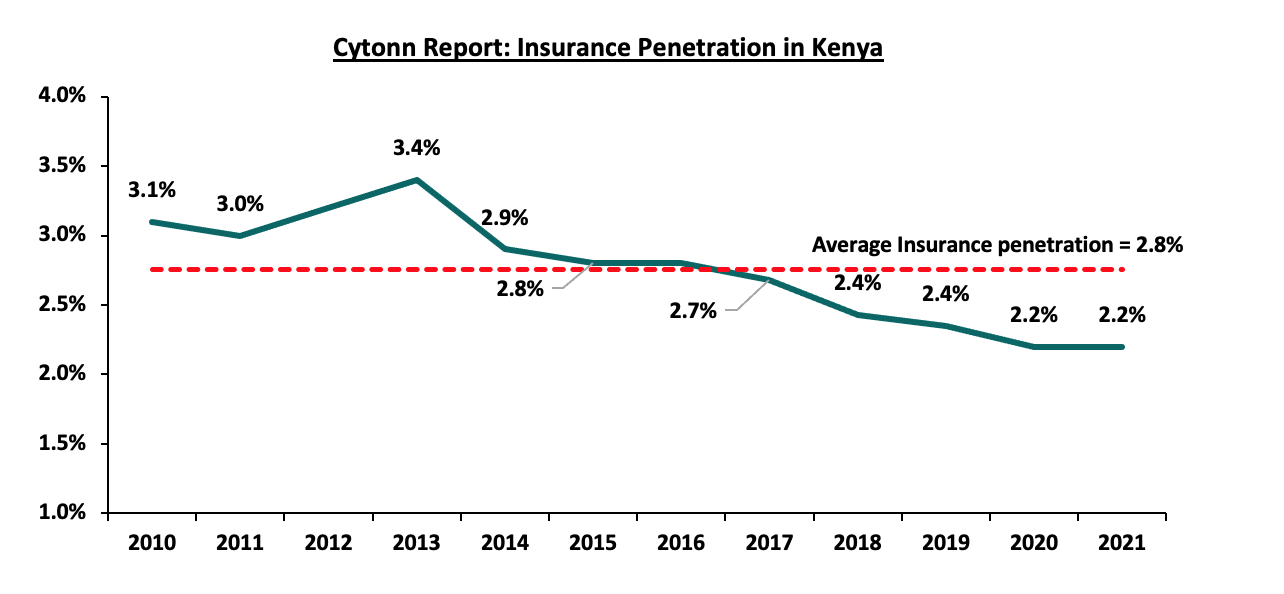
Source: CBK Financial Stability Reports
The chart below shows the insurance penetration in other economies across Africa:
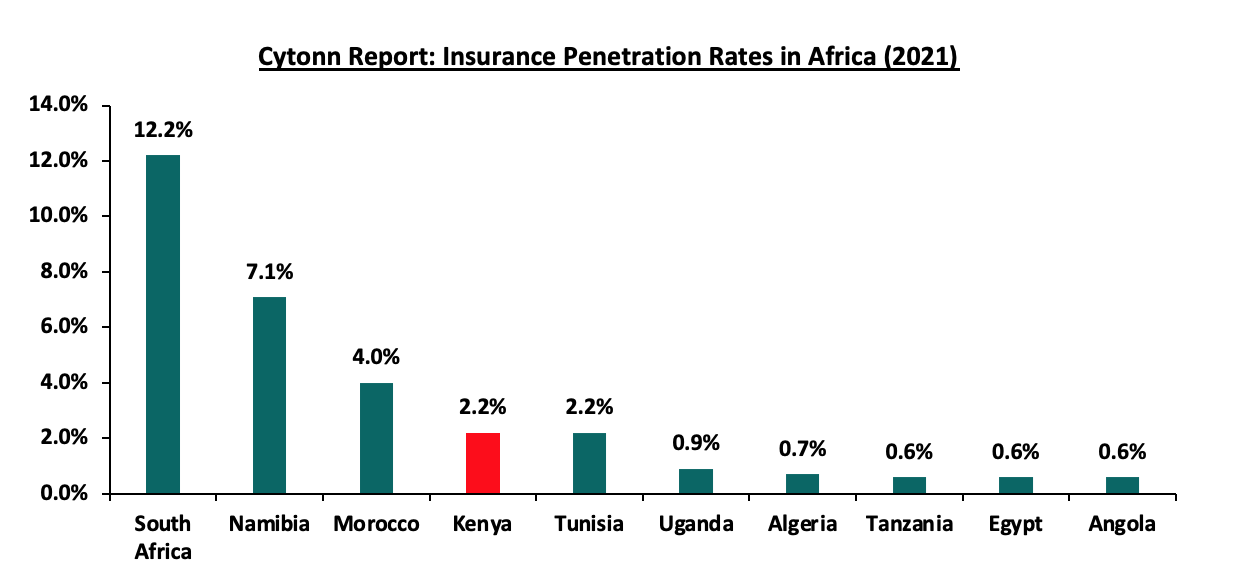
Source: Swiss Re, GCR Research, CBK
Insurance penetration in Africa has remained relatively low, averaging 3.1% in 2021, mainly attributable to lower disposable income in the continent and slow growth of alternative distribution channels and technology such as mobile phones to ensure wider reach of insurance products to the masses. Additionally, there has been slow inclusion of diversified products which cater for all income levels and groups. In 2021, South Africa remained the leader in insurance penetration in the continent as a result of mature and highly competitive market, coupled with strong institutions and a sound regulatory environment.
Section II: Key Themes that Shaped the Insurance Sector in H1’2022
Despite the country recording a 5.2% GDP growth in H1’2022, the business environment remained constrained by elevated inflation and supply chain constraints worsened by the geopolitical tensions arising from Russia’s Invasion of Ukraine. According to the Insurance Regulatory Authority(IRA)’s Q2’2022 Industry report, the insurance sector showcased resilience and recorded a 13.2% growth in gross premiums to Kshs 163.1 bn in H1’2022, from Kshs 144.0 bn in H1’2021. Key to note, the general insurance business contributed 56.7% of the industry’s premium income compared to 43.3% contribution by long term insurance business. During the period, the long term business premiums grew by 20.5% to Kshs 70.7 bn from Kshs 58.7 bn in H2’2021 while the general business premiums grew by 8.2% to Kshs 92.4 bn from Kshs 85.4 bn in H2’2021. Significant to note, motor insurance and medical insurance classes of insurance accounted for 62.5% of the gross premium income under the general insurance business compared to 62.3% in H1’2021. As for long-term insurance business, the major contributors to gross premiums were deposit administration and life assurance classes accounting for 60.7% in H2’2022, compared to the 59.7% contribution by the two classes recorded in H2’2021.
In the period under review, the net claims for the long term insurance business increased by 4.7% to Kshs 41.3 bn, from Kshs 39.4 bn in H1’2021. Similarly, net claims for the general business also increased by 14.5% to Kshs 37.1 bn, from Kshs 32.4 bn in H1’2022, driven by a 23.4% growth in medical claims to Kshs 15.5 bn in H1’2022, from Kshs 12.5 bn in H1’2021.
The NASI index declined by 25.5% in H2’2022 compared to a gain of 9.4% in H1’2021 consequently deteriorating the insurance sector’s bottom line as a result of fair value losses in the equities investments. This has seen the sector continue to reduce its allocation to quoted equities, with the proportion of quoted equities to total industry assets declining to 2.8% in H1’2022, from 4.0% in H1’2021. Key to note, Year to Date (YTD), NASI has also declined by 22.3%, which will continue to have a direct impact on the sector’s bottom-line, due to the expected fair value losses on the quoted securities.
Key highlights from the industry performance:
- Convenience and efficiency through adoption of alternative channels for both distribution and premium collection such as Bancassurance and improved agency networks,
- Advancement in technology and innovation making it possible to make premium payments through mobile phones,
- Continued recovery from the economic shocks that saw both individuals and businesses seek insurance uptake to cover for their activities, leading to growth in gross premiums which increased by 13.2% to Kshs 163.1 bn, from Kshs 144.0 bn in H1’2021 and,
- The sector’s investment income declined by 37.0% to Kshs 16.6 bn in H1’2022, from Kshs 26.3 bn recorded in H1’2021 for long term insurance businesses, and also declined by 26.5% for general insurance businesses to Kshs 4.6 bn, from Kshs 6.3 bn recorded in H1’2021. Subsequently, yield on investments for the Insurance sector declined by 1.9% points to 2.8%, from 4.7% in H1’2021.
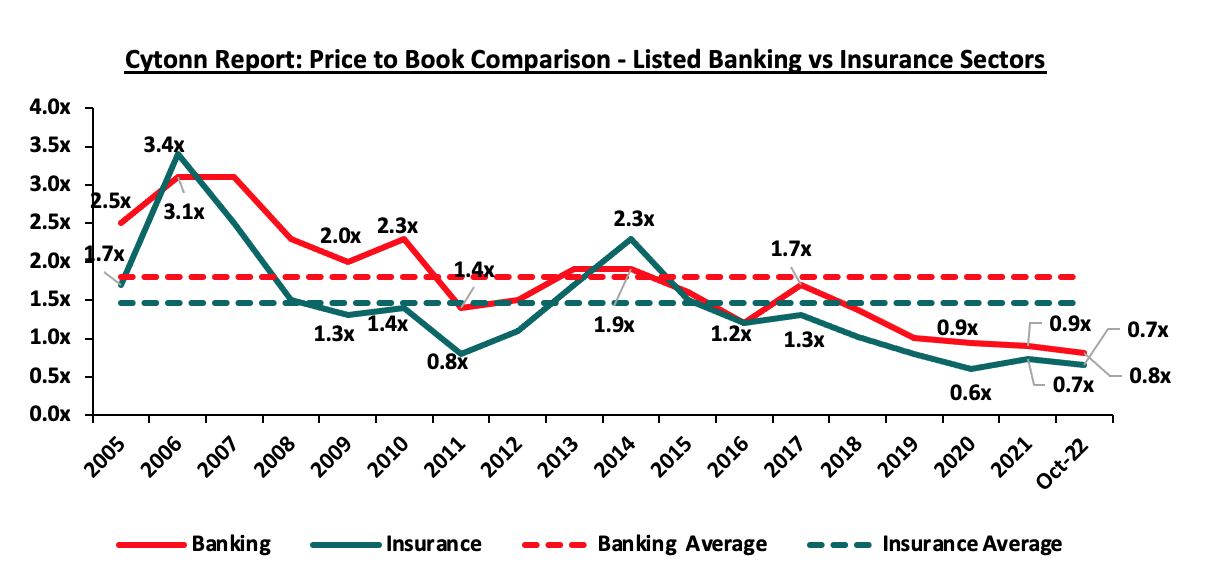
On valuations, listed insurance companies are trading at a price to book (P/Bv) of 0.7x, lower than listed banks at 0.8x, but both are lower than their 16-year historical averages of 1.5x and 1.8x, for the insurance and banking sectors, respectively. These two sectors are attractive for long-term investors supported by the strong economic fundamentals.
The key themes that have continued to drive the insurance sector include:
- Technology and Innovation
The onset of COVID-19 pandemic in 2020 acted as a catalyst towards the adoption of digital distribution of insurance products as it was a necessity. Consequently, majority of insurance companies continue to take advantage of the available digital channels to drive growth and increase insurance penetration in the country. For the fourth quarter of FY’2021/22, active mobile subscriptions declined to 64.7 mn against a population of 55.0 mn, translating to a mobile penetration of 130.9%, according to Fourth Quarter Sector Statistics Report for the FY’2021/2022 . The high mobile penetration implies that mobile phones provide sufficient headroom to increase opportunities to distribute insurance products to the younger generation of consumers and those consumers that have not been served through traditional distribution methods. Given that the process of handling and inspecting claims manually is cumbersome and imperfect, the use of Artificial Intelligence (AI) assists in investigating the legitimacy of claims and identifying those that are fraudulent. Additionally, firms are also leveraging data and AI to tailor products for their target markets. An example is Jubilee Holdings which has rolled out a digital virtual assistant, through which clients can receive real-time services that include the end to end purchase of insurance products and access to services free of human intervention.
- Regulation
To ensure that the sector benefits from a globally competitive financial services sector, the regulator has been working through regulation implementations to address some of the perennial, as well as emerging problems in the sector. The COVID-19 environment proved challenging especially on the regulatory front, as it was a balance between remaining prudent as an underwriter and adhering to the set regulations given the negative effect the pandemic. Regulations used for the insurance sector in Kenya include the Insurance Act Cap 487 and its accompanying schedule and regulations, Retirement Benefits Act Cap 197 and The Companies Act. In H1’2022, regulation remained a key aspect affecting the insurance sector and the key themes in the regulatory environment include;
- IFRS 9 - IAS 39, Financial Instruments Recognition and Measurement was replaced with IFRS 9, Financial Instruments to address the classification and measurement of financial instruments, impairment, and hedge accounting. The guidelines introduce new classification and measurement especially for financial assets, necessitating insurers to make judgements to determine whether financial investments are measured at amortised cost or fair value and whether gains and losses are included in the profit or loss or other comprehensive income. The new impairment model under IFRS 9 is based on expected credit losses and subsequently, all financial assets will carry a loss allowance, meaning that insurers will have to provision higher for impairment losses. Many insurance companies have opted to use the temporary exemption from implementation of IFRS 9, by continuing to apply IAS 39, but the temporary exemption expires in January 2023. IFRS 9 will enable insurance companies to develop appropriate models for their customer debtors and develop plans that will help them lower their credit risk in the future,
- IFRS 17- The standard establishes the principle for recognition, measurement, presentation and disclosure of insurance contracts with the objective of ensuring insurance companies provide relevant information that faithfully represents the contracts. However, as a way to protect the insurance industry from the negative effects of the pandemic the International Accounting Standards Board (IASB), the international body responsible for setting up financial reporting standards deferred its implementation to be effective from January 2023 or earlier. The standard, having replaced IFRS 4, is expected to give better information on profitability by providing more insights about current and future profitability of insurance contracts. Separation of financial and insurance results in the income statement will allow for better analysis of core performance for the entities and allow for better comparability of insurance companies. However, the implementation of the new standard has particular challenges such as the need for historical information and additional finance costs in changing the finance/accounting reporting and actuarial systems. With the looming IFRS 17 compliance dates, insurance firms need to hasten the process, and,
- Risk Based Supervision - IRA has been implementing risk-based supervision through guidelines that require insurers to maintain a capital adequacy ratio of at least 200.0% of the prescribed capital ratio by 2020. However, several hardships faced by the sector such as the COVID-19 pandemic saw an extension of the compliance deadline by 6 months. The regulation requires insurers to monitor the capital adequacy and solvency margins on a quarterly basis, with the main objective being to safeguard the insurer’s ability to continue as a going concern and provide shareholders with adequate returns. We expect more mergers within the industry as smaller companies struggle to meet the minimum capital adequacy ratios. We also expect insurance companies to adopt prudential practices in managing and taking on risk and reduction of premium undercutting in the industry as insurers will now have to price risk appropriately.
- Capital Raising, share purchase and consolidation
The move to a risk based capital adequacy framework presented opportunities for capital raising initiatives mostly by the small players in the sector to shore up their capital and meet compliance measures. With the new capital adequacy assessment framework, capital is likely to be critical to ensuring stability and solvency of the sector to ensure the businesses are a going concern. In May 2022, Sanlam Limited, a South African financial services group listed on the Johannesburg Stock Exchange, announced that it had entered into a definitive Joint Venture agreement for a term of 10 years with Allianz SE, with the aim to leverage on the two entities footprints in Africa and create a leading Pan-African financial services group, with an estimated equity value of Kshs 243.7 bn. Key to note, Sanlam Limited, indirectly owns 100.0% in Hubris Holdings Limited, which is the majority shareholder in Sanlam Kenya Plc, a listed insurance and financial services entity on the Nairobi Stock Exchange. The initial shareholding split of the Joint Venture was announced to be 60:40, Sanlam Limited to Allianz respectively, with the effective date of the proposed transaction being within 12-15 months of the announcement, subject to relevant approvals. However, given the length of the Agreement we expect that the Joint Venture will provide for Sanlam Kenya Plc, Allianz General Insurance Kenya and Jubilee General Insurance (which Allianz owns the majority stake in – 66.0%), to combine operations to grow their market share, asset base and bottom lines.
Section III: Industry Highlights and Challenges
Following the stable growth achieved by the insurance sector over the last decade, we expect the sector to experience sustained gradual growth on the back of an improving economy and subsequent growth in insurance premiums, which will enhance the capacity of the sector to sustain profitability.
In H1’2022, the Insurance Regulatory Authority (IRA), in line with their mandate of regulating and promoting development of the insurance sector approved 12 new or repackaged insurance products filed by various insurance companies. In the new products, 2 or 16.7% of the 12 products were bundled products, 3 or 25.0% of the 12 products were medical plans, 1 or 8.3% of the 12 products was micro insurance, 1 or 8.3% of the 12 products was non-linked insurance, 2 or 16.7% of the 12 products were life products, while miscellaneous accounted for 3 or 25.0% of the total new/repackaged products.
Industry Challenges:
- Cut throat competition: The local insurance sector is served by 56 insurance companies offering the same products, despite the low insurance penetration in the country. The battle for market share has seen some insurers resort to underhand methods of gaining competitive advantage, such as premium undercutting which involves secretly offering clients unrealistic low premiums in order to gain competitive advantage and to protect their market share. This is a major driver of underwriting losses suffered by the industry. The regulator retaliated plans to engage a consultant to relook at the industry pricing in March 2021, and the plans are still underway. This however comes on the back drop of muted insurance penetration that could be worsened by increased premiums pricing. Some industry players have argued price fixing will kill innovation and that the industry players should be left free to set their own prices,
- Fraud: Insurance fraud is an intentional deception committed by an applicant or policy holder for financial gain. Recent years have seen an increase in fraudulent claims especially in medical and motor insurance, with estimates indicating that one in every five medical claims are fraudulent mainly through inflated medical bills and hospitals making patients take unnecessary tests. In H1’2022, 74 fraud cases were reported, with fraudulent motor accident injury claims accounting for 25.7%, followed by forgery at 13.5%. The sector has been adopting the use of block chain and artificial intelligence to curb fraud within the sector. Key to note, most companies are also setting up their own assessment centres across the country so as to better determine the actual compensation,
- Increased loss ratios: Core insurance business performance has been dwindling, mainly attributable to the high loss ratios, which have deteriorated further, following the increase in claims outpacing increase in premiums. In H1’2022, general insurance claims increased by 14.5% to Kshs 37.1 bn from Kshs 32.4 bn in H1’2021. On the other hand, premiums for general insurance business grew by a slower 8.2% to Kshs 92.4 bn in H1’2022, from Kshs 85.4 bn in H1’2021. As a result, loss ratio for general insurers increased by 1.3% points to 68.1% in H1’2022, from 66.8% in H1’2021. Motor classes of insurance business incurred claims contributed 48.3% of total claims incurred compared to their business contribution of 28.1% of the total premium under general insurance business. However, the loss ratios under the long term business eased, to 64.2% from 72.2% in H1’2021, attributable to the 17.8% increase in premiums to Kshs 64.3 bn from Kshs 54.6 bn in H1’2021 that outpaced the 4.7% growth in net claims and policyholder’s benefits to Kshs 41.3 bn from Kshs 39.4 bn in H1’2021,
- Dwindling trust from insurance consumers: During H1’2022, IRA received 933 complaints, lodged against insurers by policyholders and beneficiaries, with general insurance accounting for a lion’s share of the complaints at 82.3%, while long term insurers recorded 17.7% complaints against them. The complaints range from insurance companies failing to settle claims and constant haggling over terms of insurance contracts, fueling the public mistrust against insurers and increasing insurance apathy in the country, and,
- Compliance with regulations: Regulation on capital requirements has made it difficult for smaller insurance companies to continue operating without increasing their capital or merging in order to raise their capital base. Additionally, some of global regulatory requirements such as implementation of IFRS 17 are costly due to the need to revamping and realigning accounting and actuarial systems.
Section IV: Performance of the Listed Insurance Sector in H1’2022
The table below highlights the performance of the listed insurance sector, showing the performance using several metrics, and the key take-outs of the performance.
|
Cytonn Report: Listed Insurance Companies H1’2022 Earnings and Growth Metrics |
||||||||
|
Insurance |
Core EPS Growth |
Net Premium growth |
Claims growth |
Loss Ratio |
Expense Ratio |
Combined Ratio |
ROaE |
ROaA |
|
Britam |
77.4% |
5.1% |
(1.5%) |
73.5% |
48.6% |
122.1% |
2.0% |
0.3% |
|
CIC |
45.0% |
20.5% |
2.0% |
68.8% |
49.6% |
118.4% |
4.7% |
0.8% |
|
Sanlam |
(1.4%) |
5.5% |
(9.1%) |
91.4% |
36.7% |
128.2% |
(34.4%) |
(0.8%) |
|
Jubilee Insurance |
(25.3%) |
(7.6%) |
(16.2%) |
99.4% |
33.7% |
133.0% |
8.0% |
2.2% |
|
Liberty |
(99.4%) |
6.1% |
(20.0%) |
60.6% |
66.9% |
127.5% |
0.02% |
0.004% |
|
*H1'2022 Weighted Average |
16.0% |
1.7% |
(8.7%) |
83.4% |
43.4% |
126.8% |
3.4% |
1.1% |
|
H1'2021 Weighted Average |
127.6% |
6.3% |
29.1% |
92.8% |
53.8% |
146.6% |
6.2% |
1.6% |
|
*Market cap weighted as at 14/10/2022 **Market cap weighted as at 30/09/2021 |
|
|||||||
The key take-outs from the above table include;
- Core EPS growth recorded a weighted growth of 16.0%, compared to a weighted growth of 127.6% in H1’2021. The decline in earnings was attributable to a slower premium growth during the period following a slower economic growth and deteriorated business environment, coupled with declines recorded in investment income,
- The premiums grew at a slower pace of 1.7% in H1’2022, compared to growth of 6.3% in H1’2021, while claims declined significantly at a rate of 8.7% in H1’2022, from the 29.1% growth recorded in H1’2021 on a weighted average basis,
- The loss ratio across the sector eased to 83.4% in H1’2022, from 92.8% in H1’2021,
- The expense ratio eased to 43.4% in H1’2022, from 53.8% in H1’2021, owing to a decline in operating expenses, a sign of increased efficiency,
- The insurance core business still remains unprofitable, despite the combined ratio improving to 126.8% in H1’2022, compared to 146.6% in H1’2021, and,
- On average, the insurance sector delivered a Return on Average Equity (ROaE) of 3.4%, a decline from a weighted Return on Average Equity of 6.2% in H1’2021.
Based on the Cytonn H1’2022 Insurance Report, we ranked insurance firms from a franchise value and from a future growth opportunity perspective with the former getting a weight of 40.0% and the latter a weight of 60.0%.
For the franchise value ranking, we included the earnings and growth metrics as well as the operating metrics shown in the table below in order to carry out a comprehensive review:
|
Cytonn Report: Listed Insurance Companies H1’2022 Franchise Value Score |
|||||||
|
Insurance Company |
Loss Ratio |
Expense Ratio |
Combined Ratio |
Return on Average Capital Employed |
Tangible Common Ratio |
Franchise Value Score |
Ranking |
|
CIC Group |
68.8% |
49.6% |
118.4% |
5.9% |
17.1% |
16 |
1 |
|
Liberty Holdings |
60.6% |
66.9% |
127.5% |
1.2% |
18.0% |
20 |
2 |
|
Jubilee Holdings |
99.4% |
33.7% |
133.0% |
9.7% |
26.1% |
21 |
3 |
|
Britam Holdings |
73.5% |
48.6% |
122.1% |
5.2% |
11.6% |
23 |
4 |
|
Sanlam Kenya |
91.4% |
36.7% |
128.2% |
(81.7%) |
1.0% |
25 |
5 |
|
Weighted Average H1'2022 |
83.4% |
43.4% |
126.8% |
3.9% |
18.3% |
|
|
The Intrinsic Valuation is computed through a combination of valuation techniques, with a weighting of 40.0% on Discounted Cash-flow Methods, 35.0% on Residual Income and 25.0% on Relative Valuation. The overall FY’2020 ranking is as shown in the table below:
|
Cytonn Report: Listed Insurance Companies H1’2022 Comprehensive Ranking |
|||||
|
Insurance |
Franchise Value Score |
Intrinsic Value Score |
Weighted Score |
H1’2022 Ranking |
FY'2021 Ranking |
|
Jubilee Holdings |
3 |
1 |
1.8 |
1 |
1 |
|
Liberty Holdings |
2 |
2 |
2.0 |
2 |
2 |
|
CIC Group |
1 |
4 |
2.8 |
3 |
5 |
|
Britam |
4 |
3 |
3.4 |
4 |
3 |
|
Sanlam Kenya |
5 |
5 |
5.0 |
5 |
4 |
Major Changes from the FY’2021 Ranking are;
- Jubilee Holdings maintained position 1 in H1’2022 as was in FY’2021 mainly due to the strong the franchise and intrinsic scores in H1’2022, driven by reduction in expense ratio to 33.7% in H1’2022, from 41.3% in FY’2021. As a result, the combined ratio also improved to 133.0% in H1’2022, from 149.7% in FY’2021,
- Liberty also maintained position 2 in H1’2022 as was in FY’2021 mainly due to improvement in the franchise score in H1’2022, driven by the improvement in the loss ratio to 60.6%, from 78.3% in FY’2021. The expense ratio also improved to 66.9%, from 79.3% in FY’2021,
- CIC Group improved to position 3 in H1’2022, from position 5 in FY’2021, on the back of improved franchise and intrinsic scores driven by improvement of its loss ratio to 68.8% in H1’2022, from 71.6% in FY’2021, and combined ratio to 118.4% in H1’2022, from 123.8% in FY’2021,
- Britam Holdings declined to position 4 in H1’2022 from position 3 in FY’2021 driven by a weak franchise score attributable to the deterioration in the loss ratio to 73.5%, from 66.9%. However, the combined ratio improved to 151.5% from the 164.2% in FY’2021, and,
- Sanlam declined to position 5 in H1’2022 from position 4 in FY’2021 mainly due to deterioration in both the franchise score and intrinsic value score.
Section V: Conclusion & Outlook of the Insurance Sector
In H1’2022, the insurance sector continued to suffer from low penetration rates which has been worsened by deteriorated business environment emanating from rising interest rates, increased inflationary pressures arising from geopolitical instability caused by Russian-Ukrainian conflict. As such, the level of disposable income has reduced amongst the citizens. However, the sector continues to undergo transition where traditional models have been disrupted, mainly on the digital transformation, innovation and regulation front, which have positively impacted the outlook. Going forward, we expect a steady growth in premiums as underwriters come up with products suited to the planning for unforeseen events like COVID-19 and global conflicts interfering with business operations. Key to note, the insurance sector should maintain the culture of innovation achieved during the pandemic period while maintaining the customer centricity as the main focus of the sector’s operating model. Insurance companies should also widen their historical focus from risk and cost minimization to venture into high levels of risk taking and experimentation which will consequently optimize the ongoing innovation, lead to differentiation among competitors and improve profit. As such, we are of the opinion that the insurance sector will have to perform delicate balancing acts to ensure that they remain profitable. The industry has a lot it can do in order to register considerable growth and improve the level of penetration in the country to the 2021 world average of 7.2%, some of this include:
- Improve efficiency – The underwriters should develop strategies to further lower the high expense ratios which are deteriorating the growth of premiums. In H1’2022, the weighted average expense ratio remained elevated despite easing to 43.4%, from 53.8% in H1’2021, owing to a decline in operating expenses, a sign of increased efficiency. This can be achieved through the optimization of operating models and leverage on digitalization to fast-track operations and minimize costs,
- Portfolio optimization – It is prudent for insurance firms to optimize their portfolio by re-evaluating their products and services to sustain the sector’s recovery and realize profitability. Insurers should focus on their core and profitable offerings and dispose non-core offerings, this is achievable through sale of business units considered unprofitable. An example of such is Jubilee which recently received Kshs 270.0 mn from the sale of a 52.4% stake in its Mauritian subsidiary to insurance firm Allianz SE. Going forward, the portfolio optimization will extend to lowering stake in non-profitable subsidiaries and associates and affect underwriters’ products as insurers extend concentration to profitable products,
- Investment diversification – The underwriters should focus more on investment diversification through avenues such as pension schemes, unit trusts, fund management and investment advisories to improve profits and minimize losses. This shift is necessary as evidenced by the increasing combined ratios that have seen insurers suffer losses in their core business, with increase in underwriting expenses and claims outpacing the increase in premiums. Additionally, we expect insurers to continue to look into non-traditional asset classes such as infrastructure. An example is Jubilee Holdings investment in associates such as Bujagali hydropower plant in Uganda, PDM Holdings Ltd and IPS Cable Systems Ltd whose share of profits has been boosting its bottom-line,
- Insurance awareness campaigns – Knowledge deficit on insurance products and its importance continues to persist, massively contributing to the low insurance penetration. Insurance is still largely assumed as regulatory compliance, rather than a necessity. The regulators, insurers and other stakeholders should enhance insurance awareness campaigns to increase understanding of insurance products. According to a survey commissioned by the Association of Kenya insurers (AKI), the 2nd largest contributor to low insurance uptake at 27.0%, is lack of knowledge of the various insurance products and their benefits. As such, there is a lot of headroom for insurers, to educate, repackage, and tailor their products to different potential clients,
- Partnerships and alternative distribution channels – Going forward, we expect underwriters to continue with partnerships and offering alternative distribution channels. This can be realized by linking with other financial services players including Fund managers who have ventured into offering insurance linked products as well as the current bancassurance relationship with Banks. Insurance industry can also take advantage of the penetration of bank products to also push their products. Integration of mobile money payments to allow for policy payments is also expected to continue because of convenience which it provides and also mobile phone penetration in the country is high therefore insurance companies will want to leverage this to improve penetration,
- Technology and innovation – The sector will continue experiencing enhanced technological tools and innovations such as Artificial Intelligence and real time data in hyper personalization of insurance marketing so as to use customer information to tailor content, products and services in line with customer preferences. With such tools, insurers will effectively respond to changes in buying behaviours and tailoring products and services to the needs of the customers to ensure their loyalty hence high retention. Firms will also adopt increased inclusion of advancements like smart contracts through block chain that would help eliminate processing costs, reduce insurance fraud and fictitious claims and improve customer satisfaction through efficient claims processing, and,
- Regulations - We also anticipate increased regulation in the sector from the regulatory body and other international players to ensure its solvency and sustainability. Insurers have to adjust their insurance contract recognition methods in preparation to the coming into effect of IFRS 9 and IFRS 17 in January of 2023 or earlier. The push by the regulator to have the desired capital adequacy levels will likely see more consolidations as insurers try to meet the capital requirements, especially for the small firms. Additionally, there are increased efforts by regulators, governments and policymakers to ensure that Environmental, Social and Governance (ESG) regulations become a necessity in the insurance sector. As such, insurers will have no option but to incorporate ESG and as such, services and products offered by insurers should ensure environmental sustainability, ethics and regulatory compliance and data privacy, and ensuring social responsibility.
To read the H1’2022 Insurance Report, please download it here
Disclaimer: The views expressed in this publication are those of the writers where particulars are not warranted. This publication is meant for general information only and is not a warranty, representation, advice or solicitation of any nature. Readers are advised in all circumstances to seek the advice of a registered investment advisor.

- Talk to us
- Kenya
- P.O Box 20695 - 00200, Nairobi, Kenya
- Cell +254709101200
- Tel +254709101200
- WhatsApp +254741676635
- United States
- +254709101200
- DOWNLOAD OUR APP
-


- Kenya
- 8th Floor, Pinetree Plaza, Kaburu Drive, Ngong Road, Nairobi, Kenya
- USA
- Suite 1150, 1775 Eye Street NW, USA, Washington DC 20006, USA
- Investments
- High Yield
- Private Equity
- Real Estate
- Real Estate
- RiverRun Estates
- Cytonn Towers
- The Ridge
- Taraji Heights
- The Alma