Kenya Mortgage Refinance Company (KMRC) Update, & Cytonn Weekly #33/2021.
By Research Team, Aug 22, 2021
Executive Summary
Fixed Income
During the week, T-bills were oversubscribed, with the overall subscription rate coming in at 118.2%, an increase from the 29.3% recorded the previous week attributable to the high liquidity in the money markets; the dramatic increase in subscription was due to the closure of the three bonds offered earlier in the month. The 91-day paper recorded the highest subscription rate, receiving bids worth Kshs 12.1 bn against the amounts offered Kshs 4.0 bn, translating to a subscription rate of 303.6%, a significant increase from the 70.3% recorded the previous week. Investors’ continued interest in the 91-day paper during the week is mainly attributable to the paper’s higher return on a risk adjusted basis compared to the rest. The subscription rate for the 182-day paper increased to 152.3%, from 31.3% recorded the previous week, while the subscription rate for the 364-day paper also declined to 10.0%, from 10.9% recorded the previous week. The yields on the 91-day and 364-day papers increased by 7.2 bps and 0.2 bps to 6.6% and 7.4%, respectively, while the yield on the 182-day paper declined marginally by 1.3 bps to 7.1%.
During the week, the National Treasury gazetted the revenue and net expenditures for the first month of FY’2021/2022, ending 31st July 2021, highlighting that the total revenue collected as at the end of July 2021 amounted to Kshs 267.1 bn, equivalent to 8.4% of the FY’2021/2022 target of Kshs 3.2 tn while the total expenditure amounted to Kshs 170.4 bn, equivalent to 5.3% of the budget of Kshs 3.2 tn.
Additionally, the government opened bidding for a new infrastructure bond, IFB1/2021/21, whose offer period ends on 7th September 2021.
Equities
During the week, the equities market was on an upward trajectory, with NASI and NSE 20 both gaining by 2.8%, while NSE 25 gained by 2.7%, taking their YTD performance to gains of 22.6%, 18.9% and 7.7% for NASI, NSE 25 and NSE 20, respectively. The equities market performance was mainly driven by gains recorded by stocks such as NCBA, ABSA, BAT and Safaricom, which gained by 6.7%, 3.8%, 3.5% and 3.4%, respectively. The gains were however weighed down by a 0.7% decline recorded by Co-operative Bank.
During the week, KCB Group, Equity Group and Co-operative Bank released their H1’2021 financial results, highlighting a 101.9%, 97.7% and 2.3% increase in their core earnings per share, respectively. As of now, four out of the ten listed banks have now released their H1’2021 results.
Real Estate
During the week, the Kenya National Bureau of Statistics (KNBS) released the Leading Economic Indicators June 2021 indicating that the international arrivals through Jomo Kenyatta International Airport (JKIA) and Moi International Airport (MIA) registered an improvement from 1,177 visitors in Q2’2020 to 113,307 in Q2’2021. Cement consumption registered a 26.9% increase to 3.3 mn metric tonnes between January and May 2021 from 2.6 mn metric tonnes in the same period in 2020. Also, Hass Consult, a real estate development and consulting company, released the Hass Consult Q2’2021 House Price Index highlighting that house prices realized an overall 0.1% q/q and 1.7% y/y price declines. Hass Consult also released the Hass Consult Q2’2021 Land Price Index highlighting that land prices within Nairobi’s suburbs and satellite towns registered a 0.3% q/q and 1.1% q/q improvement. In the hospitality sector, the Ministry of Tourism through the Tourism Fund Corporation announced plans to engage in Public Private Partnership (PPP) deal to complete the construction of Crab Utalii Hotel worth Kshs 5.9 bn, on a 20.0 are piece of land in Vipingo Kilifi County. In the infrastructure sector, the national government through the Kenya Rural Roads Authority (KeRRA) began the tarmacking of the 55.0 Km Msau-Mbale-Werugha-Mgange-Bura road at a cost of Kshs 2.0 bn in Taita Taveta County. Additionally, the Kenya Rural Roads Authority (KeRRA) announced plans to construct the 78.0 Km Kamukunji-Kisanana-Kipkitur-Lake Bogoria road worth Kshs 3.7 bn in Baringo County through Intex Construction Limited.
Focus of the Week
The Kenya Mortgage Refinance Company (KMRC) is a treasury backed financial institution in Kenya that specializes in lending to Primary Mortgage Lenders (PMLs) such as banks, microfinance institutions and Savings and Credit Cooperatives (SACCOs) for onward lending to potential home owners. It was established in August 2018 and began its operations in September 2020 after licensing by the Central Bank of Kenya (CBK), in an aim to increase home ownership through issuance of affordable mortgages. This week, we seek to do a follow up of the company and provide an update a year since operationalization, as well as benchmark with a more established refinance company.
Investment Updates:
- Weekly Rates:
- Cytonn Money Market Fund closed the week at a yield of 10.74%. To invest, just dial *809#;
-
- Cytonn High Yield Fund closed the week at a yield of 15.55% p.a. To invest, email us at sales@cytonn.com and to withdraw the interest you just dial *809#;
- We continue to offer Wealth Management Training daily, from 9:00 am to 11:00 am, through our Cytonn Foundation. The training aims to grow financial literacy among the general public. To register for any of our Wealth Management Trainings, click here;
- If interested in our Private Wealth Management Training for your employees or investment group, please get in touch with us through wmt@cytonn.com;
- Cytonn Insurance Agency acts as an intermediary for those looking to secure their assets and loved ones’ future through insurance namely; Motor, Medical, Life, Property, WIBA, Credit and Fire and Burglary insurance covers. For assistance, get in touch with us through insuranceagency@cytonn.com;
- Cytonnaire Savings and Credit Co-operative Society Limited (SACCO) provides a savings and investments avenue to help you in your financial planning journey. To enjoy competitive investment returns, kindly get in touch with us through clientservices@cytonn.com;
Real Estate Updates:
- For an exclusive tour of Cytonn’s real estate developments, visit: Sharp Investor's Tour, and for more information, email us at sales@cytonn.com;
- Phase 3 of The Alma is now ready for occupation. To rent please email properties@cytonn.com;
- We have 8 investment-ready projects, offering attractive development and buyer targeted returns. See further details here: Summary of Investment-ready Projects;
- For recent news about the group, see our news section here.
Hospitality Updates:
- We currently have promotions for Staycations, visit cysuites.com/offers for details or email us at sales@cysuites.com;
- Share a meal with a friend during the Sunday Brunch at The Hive Restaurant at Cysuites Hotel and Apartment. Every Sunday from 11.00 AM to 4.00 PM at a price of Kshs 2,500 for Adults and Kshs 1,500 for children under 12 years;
Money Markets, T-Bills & T-Bonds Primary Auction:
During the week, T-bills were oversubscribed, with the overall subscription rate coming in at 118.2%, an increase from the 29.3% recorded the previous week attributable to the high liquidity in the money markets; the dramatic increase in subscription was due to the closure of the three bonds offered earlier in the month. The 91-day paper recorded the highest subscription rate, receiving bids worth Kshs 12.1 bn against the offered Kshs 4.0 bn, translating to a subscription rate of 303.6%, a significant increase from the 70.3% recorded the previous week. Investors’ continued interest in the 91-day paper during the week is mainly attributable to the paper’s higher return on a risk adjusted basis. The subscription rate for the 182-day paper increased to 152.3%, from 31.3% recorded the previous week, while the subscription rate for the 364-day paper also declined to 10.0%, from 10.9% recorded the previous week. The yields on the 91-day and 364-day papers increased by 7.2 bps and 0.2 bps to 6.6% and 7.4%, respectively, while the yield on the 182-day paper declined marginally by 1.3 bps to 7.1%. The government continued to take advantage of the low yields and the high liquidity in the market by accepting 100.0% of the Kshs 28.4 bn worth of bids received.
In the primary bonds auction, the government is seeking to raise Kshs 75.0 bn for budgetary support by issuing a new infrastructure bond, IFB1/2021/21. The coupon will be market determined with the offer period ending on 7th September 2021. We expect the bond to be oversubscribed, similar to the primary bond offers earlier this month, due to the prevailing high liquidity in the market and tax free nature of the bond. We recommended bidding of the bond at 12.9%-13.2%.
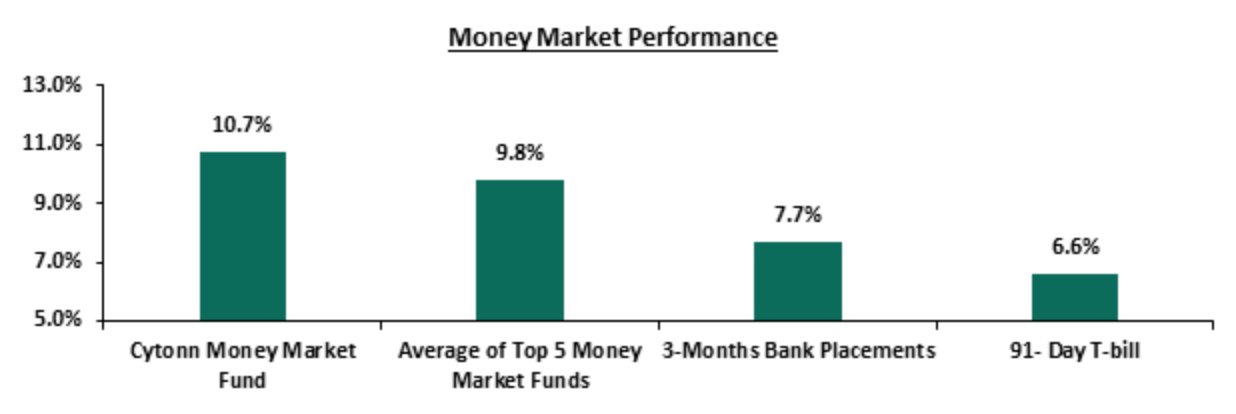
In the money markets, 3-month bank placements ended the week at 7.7% (based on what we have been offered by various banks), while the yield on the 91-day T-bill increased by 7.2 bps to 6.6%. The average yield of the Top 5 Money Market Funds remained unchanged at 9.8%, similar to what was recorded the previous week. The yield on the Cytonn Money Market Fund increased by 0.2% points to 10.7%, from 10.5% recorded last week.
The table below shows the Money Market Fund Yields for Kenyan Fund Managers as published on 20th August 2021:
|
Money Market Fund Yield for Fund Managers as published on 20th August 2021 |
|||
|
Rank |
Fund Manager |
Daily Yield |
Effective Annual Rate |
|
1 |
Cytonn Money Market Fund |
10.20% |
10.74% |
|
2 |
Nabo Africa Money Market Fund |
9.52% |
9.95% |
|
3 |
Zimele Money Market Fund |
9.56% |
9.91% |
|
4 |
Madison Money Market Fund |
8.89% |
9.29% |
|
5 |
Sanlam Money Market Fund |
8.76% |
9.16% |
|
6 |
CIC Money Market Fund |
8.68% |
8.98% |
|
7 |
Apollo Money Market Fund |
9.10% |
8.95% |
|
8 |
Dry Associates Money Market Fund |
8.42% |
8.75% |
|
9 |
GenCapHela Imara Money Market Fund |
8.31% |
8.66% |
|
10 |
Co-op Money Market Fund |
8.27% |
8.62% |
|
11 |
Orient Kasha Money Market Fund |
8.28% |
8.60% |
|
12 |
British-American Money Market Fund |
8.18% |
8.49% |
|
13 |
ICEA Lion Money Market Fund |
8.01% |
8.33% |
|
14 |
NCBA Money Market Fund |
8.00% |
8.30% |
|
15 |
Old Mutual Money Market Fund |
6.93% |
7.16% |
|
16 |
AA Kenya Shillings Fund |
6.08% |
6.25% |
Liquidity:
During the week, liquidity in the money markets tightened, with the average interbank rate increasing marginally by 0.1% points to 2.9% from 2.8% recorded the previous week, partly attributable to settlements of government securities, including the three primary bonds that closed during the previous week and the beginning of the monthly CRR cycle. The average interbank volumes decreased by 26.3% to Kshs 9.6 bn, from Kshs 13.1 bn recorded the previous week.
Kenya Eurobonds:
During the week, the yields on Eurobonds remained relatively unchanged, with the yields on the 10-year bond issued in 2014, the 10-year bond issued in 2018, 30-year bond issued in 2018, the 12-year bond issued in 2019, and, the 12-year bond issued in 2021 remaining unchanged at 3.2%, 5.3% 7.3%, 6.2%, and 6.1%, respectively. On the other hand, the yield on the 7-year bond issued in 2019 increased by 0.1% points to 4.8%. Below is a summary of the performance:
|
Kenya Eurobond Performance |
||||||
|
|
2014 |
2018 |
2019 |
2021 |
||
|
Date |
10-year issue |
10-year issue |
30-year issue |
7-year issue |
12-year issue |
12-year issue |
|
31-Dec-2020 |
3.9% |
5.2% |
7.0% |
4.9% |
5.9% |
- |
|
30-Jul-21 |
3.3% |
5.2% |
7.3% |
4.6% |
6.2% |
6.2% |
|
13-Aug-21 |
3.1% |
5.3% |
7.3% |
4.8% |
6.2% |
6.1% |
|
16-Aug-21 |
3.1% |
5.3% |
7.3% |
4.8% |
6.2% |
6.1% |
|
17-Aug-21 |
3.1% |
5.3% |
7.3% |
4.8% |
6.2% |
6.1% |
|
18-Aug-21 |
3.1% |
5.3% |
7.3% |
4.8% |
6.2% |
6.1% |
|
19-Aug-21 |
3.2% |
5.3% |
7.3% |
4.8% |
6.2% |
6.2% |
|
20-Aug-21 |
3.1% |
5.3% |
7.3% |
4.8% |
6.2% |
6.1% |
|
Weekly Change |
0.0% |
0.0% |
0.0% |
0.1% |
0.0% |
0.0% |
|
MTD Change |
(0.2%) |
(0.1%) |
0.0% |
0.0% |
0.0% |
0.0% |
|
YTD Change |
(0.8%) |
0.1% |
0.3% |
0.0% |
0.3% |
- |
Source: Reuters
Kenya Shilling:
During the week, the Kenyan shilling depreciated by 0.3% against the US dollar to close the week at Kshs 109.5, from Kshs 109.2 recorded the previous week, mainly attributable to increased dollar demand from commodity and energy sector importers outweighing the supply of dollars from exporters. On a YTD basis, the shilling has depreciated by 0.3% against the dollar, in comparison to the 7.7% depreciation recorded in 2020. We expect the shilling to remain under pressure for the remainder of 2021 as a result of:
- Rising uncertainties in the global market due to the Coronavirus pandemic, which has seen investors continue to prefer holding their investments in dollars and other hard currencies and commodities,
- The widened current account position which increased by 0.2% points to 5.4% of GDP in the 12 months to June 2021 from 5.2% of GDP for a similar period in 2020, and,
- Demand from energy importers as they beef up their hard currency positions in the prevailing elevated global oil prices.
The shilling is however expected to be supported by:
- The Forex reserves, currently at USD 9.2 bn (equivalent to 5.6 months of import cover), which is above the statutory requirement of maintaining at least 4.0 months of import cover, and the EAC region’s convergence criteria of 4.5-months of import cover, and,
- Improving diaspora remittances evidenced by a 6.0% y/y increase to USD 305.9 mn in June 2021, from USD 288.5 mn recorded over the same period in 2020, which has continued to cushion the shilling against further depreciation.
Weekly Highlight
- FY’2021/2022 Budget Outturn
During the week, the National Treasury gazetted the revenue and net expenditures for the first month of FY’2021/2022, closing on 31st July 2021. Below is a summary of what was gazetted:
|
FY'2021/2022 Budget Outturn - As at 30th July 2021 |
|||
|
Item |
12-months Original Estimates |
Actual Receipts/Expenditure |
Percentage Achieved |
|
Opening Balance |
|
21.3 |
|
|
Tax Revenue |
1,707.4 |
121.8 |
7.1% |
|
Non-Tax Revenue |
68.2 |
0.3 |
0.5% |
|
External Loans & Grants |
379.7 |
0.0 |
0.0% |
|
Domestic Borrowings |
1,008.4 |
119.7 |
11.9% |
|
Other Domestic Financing |
29.3 |
4.0 |
13.6% |
|
Total Revenue |
3,193.0 |
267.1 |
8.4% |
|
Recurrent Exchequer issues |
1,106.6 |
71.2 |
6.4% |
|
CFS Exchequer Issues |
1,327.2 |
99.2 |
7.5% |
|
Development Expenditure |
389.2 |
0.0 |
0.0% |
|
County Governments + Contingencies |
370.0 |
0.0 |
0.0% |
|
Total Expenditure |
3,193.0 |
170.4 |
5.3% |
|
Fiscal Deficit excluding Grants |
(379.7) |
96.7 |
(25.5%) |
|
Total Borrowing |
1,388.1 |
119.7 |
8.6% |
|
Amounts in Kshs bn unless stated otherwise |
|||
The key take-outs from the report include:
- Total revenue collected as at the end of July 2021 amounted to Kshs 267.1 bn, equivalent to 8.4% of the FY’2021/2022 target of Kshs 3.2 tn and is 100.4% of the prorated monthly amount. Tax revenues amounted to Kshs 121.8 bn, equivalent to 7.1% of the FY’2021/2022 target of Kshs 1.7 tn and 100.4% of its prorated target. Key to note, the opening balance includes Kshs 20.7 bn held in the Sovereign Bond special account,
- The total expenditure amounted to Kshs 170.4 bn, equivalent to 5.3% of the budget of Kshs 3.2 tn and 64.0% of the monthly prorated amount. Additionally, the net disbursement to recurrent expenditure came in at Kshs 71.2 bn, which is 6.4% of its FY’2020/2021 target, and 77.2% of its pro-rated projected. The absorption rate is much lower with the largest culprit being the development expenditure most probably as the ministries work on the disbursement procedures. The low absorption rate is likely to slow the ongoing economic recovery,
- Consolidated Fund Services (CFS) Exchequer issues lagged behind the prorated target of Kshs 110.6 bn after amounting to Kshs 99.2 bn, equivalent to 89.7% of the target. The cumulative public debt servicing cost amounted to Kshs 0.1 tn which is 7.6% of the FY’2021/2022 estimates of Kshs 1.2 tn, and,
- Total borrowings as at the end of July 2021 amounted to Kshs 119.7 bn, equivalent to 8.6% of the FY’2021/2022 target of Kshs 1.4 tn. The domestic borrowing target of Kshs 1.0 tn comprised of adjusted net domestic borrowings of Kshs 661.6 bn and Internal Debt Redemptions (Roll-overs) of Kshs 346.8 bn. There are no external loans and grants in the FY’2021/2022 so far.
The positive revenue performance for the first month of the current fiscal year does not come as a surprise given that KRA registered a revenue outperformance in the first five months of 2021 which averaged at Kshs 128.0 bn monthly. We expect a continued revenue outperformance in the coming months partly attributable to the tax changes introduced in 2021, as well as the expected economic recovery. Recovery from the negative effects of the pandemic will require government spending so as to revive the economy, even as the Delta variant continues to increase the possibility of a fourth wave of the pandemic and further restrictions. Additionally, we expect that the government will continue funding the fiscal deficit by borrowing domestically mainly supported by a stable interest rate environment and the prevailing high liquidity in the money markets.
Rates in the fixed income market have remained relatively stable due to the high liquidity in the money markets, coupled with the discipline by the government as they reject expensive bids. The government is 62.6% ahead its prorated borrowing target of Kshs 101.3 bn having borrowed Kshs 164.7 bn in FY’2021/2022. We expect a gradual economic recovery going into FY’2021/2022 as evidenced by KRA collecting Kshs 1.7 tn in FY’2020/2021, a 3.9% increase from Kshs 1.6 tn collected in the prior fiscal year. However, despite the projected high budget deficit of 7.5% and the lower credit rating from S&P Global to 'B' from 'B+', we believe that the monetary support from the IMF and World Bank will mean that the interest rate environment may stabilize since the government will not be desperate for cash.
Markets Performance
During the week, the equities market was on an upward trajectory, with NASI and NSE 20 both gaining by 2.8%, while NSE 25 gained by 2.7%, taking their YTD performance to gains of 22.6%, 18.9% and 7.7% for NASI, NSE 25 and NSE 20, respectively. The equities market performance was mainly driven by gains recorded by stocks such as NCBA, ABSA, BAT and Safaricom, which gained by 6.7%, 3.8%, 3.5% and 3.4%, respectively. The gains were however weighed down by a 0.7% decline recorded by Co-operative Bank.
During the week, equities turnover increased by 85.2% to USD 41.7 mn, from USD 22.5 mn recorded the previous week, taking the YTD turnover to USD 804.9 mn. Foreign investors remained net buyers, with a net buying position of USD 7.7 mn, from a net buying position of USD 6.2 mn recorded the previous week, taking the YTD net selling position to USD 14.5 mn.
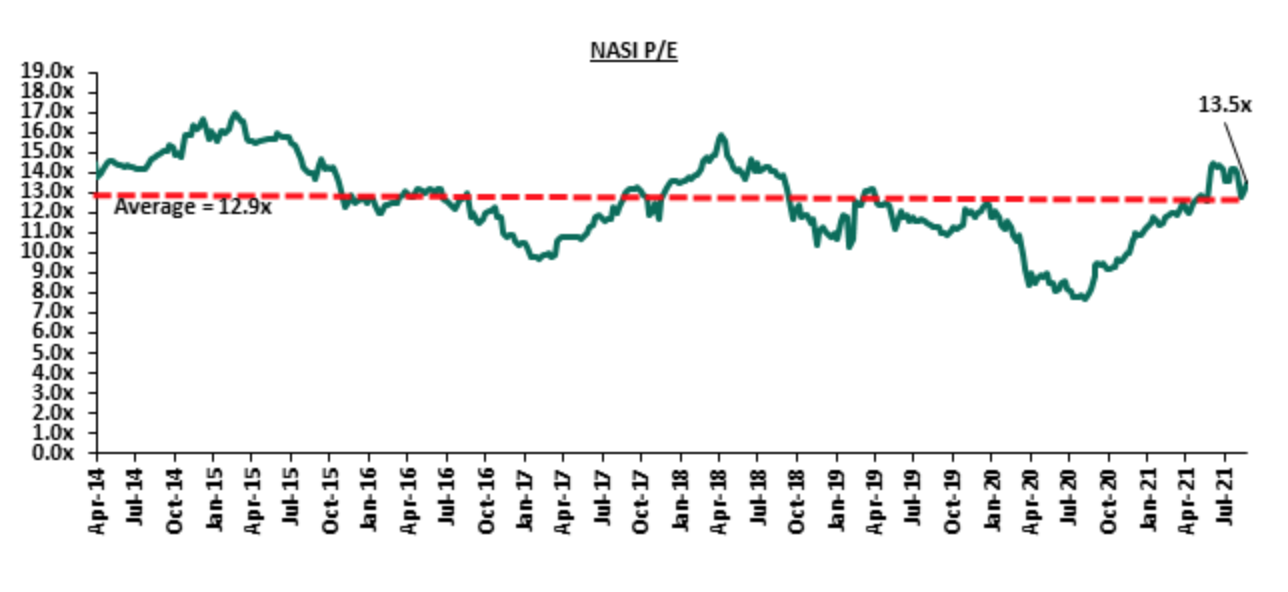
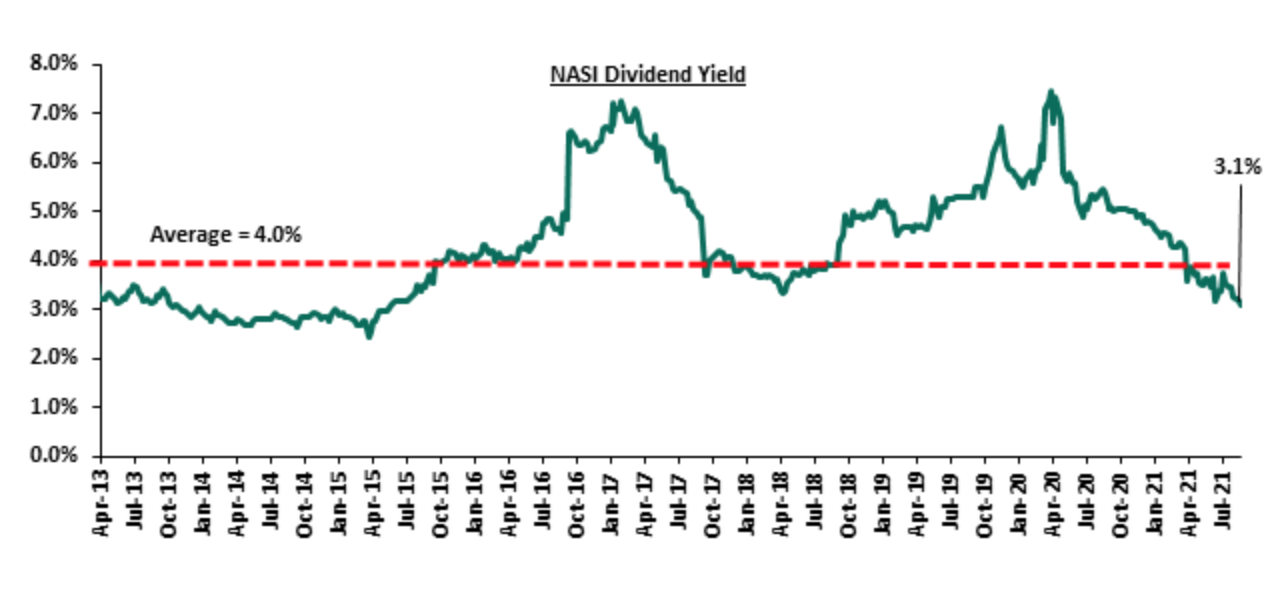
The market is currently trading at a price to earnings ratio (P/E) of 13.5x, 4.4% above the historical average of 12.9x, and a dividend yield of 3.1%, 0.9% points below the historical average of 4.0%. Key to note, NASI’s PEG ratio currently stands at 1.5x, an indication that the market is trading at a premium to its future earnings growth. Basically, a PEG ratio greater than 1.0x indicates the market may be overvalued while a PEG ratio less than 1.0x indicates that the market is undervalued. Excluding Safaricom, which is currently 61.2% of the market, the market is trading at a P/E ratio of 12.4x and a PEG ratio of 1.4x. The current P/E valuation of 13.5x is 75.2% above the most recent trough valuation of 7.7x experienced in the first week of August 2020. The charts below indicate the historical P/E and dividend yields of the market.
Earnings Releases
During the week, Equity Group, Cooperative Bank and KCB Group released their H1’2021 financial results. Below is a summary of their performance;
- Equity Group
|
Equity Group H1’2021 Key Highlights |
|||
|
Balance Sheet |
|||
|
Balance Sheet items |
H1’2020 (Kshs bn) |
H1’2021 (Kshs bn) |
y/y change |
|
Government Securities |
181.2 |
202.6 |
11.8% |
|
Net Loans and Advances |
391.6 |
504.8 |
28.9% |
|
Total Assets |
746.5 |
1,119.7 |
50.0% |
|
Customer Deposits |
543.9 |
819.7 |
50.7% |
|
Deposits Per Branch |
1.8 |
2.4 |
34.2% |
|
Total Liabilities |
623.1 |
964.7 |
54.8% |
|
Shareholders’ Funds |
122.2 |
148.2 |
21.2% |
|
Income Statement |
|||
|
Income Statement Items |
H1’2020 (Kshs bn) |
H1’2021 (Kshs bn) |
y/y change |
|
Net Interest Income |
24.6 |
31.2 |
26.5% |
|
Net non-Interest Income |
14.4 |
20.8 |
44.2% |
|
Total Operating income |
39.0 |
51.9 |
33.0% |
|
Loan Loss provision |
(8.0) |
(2.9) |
(63.7%) |
|
Total Operating expenses |
(27.1) |
(28.1) |
3.8% |
|
Profit before tax |
12.0 |
23.8 |
99.0% |
|
Profit after tax |
9.1 |
17.9 |
97.7% |
|
Core EPS |
2.4 |
4.8 |
97.7% |
|
Key Ratios |
|||
|
Ratios |
H1’2020 |
H1’2021 |
% point change |
|
Yield from interest-earning assets |
10.8% |
10.3% |
(0.5%) |
|
Cost of funding |
2.9% |
2.9% |
0.0% |
|
Net Interest Margin |
8.1% |
7.6% |
(0.5%) |
|
Non- Performing Loans (NPL) Ratio |
11.0% |
11.4% |
0.4% |
|
NPL Coverage |
48.5% |
63.2% |
14.7% |
|
Cost to Income with LLP |
69.3% |
54.1% |
(15.2%) |
|
Loan to Deposit Ratio |
72.0% |
61.6% |
(10.4%) |
|
Return on Average Assets |
2.8% |
3.1% |
0.3% |
|
Return on Average Equity |
17.5% |
21.4% |
3.9% |
|
Equity to Assets |
16.4% |
13.2% |
(3.2%) |
|
Capital Adequacy Ratios |
|||
|
Ratios |
H1'2020 |
H1'2021 |
% point change |
|
Core Capital/Total Liabilities |
20.3% |
15.8% |
20.3% |
|
Minimum Statutory ratio |
8.0% |
8.0% |
8.0% |
|
Excess |
12.3% |
7.8% |
12.3% |
|
Core Capital/Total Risk Weighted Assets |
16.9% |
14.0% |
16.9% |
|
Minimum Statutory ratio |
10.5% |
10.5% |
10.5% |
|
Excess |
6.4% |
3.5% |
6.4% |
|
Total Capital/Total Risk Weighted Assets |
20.2% |
17.5% |
20.2% |
|
Minimum Statutory ratio |
14.5% |
14.5% |
14.5% |
|
Excess |
5.7% |
3.0% |
5.7% |
Key take-outs from the earnings release include;
- Core earnings per share increased by 97.7% to Kshs 4.8 in H1’2021, from Kshs 2.4 recorded in H1’2020, better than our projections of a 65.5% increase to Kshs 4.0. The performance was driven by a 33.0% growth in total operating income to Kshs 51.9 bn, outpacing the 3.8% growth in total operating expenses to Kshs 28.1 bn, from Kshs 27.1 bn in H1’2020,
- Net Interest income increased by 26.5% to Kshs 31.2 bn, from Kshs 24.6 bn in H1’2020, driven by a 29.8% increase in interest income on loans and advances to Kshs 29.2 bn, from Kshs 22.5 bn in H1’2020, coupled with a 30.2% increase in interest income from government securities to Kshs 12.7 bn, from Kshs 9.8 bn in H1’2020,
- The Yield on Interest-Earning Assets, however, declined to 10.3%, from 10.8% in H1’2020, as the average interest-earning assets grew faster, by 36.1% to Kshs 815.2 bn, from Kshs 599.1 bn in H1’2020 compared to the 29.1% increase in trailing interest income. Trailing Interest Income refers to the performance of the interest income for the past 12 consecutive months,
- Interest expense rose by 42.0% to Kshs 11.6 bn, from Kshs 8.2 bn in H1’2020, following a 51.1% increase in interest expense on customer deposits to Kshs 9.3 bn, from Kshs 6.1 bn in H1’2020, coupled with a 19.5% increase in other interest expenses to Kshs 2.1 bn, from Kshs 1.8 bn in H1’2020. The rise in interest expense was however mitigated by a 17.6% decline in interest expense on deposits and placements from banking institutions to Kshs 0.2 bn, from Kshs 0.3 bn in H1’2020. Cost of funds, on the other hand, declined marginally by 0.03% points to 2.89%, from 2.92% in H1’2020, owing to the faster 36.5% growth in average interest-bearing liabilities, which outpaced the 35.3% growth in the trailing interest expense. Trailing interest expense refers to the performance of the interest expense for the past 12 consecutive months,
- Net Interest Margin (NIM) declined to 7.6% from 8.1% in H1’2020, attributable to the 36.1% growth in average interest-earning assets, which outpaced the 27.1% growth of trailing Net Interest Income (NII),
- Total operating expenses grew by 3.8% to Kshs 28.1 bn in H1’2021, from Kshs 27.1 bn recorded in H1’2020, mainly driven by staff costs, which increased by 26.8% to Kshs 8.5 bn in H1’2021 from Kshs 6.7 bn recorded in H1’2020, coupled with an increase in other operating expenses of 35.3% to Kshs 16.7 bn in H1’2021 from Kshs 12.3 bn recorded in H1’2020. The rise in total operating expenses was however mitigated by a 63.7% decline in Loans Loss Provision to Kshs 2.9 bn in H1’2021 from Kshs 8.0 bn recorded in H1’2020. The reduced provision level was on the back of increased business activities during the half driven by the gradual recovery of the operating environment,
- The balance sheet recorded an expansion as total assets increased by 50.0% to Kshs 1.1 tn in H1’2021, from Kshs 0.7 tn recorded in H1’2020. This growth was largely driven by the 28.9% growth of the loan book to Kshs 504.8 bn, from Kshs 391.6 bn recorded in H1’2020, coupled with an 11.8% growth in government securities to Kshs 202.6 bn in H1’2021, from Kshs 181.2 bn in H1’2020. The remarkable expansion in the balance sheet is also partly attributable to the 66.5% stake acquisition of Congolese lender, Banque Commerciale Du Congo (BCDC) in August 2020. BCDC contributed Kshs 328.3 bn worth of assets in H1’2021 to the Group,
- Total liabilities rose by 54.8% to Kshs 964.7 bn, from Kshs 623.1 bn in H1’2020, driven by a 50.7% increase in customer deposits to Kshs 819.7 bn, from Kshs 543.9 bn in H1’2020. Key to note, the strong growth in customer deposits is mainly attributable to the acquisition of BCDC, with the subsidiary contributing Kshs 274.8 bn to the total deposits,
- Deposits per branch increased by 34.2% to Kshs 2.4 bn, from Kshs 1.8 bn in H1’2020, with the number of branches increasing by 37 to 337 branches in H1’2021, from 300 in H1’2020, with Equity BCDC contributing 26 of the additional branches,
- Gross Non-Performing Loans (NPLs) increased by 36.5% to Kshs 62.2 bn in H1’2021, from Kshs 45.6 bn recorded in H1’2020. The NPL ratio rose to 11.4% in H1’2021, from 11.0% recorded in H1’2020, attributable to the faster 36.5% growth in Gross Non-Performing Loans (NPLs), compared to the 31.5% increase in gross loans,
- With the general Loan Loss Provisions increasing by 90.0% to Kshs 31.0 bn, from Kshs 16.3 bn in H1’2020, higher than the 36.5% rise in the Gross Non-Performing Loans, the NPL coverage improved to 63.2%, from 48.5% in H1’2020, an indication of sufficient provisioning, and,
- Equity Group is currently sufficiently capitalized with a core capital to risk-weighted assets ratio of 14.0%, 3.5% points above the minimum statutory requirement. In addition, the total capital to risk-weighted assets ratio was 17.5%, exceeding the minimum statutory requirement by 3.0% points. Adjusting for IFRS 9, the core capital to risk-weighted assets stood at 14.1% while total capital to risk-weighted assets came in at 17.6%.
For a comprehensive analysis, please see our Equity Group H1’2021 Earnings Note
- KCB Group
|
KCB Group H1’2021 Key Highlights |
||||||
|
Balance Sheet |
||||||
|
Balance Sheet Items |
H1’2020 (Kshs bn) |
H1’2021 (Kshs bn) |
y/y change |
|||
|
Net Loans and Advances |
559.9 |
607.0 |
8.4% |
|||
|
Government Securities |
208.5 |
213.0 |
2.2% |
|||
|
Total Assets |
953.1 |
1,022.2 |
7.2% |
|||
|
Customer Deposits |
758.2 |
786.0 |
3.7% |
|||
|
Deposits per Branch |
2.1 |
2.2 |
5.2% |
|||
|
Total Liabilities |
820.9 |
869.2 |
5.9% |
|||
|
Shareholders’ Funds |
132.1 |
152.9 |
15.7% |
|||
|
Income Statement |
||||||
|
Income Statement Items |
H1’2020 (Kshs bn) |
H1’2021 (Kshs bn) |
y/y Change |
|||
|
Net Interest Income |
31.1 |
36.4 |
17.2% |
|||
|
Net non-Interest Income |
14.0 |
14.8 |
5.9% |
|||
|
Total Operating income |
45.0 |
51.2 |
13.7% |
|||
|
Loan Loss provision |
(11.0) |
(6.6) |
(40.3%) |
|||
|
Total Operating expenses |
(32.2) |
(29.3) |
(9.0%) |
|||
|
Profit before tax |
12.8 |
21.9 |
70.9% |
|||
|
Profit after tax |
7.6 |
15.3 |
101.9% |
|||
|
Core EPS |
2.4 |
4.8 |
101.9% |
|||
|
Key Ratios |
||||||
|
Income Statement Ratios |
H1’2020 |
H1’2021 |
% point Change |
|||
|
Yield from interest-earning assets |
11.2% |
11.2% |
0.0% |
|||
|
Cost of funding |
2.9% |
2.6% |
(0.3%) |
|||
|
Net Interest Margin |
8.4% |
8.7% |
0.3% |
|||
|
Non-Performing Loans (NPL) Ratio |
13.8% |
14.4% |
0.6% |
|||
|
NPL Coverage |
56.9% |
61.6% |
4.7% |
|||
|
Cost to Income With LLP |
71.5% |
57.2% |
(14.3%) |
|||
|
Loan to Deposit Ratio |
73.8% |
77.2% |
3.4% |
|||
|
Cost to Income Without LLP |
47.0% |
44.3% |
(2.7%) |
|||
|
Return on average equity |
16.0% |
19.2% |
3.2% |
|||
|
Return on average assets |
2.4% |
2.8% |
0.4% |
|||
|
Equity to Assets |
13.9% |
15.0% |
1.1% |
|||
|
|
Capital Adequacy Ratios |
|||||
|
Ratios |
H1’2020 |
H1’2021 |
% point Change |
|||
|
Core Capital/Total Liabilities |
17.5% |
19.0% |
1.5% |
|||
|
Minimum Statutory ratio |
8.0% |
8.0% |
|
|||
|
Excess |
9.5% |
11.0% |
1.5% |
|||
|
Core Capital/Total Risk Weighted Assets |
17.9% |
18.6% |
0.7% |
|||
|
Minimum Statutory ratio |
10.5% |
10.5% |
|
|||
|
Excess |
7.4% |
8.1% |
0.7% |
|||
|
Total Capital/Total Risk Weighted Assets |
19.5% |
21.9% |
2.4% |
|||
|
Minimum Statutory ratio |
14.5% |
14.5% |
|
|||
|
Excess |
17.5% |
19.0% |
1.5% |
|||
Key take-outs from the earnings release include;
- Core earnings per share rose by 101.9% to Kshs 4.8, from Kshs 2.4 in H1’2020, higher than our projections of a 48.9% increase to Kshs 3.5. The performance was driven by a 13.7% growth in total operating income to Kshs 51.2 bn from Kshs 45.0 bn in H1’2020, and a 40.3% decline in Loan Loss Provisions to Kshs 6.6 bn, from Kshs 11.0 bn in H1’2020. Total operating expenses recorded a 9.0% decline to Kshs 29.3 bn, from Kshs 32.2 bn in H1’2020,
- Net Interest income grew by 17.2% to Kshs 36.4 bn, from Kshs 31.1 bn in H1’2020, driven by a 15.0% increase in interest income from loans and advances, which increased to Kshs 34.5 bn from Kshs 30.0 bn in H1’2020, coupled with an 11.6% increase in interest income from government securities which increased to Kshs 12.1 bn, from Kshs 10.8 bn in H1’2020. The increase was however weighed down by a 4.1% decline in income from deposits and placements with banking institutions to Kshs 0.58 bn, from Kshs 0.55 bn in H1’2020,
- The yield on interest-earning assets remained unchanged at 11.2% as recorded in H1’2020, attributable to a 15.2% growth in average interest earning assets, which matched the 15.0% growth in trailing interest income,
- Interest expense rose by 3.8% to Kshs 10.7 bn, from Kshs 10.3 bn in H1’2020, following a 54.7% rise in Interest expense on deposits and placements to Kshs 1.5 bn, from Kshs 1.0 bn in H1’2020. The growth in interest expense was however mitigated by the 1.7% decline in interest expense on customer deposits to Kshs 9.2 bn, from Kshs 9.3 bn in H1’2020. Cost of funds declined to 2.6% from 2.9% recorded in H1’2020, following a faster 16.3% increase in average interest bearing liabilities, which outpaced the 3.8% increase in interest expense,
- Net Interest Margin (NIM) on the other hand, increased to 8.7%, from 8.4% in H1’2020 due to the faster 18.6% growth in trailing Net Interest Income that outpaced the 15.2% increase in average interest-earning assets,
- Total operating expenses decreased by 9.0% to Kshs 29.3 bn, from Kshs 32.2 bn in H1’2020, largely driven by a 40.3% decline in Loan Loss Provisions (LLP) to Kshs 6.6 bn, from Kshs 11.0 bn in H1’2020. Staff costs increased by 21.4% to Kshs 12.3 bn from Kshs 10.1 bn in H1’2020,
- The balance sheet recorded an expansion as total assets grew by 7.2% to Kshs 1.0 tn bn, from Kshs 953.1 bn in H1’2020. The growth was supported by an 8.4% loan book expansion to Kshs 607.0 bn, from Kshs 559.9 bn in H1’2020, coupled with a 2.2% increase in government securities to Kshs 213.0 bn, from Kshs 208.5 bn in H1’2020,
- Total liabilities rose by 5.9% to Kshs 869.2 bn, from Kshs 820.9 bn in H1’2020, driven by a 63.9% rise in borrowings to Kshs 35.0 bn, from Kshs 21.4 bn in H1’2020. Customer deposits increased by 3.7% to Kshs 786.0 bn from Kshs 758.2 bn, with customer deposits from NBK amounting to Kshs 99.9 bn in H1’2021,
- Deposits per branch increased by 5.2% to Kshs 2.2 bn from Kshs 2.1 bn in H1’2020, with the number of branches declining to 354 as at the end of H1’2021, from 359 in H1’2020, due to the group closing 5 branches in Kenya, 1 in Rwanda and 1 in South Sudan in the period. The group however opened 2 branches in Uganda during the period,
- Gross non-performing loans increased by 14.1% to Kshs 95.7 bn in H1’2021 from Kshs 83.9 bn in H1’2020. Consequently, the NPL ratio rose to 14.4% in H1’2021, from 13.8% in H1’2020, attributable to the faster 14.1% growth in Non-Performing Loans, which outpaced the 8.4% growth in loans. The rise in non-performing loans was mainly attributable to the poor performance from the Corporate segment, MSME segment, mortgage segment and Check-Off loans which recorded NPL ratios of 17.9%, 11.8%, 10.5% and 2.8%, respectively,
- Loan Loss Provisions (LLP) decreased by 40.3% y/y to Kshs 6.6 bn in H1’2021, from Kshs 11.0 bn in H1’2020. The NPL coverage on the other hand improved to 61.6% in H1’2021 from 56.9% in H1’2020, as general Loan Loss Provisions increased by 29.6% to Kshs 46.8 bn from Kshs 36.1 bn in H1’2020, attributable to the deterioration in the group’s asset quality with the NPL ratio rising to 14.4% from 13.8% in H1’2020, and,
- KCB Group remains sufficiently capitalized with a core capital to risk-weighted assets ratio of 18.6%, 8.1% points above the statutory requirement. In addition, the total capital to risk-weighted assets ratio came in at 21.9%, exceeding the statutory requirement by 7.4% points. Adjusting for IFRS 9, the core capital to risk-weighted assets stood at 18.7%, while total capital to risk-weighted assets came in at 22.0%.
For a comprehensive analysis, please see our KCB Group H1’2021 Earnings Note
- Co-operative Bank of Kenya
|
Co-operative Bank H1’2021 Key Highlights |
|||
|
Balance Sheet |
|||
|
Balance Sheet Items |
H1’2020 (Kshs bn) |
H1’2021 (Kshs bn) |
y/y change |
|
Government Securities |
122.4 |
182.0 |
48.7% |
|
Net Loans and Advances |
272.2 |
301.2 |
10.7% |
|
Total Assets |
513.9 |
573.0 |
11.5% |
|
Customer Deposits |
384.6 |
407.7 |
6.0% |
|
Deposits per branch |
2.4 |
2.3 |
(4.8%) |
|
Total Liabilities |
432.2 |
480.4 |
11.1% |
|
Shareholders’ Funds |
80.1 |
92.6 |
15.6% |
|
Income Statement |
|||
|
Income Statement Items |
H1’2020 (Kshs bn) |
H1’2021 (Kshs bn) |
y/y change |
|
Net Interest Income |
15.9 |
18.8 |
18.3% |
|
Net non-Interest Income |
8.3 |
10.3 |
24.3% |
|
Total Operating income |
24.2 |
29.2 |
20.4% |
|
Loan Loss provision |
(1.9) |
(4.2) |
123.0% |
|
Total Operating expenses |
(14.6) |
(18.7) |
28.3% |
|
Profit before tax |
9.6 |
10.5 |
9.6% |
|
Profit after tax |
7.2 |
7.4 |
2.3% |
|
Core EPS |
1.0 |
1.1 |
2.3% |
|
Key Ratios |
|||
|
Income statement ratios |
H1'2020 |
H1'2021 |
% point change |
|
Yield from interest-earning assets |
11.5% |
11.7% |
0.2% |
|
Cost of funding |
3.1% |
3.2% |
0.1% |
|
Net Interest Margin |
8.2% |
8.6% |
0.4% |
|
Non-Performing Loans (NPL) Ratio |
11.8% |
15.2% |
3.4% |
|
NPL Coverage |
54.6% |
63.5% |
8.9% |
|
Cost to Income With LLP |
60.1% |
64.1% |
4.0% |
|
Loan to Deposit Ratio |
70.8% |
73.9% |
3.1% |
|
Cost to Income Without LLP |
52.4% |
49.9% |
(2.5%) |
|
Return on average equity |
18.2% |
12.7% |
(5.5%) |
|
Return on average assets |
3.0% |
2.0% |
(1.0%) |
|
Equity to assets |
15.6% |
16.2% |
0.6% |
|
Capital Adequacy Ratios |
H1'2020 |
H1'2021 |
% Points change |
|
Core Capital/Total Liabilities |
18.2% |
18.2% |
0.0% |
|
Minimum Statutory ratio |
8.0% |
8.0% |
0.0% |
|
Excess |
10.2% |
10.2% |
0.0% |
|
Core Capital/Total Risk Weighted Assets |
16.3% |
15.3% |
(1.0%) |
|
Minimum Statutory ratio |
10.5% |
10.5% |
0.0% |
|
Excess |
5.8% |
4.8% |
(1.0%) |
|
Total Capital/Total Risk Weighted Assets |
16.8% |
17.0% |
0.2% |
|
Minimum Statutory ratio |
14.5% |
14.5% |
0.0% |
|
Excess |
2.3% |
2.5% |
0.2% |
Key take-outs from the earnings release include;
- Core earnings per share increased by 2.3% to Kshs 1.1 in H1’2021, from Kshs 1.0 in H1’2020 driven by a 20.4% increase in total operating income to Kshs 29.2 bn in H1’2021 from Kshs 24.2 bn in H1’2020, despite a faster increase of 28.3% increase in total operating expenses to Kshs 18.7 bn in H1’2021, from Kshs 14.6 bn in H1’2020,
- Net Interest income rose by 18.3% to Kshs 18.8 bn in H1’2021, from Kshs 15.9 bn in H1’2020. The growth recorded was as a result of a 42.3% increase in interest income from government securities to Kshs 8.8 bn, from Kshs 6.2 bn in H1’2020, coupled with a 12.7% rise in interest income from loans and advances to Kshs 16.9 bn, from Kshs 15.0 bn in H1’2020. This growth was however weighed down by a 69.3% decline in interest income from deposits with other financial institutions to Kshs 0.2 bn in H1’2021, from Kshs 0.6 bn in H1’2020,
- The yield on interest-earning assets increased to 11.7%, from 11.5% in H1’2020 due to the faster 17.7% growth in trailing interest income, which outpaced the 16.2% growth in the average interest-earning assets,
- Interest expense increased by 20.9% to Kshs 7.1 bn in H1’2021, from Kshs 5.9 bn in H1’2020, largely due to a 25.3% rise in interest expense from customer deposits to Kshs 6.4 bn, from Kshs 5.1 bn in H1’2020. This was however mitigated by a 9.1% decline in other interest expenses to Kshs 0.7 bn in H1’2021, from Kshs 0.8 bn in H1’2020. As such, cost of funds declined to 3.1%, from 3.2% in H1’2020, owing to the faster 14.4% rise in the average interest-bearing liabilities, compared to the 13.8% increase in trailing interest expense,
- Net Interest Margin (NIM) increased to 8.6%, from 8.2% in H1’2020, attributable to the 19.1% growth of trailing Net Interest Income (NII), which outpaced the 16.2% growth in average interest-earning assets,
- Total operating expenses rose by 28.3% to Kshs 18.7 bn in H1’2021, from Kshs 14.6 bn in H1’2020, largely driven by the 123.0% rise in Loan Loss Provisions (LLP) to Kshs 4.2 bn, from Kshs 1.9 bn in H1’2020. The increased provisioning levels by the lender is mainly as a result of the elevated levels of credit risk currently in the market. Notably, Staff costs declined by 1.3% to Kshs 6.5 bn from Kshs 6.6 bn in H1’2020,
- The balance sheet recorded an expansion as total assets grew by 11.5% to Kshs 573.0 bn in H1’2021, from Kshs 513.9 bn in H1’2020, mainly attributable to the 48.7% growth in government securities to Kshs 182.0 bn, from Kshs 122.4 bn, coupled with a 10.7% growth in net loans and advances to Kshs 301.2 bn in H1’2021, from Kshs 272.2 bn in H1’2020. The increase in allocation to government securities shows the bank’s cautious lending strategy considering the deteriorating asset quality, as evidenced by the bank’s NPL ratio rising to 15.2% in H1’2021 from 11.8% in H1’2020,
- Total liabilities grew by 11.1% to Kshs 480.4 bn, from Kshs 432.2 bn in H1’2020, which was largely attributable to a 6.0% rise in customer deposits to Kshs 407.7 bn in H1’2021, from Kshs 384.6 bn in H1’2020, coupled with a 73.3% increase in borrowings to Kshs 44.4 bn, from Kshs 25.6 bn in H1’2020. The increased borrowing levels can be attributed to a Kshs 21.0 bn borrowing by Kingdom Bank to support its operations,
- Deposits per branch decreased by 4.8% to Kshs 2.3 bn, from Kshs 2.4 bn in H1’2020. The number of branches increased by 18 branches to 177 from 159 branches in H1’2020,
- Gross Non-Performing Loans (NPLs) increased by 48.2% to Kshs 50.8 bn in H1’2021, from Kshs 34.3 bn in H1’2020. The NPL ratio rose to 15.2% in H1’2021 from 11.8% in H1’2020, owing to the slower 14.6% growth in gross loans compared to the 48.2% growth in gross non-performing loans,
- The NPL coverage ratio consequently improved to 63.5% in H1’2021, from 54.6% in H1’2020, due to the faster 95.0% growth in General Loan Loss Provisions which was outpaced by the 48.2% growth in Gross Non-Performing Loans (NPLs), and,
- Co-operative Bank remains sufficiently capitalized with a core capital to risk-weighted assets ratio of 15.3%, 4.8% points above the statutory requirement of 10.5%. Also, the total capital to risk-weighted assets ratio came in at 17.0%, exceeding the statutory requirement of 14.5% by 2.5% points. Adjusting for IFRS 9, the core capital to risk-weighted assets stood at 13.1%, while total capital to risk-weighted assets came in at 14.8%,
For a comprehensive analysis, please see our Co-operative Bank H1’2021 Earnings Note
Asset Quality
The table below is a summary of the asset quality for the companies that have released
|
|
H1'2020 NPL Ratio** |
H1'2021 NPL Ratio* |
H1'2020 NPL Coverage** |
H1'2021 NPL Coverage* |
% point change in NPL Ratio |
% point change in NPL Coverage |
|
Co-operative Bank of Kenya |
11.8% |
15.2% |
54.6% |
63.5% |
3.4% |
8.9% |
|
KCB |
13.8% |
14.4% |
56.9% |
61.6% |
0.6% |
4.7% |
|
Equity Group |
11.0% |
11.4% |
48.5% |
63.2% |
0.4% |
14.7% |
|
Stanbic Bank |
12.1% |
9.5% |
59.3% |
51.0% |
(2.6%) |
(8.3%) |
|
Mkt Weighted Average |
11.6% |
12.4% |
57.8% |
60.6% |
0.8% |
2.8% |
|
*Market cap weighted as at 20/08/2021 |
||||||
|
**Market cap weighted as at 28/08/2020 |
||||||
Key take-outs from the table include;
- Asset quality for the listed banks that have released deteriorated during the period, with the weighted average NPL ratio rising by 1.3% points to a market cap weighted average of 12.9%, from an average of 11.6% for the listed banking sector in H1’2020. The deterioration in asset quality was as a result of increased non-performing loans due to the increased credit risk as a consequence of the subdued business environment occasioned Covid-19 pandemic, and,
- NPL Coverage for the listed banks increased to a market cap weighted average of 61.8% in H1’2021, from 57.8% recorded in H1’2020, as the banks increased their provisioning levels due to the difficult economic conditions caused by the pandemic. Banks are expected to continue over-provisioning in 2021, albeit at a slower pace than in 2020.
Summary Performance
The table below highlights the performance of the banks that have released so far, showing the performance using several metrics, and the key take-outs of the performance;
|
Bank |
Core EPS Growth |
Interest Income Growth |
Interest Expense Growth |
Net Interest Income Growth |
Net Interest Margin |
Non-Funded Income Growth |
NFI to Total Operating Income |
Growth in Total Fees & Commissions |
Deposit Growth |
Growth in Government Securities |
Loan to Deposit Ratio |
Loan Growth |
Return on Average Equity |
|
KCB |
101.9% |
13.9% |
3.8% |
17.2% |
8.7% |
5.9% |
28.9% |
(2.2%) |
3.7% |
2.2% |
77.2% |
8.4% |
19.2% |
|
Equity Group |
97.7% |
30.3% |
42.0% |
26.5% |
7.6% |
44.2% |
40.0% |
42.5% |
50.7% |
11.8% |
61.6% |
28.9% |
21.4% |
|
Stanbic Bank |
37.2% |
2.1% |
(9.9%) |
9.5% |
4.4% |
10.5% |
44.3% |
3.0% |
(9.4%) |
(2.7%) |
79.9% |
(11.7%) |
11.9% |
|
Cooperative Bank |
2.3% |
19.0% |
20.9% |
18.3% |
8.6% |
24.3% |
35.4% |
17.8% |
6.0% |
48.7% |
73.9% |
10.7% |
12.7% |
|
H1'21 Mkt Weighted Average* |
78.0% |
20.8% |
21.8% |
20.7% |
7.9% |
25.6% |
35.9% |
20.5% |
22.9% |
13.8% |
70.3% |
15.8% |
18.4% |
|
H1'20 Mkt Weighted Average** |
(33.6%) |
10.4% |
10.0% |
10.9% |
7.0% |
(1.1%) |
35.2% |
(3.4%) |
18.5% |
25.9% |
71.5% |
14.5% |
15.4% |
|
*Market cap weighted as at 20/08/2021 |
|||||||||||||
|
**Market cap weighted as at 28/08/2020 |
|||||||||||||
Key takeaways from the table above include:
- The listed banks that have released recorded a 78.0% weighted average growth in core Earnings per Share (EPS), compared to a weighted average decline of 33.6% in H1’2020 for the listed banking sector. The performance is however largely skewed by the strong performance from KCB and Equity Group,
- The Banks have recorded a weighted average deposit growth of 22.9%, faster than the 18.5% growth recorded in H1’2020,
- Interest expense grew at a faster pace, by 21.8%, compared to the 10.0% growth in H1’2020 while cost of funds declined, coming in at a weighted average of 2.4% in H1’2021, from 2.9% in H1’2020, owing to the faster growth in average interest-bearing liabilities, an indication that the listed banks were able to mobilize cheaper deposits,
- Average loan growth came in at 15.8%, higher than the 14.5% growth recorded in H1’2020. The loan growth was also faster than the 13.8% growth in government securities, an indication that the banks’ are gradually going back to lending as the economy continues to rebound,
- Interest income grew by 20.8%, compared to a growth of 10.4% recorded in H1’2020. Notably, the weighted average Yield on Interest Earning Assets (YIEA) for the four banks increased to 10.3%, from the 9.7% recorded in H1’2020 for the listed banking sector, an indication of the increased allocation to higher-yielding assets by the sector during the period. Consequently, the Net Interest Margin (NIM) now stands at 7.9%, 0.9% points higher than the 7.0% recorded in H1’2020 for the whole listed banking sector, and,
- Non-Funded Income grew by 25.6%, compared to the 1.1% decline recorded in H1’2020. This can be attributable to the faster growth in the fees and commission which grew by 20.5% compared to a decline of 3.4% in H1’2020.
Universe of Coverage
|
Company |
Price as at 13/08/2021 |
Price as at 20/08/2021 |
w/w change |
YTD Change |
Year Open 2021 |
Target Price* |
Dividend Yield |
Upside/ Downside** |
P/TBv Multiple |
Recommendation |
|
I&M Group*** |
22.8 |
23.0 |
1.1% |
(48.7%) |
44.9 |
29.8 |
9.8% |
39.3% |
0.3x |
Buy |
|
Kenya Reinsurance |
2.5 |
2.5 |
(1.2%) |
6.9% |
2.3 |
3.1 |
8.1% |
33.6% |
0.3x |
Buy |
|
NCBA*** |
25.4 |
27.1 |
6.7% |
1.9% |
26.6 |
29.5 |
5.5% |
14.4% |
0.7x |
Accumulate |
|
Co-op Bank*** |
13.8 |
13.7 |
(0.7%) |
9.2% |
12.6 |
14.5 |
7.3% |
13.1% |
1.0x |
Accumulate |
|
KCB Group*** |
47.2 |
48.0 |
1.7% |
24.9% |
38.4 |
52.5 |
2.1% |
11.6% |
1.1x |
Accumulate |
|
Diamond Trust Bank*** |
64.5 |
65.0 |
0.8% |
(15.3%) |
76.8 |
70.0 |
0.0% |
7.7% |
0.3x |
Hold |
|
Standard Chartered*** |
130.8 |
134.8 |
3.1% |
(6.7%) |
144.5 |
134.5 |
7.8% |
7.6% |
1.0x |
Hold |
|
Equity Group*** |
51.0 |
52.5 |
2.9% |
44.8% |
36.3 |
55.9 |
0.0% |
6.5% |
1.5x |
Hold |
|
ABSA Bank*** |
9.8 |
10.2 |
3.8% |
6.6% |
9.5 |
10.7 |
0.0% |
5.4% |
1.1x |
Hold |
|
Sanlam |
11.6 |
11.9 |
3.0% |
(8.5%) |
13.0 |
12.4 |
0.0% |
4.2% |
1.1x |
Lighten |
|
Stanbic Holdings |
86.0 |
94.0 |
9.3% |
10.6% |
85.0 |
89.1 |
1.8% |
(3.4%) |
0.9x |
Sell |
|
Jubilee Holdings |
358.8 |
360.0 |
0.3% |
30.6% |
275.8 |
330.9 |
2.5% |
(5.6%) |
0.7x |
Sell |
|
Liberty Holdings |
8.4 |
9.0 |
7.1% |
16.9% |
7.7 |
8.4 |
0.0% |
(6.7%) |
0.7x |
Sell |
|
Britam |
8.3 |
8.3 |
(0.2%) |
18.3% |
7.0 |
6.7 |
0.0% |
(19.1%) |
1.5x |
Sell |
|
HF Group |
3.7 |
4.0 |
7.0% |
26.8% |
3.1 |
3.2 |
0.0% |
(19.6%) |
0.2x |
Sell |
|
CIC Group |
3.2 |
2.8 |
(11.7%) |
31.8% |
2.1 |
1.8 |
0.0% |
(35.3%) |
1.0x |
Sell |
|
Target Price as per Cytonn Analyst estimates as at Q1’2021. We are currently reviewing our target prices for the banking sector coverage **Upside/ (Downside) is adjusted for Dividend Yield ***For Disclosure, these are stocks in which Cytonn and/or its affiliates are invested in Key to note, I&M Holdings YTD share price change is mainly attributable to the counter trading ex-bonus issue |
||||||||||
We are “Neutral” on the Equities markets in the short term. With the market currently trading at a premium to its future growth (PEG Ratio at 1.1x), we believe that investors should reposition towards companies with a strong earnings growth and are trading at discounts to their intrinsic value. Additionally, we expect the recent discovery of new strains of COVID-19 coupled with the introduction of strict lockdown measures in major economies to continue dampening the economic outlook.
- Industry Reports
During the week, the Kenya National Bureau of Statistics (KNBS) released the Leading Economic Indicators June 2021 and the following were the key take outs from the report;
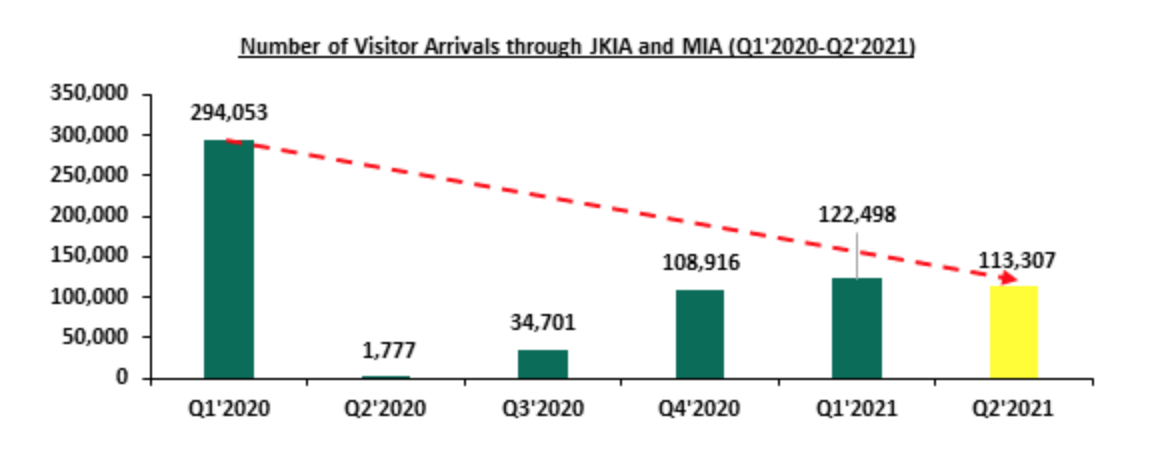
- International arrivals through Jomo Kenyatta International Airport (JKIA) and Moi International Airport (MIA) registered an improvement from 1,177 visitors in Q2’2020 to 113,307 in Q2’2021. This is as a result of the ease of the pandemic restrictions and lockdowns, coupled with the aggressive efforts by the Ministry of Tourism to market the Kenyan hospitality industry and make it visible to the rest of the world. However, the number of visitor arrivals through Jomo Kenyatta International Airport (JKIA) and Moi International Airport (MIA) recorded a decline of 7.5% from 122,498 persons in Q1’2021 to 113,307 persons in Q2’2021. The decline in the number of international arrivals was largely attributed to the level four travel advisory alert initiated by the United States of America (USA) and United Kingdom (UK) listing Kenya on its “red-list” as a high risk country in April 2021 due to the rise in number of COVID-19 cases, thereby causing a drop as the two countries are regarded as key source markets of tourists in Kenya.
The graph below shows the number of international arrivals in Kenya between Q1’2020 and Q2’2021:
Source: Kenya National Bureau of Statistics
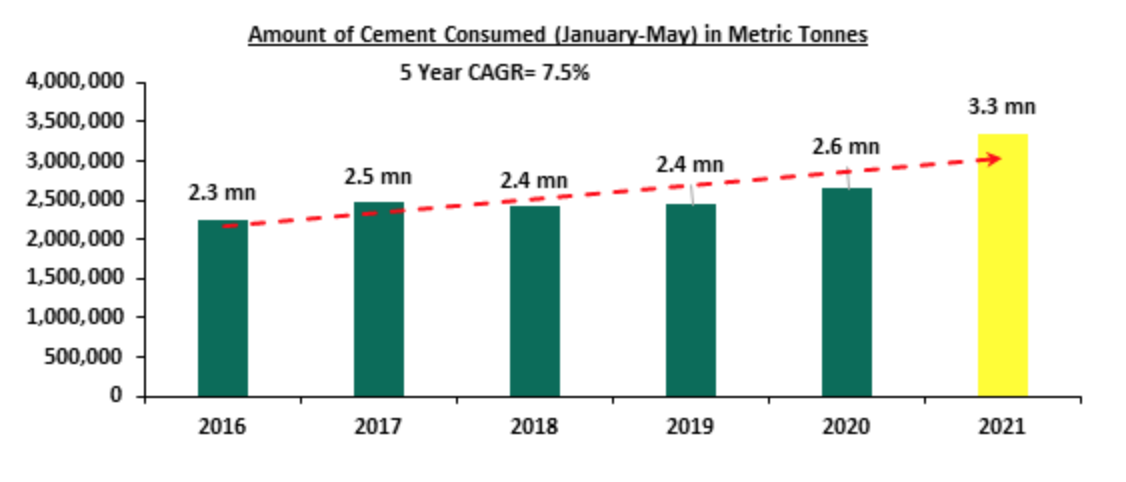
- Cement consumption registered a 26.9% increase to 3.3 mn metric tonnes between January and May 2021 compared to 2.6 mn metric tonnes recorded during the same period in 2020, pointing to stable activities in the construction sector despite the pandemic, as well as the ongoing large infrastructure development projects by the government such as the Nairobi Expressway. We expect the construction industry to continue registering increased activities attributed to the various infrastructural and affordable housing projects being initiated and implemented by the government and the private sector. Moreover, the upgrading of the e-construction permit system will facilitate easier and faster approval for development plans upon completion, hence improve the value of building approvals as well, which dropped by 63.7% to Kshs 39.8 bn between January and May 2021, from Kshs 109.5 bn recorded in a similar period in 2020 due to the pandemic restrictions and lockdowns imposed in the country thereby causing investors to halt their development plans due to uncertainties.
The graph below shows the volumes of cement consumption in Nairobi between 2016 and 2021:
Source: Kenya National Bureau of Statistics
We expect the increased construction activities supported by the reopening of the economy coupled with increase in the roll out of vaccines to impact the real estate sector positively. The number of international arrivals is expected to be boosted by marketing of Kenya as a tourist destination for example through the World Rally Championships which are expected to run annually up to 2026. However, tourist numbers are expected to be weighed down by travel advisories and the ongoing pandemic.
Hass Consult, a real estate development and consulting company, released their Hass Consult Q2’2021 House Price Index, a report highlighting the residential market performance of various nodes in the Nairobi Metropolitan Area (NMA). The following were the key take outs from the report;
- House prices realized an overall 0.1% q/q and 1.7% y/y price decline, driven by the huge declines in Kilimani and Kileleshwa which have seen highest y/y price corrections of 9.5% and 6.9%, respectively,
- Lang’ata registered the best performance in both q/q and y/y periods with property appreciations coming in at 4.1% and 10.3%, respectively, due to affordability,
- Rental prices in the NMA realized a mild recovery of 1.1% q/q and 6.1% y/y in June 2021, mainly driven by the rise in rental prices for detached units, and,
- Muthaiga suburb’s registered the highest y/y rental rates appreciation of 11.7% due to an improved demand, whereas Kilimani apartments registered the highest y/y rental rates correction at 11.5% as a result of oversupply.
The findings of this report are in line with the Cytonn H1’2021 Markets Review which highlighted that the average rental yield for houses in the NMA registered a 0.2% points q/q increase to 4.8% in H1’2021 from 4.7% recorded in Q1’2021 attributable to economic improvement which saw asking rents recording an uptick. We therefore expect the residential sector to continue registering improved development activities and uptake of houses due to the reopening of the economy which is expected to improve transactional volumes, coupled with government and private sector focus on developing and delivering projects. Investment opportunities for detached units lie in Ruiru, Kitisuru and, Redhill which recorded the highest average y/y returns at 6.6%, 6.5% and, 6.5%, respectively, while for apartments, opportunities lie in Waiyaki Way, Parklands and, Ruaka which recorded the highest average y/y total returns of 8.1%, 7.6% and, 7.5%, respectively.
Hass Consult also released the Hass Consult Q2’2021 Land Price Index and the key take outs were as follows;
- Land prices within Nairobi’s suburbs and satellite towns registered a 0.3% q/q and 1.1% q/q appreciation, respectively, due to improved asking prices as a result of increased demand and improving infrastructure thereby opening areas for real estate development,
- Nyari was the best performing node in Nairobi’s suburbs recording price appreciations of 2.3% q/q and 6.2% y/y due to improved infrastructure development by the installation of the Westlands-Redhill Link Road thereby opening the area to investment opportunities and accessibility,
- Riverside was the worst performing node registering price corrections of 1.6% q/q and 8.1%y/y as a result of decline in demand and unaffordability, and,
- For satellite towns, Ngong registered the highest y/y growth of 18.1% largely attributed to affordability thereby enhancing uptake from growing middle income population with disposable income, and improving infrastructure opening the area for real estate investments and development.
The findings of this report are also in line with the Cytonn H1’2021 Markets Review which highlighted that NMA land sector recorded an overall annualized capital appreciation of 1.6%, indicating that the land sector continues to be a good investment asset. We expect the sector to continue registering remarkable performance having shown resilience in its performance in the wake of the pandemic due to; i) the availability of land in the satellite towns and at affordable prices, ii) increasing demand for land by a growing middle income class with disposable income, iii) improving infrastructure facilitating investments in the land sector and boost of prices, iv) positive demographics, and, v) the continued focus on affordable housing especially within the satellite towns of Nairobi. The investment opportunities in the NMA land sector lie in areas such as Ongata Rongai, Athi River, Ruiru and Kitisuru, which recorded high price appreciations of 8.9%, 8.7%, 6.9% and 6.3%, compared to a market average of 1.6%.
- Hospitality Sector
During the week, the Ministry of Tourism through the Tourism Fund Corporation announced plans to engage in Public Private Partnership (PPP) deal to complete the construction of Crab Utalii Hotel worth Kshs 5.9 bn, on a 20.0 are piece of land in Vipingo Kilifi County. The construction of the hotel which began in November 2013 is currently 60.0% done and is expected to be completed in two phases by July 2022. The phase one and two of the project deficits are Kshs 1.6 bn and Kshs 1.1 bn bringing total project deficit to Kshs 2.7 bn, and the Tourism Fund, the Tourism Promotion Fund and the National Treasury have already pledged Kshs 1.5 bn to facilitate its timely delivery. Once completed, the hotel is expected to boost tourism activities and overall hospitality sector performance of the larger Kilifi region due to its superior location along the Indian Ocean beach which is a major tourist attraction site.
The decision by the Ministry comes at a time when PPPs have proven to be a strategic way for delivering projects in the country, attributed to the various benefits they bear such as; i) access to finance for projects, ii) access to private sector efficiencies by the government, and, iii) enhancing the delivery of large scale projects at a cost effective way that would otherwise cause constraints to taxpayers if implemented by the government. In line with this, some of the PPP projects that are currently in the pipeline include; i) River Estate in Ngara by National Government and Edderman Property Limited, ii) Nairobi Expressway by National Government and China Roads and Bridges Corporation, and iii) Pangani Housing Project by National Government and Tecnofin Kenya Limited. Despite this, PPPs have not been performing to the optimum attributed to insufficient regulatory framework to handle complex transactions, and irregular procurement processes due to corruption, thereby impeding timely delivery of projects. However, with the new Public Private Partnership Bill that was proposed in April 2021, PPP initiated projects are expected to perform better as a result of good governance thereby enhancing more developments and boosting confidence of investors in the projects, once the bill is passed in parliament.
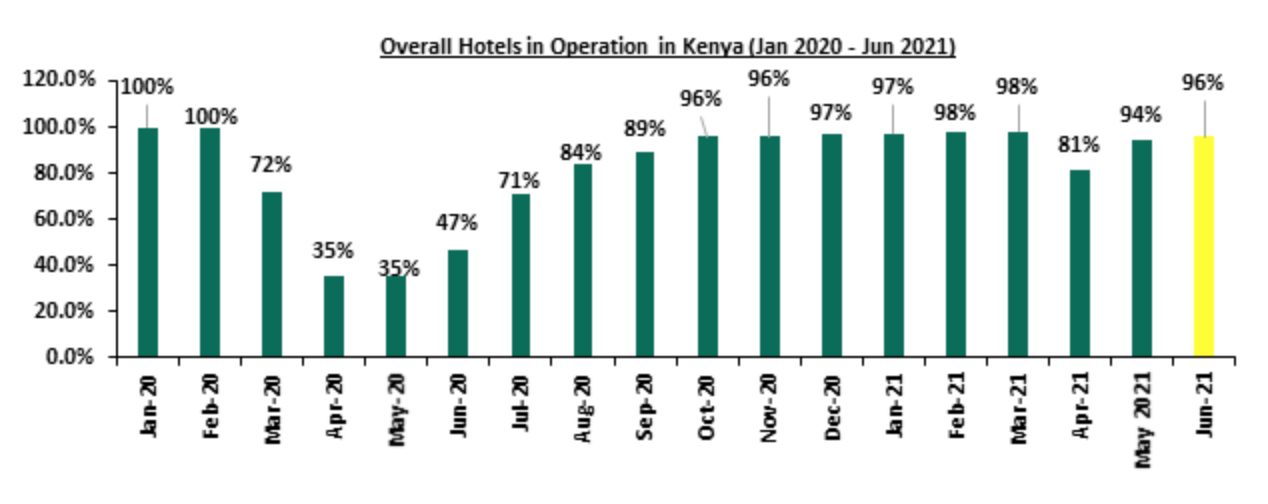
The choice to invest in the project within Kilifi by the developers is also supported by; i) strategic location with ability to attract tourists attributed to the warm climate leading to more beach activities, ii) easy access due to availability of infrastructure such as the Mombasa-Malindi highway, iii) availability of amenities such as shopping malls, and, iv) value for money as real estate tourism investments projects have proven to generate favorable returns to investors due to the ready market from tourists both local and international as well as expatriates. Moreover, we expect confidence of investors in the region to be boosted attributed to the reopening of the economy and the expected stability of the hospitality industry in the long run as the country continues to roll out the COVID-19 vaccines evidenced by the overall increase in the number of hotels operating in the country.
The graph below shows the overall percentage of the number of operating hotels in Kenya between January 2020 and June 2021;
Source: Central Bank of Kenya
- Infrastructure Sector
During the week, the national government through the Kenya Rural Roads Authority (KeRRA) began the tarmacking of the 55.0 Km Msau-Mbale-Werugha-Mgange-Bura road project at a cost of Kshs 2.0 bn in Taita Taveta County. The construction of the road was initiated in 2017 by His Excellency President Uhuru Kenyatta but was however stalled midway due to financial constraints. Additionally, the Kenya Rural Roads Authority (KeRRA) announced plans to construct the 78.0 Km Kamukunji-Kisanana-Kipkitur-Lake Bogoria road worth Kshs 3.7 bn in Baringo County through Intex Construction Limited, a local contractor. The construction of the road was announced in 2017, but the plans were halted due to lack of budget allocation until January 2021. The actual construction of the road is to be done at a cost of Kshs 3.3 bn out of the total Kshs 3.7 bn, with the remaining Kshs 0.4 bn to be set aside for its maintenance. Once completed, the projects are expected to spur trading activities in surrounding regions as well as ease transport services. Moreover, they are expected to open up the surrounding areas for real estate investment as well as boost their property prices, and initiate an improvement in tourism activities from both local and international visitors with Lake Bogoria and Taita Hills National Parks being major tourism destinations within Baringo and Taita Taveta Counties, respectively.
Kenya’s infrastructure sector continues to experience major developments despite the ongoing pandemic, mainly attributed to government’s aggressive focus on initiating and implementing projects such as; i) Western Bypass project, ii) Nairobi Express Way project expected to be completed six months ahead of initial schedule in February 2022, iii) Nairobi-Nakuru Mau Summit Highway project, and, iv) Lamu Port-South Sudan-Ethiopia Transport (LAPSSET) corridor whose first berth was completed and launched in May 2021. We expect the sector to continue registering numerous developments due to; i) the 0.6% increase in budgetary allocation to Kshs 182.5 bn for the FY’2021/2022, from Kshs 181.4 bn allocation for FY’2020/2021, ii) government’s partnerships such as PPPs aimed at facilitating the construction and completion of various projects in a timely and cost effective way, and, iii) government’s focus on developing quality and adequate roads to make Kenya an intra-regional hub for trade in East Africa.
The graph below shows the budget allocation to the infrastructure sector over the last nine financial years:
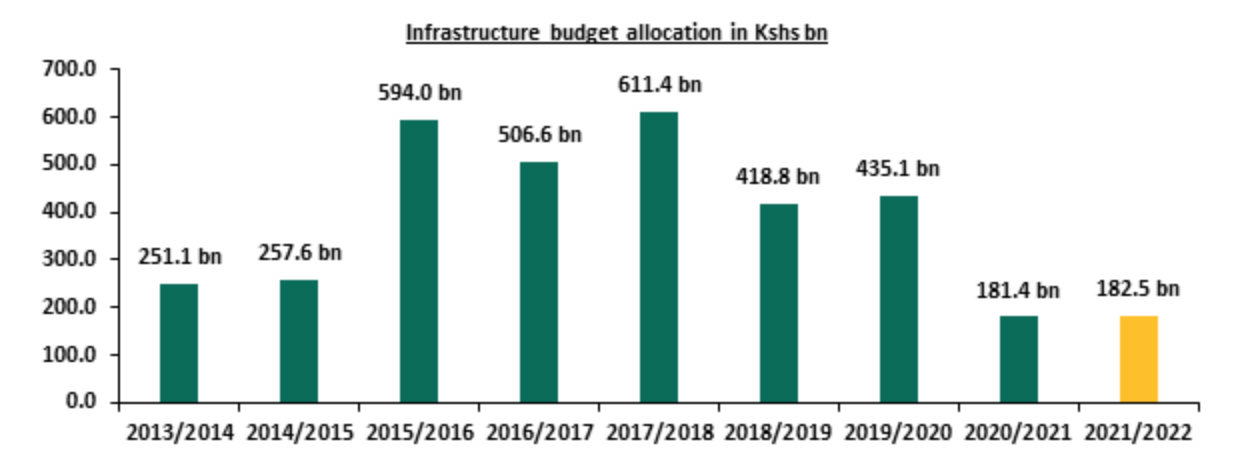
Source: National Treasury
Kenya’s real estate sector is expected to continue experiencing improvement in performance as a result of the reopening of the economy thereby initiating improved uptake of property and developments, coupled with government’s continued focus on initiation and implementation of infrastructure projects further opening various areas for real estate investments thereby boosting prices. However, the low number of visitor arrivals, despite improving, is expected to weigh down the performance of the hospitality sector.
The Kenya Mortgage Refinance Company (KMRC) is a treasury backed financial institution in Kenya that specializes in lending to Primary Mortgage Lenders (PMLs) such as banks, microfinance institutions and Savings and Credit Cooperatives (SACCOs) for onward lending to potential home owners. It was established in August 2018 and began its operations in September 2020 after licensing by the Central Bank of Kenya (CBK), in an aim to increase home ownership through issuance of affordable mortgages. This week, we seek to do a follow up of the company and provide an update a year since operationalization, as well as benchmark with a more established refinance company;
We have in the past written three topical on KMRC namely;
- Kenya Mortgage Refinance Company in April 2018,
- Kenya Mortgage Refinance Company Update in April 2019, and,
- The latest being the Kenya Mortgage Refinance Recap in November2020.
Homeownership is an important aspiration, hence affordable mortgages are essential to increasing homeownership, currently at 21.3% compared to Ghana at 47.2% and South Africa at 53.0%, hence the need for acceleration. Consequently, we again seek to offer more insights into the progress, with an aim of offering solutions to challenges faced so far and giving recommendations to those challenges by benchmarking with a well-established refinance company, and observing existing gaps in the Kenyan set up. We shall therefore cover the following topics;
- Overview of the Housing Sector in Kenya,
- Home Financing in Kenya,
- Overview of Kenya Mortgage Refinance Company (KMRC),
- KMRC Objectives, Achievements and Challenges,
- Case Study and Lessons Learnt, and,
- Conclusion
- Overview of the Housing Sector in Kenya
The housing sector in Kenya remains constrained by high demand and low supply. According to the Centre for Affordable Housing, the yearly new supply of housing units in Kenya stands at approximately 50,000, with only 2.0% percent of this incoming supply targeted for the low income earners. Considering the housing deficit of 2.0 mn units which continues to grow annually by 200,000 units, and the low annual supply rate, it might not be easy to meet the targeted to 500,000 affordable housing units by 2022 under the Affordable Housing Initiative, since we are yet to see a significant part of that delivered. Current hurdles constraining supply of affordable houses in the country include; i) high construction costs, ii) the pending operationalization of the Integrated Project Delivery Unit under the Ministry of Housing as a single point of regulatory approval for developments, infrastructure provision and developer incentive, iii) lack of development finance as investors hold back monies during the tough economic times and a non-supportive capital markets regulatory framework, and, iv) reduced revenue inflows and disruption of supply chains due to the pandemic.
Home ownership in Kenya has remained low at 21.3% in urban areas as at 2020, implying that 78.7% of the urban population are renters, which is low compared to other African countries such as Ghana with a 47.2% urban home ownership rate. The low home ownership rate is attributed to; i) the increasing number of Non-Performing Loans (NPLS) in the real estate sector, which increased by 14.8 % to Kshs 70.5 bn in Q1’2021 from Kshs 61.4 bn recorded in Q4’2020 leading to tighter underwriting standards, ii) exclusion of self-employed citizens due to lack of the credit information on criteria threshold for mortgage products, iii) the tough economic times reducing savings and disposable income, iv) high property costs, and, v) the high initial deposits required to access mortgages.
The graph below shows the home ownership percentages of different countries compared to Kenya;
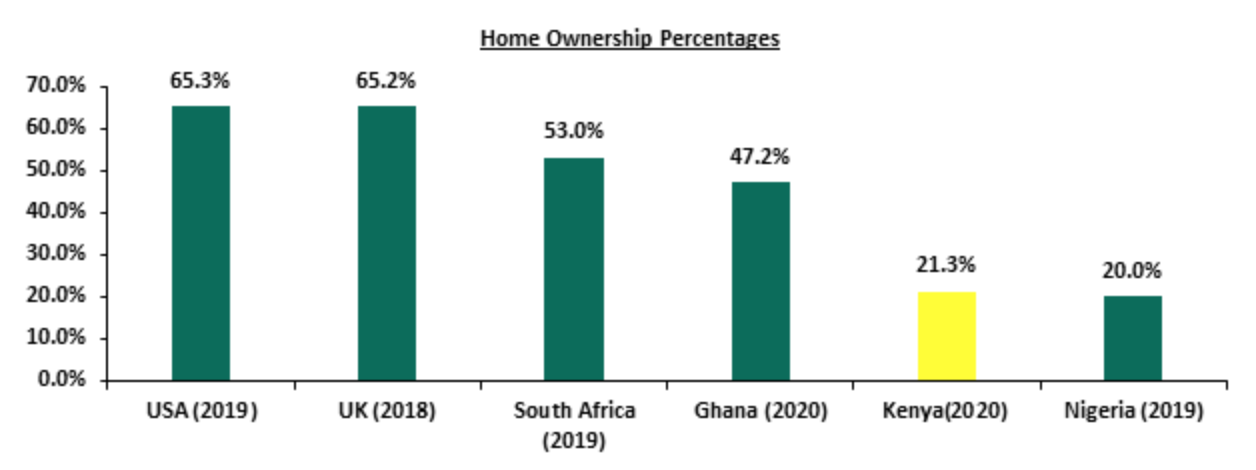
Source: Center for Affordable Housing Africa, Federal Reserve Bank
To address the low home ownership rate, the government established the Affordable Housing Initiative under Big 4 Agenda aimed at providing affordable housing for the low and middle income earners ranging from government and institutional housing, slum upgrading and private affordable homes. This led to the establishment of the Boma Yangu online platform, which facilitates the registration for housing allocations and has so far attracted at least 321,284 applications. The government, however, has only been able to hand over 716 units under the Pangani and Ngara Park Road Affordable Housing Projects. Other projects in the pipeline in the Nairobi Metropolitan Area (NMA) are Shauri Moyo, Starehe and River Estate.
- Housing Finance in Kenya
The main form of housing finance in the country is personal savings accounting for 54.0% of all housing financing alternatives while bank loans come in second at 19.0% according to the Kenya Bankers Association-Home Ownership Survey. The survey also shows that mortgages have continued to lag behind as a home financing alternative, accounting for only 6.0% and being the least sort option of the home financing.
The graph below shows home financing alternatives in Kenya;
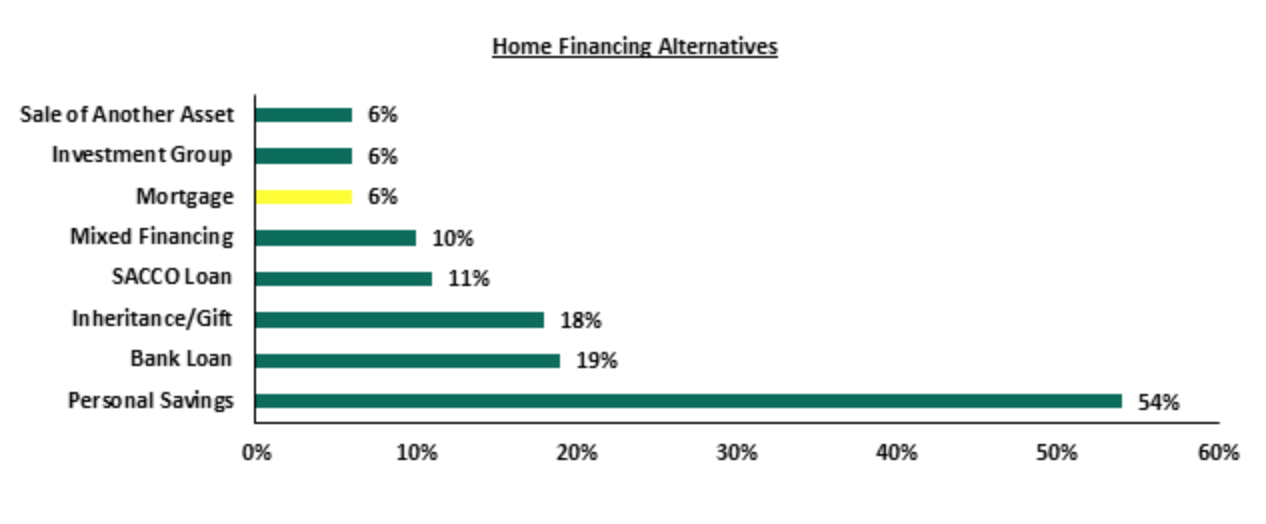
Source: Kenya Bankers Association (KBA)
According to the Central Bank of Kenya- Bank Supervision Annual Report 2020, the residential mortgage market recorded a 3.7% decline in the number of mortgage loans accounts, to 26,971 in December 2020 from 27,993 in December 2019. The overall value of mortgage loans outstanding therefore registered a 2.1% decline from Kshs 237.7 bn in December 2019 to Kshs 232.7 bn in December 2020. The performance decline of the mortgage market was mainly attributed to fewer mortgage loans advanced by banks, due to the effect of the Covid-19, depressed economy that caused an increase in mortgage defaults as well as a reduction in savings and disposable income. According to the same report, about 74.5% of lending to the mortgage market was by 6 institutions that is, one medium sized bank at 11.2% and five banks from the large peer group at 63.3% in FY’2020, compared to 76.1% of lending by 6 institutions in FY’2019, that is one medium sized bank at 16.9% and five banks from the large peer group at 59.2%. The interest rate charged on mortgages on average was 10.9% in 2020, compared to an average of 11.3% in 2019 reflecting a 0.4% reduction in average rates. The average loan maturity was 11.0 years with minimum of 4 years in 2020, compared to average loan maturity of 11.2 years with a minimum of 5 years in 2019. These reductions in average interest rates and minimum loan maturity periods are expected to accommodate more mortgage clients.
The graph below shows the number of mortgage loan accounts in Kenya over the last 10 years;
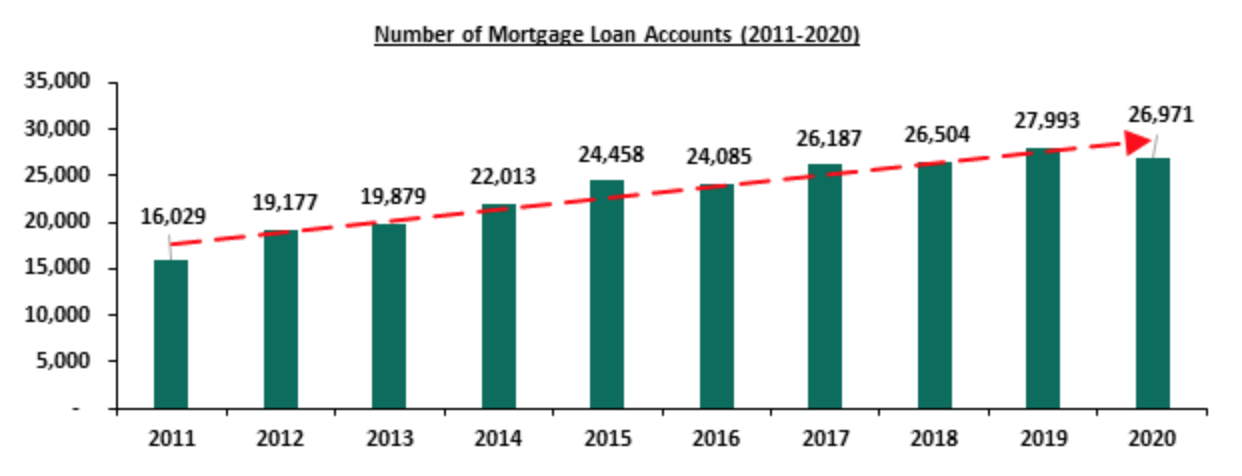
Source: Central Bank of Kenya (CBK)
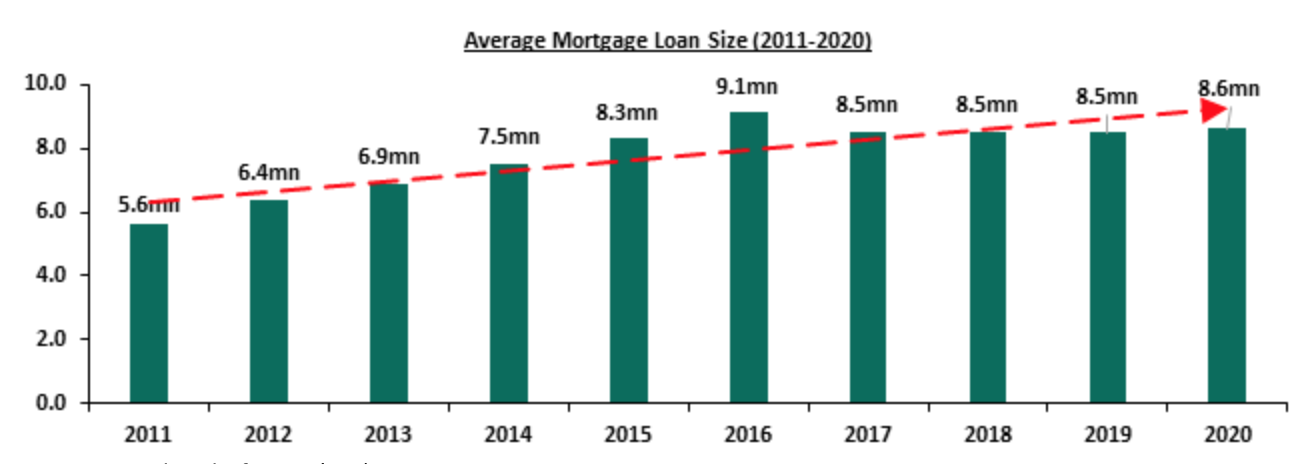
However, according to the CBK’s report, the average mortgage loan size increased from Kshs 8.5 mn in 2019 to Kshs 8.6 mn in 2020, with the government making efforts to avail relatively affordable mortgage facilities through the Kenya Mortgage and Refinance Company (KMRC) as banks tighten credit standards to the mortgage market in the midst of high loan default rates.
The graph below shows the average mortgage loan size from 2011 to 2020;
Source: Central Bank of Kenya (CBK)
With an average mortgage size of Kshs 8.6 mn and interest rates at 10.9% and a maximum tenor of 20 years, one is required to make monthly repayments of approximately Kshs 88,000 per month, which is unaffordable assuming a gross salary of Kshs 50,000 per month and that is the median household income in Kenya for the employed population. Given the above, the Kenya mortgage to GDP ratio has continued to lag behind at 2.2% as of 2020, compared to countries such as Namibia and South Africa at 18.9% and 16.2%, respectively as shown in the graph below;
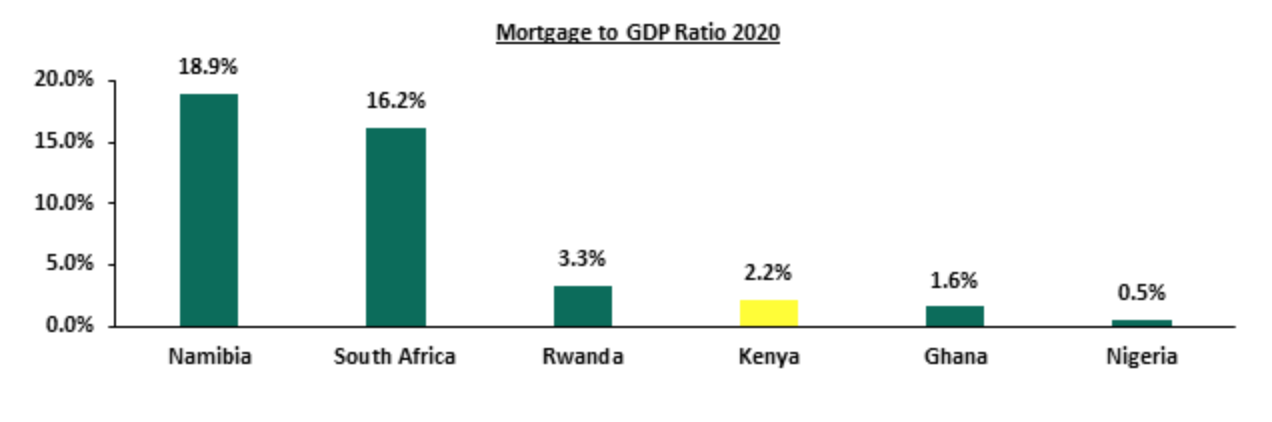
Source: Center for Affordable Housing Africa
The average mortgage loan size has increased by a 10-year CAGR of 4.4% while the average loan accounts have increased by a 10-year CAGR of 5.3% which is a positive trend. The increase in loan accounts over the ten years is attributable to the combined efforts by the government and the private sector players to avail affordable mortgages with flexible terms in order to accommodate more clients especially in the low and middle income bands thereby boosting home ownership rates.
- Overview of Kenya Mortgage Refinance Company
The Kenya Mortgage Refinance Company is a treasury backed lender, established in August 2018 and licensed for operations in September 2020, to provide long term funds to primary mortgage lenders such as banks, microfinance institutions and SACCOs in order to increase the availability and affordability of home loans to Kenyans. KMRC was established in a partnership between the Government of Kenya through the National Treasury, and World Bank with majority ownership by the private sector at 75.0% and the Government at 25.0%. Its current shareholders include;
|
KMRC Shareholders (As at 2020) |
|||
|
# |
Umbrella Body |
Individual Shareholders |
Estimated Stake (%) |
|
1 |
The Government of Kenya |
The Ministry of National Treasury and Planning |
25.0% |
|
2 |
Pan African Housing Developer |
Shelter Afrique |
8.4% |
|
3 |
World Bank |
International Finance Corporation (IFC) |
8.4% |
|
4 |
Commercial Banks |
Kenya Commercial Bank (KCB) Group, Cooperative Bank, Diamond Trust Bank (DTB), Housing Finance (HF) Group, NCBA, Absa Kenya, Stanbic and Credit Bank
|
43.3% |
|
5 |
Savings and Credit Co-operatives (SACCOs) |
Kenya Police, Mwalimu National, Safaricom, Ukulima, Bingwa, Imarisha, Unaitas, Imarika, Tower, Stima and Harambee SACCOs |
14.9% |
|
6 |
Microfinance Bank |
Kenya Women Microfinance Bank (KWFT).
|
|
Source: Online Research
KMRC provides concessional fixed rate long term loans to primary mortgage lenders so that they can transfer the benefits to individual borrowers, making home loans accessible and affordable to majority of Kenyans especially the low and middle income earners. In terms of products, KMRC offers two key loan products which include;
- Affordable housing loans: These are loans extended to Primary Mortgage Lenders (PMLs) to re-finance mortgage loans capped at Kshs 4.0 mn in Nairobi Metropolitan Area (Nairobi, Kiambu, Machakos & Kajiado) and Kshs 3.0 mn in other parts of the country to individual borrowers whose monthly household income is not more than Kshs 150,000. The loans are issued at a fixed rate of 5.0%, and,
- Marketing housing loans: These are loans extended to Primary Mortgage Lenders to re-finance mortgage loans above the Affordable Housing loans threshold of Kshs 4.0 mn, and income greater than 150,000.
KMRC refinances participating financial institutions (primary mortgage lenders) subject to refinancing eligibility criteria outlined below;
- Eligible property for refinancing must be a residential unit for owner occupation or occupation by immediate relatives of the owner,
- Eligible loans should be for purchase of a residential house for Kenyan citizens, salaried and self-employed, for a term up to 25 years,
- Interest rate is fixed at 5.0% and the currency must be in Kenyan Shillings with a mortgage loan limit of up to Kshs 4.0 mn for affordable housing loans within the Nairobi Metropolitan Area (NMA) and Kshs 3.0 mn elsewhere,
- Loan to Value Ratio (LVR) must be up to 90.0% of the value of the property implying a minimum deposit rate of 10.0% to be eligible for the loan,
- All loans submitted for refinance must be current and have no delinquencies, i.e. must not have history of default, and,
- The nominal value of pledged mortgage loans should exceed the aggregate outstanding balance of the loans to the financial institution by 120.0 % for example, for a mortgage loan Kshs 4.0 mn the value of the collateral should be at least Kshs 4.8 mn.
- KMRC Objectives, Achievements and Challenges
- Objectives of the Kenya Mortgage Refinance Company
Some of the key objectives of KMRC include;
- Provision of secure long-term funding at attractive rates to member institutions to enable them scale up their mortgage lending operations,
- Contributing to the growth of Kenyan capital markets through the issuance of KMRC bonds as a source of sustainable long-term fund,
- Standardization of mortgage practices in Kenya through enhancing capacity building to primary mortgage lenders,
- Facilitating the entry of new mortgage lenders in the market in order to broaden the scope of mortgage issuance and as a result increase competition among the primary lenders,
- Support lowering the cost of funds to primary mortgage lenders, which lead to a lowering of onward mortgage rates, thereby improving affordability and extending the range of potential borrowers, and,
- Facilitating member institutions to extend the mortgage maturity in line with the objective of long-term finance.
- KMRC Achievements
- Boosted Liquidity to Primary Mortgage Lenders: In December 2020, KMRC made its debut lending of Kshs 2.8 bn to primary mortgage lenders out of the total Kshs 4.5 bn that was available for refinancing. KCB Bank was the largest beneficiary of the KMRC funding at Kshs 2.1 bn, while Housing Finance (HF), Stima Sacco and Tower Sacco received an allocation of Kshs 515.0 mn, 69.0 mn and 30.0 mn, respectively. This lending was provided at a fixed rate of 5.0% for onward lending at single digit rates. In the for FY’2021/22 that began in July 2021, KMRC has tripled the lending allocation to Kshs 7.0 bn representing a 153.5% increase,
- Increased Mortgage Uptake in the Country: The lending to primary mortgage lenders at December 2020 refinanced a portfolio of 1,427 mortgages, at single digit interest rates to make them affordable to more clients and increase mortgage uptake. The boost in mortgage accounts came at an ideal time when mortgage accounts had declined by 1,022 accounts to 26,971 in December 2020 from 27,993 in December 2019, thus reducing further hemorrhage in the sector which was negatively impacted by the effects of Covid-19 pandemic,
- Encouraged Mortgage Market Competition for the Benefit of Borrowers: KMRC lending at 5.0% to primary mortgage lenders for onward lending at single digit rates has spurred competition among lending institutions particularly those offering higher interest rates. This has prompted them to revise their terms in order to remain competitive, thereby benefitting mortgage loan borrowers,
- Increased Capital for Refinancing: KMRC has since been able to receive debt financing of Kshs 25.0 bn from the World Bank and Kshs 10.0 bn from the African Development Bank. Equity from shareholder members accounts for Kshs 2.2 bn of the total Kshs 40.0 bn under management by the firm as at June 2021. Moreover, in the FY’2021/22 budget, KMRC received a Kshs 3.5 bn allocation from the government to refinance affordable housing in the country. In the company’s Annual General Meeting (AGM) held in June 2020, KMRC voted for International Finance Corporation (IFC), World Banks Private Investment arm, and Shelter Afrique, a Pan-African housing developer and financier, as the part of the Company’s shareholders with more equity injections expected in the company in the near future, and,
- Solving the Balance Sheet Mismatch PMLs to Encourage Long Tenor Mortgages: Due to the short term nature of deposits for many financial institutions, and the long term nature of mortgage loans at an average of 11 years and a maximum of 20 years in 2020, most of these financial institutions would shy away from mortgage lending to avoid future liquidity challenges and the uncertainty of variable interest rates to their cash flows. However, KMRC is now offering the institutions long term financing at a fixed rate of 5.0% which will enable them offer long tenor mortgages with minimal liquidity or interest rate risk concerns to reduce over dependence on deposits while offering loans.
- Challenges facing KMRC
- High Property Prices: Given the property price cap for affordable housing at the Nairobi Metropolitan Area, clients may run out of options for houses due to the high prices recorded in the area. During H1’2021, prices for detached units averaged at Kshs 12.3 mn while that of apartments averaged at Kshs 8.9 mn which are both higher than the affordable housing limits of Kshs 4.0 mn in the NMA region and Kshs 3.0 mn elsewhere.
The table below shows the performance of both apartments and detached units in the Nairobi Metropolitan Area (NMA) in H1’2021;
(All Values in Kshs unless stated otherwise)
|
Detached Units Performance H1’2021 |
|||||
|
Area |
Average Unit Size (SQM) |
Average of Price per SQM H1'2021 |
Price |
Average of Price Appreciation |
Average Total Returns H1'2021 |
|
High-End |
90 |
193,010 |
17.4 mn |
1.1% |
4.8% |
|
Upper Mid-End |
90 |
142,934 |
12.9 mn |
1.2% |
5.8% |
|
Lower Mid-End |
90 |
73,803 |
6.6 mn |
1.1% |
5.5% |
|
Average |
90 |
136,582 |
12.3 mn |
1.1% |
5.4% |
|
Apartments Performance H1’2021 |
|||||
|
Area |
Average Unit Size (SQM) |
Average of Price Per SQM H1'2021 |
Price |
Average of Price Appreciation |
Average Total Returns H1'2021 |
|
Upper Mid-End |
90 |
124,559 |
11.2 mn |
0.3% |
5.7% |
|
Suburbs |
90 |
95,611 |
8.6 mn |
0.9% |
6.2% |
|
Satellite Towns |
90 |
77,272 |
7.0 mn |
(0.9%) |
4.7% |
|
Average |
90 |
99,147 |
8.9 mn |
0.1% |
5.6% |
Source: Cytonn Research 2021
- High Default Rates Leading to a High Number of Non-Performing Loans (NPLs): According to Central Bank of Kenya-Quarterly Economic Review the residential gross NPLs in the real estate sector increased by 14.8 % to Kshs 70.5 bn in Q1’2021 from Kshs 61.4 bn recorded in Q4’2020, accounting for 15.9% of the total real estate loan book. The increase was attributed economic disruptions by the Covid-19 pandemic reducing cash flows and the ability to service debt. The high number of non-performing loans is expected to reduce loan advances as lenders will cushion themselves from credit risk that would expose them to possible collapse,
- Constrained and Unsustainable Funding Model: In an aim to consolidate more funds for onward lending, KMRC is likely to attract fewer investors as it seeks to both borrow and maintain lending at low rates, and as result face competition from government instruments which are offering higher rates. Some of the government bonds such as the 20-year bond are attracting a return of 13.2% and would seem more attractive to investors. It is therefore not clear how the firm will borrow and maintain lending at a 5.0% rate with the latest postponement of the green bond issue attributed to challenges surrounding rates, quantum and bond guarantee negotiations, and,
- Inability to Meet Criteria Threshold for Mortgage Products: The primary lending institutions have a set of eligibility criteria to meet before they can receive funding from KMRC mostly set under the World Bank and African Development Bank (AfDB) standards as discussed. Most of these requirements have not been met thus limiting the number of primary mortgage lenders for the loans.
- Case Study: Jordan Mortgage Refinance Company (JMRC)
- Introduction
Jordan Mortgage Refinance Company (JMRC) is a public shareholding company established in 1996 and headquartered in Amman Jordan, whose main purpose is providing medium and long-term financing for the Jordanian housing sector by extending loans to banks and financial institutions in the country. JMRC gets the necessary funding for its operations through member equity and issuing bonds in the local capital market through private or public subscription in accordance with the Jordan Securities Commission regulations.
- Ownership
The Central Bank of Jordan (CBJ) is the major shareholder of JMRC with an 18.0% shareholding while the private sector owns 82.0% as indicated in the table below;
|
JMRC Shareholding |
|||
|
# |
The Investors |
Value/No of shares |
Percentage |
|
1. |
The Central Bank of Jordan (CBJ) |
900 |
18.0% |
|
2. |
Social Security Corporation |
500 |
10.0% |
|
3. |
Housing & Urban Development Corporation |
500 |
10.0% |
|
4. |
Housing Bank for Trade and Finance |
500 |
10.0% |
|
5. |
Arab Bank |
500 |
10.0% |
|
6. |
Jordan Loan Guarantee Company |
300 |
6.0% |
|
9. |
Jordan Commercial Bank |
250 |
5.0% |
|
7. |
Jordan Ahli Bank |
245 |
4.9% |
|
8 |
Cairo Amman Bank |
245 |
4.9% |
|
10 |
Others |
1,045 |
21.2% |
|
Total |
100.0% |
||
Source: JMRC
- Eligibility Criteria
JMRC provides medium and long-term finance for banks and financial institutions. A refinance loan is granted to a financial institution that;
- Is privately owned, duly established and operating under the laws of the Hashemite Kingdom of Jordan provided that the JMRC shall have determined that such financial institution,
- Is in compliance with the legal and regulatory requirements applicable to its operations, including all applicable banking or financial or company laws, capital adequacy requirements, and monetary regulations,
- Has had its audited financial statements by independent auditors for its fiscal year, preceding the year within which its respective refinance loan agreement is to been entered into,
- Has a sound financial structure and satisfactory financial performance, in addition to having the management, staff, and other required resources for carrying out its operation efficiently, and,
- Has adequate technical and administrative capacity and satisfactory operating policies and procedures for appraisal and monitoring of a mortgage loan portfolio, and for carrying out its activities under the Housing finance and Urban Reform Project Agreement signed between the International Bank for Reconstruction and Development (IBRD) and JMRC.
- Achievements
- Successful Bond Issuance for Mortgage Funding: During H1’2021 JMRC issued 12 bonds with a nominal value of USD 0.125 bn (Kshs 13.7bn). The total amount of corporate bonds issued by JMRC since inception in 1996 is USD 3.0 bn (Kshs 325.8 bn). JMRC has issued its corporate bonds through private subscription and are collateralized by the company’s assets. The interest rate on latest JMRC 7-year bond issue in August 2021 at 4.4% reflects the low risk associated with the company, given that the government’s risk free rate for a 7-year bond is 4.1%. The funds raised through bond issue are incorporated in capital for refinancing to primary mortgage lenders.
The graph below show the value of bonds issued every year and since inception from 2016 to 2021;
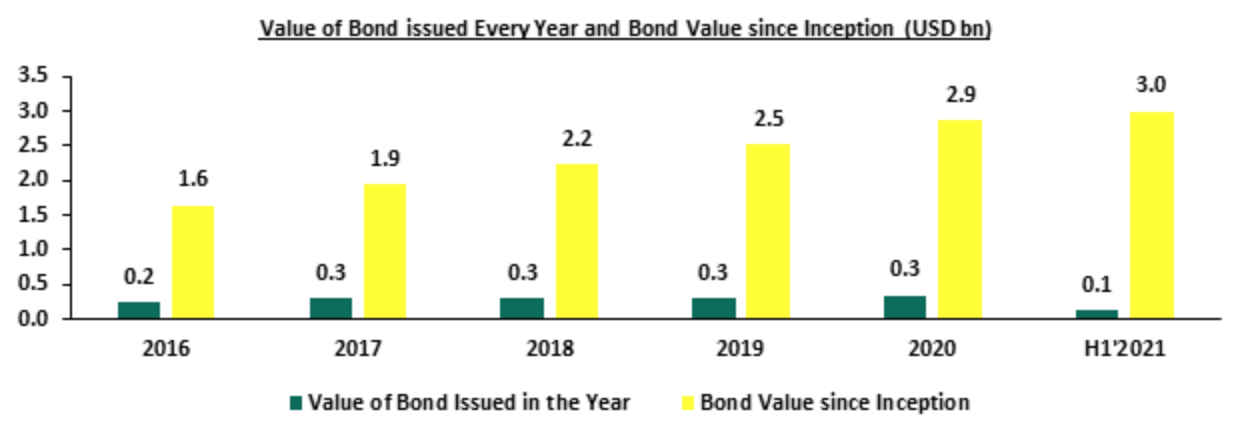
Source: JMRC
- Increased Capital to Primary Mortgage Lenders: In H1’2021, JMRC signed 12 refinance loan agreements with 8 financial institutions for an amount of USD 0.132 bn (Kshs 14.5 bn). The refinance loans agreements with primary lenders signed since JMRC’s inception are 338 with a total amount of USD 2.8 bn (Kshs 305.3 bn). This has continued to boost mortgage accounts by lenders and increasing the home ownership rates in the country.
The graph below shows the value of refinance loans granted every year and since inception from 2016 to H1’2021;
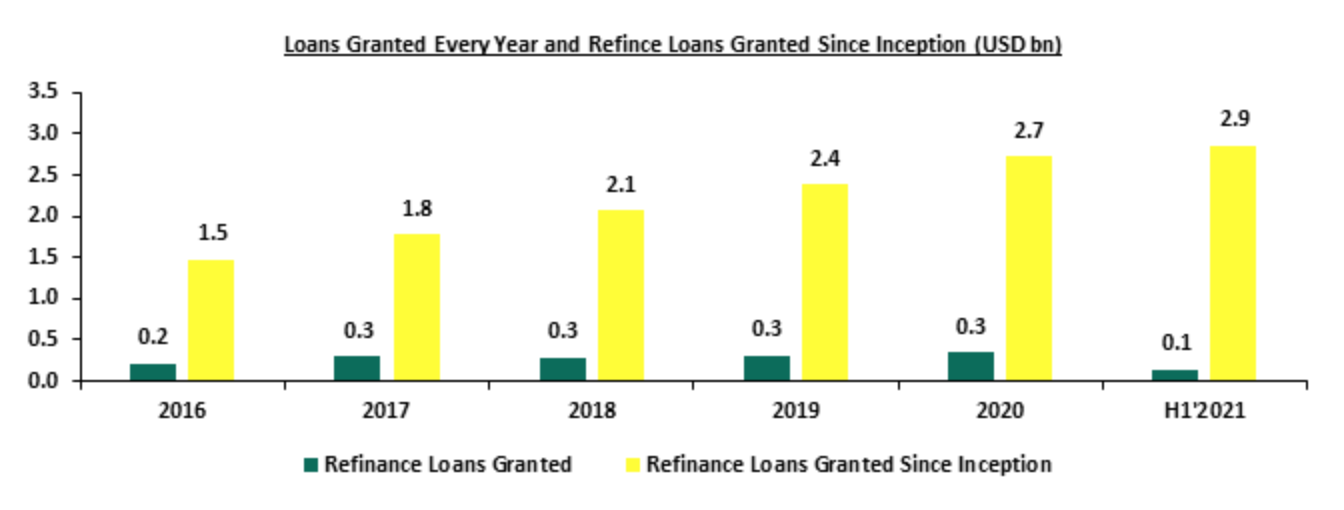
Source: JMRC
- Low Market Interest Rates to Mortgage Clients: In 2001, mortgage rates for major banks in Jordan ranged from 9.0%-11.0% but 20 years down the line, the rates have declined to between 5.6%-7.6% in the market and this can be partly attributable to the Kshs 305.3 bn in loans that KMRC has issued since inception. Primary mortgage lenders in Jordan are able to do onward lending at interest rates as low as 5.6% with a good example being the Bank of Jordan which offers up to 80.0% financing at such a low rate for tenures of up to 25 years. The Bank of Jordan is a shareholder of the JMRC with a 4.0% shareholding and thus is able to maintain capital liquidity from borrowing from the JMRC and lending at low rates, and,
- Low Risk Weighted Capital for Housing Loans: In Jordan the required risk weighted capital for housing loans is at 20.0% compared to Kenya’s recently lowered to 35.0% effective 1st July 2021, from the initial 50.0%. This has boosted liquidity and freed more funds available for refinancing and Jordan has therefore been able to reach to a larger number of primary mortgage lenders with 12 refinance agreements in H1’2021 and 338 since inception.
- Challenges facing JMRC
- Biased Mindset of the Banking Sector: The banking sector is reluctant to extend long term loans and consider JMRC as a competitor than a partner. They are contented with the short term variable rate lending they operate in and fear that that JMRC will aid other primary lenders into bringing stiff competition through reduced rates thus bringing down interest rates paid by their clients,
- Narrow Primary Mortgage Market: In Jordan, three Banks handle over 50.0% of the mortgage loan business which are often inclined to selling certificates of deposit as opposed to obtaining funds from JMRC. Even with much liquidity, banks have limits on how much they can borrow from JMRC. This limits the number of mortgage clients that can be reached at any particular point by the JMRC funding, and,
- Lack of Action in Fostering Regulatory Reform to Attract the Private Sector: Low political will has slowed the implementation of key reforms to catalyze housing supply by the private sector related to i) land availability in terms of restrictions on plot size and density, ii) the slow procedures and high costs in construction permits, iii) territorial planning, and, iv) zoning constraints. Despite that most of the proposed reforms have included specific deadlines, oversight committees, work-plans there is no clear coordination mechanisms to work this out.
- Recommendations from The Case Study
- KMRC Should Look to Boost Funding through issuance of bonds: JMRC has managed to raise funds through issuing of bonds which has enabled the company maintain cash flows for lending. In H1’2021 JMRC issued 12 bonds with a nominal value of USD 0.125 bn (Kshs 14.5 bn) and the total amount of corporate bonds issued by JMRC since inception till H1’2021 are USD 3.0 bn (Kshs 305.3 bn). The Kenya Mortgage Refinance Company (KMRC) bond issue that was scheduled for September 2021 was postponed pending stakeholder consultations leading to delayed funding for potential refinancing. We recommend that KMRC pursue the credit guarantee agreement with African Development Bank as planned, and leverage on their high credit score at AAA with a prospect status to reduce risk exposure and increase in investor appetite,
- Increase Capital and Investor Confidence through Listing in the Stock Exchange: JMRC was listed in the Amman Stock Exchange in 2011. After the listing, the net revenue has increased at an 8-year CAGR of 16.2% from USD 13.3 mn (Kshs 1.5 bn) in 2012 to an estimated USD 44.4 mn (Kshs 4.9 bn) as at FY’2020. Listing not only helps improve capital by raising funds from the general public, it also helps build confidence from investors since financials are publicly available and listed companies are viewed to have stronger regulation and scrutiny. KMRC should in its long term plans look to list on the Nairobi Stock Exchange (NSE) in order to increase funding and grow investor confidence,
- In the Long Run and in Consultation with CBK, KMRC Should Look to Lower the Risk Weighted Capital Further to Improve Liquidity: Since one of the criteria for mortgage loan refinancing by KMRC is an over collateralization by 120.0% of the balance of the loan, KMRC in consultation with CBK should look to improve liquidity with the primary mortgage lenders even further, by reducing the risk weighted capital for individual housing loans to lower than the current 35.0%. This will free more funds for onward lending thereby boosting mortgage uptake in the country, and,
- Growing Public Awareness is Key: KMRC should look to grow its public awareness by innovating ways to market its affordable mortgage products and expound on the eligibility criteria for loans with primary mortgage lenders. JMRC has participated in conferences such as the Jordan Leasing Conference, awareness campaigns and fostered cooperation with Central Bank of Jordan (CBJ) and commercial banks, to bring together employees, borrowers and mortgage lenders. This has provided them with the relevant training through enrollment in structured courses with benchmarks in international markets. For Kenya, public awareness is timely given that formal housing finance through banks accounts for less than 10.0% of the total housing finance alternatives.
- Conclusion
In our view, KMRC has so far performed well, one year after operationalization in terms of improving liquidity with lending institutions and contributing towards the increase in mortgage uptake in the country, with the debut Kshs 2.8 bn loan issue so far servicing 1,427 mortgage loans. However, in order to achieve its 5-year objective of financing over 50,000 homes, KMRC needs to increase its fund base by fast tracking its green bond issue and fostering worldwide partnerships to not only learn, but also acquire more funding. To complement KMRCs efforts to achieve higher home ownership rates, the government needs to take a number of steps in supporting affordable housing including: i) encouraging the use of alternative building materials to lower construction costs, ii) reviewing the public private partnership framework to enhance effectiveness iii) fast-tracking incentives, and, iv) allocating more funds into the refinance company to boost liquidity and subsequent mortgage uptake.
Disclaimer: The views expressed in this publication are those of the writers where particulars are not warranted. This publication, which is in compliance with Section 2 of the Capital Markets Authority Act Cap 485A, is meant for general information only and is not a warranty, representation, advice or solicitation of any nature. Readers are advised in all circumstances to seek the advice of a registered investment advisor

- Talk to us
- Kenya
- P.O Box 20695 - 00200, Nairobi, Kenya
- Cell +254709101200
- Tel +254709101200
- WhatsApp +254741676635
- United States
- +254709101200
- DOWNLOAD OUR APP
-


- Kenya
- 8th Floor, Pinetree Plaza, Kaburu Drive, Ngong Road, Nairobi, Kenya
- USA
- Suite 1150, 1775 Eye Street NW, USA, Washington DC 20006, USA
- Investments
- High Yield
- Private Equity
- Real Estate
- Real Estate
- RiverRun Estates
- Cytonn Towers
- The Ridge
- Taraji Heights
- The Alma