Cytonn H1’2021 Markets Review
By Research Team, Jul 4, 2021
Executive Summary
Global Markets Review
According to the World Bank’s June 2021 report, the Global Economy is projected to grow at a rate of 5.6% in 2021, up from the initial growth outlook of 4.0%, making it the strongest post-recession pace in 80 years. The growth is broad-based with advanced economies projected to grow at 5.4% while Developing and emerging markets are projected to grow at 6.0%. The key challenges remain the distribution of the vaccines, the high trading costs and potential increase in inflation;
Sub-Saharan Africa Regional Review
The World Bank and the International Monetary Fund (IMF) project that the Sub-Saharan Regional GDP growth for 2021 will come in at 2.8% and 3.4% respectively, which is higher than their earlier projections of 3.0% but lower than 3.1%, respectively. The region’s growth will be driven by positive spill overs from strengthening global activity, improved global control of the COVID-19 pandemic and strong domestic activity in agricultural commodity exporters.
The select currencies recorded a mixed performance against the US Dollar with the South African rand being the largest gainer and the Mauritius Rupee being the largest decliner. During the first half of 2021, Africa’s appetite for foreign-denominated debt continued, with the latest issues during the period being Benin, Ivory Coast, Ghana and Kenya which raised a total of USD 6.1 bn with an average subscription rate of 3.5x. Additionally, Sub-Saharan Africa (SSA) stock markets recorded mixed performance in H1’2021, with most of the markets recording positive returns, attributable to foreign investors’ activities as they sort for higher returns;
Kenya Macroeconomic Review
According to the National Treasury, the Kenyan economy is projected to register a GDP growth of 6.6% in 2021, supported by increased economic activity following the reopening of the country. During the first half of 2021, the country saw its ratings revised downwards by Standard & Poor’s, a US based ratings agency, to 'B' from 'B+’, while Fitch Ratings affirmed Kenya's Long-Term Foreign-Currency Issuer Default Rating (IDR) at 'B+' with a Negative Outlook. The key concerns are the high debt levels and the fact that the COVID-19 pandemic has made it more difficult to achieve Fiscal Consolidation. The average inflation rate for H1’2021 increased to 5.9%, compared to 5.6% in H1’2020, attributable to the sharp increase in oil prices in H1’2021 which are up 43.3%. The business environment registered some improvement in the economic activity as measured by the average Stanbic Purchasing Managers Index (PMI), which increased to 49.7 in the first five months of 2021 from 42.2 in the H1’2020;
Fixed Income
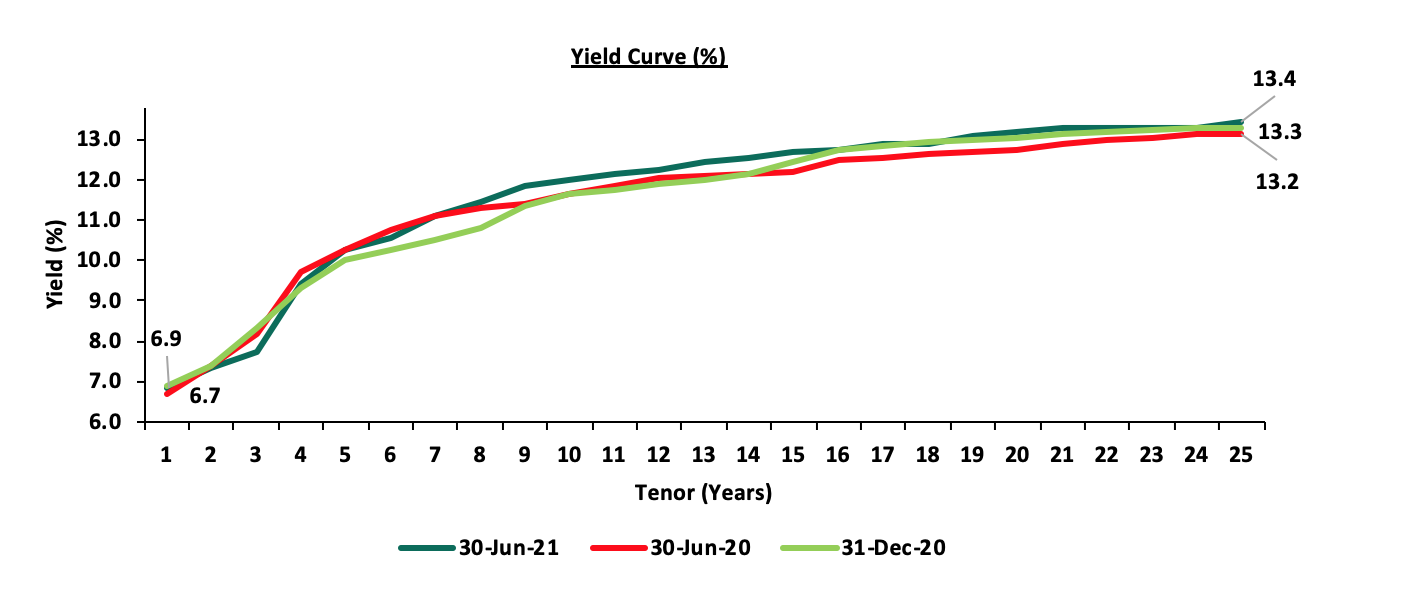
During the first half of 2021, T-bills remained oversubscribed, with the overall subscription rate coming in at 104.7%, down from 152.8% in H1’2020. The oversubscription was partly attributable to the investors continued preference for shorter-dated papers as they looked to avoid duration risks especially during this period of uncertainty. The average yields on the 364-day and 182-day papers declined to 7.7% and 7.3% in H1’2021, from 8.2% and 7.4%, respectively, recorded in H1’2020, while the yields on the 91-day T-bill increased to 6.9% in H1’2021, from 6.7% recorded in H1’2020. The yield curve remained relatively stable with a slight decline in the short end but a slight increase in the medium to long end led to 1.2% decline in the FTSE bond index.
During the week, T-bills remained oversubscribed, with the overall subscription rate coming in at 130.6%, an increase from the 105.6% recorded the previous week. The 91-day paper recorded the highest subscription rate, receiving bids worth Kshs 10.0 bn against the offered Kshs 4.0 bn, translating to a subscription rate of 252.0%, a decline from the 267.7% recorded the previous week. The oversubscription of the 91-day paper is partly attributable to the higher risk adjusted return offered by the paper given the decline in the rates of the other papers. The subscription rate for the 364-day paper declined to 73.2%, from 90.4% recorded the previous week, while the subscription rate for the 182-day paper increased to 139.5%, from 56.0% recorded the previous week. The yields on all the three papers declined; with the 91-day, 182-day and 364-day paper declining by 13.2 bps, 8.9 bps and 6.8 bps, to 6.7%, 7.2% and 7.7%, respectively. The government continued to reject expensive bids, accepting Kshs 25.4 bn out of the Kshs 31.4 bn worth of bids received, translating to an acceptance rate of 81.2%;
Equities
During Q2’2021, the equities market was on an upward trajectory, with NASI, NSE 25 and NSE 20 gaining by 9.4%, 6.8% and 4.4%, respectively, taking their H1’2021 to gains of 14.1%, 10.5%, and 3.2% for NASI, NSE 25 and NSE 20 respectively. The equities market performance during the quarter was driven by gains recorded by large cap stocks such as Equity Group, EABL, and Safaricom of 17.9%, 14.4%, and 14.3%, respectively. During the week, the equities market recorded mixed performance with NSE 20 and NSE 25 gaining by 1.5% and 0.9%, respectively, while NASI declined marginally by 0.2%, taking their YTD performance to gains of 12.6%, 10.9% and 3.0%, for NASI, NSE 25 and NSE 20, respectively. The equities market performance was mainly driven by gains recorded by large-cap stocks such as Bamburi, BAT Kenya and Cooperative Bank, of 8.1%, 4.2%, and 3.1%, respectively. The gains were however weighed down by losses recorded by ABSA Bank, KCB Group and Diamond Trust Bank (DTB-K), which declined by 5.2%, 3.1% and 1.7%, respectively;
Real Estate
During the H1’2021, the real estate sector recorded increased activities following the reopening of the economy which saw an improved business environment. The residential sector recorded improvements on both average q/q and y/y performances with average total returns at 5.5%, a 0.8% points y/y increase from 4.7% of total average returns recorded in FY’2020, and a 0.4% q/q increase from 5.1% recorded in Q1’2021. The commercial office sector recorded 0.1% and 1.9% points decline in the average rental yields and occupancy rates to 6.9% and 76.3% in H1’2021, from 7.0% and 77.7%, respectively in FY’2020. The retail sector performance in H1’2021 recorded a slight improvement of 0.1% in the rental yield to 7.6% from 7.5% in FY’2020 attributed to increased market activities in the retail front. The land sector continued to show resilience despite the pandemic recording an overall annualized capital appreciation of 1.6%.
Investment Updates:
- Weekly Rates:
- Cytonn Money Market Fund closed the week at a yield of 10.14%. To invest, just dial *809#;
- Cytonn High Yield Fund closed the week at a yield of 15.53% p.a. To invest, email us at sales@cytonn.com and to withdraw the interest you just dial *809#;
- We continue to offer Wealth Management Training daily, from 9:00 am to 11:00 am, through our Cytonn Foundation. The training aims to grow financial literacy among the general public. To register for any of our Wealth Management Trainings, click here;
- If interested in our Private Wealth Management Training for your employees or investment group, please get in touch with us through wmt@cytonn.com;
- Cytonn Insurance Agency acts as an intermediary for those looking to secure their assets and loved ones’ future through insurance namely; Motor, Medical, Life, Property, WIBA, Credit and Fire and Burglary insurance covers. For assistance, get in touch with us through insuranceagency@cytonn.com;
- Cytonnaire Savings and Credit Co-operative Society Limited (SACCO) provides a savings and investments avenue to help you in your financial planning journey. To enjoy competitive investment returns, kindly get in touch with us through clientservices@cytonn.com;
Real Estate Updates:
- For an exclusive tour of Cytonn’s real estate developments, visit: Sharp Investor's Tour, and for more information, email us at sales@cytonn.com;
- Phase 3 of The Alma is now ready for occupation. To rent please email properties@cytonn.com;
- We have 10 investment-ready projects, offering attractive development and buyer targeted returns. See further details here: Summary of Investment-ready Projects;
- For recent news about the group, see our news section here.
Hospitality Updates:
- We currently have promotions for Staycations, visit cysuites.com/offers for details or email us at sales@cysuites.com.
Introduction
According to the World Bank’s June 2021 report, the global economy is projected to grow at a rate of 5.6% in 2021, 1.6% points higher than their initial outlook of 4.0%, largely driven by a projected 6.0% growth in emerging markets and developing economies, coupled with a 5.4% growth in advanced economies. Key to note, the 5.6% projected growth is the strongest post-recession pace in 80 years. The global recovery is however uneven, with advanced economies rebounding while developing countries lag behind driven by the unequitable vaccine access and distribution. The economic growth shall be largely supported by how fast the vaccines shall be distributed and the strength of the Fiscal and monetary measures put in place. The key challenges going forward shall be the increasing inflation rates globally due to high commodity prices and the high cost of trade due to shipping and logistical strains globally.
Commodity Prices:
The high demand for commodities has led to the prices increasing to the pre-pandemic levels led by energy and metal prices which are up 58.2% and 57.7% respectively. The prices of precious metals have registered muted growth as investors participate in other attractive asset classes like long-term bonds. Below is a summary performance of various commodities:
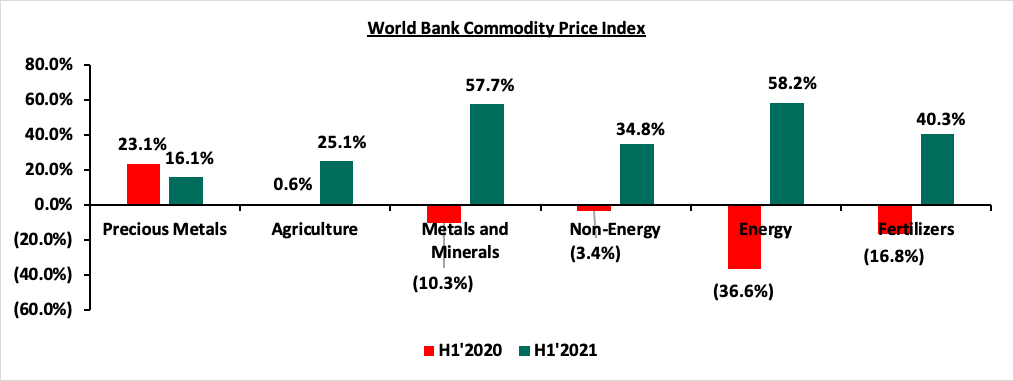
Source: World Bank
According to the World Bank and the International Monetary Fund (IMF), the Sub Saharan economy is projected to grow at a rate between 3.4% and 2.8% in 2021 following a 2.4% decline in 2020 supported by recovering commodity prices and improving economic activity following the re-opening of most economies. There are still risks to these outlooks given subsequent waves of the virus, the governments’ high debt levels and historical challenges such as political instabilities in some of the countries.
Debt sustainability in the region continues to be a major concern and as per World Bank’s Africa’s Pulse April 2021, SSA’s public debt is projected to rise further to 69.0% of GDP in 2021, from 65.0% in 2020. Most African countries continued participating in Paris and Non-Paris club Debt Service Suspension initiatives in the first half of 2021 in a bid to manage their overall debt burden. According to the IMF’s Regional Economic Outlook, seventeen countries were in debt distress which is one more than before the pandemic. This is due to significant shortfalls in revenue collection and depreciating local currencies which in turn make debt servicing more expensive.
Currency Performance
Following a sharp depreciation of currencies in 2020, we have seen most currencies recover with South Africa gaining by 2.6% and Kenya at 1.2%. The Mauritius Rupee is the worst performer YTD given the low economic activity and the structure of its economy. The Zambian Kwacha is the largest decliner over the last twelve months having lost 24.9% due to the high demand for debt repayment by the government. Going forward, the increase in commodity prices will see commodity driven economies perform better due to increased dollar inflows from the higher prices which will support their currencies.
Below is a table showing the performance of select African currencies:
|
Select Sub Saharan Africa Currency Performance vs USD |
|||||
|
Currency |
Jun-20 |
Dec-20 |
Jun-21 |
Last 12 Months change (%) |
YTD change (%) |
|
South African Rand |
17.3 |
14.7 |
14.3 |
17.3% |
2.6% |
|
Ugandan Shilling |
3719.1 |
3647.0 |
3556.8 |
4.4% |
2.5% |
|
Kenyan Shilling |
106.5 |
109.2 |
107.9 |
(1.3%) |
1.2% |
|
Ghanaian Cedi |
5.7 |
5.8 |
5.8 |
(1.8%) |
0.7% |
|
Botswana Pula |
11.9 |
10.8 |
10.8 |
9.2% |
0.4% |
|
Tanzanian Shilling |
2313.0 |
2314.0 |
2319.0 |
(0.3%) |
(0.2%) |
|
Malawian Kwacha |
728.4 |
763.2 |
805.8 |
(10.6%) |
(5.6%) |
|
Zambian Kwacha |
18.1 |
21.1 |
22.6 |
(24.9%) |
(6.9%) |
|
Nigerian Naira |
360.0 |
380.7 |
410.5 |
(14.0%) |
(7.8%) |
|
Mauritius Rupee |
40.0 |
39.6 |
42.7 |
(6.8%) |
(8.0%) |
African Eurobonds:
Africa’s appetite for foreign-denominated debt has increased in recent times with the latest issuers during the first half of 2021 being Benin, Ivory Coast, Ghana and Kenya raising a total of USD 6.1 bn which translates to a 3.5x subscription rate. The high support is driven by the yield hungry investors and also the outlook of positive recovery in the regional economies.
Below is a 5 year graph showing the Eurobond secondary market performance of select 10-year Eurobonds issued by the respective countries:
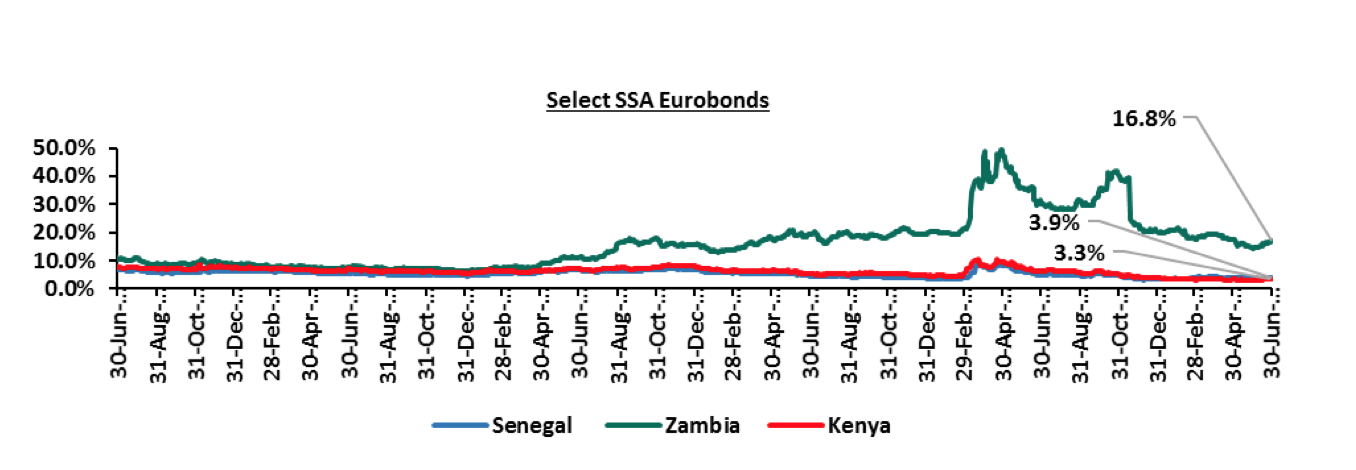
Source: Reuters
Key Take outs from the chart:
- Yields on the Zambia Eurobond declined in H1’2021 by 3.4% points to 16.8%, from 20.2% recorded at the end of December 2020. The decline is partly attributable to; the rising copper prices that have improved the economic prospects of the country coupled with the government’s efforts on debt sustainability which has aided in regaining some of the investors’ confidence. Yields on the Zambia Eurobond however remain relatively high, owing to the high risk attached to the country as it failed to honor its service obligations of a USD 42.5 mn Eurobond coupon in November 2020 and is still struggling with high debt levels which are currently above 100.0% of the GDP,
- Yields on the Kenya Eurobond also declined by 0.6% points to 3.3%, from 3.9% recorded at the end of December 2020, partly attributable to improved investor confidence following the announcement of the IMF Credit Facility that came with conditions meant to enforce fiscal consolidation and ensure debt sustainability in Kenya, and,
- Yields on the Senegal Eurobond increased by 0.7% points to 3.9% from 3.2% recorded at the end of December 2020, attributable to the economic decline due to the COVID-19 pandemic with the tourism and transport sectors being some of the hardest hit sectors.
Equities Market Performance
Sub-Saharan Africa (SSA) stock markets recorded a mixed performance in H1’2021, with most of the markets recording positive returns, attributable to foreign investors’ activities as they looked for higher returns. The Ghanaian Stock market (GGSECI) was the best performing index with a 36.6% YTD gain, supported by a stable economy and currency. Nigeria’s NGSEASI was the worst-performing index with losses of 12.8% YTD, attributable to capital flight to other asset classes, mostly fixed income where the yields have gone up since the start of the year. The devaluation of the currency in 2021 as well as the souring inflation, which has been above 20.0%, has led to poor market performance, elevating the risks caused by the pandemic. Below is a summary of the performance of key indices:
|
Equities Market Performance (Dollarized*) |
||||||
|
Country |
Index |
Jun-20 |
Dec-20 |
Jun-21 |
Last 12 Months change (%) |
YTD change (%) |
|
Ghana |
GGSECI |
330.6 |
332.5 |
454.2 |
0.6% |
36.6% |
|
Uganda |
USEASI |
0.4 |
0.4 |
0.4 |
(10.0%) |
16.7% |
|
Kenya |
NASI |
1.3 |
1.4 |
1.6 |
7.2% |
15.4% |
|
South Africa |
JALSH |
3138.5 |
4069.0 |
4626.1 |
29.6% |
13.7% |
|
Zambia |
LASILZ |
216.8 |
185.2 |
205.5 |
(14.6%) |
11.0% |
|
Tanzania |
DARSDSEI |
1.5 |
1.5 |
1.6 |
(0.3%) |
4.9% |
|
Rwanda |
RSEASI |
0.2 |
0.2 |
0.2 |
(25.0%) |
0.0% |
|
Nigeria |
NGSEASI |
68.0 |
105.8 |
92.2 |
55.6% |
(12.8%) |
|
*The index values are dollarized for ease of comparison |
||||||
Source: Reuters
GDP growth in Sub-Saharan Africa region is expected to recover gradually in 2021, in line with the rest of the global economy. The region still faces key challenges among them the COVID-19 pandemic with the region experiencing a slow distribution of the vaccines. Additionally, some of the countries are suffering from high debt levels that increased to 69.0% from 65.0% in 2020 making them less attractive to foreign capital. The significant weakening of the currencies has made debt service also become very expensive.
Following an economic contraction in 2020, The Kenyan Economy is projected to grow at an average of 5.4% in 2021 according to various organizations as shown below:
|
No. |
Organization |
2021 Projections |
|
1. |
International Monetary Fund |
7.6% |
|
2. |
National Treasury |
6.6% |
|
3. |
World Bank |
4.5% |
|
4. |
S&P Global |
4.4% |
|
5. |
Cytonn Investments Management PLC |
4.0% |
|
Average |
5.4% |
|
Source: Cytonn Research
The growth is largely supported by the gradual recovery of the business environment more so in sectors such as trade and tourism which were the worst hit by the pandemic in 2020. According to the recently released Kenya Economic Update report on Kenya by the World Bank, economic growth is expected to be driven by;
- An upturn in economic activity attributable to the reopening of the economy,
- Moderate recovery in the service sector as the vaccine rollout continues to pick up pace, and,
- Adequate agricultural output and sales, aided by rising external demand from the gradually reopening global economy.
There was a general optimism in the first half of the year, with the average Stanbic Bank Monthly Purchasing Managers’ Index (PMI) for the first five months averaging 49.7, which is higher than the 42.4 recorded in H1’2020, pointing to a solid improvement in the private sector.
Inflation:
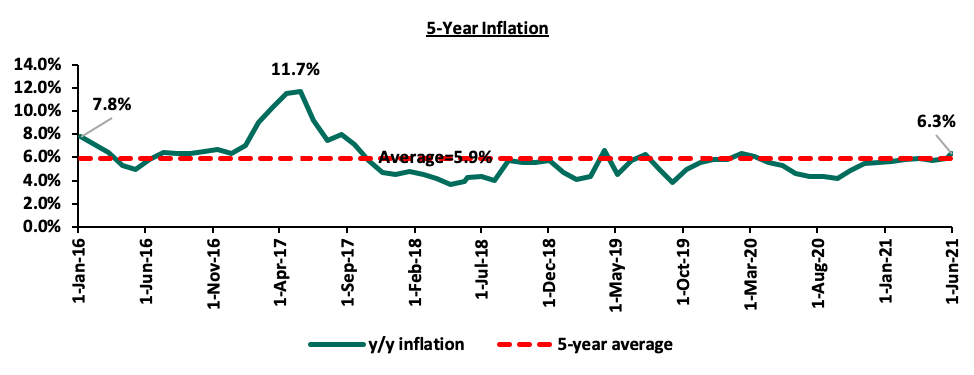
The average inflation rate increased to 5.9% in H1’2021, compared to 5.6% in H1’2020, attributable to the sharp increase in oil prices in H1’2021, which are up 43.3%. Inflation for the month of June 2021 came in at 6.3%, the highest since February 2020, and an increase from the 5.9% recorded in May, attributable to a 13.5% increase in the fuel index, an 8.5% increase in the food and beverages index and a 2.6% increase in the Non-food and fuel index during the month. Going forward, we expect inflation to remain within the government’s target range of 2.5% - 7.5%, mainly due to the rising global fuel prices and the expiry of the tax measures at the start of the year.
Below is the inflation chart for the last five years:
The Kenya Shilling:
The Kenya Shilling appreciated against the US Dollar by 1.2% in H1’2021, to close at Kshs 107.9, from Kshs 109.2 at the end of Q4’2020, partly attributable to dollar inflows from the Eurobond issue in addition to IMF and World Bank loan disbursements in Q2’2021. During the week, the Kenya Shilling depreciated against the US Dollar by 0.2% to close at 108.0, from 107.8 the previous week. Despite the appreciation witnessed in the first half of 2021, we expect the shilling to remain under pressure as a result of:
- Rising uncertainties in the global market due to the Coronavirus pandemic, which has seen investors continue to prefer holding their investments in dollars and other hard currencies and commodities, and,
- Demand from merchandise traders as they beef up their hard currency positions in anticipation for more trading partners reopening their economies globally.
The shilling is however expected to be supported by:
- The Forex reserves, currently at USD 9.5 bn (equivalent to 5.8-months of import cover), which is above the statutory requirement of maintaining at least 4.0-months of import cover, and the EAC region’s convergence criteria of 4.5-months of import cover. Key to note, there was an increase in the forex reserves attributable to proceeds of the Eurobond issue coupled with the USD 407.0 mn IMF disbursement and the USD 130.0 mn World Bank loan financing received during the week,
- The stable current account position which is estimated to remain at a deficit of 5.2% of GDP in 2021, and,
- Improving diaspora remittances evidenced by a 22.3% y/y increase to USD 315.8 mn in May 2021, from USD 258.2 mn recorded over the same period in 2020, which has continued to cushion the shilling against further depreciation.
Monetary Policy:
The Monetary Policy Committee (MPC) met thrice in H1’2021, maintaining the Central Bank Rate (CBR) at 7.00% for the nine consecutive sitting. The MPC held that the current accommodative monetary policy measures are still needed and are sufficient to support the economy.
Fiscal Policy:
The Kenyan budget for the FY’2021/2022 National Budget is projected at Kshs 3.0 tn, a 4.8% increase from the Kshs 2.9 tn final FY’2020/21 budget. The government projected that total revenue will increase by 10.3% to Kshs 2.0 tn, from the Kshs 1.8 tn in FY’2020/2021, with the increase largely being projected to come from ordinary revenue. The projected revenues were mainly pegged on Kenya’s economic recovery, broadening the tax base and tax reforms. For more information, see our note on Kenya’s FY’2021/2022 Budget Review,
On the FY’2021/2022 outturn, it is projected that the government shall be below its budget having spent Kshs 2.4 tn, equivalent to 80.1% of the revised budget of Kshs 2.9 tn and the total collections stood at Kshs 2.4 tn, equivalent to 80.1% of the revised target of Kshs 2.9 tn for the first 11 months of FY’2021/2022. The total borrowings stood at Kshs 895.0 bn as at 31st May 2021, equivalent to 70.3% of the revised borrowing target of Kshs 1.3 bn.
Going forward, we still expect the government will continue to lag behind in collections in the current fiscal year due to the low economic activity.
Weekly Highlights:
- World Bank Loan
During the week, the World Bank Board of Executive Directors approved a USD 130.0 mn (Kshs 14.0 bn) additional loan financing for the Kenya COVID-19 Health Emergency Response Project to facilitate affordable and equitable access to COVID-19 vaccines for Kenyans. The funding will enable Kenya to procure more vaccines through the African Vaccine Acquisition Task Team (Avatt) and the COVID-19 Vaccines Global Access (Covax) facilities in addition to supporting the deployment of the vaccines by boosting the country’s cold-storage capacity. The funding is the second additional financing for the Kenya COVID-19 Health Emergency Response Project, bringing World Bank’s total contribution to USD 140.0 mn (Kshs 15.1 bn) under the project. Since the start of the pandemic, World Bank’s total contribution to Kenya’s COVID-19 response now stands at USD 246.0 mn (Kshs 26.5 bn).
The World Bank funding will enhance the country’s COVID-19 response by financing the acquisition of additional vaccines and establishment of 25 county vaccination stores in addition to boosting the vaccines storage capacity. In our view, the financing will also facilitate the country’s target of 10 mn fully vaccinated Kenyans by December 25th 2021, which will in turn boost the country’s economic recovery.
Money Markets, T-Bills & T-Bonds Primary Auction:
During the first half of 2021, T-bills were oversubscribed, with the overall subscription rate coming in at 104.7%, down from 152.8% in H1’2020. The oversubscription was partly attributable to the continued preference for shorter-dated papers by investors looking to avoid duration risk especially during this period of uncertainty. Overall subscriptions for the 91-day, 182-day, and 364-day papers came in at 81.8%, 55.3% and 161.4% in H1’2021, from 133.4%, 80.1% and 228.1% in H1’2020, respectively, with investors’ participation remaining skewed towards the 364-day paper. The average yields on the 364-day and 182-day papers declined to 7.7% and 7.3% in H1’2021 from 8.2% and 7.4%, respectively, recorded in H1’2020, as the Central Bank of Kenya continued to reject expensive bids, with the yields on the 91-day T-bill increasing to 6.9% in H1’2021, from 6.7% recorded in H1’2020. The acceptance rate in H1’2021 increased to 79.7%, from 60.1% in H1’2020, with the government accepting a total of Kshs 516.5 bn of the Kshs 680.8 bn worth of bids received in H1’2021.
During the week, T-bills remained oversubscribed, with the overall subscription rate coming in at 130.6%, an increase from the 105.6% recorded the previous week. The 91-day paper recorded the highest subscription rate, receiving bids worth Kshs 10.0 bn against the offered Kshs 4.0 bn, translating to a subscription rate of 252.0%, a decline from the 267.7% recorded the previous week. The oversubscription of the 91-day paper is partly attributable to the higher risk adjusted return offered by the paper given the decline in the rates of the other papers. The subscription rate for the 364-day paper declined to 73.2%, from 90.4% recorded the previous week, receiving bids worth Kshs 7.3 bn against the offered amounts of Kshs 10.0 bn, while the subscription rate for the 182-day paper increased to 139.5%, from 56.0% recorded the previous week, receiving bids worth Kshs 13.9 bn against the offered amounts of Kshs 10.0 bn. The yields on all the three papers declined; with the 91-day, 182-day and 364-day paper declining by 13.2 bps, 8.9 bps and 6.8 bps, to 6.7%, 7.2% and 7.7%, respectively. The government continued to reject expensive bids, accepting Kshs 25.4 bn out of the Kshs 31.4 bn worth of bids received, translating to an acceptance rate of 81.2%.
Primary T-Bond Auctions in H1’2021
During H1’2021, the Government issued eleven Treasury bonds seeking to raise Kshs 333.0 bn and they were generally oversubscribed receiving bids totaling Kshs 505.5 bn. The government was keen to maintain low rates only accepting Kshs 370.9 bn. The table below provides more details on the bonds issued during the period:
|
Issue Date |
Bond Auctioned |
Effective Tenor to Maturity (Years) |
Coupon |
Amount offered (Kshs bn) |
Actual Amount Raised (Kshs bn) |
Total bids received |
Average Accepted Yield |
Subscription Rate |
Acceptance Rate |
|
11/01/2021 |
FXD1/2021/002 |
2.0 |
9.5% |
25.00 |
55.9 |
61.2 |
9.5% |
244.6% |
91.3% |
|
25/01/2021 |
IFB1/2021/016 |
16.0 |
12.3% |
50.0 |
81.1 |
125.5 |
12.3% |
250.9% |
64.6% |
|
8/02/2021 |
FXD1/2013/15 |
7.1 |
11.3% |
50.0 |
9.4 |
13.6 |
11.8% |
83.7% |
76.7% |
|
FXD1/2012/20 |
11.8 |
12.0% |
22.7 |
28.3 |
12.6% |
||||
|
22/02/2021 |
FXD1/2013/15 –(Tap Sale) |
7.1 |
11.8% |
18.0 |
7.0 |
7.2 |
11.8% |
62.4% |
97.1% |
|
FXD1/2012/20 (Tap Sale) |
11.8 |
12.6% |
3.9 |
4.1 |
12.6% |
||||
|
15/03/2021 |
FXD1/2019/10 |
8.0 |
12.4% |
50.0 |
15.5 |
15.9 |
12.4% |
97.4% |
99.2% |
|
FXD2/2018/20 |
17.4 |
13.2% |
32.8 |
32.8 |
13.4% |
||||
|
12/04/2021 |
IFB1/2021/018 |
18.0 |
12.7% |
60.0 |
81.9 |
88.6 |
12.7% |
147.6% |
92.5% |
|
10/05/2021 |
FXD2/2019/15 |
13.0 |
12.7% |
30.0 |
6.0 |
11.6 |
13.0% |
142.0% |
47.6% |
|
FXD1/2021/25 |
25.0 |
13.9% |
14.2 |
31.0 |
13.9% |
||||
|
24/05/2021 |
FXD2/2019/15 (Tap Sale) |
13.0 |
12.7% |
20.0 |
15.7 |
15.9 |
13.0% |
104.7% |
98.9% |
|
FXD1/2021/25 (Tap Sale) |
25.0 |
13.9% |
5.0 |
5.0 |
13.9% |
||||
|
21/06/2021 |
FXD1/2019/20 |
17.9 |
12.9% |
30.0 |
13.4 |
41.0 |
13.3% |
216.4% |
30.3% |
|
FXD1/2012/20 |
11.4 |
12.0% |
6.3 |
23.9 |
12.5% |
Secondary Bond Market Activity:
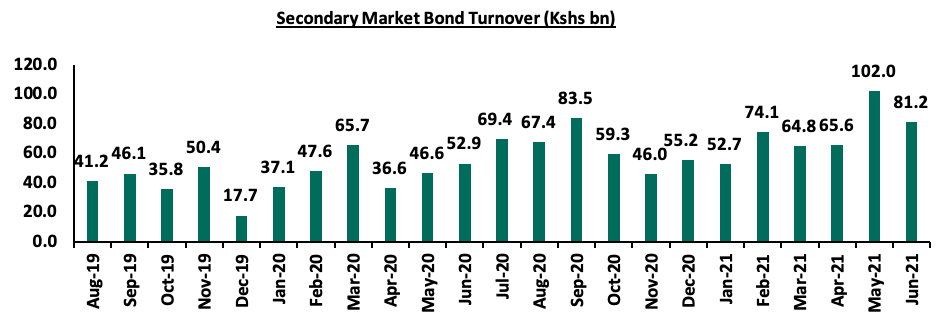
- Bond Turnover
The secondary bond market recorded increased activity, with the turnover increasing by 53.8% to Kshs 440.5 bn, from Kshs 286.5 bn in H1’2020, partially attributable to local institutional investors increasing their allocation to treasury bonds due to increased liquidity in the market as banks were still slow in lending.
- Yield Curve
The yield curve remained relatively stable with a slight decline in the yields on the short end and increase in the medium to long end leading to a 1.2% decline in the FTSE bond index. The chart below shows the yield curve movement during H1’2021:
- Money Market Performance
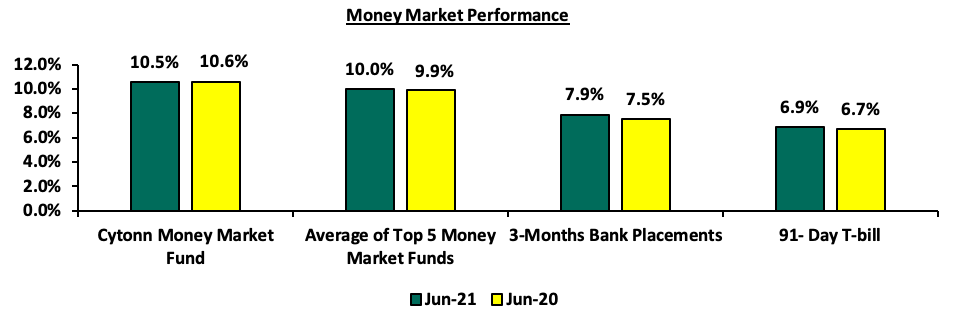
The 3-month bank placements recorded 7.9% as at the end of H1’2021 higher than 7.5% recorded at the end of H1’2020 (based on what we have been offered by various banks), the average 91-day T-bill rate also increased to 6.9% in H1’2021 from 6.7% in H1’2020, while the average of Top 5 Money Market Funds increased to 10.0% from 9.9% in H1’2020. The yield on the Cytonn Money Market (CMMF) declined by 0.1% points to 10.5% in H1’2021, from 10.6% recorded in H1’2020.
During the week, 3-month bank placements ended at 7.9% (based on what we have been offered by various banks), while the 91-day T-bill declined by 13.2 bps to 6.7% from 6.9%, recorded the previous week. The average yield of the Top 5 Money Market Funds declined to 9.8% from 10.0% recorded last week while the yield on the Cytonn Money Market (CMMF) declined by 0.5% points to 10.1%, from 10.6% recorded the previous week.
The table below shows the Money Market Fund Yields for Kenyan Fund Managers as published on 2nd July 2021:
|
Money Market Fund Yield for Fund Managers as published on 2nd July 2021 |
|||
|
Rank |
Fund Manager |
Daily Yield |
Effective Annual Rate |
|
1 |
Cytonn Money Market Fund |
9.66% |
10.14% |
|
2 |
Nabo Africa Money Market Fund |
9.52% |
9.95% |
|
3 |
Zimele Money Market Fund |
9.56% |
9.91% |
|
4 |
Madison Money Market Fund |
9.13% |
9.56% |
|
5 |
Orient Kasha Money Market Fund |
9.06% |
9.45% |
|
6 |
Sanlam Money Market Fund |
9.02% |
9.44% |
|
7 |
CIC Money Market Fund |
9.07% |
9.42% |
|
8 |
Co-op Money Market Fund |
8.60% |
8.98% |
|
9 |
Dry Associates Money Market Fund |
8.37% |
8.70% |
|
10 |
GenCap Hela Imara Money Market Fund |
8.34% |
8.70% |
|
11 |
Apollo Money Market Fund |
8.51% |
8.57% |
|
12 |
British-American Money Market Fund |
8.20% |
8.52% |
|
13 |
ICEA Lion Money Market Fund |
8.01% |
8.34% |
|
14 |
NCBA Money Market Fund |
8.02% |
8.32% |
|
15 |
Old Mutual Money Market Fund |
7.51% |
7.77% |
|
16 |
AA Kenya Shillings Fund |
6.76% |
6.97% |
Liquidity:
The liquidity in the money market tightened, as evidenced by the increase in the interbank rate to 4.9%, from 4.3% during H1’2020. Additionally, the average volumes traded in the interbank market increased by 4.8% to Kshs 10.9 bn, from Kshs 10.4 bn recorded in H1’2020. The tightened liquidity in the market was partly attributable to tax remittances and bond outflows which offset government payments, coupled with reduced foreign investor activities as investors remained cautious amidst the COVID-19 environment.
During the week, liquidity in the money market tightened, with the average interbank rate increasing to 4.9% from 4.7% recorded the previous week, partly attributable to settlements of government securities coupled with a build-up of bank balances ahead of quarter end reporting as well as anticipatory quarterly tax remittances. The average interbank volumes traded declined by 40.9% to Kshs 7.5 bn, from Kshs 12.7 bn recorded the previous week.
Kenya Eurobonds:
During H1’2021, yields on the Kenyan Eurobonds recorded mixed performance, with the yields in the dual-tranche Eurobond issued in 2018 and the 12-year Eurobond issued in 2019 rising while the 10-year Eurobond issued in 2014 and the 7-year Eurobond issued in 2019 declined. The mixed performance points to the fact that investors are still seeking direction as they try to assess Kenya’s economic expectations amidst the uncertainty brought about by the ongoing pandemic, monetary support by the International Monetary Fund (IMF) and the Credit Ratings downgrades earlier in the year.
During the week, the yields on Eurobonds remained relatively unchanged, with the yields on the 10-year bond issued in 2014, 10-year bond issued in 2018, 30-year bond issued in 2018, 12-year bond issued in 2019 and 12-year bond issued in 2021 remaining unchanged at 3.3%, 5.4%, 7.4%, 6.3%, and 6.3% respectively. On the other hand, the yield on the 7-year bond issued in 2019 increased marginally to 4.8%, from 4.7% recorded the previous week. Below is a summary of the performance:
|
Kenya Eurobond Performance |
||||||
|
|
2014 |
2018 |
2019 |
2021 |
||
|
Date |
10-year issue |
10-year issue |
30-year issue |
7-year issue |
12-year issue |
12-year issue |
|
31-Dec-2020 |
3.9% |
5.2% |
7.0% |
4.9% |
5.9% |
- |
|
31-May-2021 |
3.1% |
5.3% |
7.3% |
4.7% |
6.2% |
- |
|
25-June-21 |
3.3% |
5.3% |
7.4% |
4.7% |
6.3% |
6.3% |
|
28- June-21 |
3.3% |
5.4% |
7.4% |
4.7% |
6.3% |
6.3% |
|
29- June-21 |
3.3% |
5.4% |
7.4% |
4.8% |
6.3% |
6.3% |
|
30- June-21 |
3.3% |
5.4% |
7.4% |
4.8% |
6.3% |
6.3% |
|
01-July-21 |
3.3% |
5.4% |
7.4% |
4.8% |
6.3% |
6.3% |
|
Weekly Change |
0.0% |
0.0% |
0.0% |
0.1% |
0.0% |
0.0% |
|
MTD Change |
0.2% |
0.1% |
0.0% |
0.1% |
0.1% |
- |
|
H1’2021 Change |
(0.6%) |
0.2% |
0.3% |
(0.1%) |
0.4% |
- |
Rates in the fixed income market have remained relatively stable due to the tightened but sufficient levels of liquidity in the money markets, coupled with the discipline by the Central Bank to reject expensive bids. The government is 9.8% behind its prorated borrowing target of Kshs 561.7 bn having borrowed Kshs 506.7 bn in FY’2020/2021. In our view, due to the current subdued economic performance brought about by the effects of the COVID-19 pandemic, the government will record a shortfall in revenue collection having collected Kshs 1,313.1 bn in the first 11 months to May 2021, compared to Kshs 1,469.7 bn prorated target collection for FY’2020/2021, thus leading to a budget deficit of 10.6%, larger than the projected 7.5% of GDP. Despite the deficit and the lower credit rating from S&P Global to 'B' from 'B+', the monetary support from the IMF and World Bank will mean that the interest rate environment may stabilize since the government will not be desperate for cash.
Market Performance:
During Q2’2021, the equities market was on an upward trajectory, with NASI, NSE 25 and NSE 20 gaining by 9.4%, 6.8% and 4.4%, respectively, taking their H1’2021 to gains of 14.1%, 10.5%, and 3.2% for NASI, NSE 25 and NSE 20 respectively. The equities market performance during the quarter was driven by gains recorded by large cap stocks such as Equity Group, EABL, and Safaricom of 17.9%, 14.4%, and 14.3%, respectively.
Equities turnover declined by 20.7% in H1’2021 to USD 641.2 mn, from USD 808.8 mn in H1’2020. Foreign investors remained net sellers in H1’2021 with a net selling position of USD 27.6 mn, from a net selling position of USD 216.5 mn recorded in H1’2020.
During the week, the equities market recorded mixed performance with NSE 20 and NSE 25 gaining by 1.5% and 0.9%, respectively, while NASI declined marginally by 0.2%, taking their YTD performance to gains of 12.6%, 10.9% and 3.0%, for NASI, NSE 25 and NSE 20, respectively. The equities market performance was mainly driven by gains recorded by large-cap stocks such as Bamburi, BAT Kenya and Cooperative Bank, of 8.1%, 4.2%, and 3.1%, respectively. The gains were however weighed down by losses recorded by ABSA Bank, KCB Group and Diamond Trust Bank (DTB-K), which declined by 5.2%, 3.1% and 1.7%, respectively.
During the week, equities turnover declined by 24.2% to USD 23.7 mn from USD 31.3 mn recorded the previous week, taking the YTD turnover to USD 652.4 mn. During the week, foreign investors turned net buyers, with a net buying position of USD 2.5 mn, from a net selling position of USD 0.7 mn recorded the previous week, taking the YTD net selling position to USD 25.6 mn.
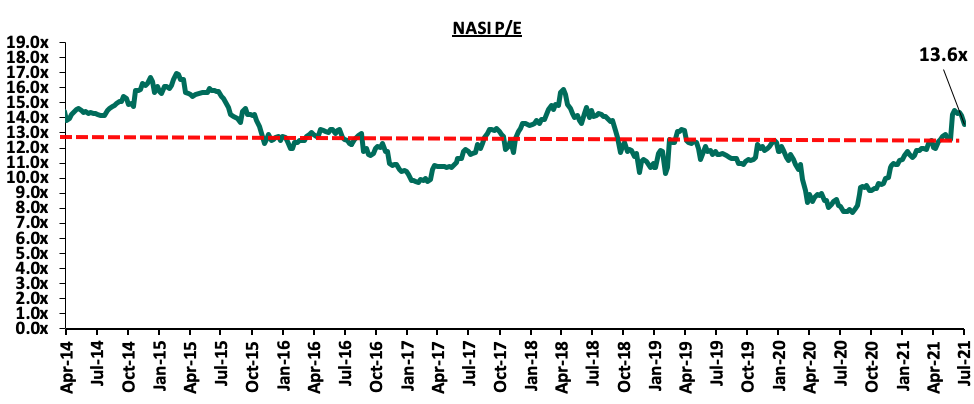
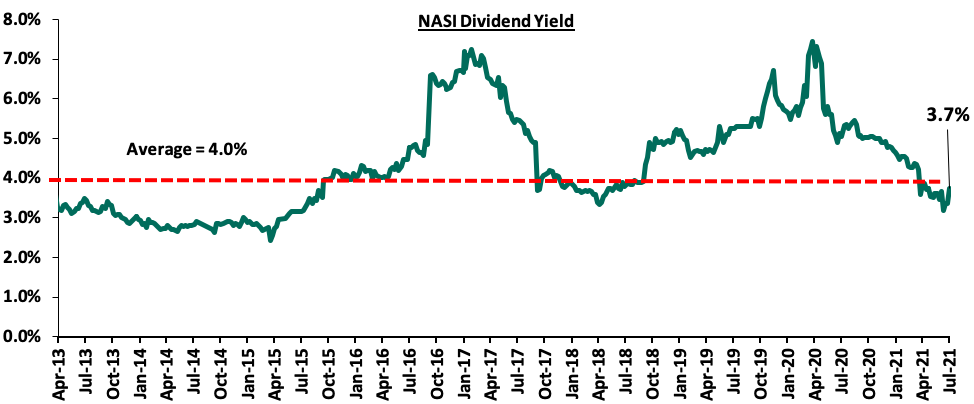
The market is currently trading at a price to earnings ratio (P/E) of 13.6x, 4.9% above the historical average of 12.9x, and a dividend yield of 3.7%, 0.3% points below the historical average of 4.0%. Key to note, NASI’s PEG ratio currently stands at 1.5x, an indication that the market is trading at a premium to its future earnings growth. Basically, a PEG ratio greater than 1.0x indicates the market may be overvalued while a PEG ratio less than 1.0x indicates that the market is undervalued. Excluding Safaricom, the market is trading at a P/E ratio of 8.7x and a PEG ratio of 1.0x. The current P/E valuation of 13.6x is 76.0% above the most recent trough valuation of 7.7x experienced in the first week of August 2020. The charts below indicate the historical P/E and dividend yields of the market.
Listed Banks’ FY’2020 and Q1’2021 Performance
During the first half of 2021, the listed banking sector released their FY’2020 and Q1’2021 results, recording earnings growth of (26.8%) and 28.4% in their core EPS in FY’2020 and Q1’2021, respectively. For more information, kindly see our FY’2020 and Q1’2021 Banking Sector Reports.
Key Half-Year Highlights:
During the first half of 2021;
- Liberty Holdings Limited (Liberty), a financial services and property holding company announced plans to buy an additional 84.2 mn shares in Liberty Kenya Holdings Plc (LK), which represents 15.8% of the company. The planned acquisition will increase the company’s stake to 73.5% (393.6 mn ordinary shares) from the current 57.7% (309.3 mn ordinary shares), retaining Liberty’s status as the biggest shareholder of the insurer. The total cost of this transaction is Kshs 926.6 mn, with Liberty Holdings Limited buying each share at Kshs 11.0. For more information, please see Cytonn Weekly #09/2021,
- The Central Bank of Kenya (CBK) announced that the emergency measures on restructuring of loans for bank borrowers put in place in March 2020, expired on 2nd March 2021. The emergency measures were meant to cushion the borrowers from the adverse effects of the pandemic which would affect their ability to service loans such as the reduction in disposable income. For more information, please see Cytonn Weekly #12/2021,
- The Central Bank of Kenya (CBK) announced that Chase Bank Limited (In Receivership) (CBLIR) would be liquidated, following the recommendation made by Kenya Deposit Insurance Corporation (KDIC). The liquidation measure comes five years after CBK appointed the Kenya Deposit Insurance Corporation (KDIC) as the receiver for Chase Bank Limited on 7th April 2016. On 7th April 2021, KDIC submitted a receiver’s reports to CBK indicating that given the weak financial position of CBLIR, liquidation of the bank was the only plausible option and therefore, effective 16th April 2021, CBK appointed KDIC as the Liquidator of CBLIR. For more information, please see Cytonn Weekly #15/2021,
- I&M Holdings PLC announced that it completed the 90.0% acquisition of Orient Bank Limited Uganda (OBL) share capital, after receiving all the required regulatory approvals. As highlighted in our Cytonn Weekly #50/2020, I&M Holdings was set to pay Kshs 3.6 bn for the deal. Additionally, I&M Holdings will take over 14 branches from OBL, taking its total branches to 80, from 66 branches as at the end of 2020. For more information, please see Cytonn Weekly #18/2021,
- KCB Group disclosed that it had made an offer to the Banque Populaire du Rwanda Plc (BPR) shareholders’ to raise its acquisition stake in the bank from 62.1% to 100.0%. As highlighted in our Cytonn Weekly #48/2020, the 62.1% BPR acquisition would see KCB pay a cash consideration based on the net asset value of the BPR at completion of the transaction using a price to book multiple of 1.1x. According to the latest BPR financials, the bank had a book value of Rwf 47.3 bn (Kshs 5.1 bn), and thus at the trading multiple of 1.1x, we expect KCB Group to pay Kshs 5.6 bn. For more information on the acquisition, see our Cytonn Weekly #19/2021,
- In May 2021, Equity Group disclosed that it had acquired an additional 7.7% stake valued at Kshs 996.0 mn, in Equity bank Congo (EBC) from the German Sovereign Wealth Fund (KfW). The acquisition raised the total ownership in EBC to 94.3%, indicating that they are currently valuing the company at Kshs 14.2 bn. This follows the recent acquisition of 66.5% stake in Banque Commerciale Du Congo (BCDC) by Equity Group at a cost of Kshs 10.2 bn in August 2020. For more information, please see Cytonn Weekly #20/2021,
- Safaricom Plc announced that the Ethiopian Communications Authority (ECA) had approved a bid for an Ethiopia Telco License which was submitted by a consortium consisting of Safaricom, Vodacom Group Ltd, Vodafone Group Plc (UK), CDC Group Plc and Sumitomo Corporation. The consortium’s financial bid of USD 850.0 mn (Kshs 91.8 bn) will allow the consortium to operate a telecommunications network in Ethiopia, but will not include a license to operate mobile money. For more information, please see Cytonn Weekly #21/2021, and,
Nation Media Group (NMG) issued a share buyback circular to shareholders, proposing to buy back of up to 10.0% (20.7 mn shares) of its issued and paid-up share capital in accordance with Part XVI, Section 447 of the Companies Act, 2015 of the laws of Kenya. This would reduce the company’s outstanding shares to 186.7 mn shares, from 207.4 mn shares. Key to note, NMG is the first company in the Nairobi Securities Exchange (NSE) to undertake a share repurchase program. The share buyback has since been approved by the shareholders in their AGM held on 25th June 2021. For more information, please see Cytonn Monthly – May 2021.
|
Company |
Price as at 25/06/2021 |
Price as at 02/07/2021 |
w/w change |
q/q change |
YTD Change |
Year Open 2021 |
Target Price* |
Dividend Yield |
Upside/ Downside** |
P/TBv Multiple |
Recommendation |
|
I&M Group*** |
21.1 |
21.6 |
2.1% |
(56.3%) |
(52.0%) |
44.9 |
29.8 |
10.4% |
48.7% |
0.3x |
Buy |
|
Kenya Reinsurance |
2.4 |
2.4 |
0.4% |
1.2% |
4.8% |
2.3 |
3.1 |
4.1% |
32.2% |
0.3x |
Buy |
|
NCBA*** |
25.2 |
25.0 |
(0.6%) |
1.4% |
(6.0%) |
26.6 |
29.5 |
6.0% |
24.0% |
0.6x |
Buy |
|
Sanlam |
10.0 |
10.2 |
2.0% |
(7.4%) |
(21.5%) |
13.0 |
12.4 |
0.0% |
21.6% |
0.9x |
Buy |
|
Diamond Trust Bank*** |
60.0 |
59.0 |
(1.7%) |
(5.6%) |
(23.1%) |
76.8 |
70.0 |
0.0% |
18.6% |
0.3x |
Accumulate |
|
KCB Group*** |
43.9 |
42.5 |
(3.1%) |
3.3% |
10.7% |
38.4 |
48.6 |
2.4% |
16.7% |
1.0x |
Accumulate |
|
ABSA Bank*** |
9.9 |
9.4 |
(5.2%) |
12.5% |
(1.3%) |
9.5 |
10.7 |
0.0% |
13.8% |
1.1x |
Accumulate |
|
Stanbic Holdings |
81.3 |
83.0 |
2.2% |
(0.3%) |
(2.4%) |
85.0 |
90.5 |
4.6% |
13.6% |
0.8x |
Accumulate |
|
Standard Chartered*** |
130.0 |
130.0 |
0.0% |
(8.5%) |
(10.0%) |
144.5 |
134.5 |
8.1% |
11.5% |
0.9x |
Accumulate |
|
Co-op Bank*** |
13.0 |
13.4 |
3.1% |
4.5% |
6.8% |
12.6 |
13.8 |
7.5% |
10.4% |
0.9x |
Accumulate |
|
Equity Group*** |
46.6 |
46.7 |
0.2% |
17.9% |
28.8% |
36.3 |
51.2 |
0.0% |
9.6% |
1.4x |
Hold |
|
Liberty Holdings |
8.5 |
7.7 |
(9.4%) |
5.1% |
0.0% |
7.7 |
8.4 |
0.0% |
9.1% |
0.6x |
Hold |
|
Britam |
7.4 |
7.2 |
(2.4%) |
3.1% |
2.6% |
7.0 |
6.7 |
0.0% |
(6.7%) |
1.3x |
Sell |
|
Jubilee Holdings |
310.0 |
375.5 |
21.1% |
29.6% |
36.2% |
275.8 |
330.9 |
2.4% |
(9.5%) |
0.8x |
Sell |
|
HF Group |
3.6 |
3.9 |
7.4% |
(3.5%) |
24.2% |
3.1 |
3.2 |
0.0% |
(17.9%) |
0.2x |
Sell |
|
CIC Group |
2.1 |
2.4 |
13.7% |
3.8% |
13.7% |
2.1 |
1.8 |
0.0% |
(25.0%) |
0.8x |
Sell |
|
*Target Price as per Cytonn Analyst estimates **Upside/ (Downside) is adjusted for Dividend Yield ***For Disclosure, these are stocks in which Cytonn and/or its affiliates are invested in Key to note, I&M Group YTD and Q/Q share price change is mainly attributable to counter trading ex-bonus issue. |
|||||||||||
We are “Neutral” on the Equities markets in the short term. With the market currently trading at a premium to its future growth (PEG Ratio at 1.5x), we believe that investors should reposition towards companies with a strong earnings growth and are trading at discounts to their intrinsic value. Additionally, we expect the recent discovery of new strains of COVID-19 coupled with the introduction of strict lockdown measures in major economies to continue dampening the economic outlook.
During the H1’2021, the real estate sector recorded increased activities following the reopening of the economy which saw an improved business environment supported by;
- The Kenyan government’s aggressiveness in implementation of the affordable housing agenda and infrastructure projects such as the Nairobi Expressway, Pangani Housing Project, and River Estate Project in Ngara among many others, despite the pandemic, hence enhancement of home ownership rates and opening up areas for investment opportunities,
- Efforts by the Kenya Mortgage Refinance Company (KMRC) and other financial institutions to provide relatively affordable mortgages to Kenyans,
- Aggressive expansion by local and international retailers taking up prime retail spaces left by troubled retailers,
- Relatively high urbanization and population growth rates of 4.0% p.a and 2.3% p.a, respectively against the global average of 1.9% p.a and 1.1% p.a, respectively according to World Bank, and,
- Launch of the National Land Information Management System (NLIMS) aimed at streamlining land transactions in Nairobi.
However, the following factors continued impeding performance of the real estate sector;
- Partial lockdowns and travel restrictions imposed in the country that affected performance of the hospitality sector which heavily relies on tourism sector,
- Reduced demand for office spaces as organizations still embraced the remote working strategy,
- Reduced consumer purchasing power attributed to the tough economic condition brought about by the COVID-19 pandemic,
- The existing oversupply of 2.0 mn SQFT in the Kenya retail sector and 7.3mn SQFT in the commercial office sector, and,
- Existing vacancy rates despite the slight occupancy increase rates for the retail spaces recorded in H1’2021, due to the shift towards online shopping that is still being embraced.
Despite the impeding factors, the real estate sector has made a remarkable improvement during the period, hence we expect its performance to stabilize in the long run supported by government efforts through the overall 2.0% increased budget allocation to Kshs 222.4 bn for the FY’2021/2022 from Kshs 218.0 bn budget allocation in FY 2020/2021 to support real estate activities, for the housing, tourism and infrastructure sectors.
Sectoral Market Performance
- Residential Sector
During H1’2021 the residential sector recorded improved performance with average total returns registering a 0.8% points half-yearly increase to 5.5%, from 4.7% recorded in FY’2020.The average y/y price appreciation in the residential market came in at 0.6%, with prices in all segments registering appreciation apart from apartments in satellite towns which recorded a price correction of 0.8%, since more people opted to rent than to buy. The average rental yield registered a 0.2% points q/q increase to 4.8% in H1’2021 from 4.7% recorded in Q1’2021 attributable to economic improvement which saw asking rents record an uptick.
(All Values are in Kshs unless stated otherwise)
|
Residential Performance Summary H1’2021 |
|||||||||
|
Segment |
Average of Rental Yield H1'2021 |
Average of Y/Y Price Appreciation H1'2021 |
Total Returns H1'2021 |
Average Rental Yield Q1'2021 |
Average of Y/Y Price Appreciation Q1'2021 |
Average of Total Returns Q1'2021 |
Change in Rental Yield |
Change in Y/Y Price Appreciation |
Change in Returns |
|
Detached Units |
|||||||||
|
High End |
3.7% |
1.1% |
4.8% |
3.6% |
1.0% |
4.6% |
0.1% |
0.1% |
0.2% |
|
Upper Mid-End |
4.6% |
1.2% |
5.8% |
4.5% |
0.5% |
5.0% |
0.1% |
0.7% |
0.8% |
|
Satellite Towns |
4.3% |
1.1% |
5.5% |
4.1% |
0.7% |
4.8% |
0.2% |
0.4% |
0.7% |
|
Detached Average |
4.2% |
1.1% |
5.4% |
4.1% |
0.8% |
4.8% |
0.1% |
0.3% |
0.6% |
|
Apartments |
|||||||||
|
Upper Mid-End |
5.3% |
0.3% |
5.7% |
5.2% |
0.1% |
5.3% |
0.1% |
0.2% |
0.4% |
|
Lower Mid-End Suburbs |
5.3% |
0.9% |
6.2% |
5.0% |
0.2% |
5.2% |
0.3% |
0.7% |
1.0% |
|
Satellite Towns |
5.6% |
(0.9%) |
4.7% |
5.4% |
0.1% |
5.5% |
0.2% |
(1.0%) |
(0.8%) |
|
Apartments Average |
5.4% |
0.2% |
5.6% |
5.2% |
0.1% |
5.3% |
0.2% |
0.1% |
0.3% |
|
Residential Market Average |
4.8% |
0.6% |
5.5% |
4.7% |
0.5% |
5.1% |
0.2% |
0.2% |
0.5% |
|
|||||||||
- Detached Units Performance
Detached units recorded an improvement in performance in H1’2021 compared to Q1’2021 with average total returns registering a 0.6% points q/q increase to 5.4% in H1’2021 from 4.8% recorded in Q1’2021, and a 1.2% points half-yearly increase from 4.2% recorded in FY’2020. The upper mid-end segment was the best performing segment with an average total return of 5.8% compared to the high-end and lower mid- end segments whose average total returns came in at 4.8% and 5.4%, respectively. Performance of the upper mid-end segment is attributed to the high rental yield of 4.6% and 1.2% y/y price appreciation. The general improved performance of house prices and rents is attributable increased transactional volumes among buyers after holding on to cash following tough uncertain economic times at the onset of the pandemic.
Overall, the best performing node was Ruiru with an average total return of 6.6% while Syokimau, Redhill and Kitisuru followed in closely with total returns all averaging at 6.5%. The performance of Ruiru is attributed to the relatively high rental yield of 5.0% compared to the detached market average of 4.2%. Runda recorded the lowest average total returns at 2.1% attributed to a 1.6% price correction.
(All Values are in Kshs unless stated otherwise)
|
Detached Units Performance H1’2021 |
||||||||
|
Area |
Average of Price per SQM H1'2021 |
Average of Rent per SQM H1'2021 |
Average of Occupancy H1'2021 |
Average of Uptake H1'2021 |
Average of Annual Uptake H1'2021 |
Average of Rental Yield H1'2021 |
Average of Price Appreciation H1'2021 |
Average Total Returns H1'2021 |
|
High-End |
||||||||
|
Kitisuru |
203,113 |
615 |
92.5% |
90.3% |
15.0% |
3.8% |
2.7% |
6.5% |
|
Rosslyn |
179,040 |
744 |
85.9% |
95.2% |
12.1% |
4.4% |
1.1% |
5.5% |
|
Lower Kabete |
154,600 |
434 |
81.3% |
84.5% |
16.0% |
2.8% |
2.5% |
5.2% |
|
Karen |
190,730 |
730 |
82.8% |
89.3% |
14.4% |
3.8% |
0.8% |
4.5% |
|
Runda |
237,567 |
756 |
90.5% |
94.2% |
10.4% |
3.7% |
(1.6%) |
2.1% |
|
Average |
193,010 |
656 |
86.6% |
90.7% |
13.6% |
3.7% |
1.1% |
4.8% |
|
Upper Mid-End |
||||||||
|
Redhill & Sigona |
97,843 |
446 |
90.9% |
90.9% |
15.4% |
5.2% |
1.3% |
6.5% |
|
Ridgeways |
152,100 |
775 |
84.5% |
86.2% |
13.4% |
5.2% |
1.2% |
6.3% |
|
Runda Mumwe |
152,949 |
635 |
85.2% |
80.1% |
14.1% |
4.3% |
2.0% |
6.3% |
|
Loresho |
148,543 |
673 |
87.8% |
82.0% |
10.7% |
4.8% |
1.5% |
6.3% |
|
South B/C |
127,298 |
537 |
94.4% |
88.7% |
14.0% |
4.8% |
1.2% |
6.0% |
|
Langata |
163,120 |
555 |
85.9% |
92.9% |
10.0% |
3.9% |
0.8% |
4.8% |
|
Lavington |
158,686 |
647 |
86.1% |
82.5% |
12.9% |
4.4% |
0.3% |
4.7% |
|
Average |
142,934 |
610 |
87.8% |
86.2% |
12.9% |
4.6% |
1.2% |
5.8% |
|
Lower Mid-End |
||||||||
|
Ruiru |
79,138 |
332 |
83.9% |
83.5% |
24.9% |
5.0% |
1.6% |
6.6% |
|
Syokimau/Mlolongo |
75,406 |
367 |
75.7% |
85.1% |
16.8% |
4.4% |
2.1% |
6.5% |
|
Juja |
64,500 |
328 |
79.6% |
88.4% |
14.9% |
4.6% |
1.0% |
5.6% |
|
Rongai |
86,541 |
233 |
83.1% |
75.9% |
13.4% |
2.9% |
2.2% |
5.1% |
|
Kitengela |
68,730 |
301 |
92.0% |
88.6% |
15.5% |
4.7% |
0.4% |
5.1% |
|
Ngong |
58,982 |
283 |
84.5% |
86.5% |
12.7% |
5.0% |
(0.2%) |
4.9% |
|
Athi River |
83,321 |
313 |
83.4% |
94.1% |
15.7% |
3.8% |
0.7% |
4.4% |
|
Average |
73,803 |
308 |
83.2% |
86.0% |
16.3% |
4.3% |
1.1% |
5.5% |
Source: Cytonn Research 2021
- Apartments Performance
Performance of apartments recorded improvement with total returns registering a 0.4% points half-yearly increase, coming in at 5.6% in H1’2021 from 5.2% in FY’2020 and a 0.3% points q/q increase from the 5.3% recorded in Q1’2021, with the average price appreciation and rental yield coming in at 0.1% and 5.4%, respectively. Apartments in the lower mid-end suburbs registered the highest average total return at 6.2% compared to upper mid-end and lower mid-end satellite towns with average total returns coming in at 5.7% and 4.8%, respectively. The lower mid-end suburbs performance is attributable to a high demand for rental units hence a relatively high rental yield of 5.3%, and a 0.9% y/y price appreciation compared to apartments market average of 0.1% as investors sought to capitalize on the residential space demand in these areas by the growing middle class.
Waiyaki Way was the best performing node, registering the highest returns at 8.1% attributable to continued demand evidenced by the relatively high average rental yield which came in at 5.6% and y/y price appreciation at 2.5%. Parklands and Ruaka followed in second and third positions respectively, with average total returns of 7.6% and 7.5%, respectively. The least performing node was Rongai with an average total return of 2.4% attributed to a price correction of 3.9% following reduced demand from buyers forcing sellers to revise their prices downwards.
(All Values are in Kshs unless stated otherwise)
|
Apartments Performance H1’2021 |
||||||||
|
Area |
Average of Price Per SQM H1'2021 |
Average of Rent per SQM H1'2021 |
Average of Occupancy H1'2021 |
Average of Uptake H1'2021 |
Average of Annual Uptake H1'2021 |
Average of Rental Yield H1'2021 |
Average of Y/Y Price Appreciation H1'2021 |
Total Returns H1'2021 |
|
Upper Mid-End |
||||||||
|
Parklands |
117,472 |
689 |
84.8% |
83.2% |
14.7% |
5.6% |
2.0% |
7.6% |
|
Westlands |
144,289 |
757 |
80.6% |
77.3% |
17.7% |
4.9% |
2.0% |
6.9% |
|
Kilimani |
103,745 |
577 |
87.6% |
90.0% |
23.0% |
5.9% |
(0.2%) |
5.7% |
|
Upperhill |
139,414 |
883 |
80.3% |
79.0% |
10.1% |
5.3% |
0.4% |
5.7% |
|
Kileleshwa |
121,559 |
646 |
86.4% |
83.9% |
16.3% |
5.4% |
(0.6%) |
4.7% |
|
Loresho |
120,877 |
552 |
89.4% |
85.3% |
10.0% |
4.9% |
(1.6%) |
3.3% |
|
Average |
124,559 |
684 |
84.9% |
83.1% |
15.3% |
5.3% |
0.3% |
5.7% |
|
Lower Mid-End: Suburbs |
||||||||
|
Waiyaki Way |
87,563 |
520 |
78.8% |
77.9% |
21.7% |
5.6% |
2.5% |
8.1% |
|
Dagoretti |
87,565 |
514 |
86.7% |
89.7% |
17.4% |
6.3% |
1.1% |
7.4% |
|
South C |
113,751 |
598 |
86.3% |
64.1% |
14.1% |
5.9% |
1.2% |
7.1% |
|
Kahawa West |
74,871 |
350 |
78.2% |
87.0% |
10.6% |
5.0% |
1.7% |
6.7% |
|
Donholm & Komarock |
80,520 |
399 |
85.2% |
87.8% |
13.3% |
5.3% |
1.1% |
6.4% |
|
South B |
104,973 |
445 |
74.3% |
84.9% |
17.5% |
4.0% |
2.3% |
6.3% |
|
Race Course/Lenana |
102,973 |
622 |
79.3% |
82.3% |
22.0% |
5.8% |
(0.3%) |
5.5% |
|
Imara Daima |
83,040 |
406 |
83.9% |
83.1% |
13.0% |
5.2% |
(0.1%) |
5.0% |
|
Langata |
125,241 |
545 |
88.2% |
82.2% |
14.2% |
4.7% |
(1.3%) |
3.4% |
|
Average |
95,611 |
489 |
82.3% |
82.1% |
16.0% |
5.3% |
0.9% |
6.2% |
|
Lower Mid-End: Satellite Towns |
||||||||
|
Ruaka |
105,633 |
514 |
63.7% |
76.0% |
19.0% |
5.5% |
2.0% |
7.5% |
|
Kikuyu |
80,766 |
529 |
79.6% |
79.4% |
17.6% |
6.4% |
0.3% |
6.7% |
|
Thindigua |
108,551 |
537 |
79.3% |
79.4% |
12.8% |
4.9% |
1.2% |
6.0% |
|
Syokimau |
67,967 |
345 |
79.0% |
77.6% |
12.0% |
5.2% |
(2.2%) |
6.0% |
|
Ngong |
58,015 |
306 |
81.4% |
72.3% |
11.8% |
5.3% |
0.7% |
5.9% |
|
Kitengela |
59,488 |
284 |
90.0% |
82.8% |
10.0% |
5.1% |
(2.8%) |
5.5% |
|
Athi River |
59,145 |
290 |
97.2% |
96.9% |
12.6% |
5.7% |
(1.2%) |
4.5% |
|
Ruiru |
86,904 |
528 |
86.4% |
85.8% |
23.8% |
6.1% |
(1.8%) |
4.3% |
|
Rongai |
68,982 |
363 |
87.3% |
94.2% |
28.6% |
6.3% |
(3.9%) |
2.4% |
|
Average |
77,272 |
411 |
82.7% |
82.7% |
16.5% |
5.6% |
(0.9%) |
4.7% |
Source: Cytonn Research 2021
Notable highlights in H1’2021 include (See Q1’2021, Cytonn Monthly-April 2021 and Cytonn Monthly-May 2021 Highlights);
- Real estate developer Acorn Holdings launched the construction of its 3,592 room-hostels at a cost of Kshs 1.9 bn in Nairobi’s Karen under the Qwetu and Qejani brands, which are expected to be completed by the end of 2022. For more information, see Cytonn Weekly #24/2021,
- Absa Bank Kenya partnered with Property developer Mi Vida Homes to provide mortgage finance to middle income earners seeking affordable houses within the Nairobi region at a rate of 12.5% annually compared to its market rate of 14.0% with up to 90.0% financing and a 25-year repayment plan, for both employed and self-employed Kenyans. For more information, see Cytonn Weekly #24/2021, and,
- International Finance Corporation (IFC), the World Bank’s private investment arm, signed a deal with Belco Realty, a real estate development firm, to support the launch and development of Kongowea Village, a mixed-use affordable housing initiative consisting of 1,379 residential units and over 4,500 SQM of retail and commercial space in Kongowea, Mombasa County. The development will sit on an eight-acre piece of land and is expected to be completed in 2024. For more information, see Cytonn Weekly #24/2021.
- During the week, the county government of Kakamega, through its Governor, Hon. Wycliffe Oparanya, announced plans to develop a 4000-unit modern affordable housing project in Kakamega and Mumias towns, at a cost of Kshs 6.0 bn. The project which is set to kick off in July 2021 is expected to be completed by March 2022 with phase one set to consist of 3,000 houses while phase two will consist of 1,000 houses, and priority for occupancy will be biased towards those whose houses will be demolished for construction purposes, after which the remaining units will be sold to county and national government officers between Kshs 1.0 mn and Kshs 3.0 mn. Members of staff will be required to pay 20.0% of the purchasing cost and the balance deducted from their salaries.
Our outlook for the residential sector remains NEUTRAL as we expect the sector to record increased activities following focus on affordable housing, efforts by the government to avail relatively cheaper mortgage facilities to encourage home ownership, and anticipated increase in the number of building approvals complemented by the Kshs 30.0 mn Nairobi County e-Development Permit System upgrade expected to be done by June 2022, aiming to offer faster and efficient construction approvals in Nairobi. However, the sector’s performance continues to be weighed down by factors such as i) low mortgage uptake, ii) sluggishness in the delivery of government affordable houses, and, iii) reduced disposable income amongst Kenyans in the midst of tough economic times.
- Commercial Office Sector
The commercial office sector recorded a 0.1% and 1.9% points decline in the average rental yields and occupancy rates to 6.9% and 76.3% in H1’2021, from 7.0% and 77.7%, respectively in FY’2020. The performance decline is attributable to the containment measures for the COVID-19 pandemic which has led to reduced demand for physical spaces as businesses continue to embrace the working from home strategy and may make it a permanent measure, coupled with the 7.3 mn SQFT office space oversupply as at 2020. The asking rents and selling prices also registered a 0.1% and 0.5% decline to an average of Kshs 92.8 per SQFT and Kshs 12,224 per SQFT in H1’2021, from Kshs 93.1 per SQFT and Kshs 12,228 per SQFT, respectively in FY’2020. The decline in the asking prices and rents is attributed to landlords providing incentives to tenants such as rent-free periods as well as reducing their rates so as to retain existing tenants and attract new occupants for their office spaces.
The table below highlights the performance of the Nairobi Metropolitan Area (NMA) Commercial Office sector over time:
(All Values are in Kshs unless stated otherwise)
|
Nairobi Metropolitan Area (NMA) Commercial Office Returns Over Time |
|||||||
|
Year |
Q1'2020 |
H1"2020 |
Q3' 2020 |
FY'2020 |
Q1'2021 |
H1'2021 |
∆ FY'2020/H1'2021 |
|
Occupancy % |
81.7% |
80.0% |
79.9% |
77.7% |
76.3% |
75.8% |
(1.9%) |
|
Asking Rents (Kshs/SQFT) |
97 |
95 |
94 |
93 |
92 |
93 |
(0.1%) |
|
Average Prices (Kshs/SQFT) |
12,535 |
12,516 |
12,479 |
12,280 |
12,228 |
12,224 |
(0.5%) |
|
Average Rental Yields (%) |
7.8% |
7.3% |
7.2% |
7.0% |
6.8% |
6.9% |
(0.1%) |
Gigiri and Karen were the best performing submarkets in H1’2021 recording rental yields of 8.2% and 7.9%, respectively against a market average of 6.9% attributed to their serene environments hence attracting prime, developments and rental prices, relatively good infrastructure, and low supply of commercial office spaces within the markets. However, Mombasa Road recorded the lowest performance within the Nairobi Metropolitan Area with rental yields coming in at 4.7% attributed to the effect of traffic snarl-ups which has been worsened by the current construction of the Nairobi-Express Way, low quality office spaces, and zoning regulations as Mombasa Road is mainly considered as an industrial area.
The table below shows the Nairobi Metropolitan Area (NMA) sub-market performance;
(All Values are in Kshs unless stated otherwise)
|
Nairobi Metropolitan Area Commercial Office Submarket Performance H1’2021 |
||||||||||||
|
Area |
Price (Kshs) /SQFT H1’2021 |
Rent (Kshs) /SQFT H1’2021 |
Occupancy (%) H1’2021 |
Rental Yields (%) H1’2021 |
Price Kshs/ SQFT FY 2020 |
Rent Kshs/SQFT FY 2020 |
Occupancy FY 2020(%) |
Rental Yield (%) FY 2020 |
∆ in Rent |
∆ in Occupancy (% points) |
∆ in Rental Yields (% points) |
|
|
Gigiri |
13,375 |
115 |
80.0% |
8.2% |
13,400 |
116 |
82.5% |
8.5% |
(0.9%) |
(2.5%) |
(0.3%) |
|
|
Karen |
13,429 |
108 |
81.7% |
7.9% |
13,567 |
106 |
83.6% |
7.8% |
2.1% |
(1.9%) |
0.1% |
|
|
Parklands |
10,947 |
92 |
77.5% |
7.8% |
10,958 |
93 |
79.9% |
7.6% |
(0.2%) |
(2.4%) |
0.2% |
|
|
Westlands |
11,964 |
104 |
73.3% |
7.7% |
11,975 |
104 |
74.4% |
7.8% |
(0.2%) |
(1.0%) |
(0.1%) |
|
|
Kilimani |
12,245 |
93 |
79.5% |
7.3% |
12,233 |
93 |
79.1% |
6.8% |
0.2% |
0.4% |
0.5% |
|
|
Upperhill |
12,614 |
95 |
77.4% |
6.9% |
12,684 |
92 |
78.5% |
6.9% |
2.7% |
(1.1%) |
0.0% |
|
|
Nairobi CBD |
11,767 |
81 |
77.1% |
6.4% |
11,889 |
82 |
82.4% |
6.8% |
(1.8%) |
(5.3%) |
(0.4%) |
|
|
Thika Road |
12,429 |
77 |
73.7% |
5.5% |
12,500 |
80 |
76.1% |
5.8% |
(3.7%) |
(2.4%) |
(0.3%) |
|
|
Mombasa road |
11,250 |
71 |
61.7% |
4.7% |
11,313 |
73 |
63.0% |
4.8% |
(2.5%) |
(1.3%) |
(0.1%) |
|
|
Average |
12,224.30 |
92.8 |
75.8% |
6.9% |
12,280 |
93 |
77.7% |
7.0% |
(0.5% |
(1.9%) |
(0.1%) |
|
Source: Cytonn Research 2021
Other notable highlights in the commercial sector in H1’2021 include:
- Insurance Regulatory Authority (IRA) and Capital Markets Authority (CMA) announced that they want to jointly buy office spaces within Nairobi premises, a move that will see it take up at least 55,000 SQFT of office space in Upper Hill with a minimum of 100 parking bays, and the building expected to sit on at least two-acre piece land. For more analysis, please see Cytonn Weekly #19/2021.
We retain a NEGATIVE outlook for the NMA commercial office sector which is expected to continue being affected by factors such as the existing oversupply at 7.3 mn SQFT of space, reduced demand as people continue embracing working from home which has proven to be a viable cost saving option for most firms and declines in the rental rates brought about by the reduced forces of demand. Despite the negative outlook, investment opportunity lies in areas such as Gigiri and Karen which fetch relatively higher rental yields with favorable locations.
- Retail Sector
The retail sector performance in H1’2021 recorded a slight improvement of 0.1% rental yield to 7.6% from 7.5% in FY’2020 attributed to increased market activities in the retail front. The average occupancies and asking rents also recorded improvement in performance by 0.7% points and 0.3% points from 75.2% and Kshs 168.6 per SQFT in FY’2020 to 75.7% and Kshs 169.1 per SQFT respectively in H1’2021. The general improvement in the performance of the sector was attributed to; i) aggressive expansion of local and international retailers such as Naivas and Carrefour taking up space previously occupied by troubled retailers such as Tuskys and Nakumatt with the retailers having opened more than 13 stores in 2021 in different locations county wide, ii) improved infrastructure which is opening up areas for investment opportunities and boosting property prices, iii) positive demographics with urbanization and population growth rates of 4.0% p.a and 2.3% p.a respectively, compared to the global average of 1.9% p.a and 1.1% p.a, respectively according to World Bank, and, v) the gradual reopening of the economy.
The performance of the retail sector in Nairobi over time is shown below:
(All Values are in Kshs unless stated otherwise)
|
Summary of Retail Sector Performance Over Time |
|||||||||||
|
Item |
Q1' 2019 |
H1' 2019 |
Q3' 2019 |
FY' 2019 |
Q1'2020 |
H1'2020 |
Q3'2020 |
FY'2020 |
Q1'2021 |
H1'2021 |
∆ FY’2020 |
|
Average Asking Rents (Kshs/SQFT) |
174 |
170 |
167 |
176 |
173 |
170 |
169 |
169 |
166 |
169 |
0.3% |
|
Average Occupancy (%) |
76.8% |
75.6% |
74.5% |
75.9% |
76.3% |
74.0% |
74.2% |
75.2% |
75.0% |
75.7% |
0.7% |
|
Average Rental Yields |
8.5% |
8.2% |
8.0% |
7.8% |
7.7% |
7.4% |
7.4% |
7.5% |
7.4% |
7.6% |
0.1 % |
Source: Cytonn Research 2021
In terms of the sub markets performance, Westlands and Karen were the best performing nodes recording average rental yields of 9.7% and 9.5% respectively compared to the overall market average of 7.6% in H1’2021. The performance is attributed to presence of affluent residents who have a high consumer purchasing power with the areas hosting high-end income earners, relatively good infrastructure, and, relatively high occupancy rates of above 80.0% against the market average of 75.7%.
Eastlands recorded the lowest yields of 5.8% against the average market rates of 7.6%, attributed to low rental charges of Kshs 136 per SQFT against a market average of Kshs 169 per SQFT, competition from informal retail spaces, and constrained consumer purchasing power.
The table below shows the submarket performance in the Nairobi Metropolitan Area (NMA):
(All Values are in Kshs unless stated otherwise)
|
Nairobi Metropolitan Area Retail Market Performance H1’2021 |
|||||||||
|
Area |
Rent/SQFT H1'2021 |
Occupancy % H1'2021 |
Rental Yield H1'2021 |
Rent Kshs/SQFT FY’ 2020 |
Occupancy FY’ 2020 |
Rental Yield FY’ 2020 |
H1 2021 ∆ in Rental Rates |
H1'2021 ∆ in Occupancy (% points) |
H1’ 2021 ∆ in Rental Yield (% points) |
|
Westlands |
209 |
80.0% |
9.7% |
209 |
81.5% |
9.9% |
0.0% |
(1.5%) |
(0.1%) |
|
Karen |
217 |
80.6% |
9.5% |
217 |
81.0% |
9.8% |
0.2% |
(0.4%) |
(0.2%) |
|
Kilimani |
173 |
82.8% |
8.9% |
171 |
82.5% |
8.5% |
0.9% |
0.3% |
0.4% |
|
Ngong Road |
178 |
78.8% |
8.0% |
178 |
80.3% |
8.2% |
0.0% |
(1.5%) |
(0.2%) |
|
Kiambu road |
178 |
68.8% |
7.1% |
176 |
67.5% |
6.9% |
1.2% |
1.3% |
0.2% |
|
Thika Road |
159 |
73.3% |
6.7% |
158 |
70.5% |
6.3% |
1.0% |
2.8% |
0.4% |
|
Mombasa road |
139 |
73.0% |
6.3% |
140 |
70.0% |
5.9% |
(0.8%) |
3.0% |
0.4% |
|
Satellite towns |
134 |
74.0% |
6.2% |
133 |
73.0% |
5.8% |
0.7% |
1.0% |
0.3% |
|
Eastlands |
136 |
70.0% |
5.8% |
137 |
70.2% |
6.1% |
(0.9%) |
(0.2%) |
(0.3%) |
|
Average |
169 |
75.7% |
7.6% |
169 |
75.2% |
7.5% |
0.3% |
0.5% |
0.1% |
Source: Cytonn Research 2021
Notable highlights in H1’2021 include (See Q1’2021, Cytonn Monthly-April 2021, and, Cytonn Monthly-May 2021 highlights);
- Optica Limited, a local eye-wear retailer, opened its 43rd Kenyan outlet in Gateway Mall along Mombasa Road as part of the retailer’s expansion strategy to the geographical outreach of its products and services. For more analysis, please see Cytonn Weekly #24/2021,
- Fusion Capital, a Kenyan based Private Equity firm and a subsidiary of Fusion Investments management, announced that it had raised Kshs 800.0 mn from international investors in the United Kingdom (UK) and Finland as well as local land partners in support of completion of the 12,000 SQFT Greenwood City Mall project worth Kshs 1.2 bn in the Meru’s Central Business District (CBD). For more analysis see Cytonn Weekly #25/2021,
- Naivas supermarket, a local retail chain, opened a new store in Nairobi’s Central Business District (CBD), along Muindi Mbingu Street, taking up prime retail space previously occupied by Tuskys Supermarket. This bring Naivas’ total operational outlets to 73 having already opened 3 other stores so far this year in Eldoret, Nakuru and Kilifi. With Naivas being on an aggressive expansion spree taking up space previously owned by troubled retailers, it also aims to open two more branches next month in Kisumu at Simba Club Hall and in Githurai 44 along Kamiti Road, as it continues to gain more market share relative to its competitors QuickMart and Carrefour who have each opened 4 stores so far this year. The decision by the retailer to take up space within Nairobi’s CBD is supported by i) stiff market competition with closest rivals Carrefour and QuickMart each having 13 and 41 stores respectively, ii) growing middle class with increased purchasing power, iii) positive demographics with Nairobi having registered a 41.9% population increase to 4.4 mn in 2019 from 3.1 mn in 2009, and, iv) exit by troubled retailers leaving prime retail spaces, and,
- Additionally, French retailer Carrefour supermarket, announced plans to open two stores in Kisumu’s United Mall and Mega Plaza in July 2021. The retailer will take up space previously occupied by troubled Tuskys hence bringing its total operational outlets to 15, having opened a new outlet in Nairobi Garden City Mall along Thika Road taking up space that was vacated by Shoprite Supermarket in April. The move by the retailer is supported by; i) a growing middle-income population with improved purchasing power, ii) stiff market competition with closest rivals Naivas and QuickMart each having opened 41 and 73 stores respectively, iii) exit of troubled retailers leaving prime retail space for uptake, and, v) rapid population growth with Kisumu having registered a 33.3% population increase from 0.9mn in 2009 to 1.2mn in 2019.
In terms of performance, according to our Kenya Retail Report 2020, Kisumu registered rental rates of Kshs 97.2 against the market average of Kshs 115.1 hence provide good investment opportunity to the retailer due to affordability.
The table below shows a summary of the performance of the retail sector in key urban cities in Kenya;
|
Summary Performance of Key Urban Cities in Kenya |
|||
|
Region |
Rent/SQFT 2020 |
Occupancy% 2020 |
Rental Yield |
|
Mount Kenya |
125.0 |
78.0% |
7.7% |
|
Nairobi |
168.5 |
74.5% |
7.5% |
|
Mombasa |
114.4 |
76.3% |
6.6% |
|
Kisumu |
97.2 |
74.0% |
6.3% |
|
Eldoret |
130.0 |
80.2% |
5.9% |
|
Nakuru |
55.7 |
76.6% |
5.9% |
|
Average |
115.1 |
76.6% |
6.7% |
Source: Cytonn Research 2020
The table below shows the summary of the number of stores of the key local and international retail supermarket chains in Kenya;
|
Main Local and International Retail Supermarket Chains |
|||||||||
|
Name of Retailer |
Category |
Highest number of branches that have ever existed as at FY’2018 |
Highest number of branches that have ever existed as at FY’2019 |
Highest number of branches that have ever existed as at FY’2020 |
Number of branches opened in 2021 |
Closed branches |
Current number of Branches |
Number of branches expected to be opened |
Projected number of branches FY’2021 |
|
Naivas |
Local |
46 |
61 |
69 |
4 |
0 |
73 |
2 |
75 |
|
QuickMart |
Local |
10 |
29 |
37 |
4 |
0 |
41 |
4 |
45 |
|
Chandarana Foodplus |
Local |
14 |
19 |
20 |
0 |
0 |
20 |
0 |
20 |
|
Carrefour |
International |
6 |
7 |
9 |
4 |
0 |
13 |
2 |
15 |
|
Cleanshelf |
Local |
9 |
10 |
11 |
1 |
0 |
12 |
0 |
12 |
|
Tuskys |
Local |
53 |
64 |
64 |
0 |
61 |
3 |
0 |
3 |
|
Game Stores |
International |
2 |
2 |
3 |
0 |
0 |
3 |
0 |
3 |
|
Uchumi |
Local |
37 |
37 |
37 |
0 |
35 |
2 |
0 |
2 |
|
Choppies |
International |
13 |
15 |
15 |
0 |
13 |
2 |
0 |
2 |
|
Shoprite |
International |
2 |
4 |
4 |
0 |
3 |
1 |
0 |
1 |
|
Nakumatt |
Local |
65 |
65 |
65 |
0 |
65 |
0 |
0 |
0 |
|
Total |
257 |
313 |
334 |
13 |
177 |
170 |
8 |
178 |
|
Source: Online Research
Our outlook for the retail sector is NEUTRAL. Despite the numerous expansion activities by local and international retailers witnessed during the quarter which have continued to support the growth of the retail sector, there are still various factors impending its performance such as the shift to online shopping causing occupancy rates decline, the existing oversupply at 2.0mn SQFT in the Kenyan retail market and 3.1mn SQFT in NMA, as well as the tough economic condition causing space uptake decline.
- Mixed-Use Developments
Notable highlights in the Mixed-Use Developments in H1’2021 include;
- Tatu City, a mixed-use property developer in the country, appointed Australian-based construction company, Snowy Mountains Engineering Corporation (SMEC) as the lead infrastructure consultant for the second phase of its 2,500-acre Tatu Industrial Park in Ruiru, with a projected completion date of May 2022. For more information, see Cytonn Monthly- May 2021,
- Hilshaw Group, a Dubai based firm, was appointed as the adviser and financing consultant of the planned Athi River Smart Green City project in Nairobi by Jetblack Group, which will sit on 4,500 acres, with its development expected to commence in May 2022 and open Phase 1 by end of 2025. For more information, see Cytonn Monthly- May 2021, and,
- Kenya Commercial Bank (KCB) Group announced that it is seeking joint venture partners to finance and develop its 153.2 acres in Juja at a cost of Kshs 6.0 bn for mixed-use development project comprising of 5,786 residential and commercial buildings. KCB’s contribution towards the venture will therefore be its prime land worth Kshs 2.3 bn whereas the JV partner will provide the cash and meet other construction related costs translating to a 38.0 % and 61.0 % shareholding respectively on the successful completion of the project. For more information, see Cytonn Weekly #19/2021.
Mixed-use developments are expected to continue gaining traction as they offer the live, work and play concept thus convenient for the rising sophisticated middle-income earners with huge demand for exceptional lifestyles, relatively higher returns to investors compared to single-use theme developments, and, a diversified portfolio to investors hence risk spread in the case a thematic sector is performing negatively in the market.
Our outlook for MUDs is NEUTRAL due to constraints from some thematic sectors such as commercial office whose reduced demand is expected to weigh down MUDs in which the theme has been incorporated.
- Hospitality Sector
In H1’2021, three hospitality related industry reports were released and the key-take outs were as stated below;
|
# |
Report |
Key Take-out |
|
1 |
Central Bank of Kenya Monetary Policy Committee Hotel Survey-May 2021 |
|
|
2 |
|
|
|
3 |
Kenya National Bureau of Statistics Leading Economic Indicators February 2021 |
|
Some of the major highlights during the first half of the year include (see Q1’2021 highlights);
- In June 2021, the Kenyan government through the Ministry of Foreign Affairs, lifted the ban on passenger flights between Nairobi and London, with flights expected to resume on June 26th 2021. Additionally, the United States of America (USA) lowered Kenya’s travel advisory from level 4 to level 2 citing moderate levels of Covid-19 in the country, having issued the highest level of advisory since April 2021. For more information, see Cytonn Weekly #24/2021,
- In May 2021, Kenya Airports Authority announced that JKIA passenger movement registered a 24.1% decline in the month of March 2021, to 279,413 passengers from 368,279 passengers in the same period last year. For more analysis, see Cytonn Weekly #21/2021, and,
- In April 2021, the United States of America (USA) retained the highest travel advisory on Kenya after the Centre for Disease Control (CDC) issued a Level Four Travel Health Advisory to American nationals due to the steep rise in Covid-19 cases in the country. Additionally, Kenyan government and the United Kingdom (UK) announced plans to form a joint committee to review the travel restrictions that triggered a tit-or-tat travel blockade between UK and Kenya over rising Covid-19 risk levels. For more information, see Cytonn Weekly #14/2021.
The hospitality sector is expected to bounce back after being one of the worst hit sectors by the Covid-19 pandemic, as evidenced by the increased number of operating hotels and bed occupancies coupled with expected increase in tourist arrivals from the lifting of travel bans, revision of travel restrictions and the government’s efforts to resolve affairs affecting tourism. The government has also reiterated its support for the tourism sector through incentives such as World Rally Championships 2021 which the President of Kenya, Hon. Uhuru Kenyatta, announced that they will run for five years up to 2026 in order to boost tourism in the country. The Cabinet Secretary for Tourism and Wildlife, Hon. Najib Balala, also announced measures to give priority vaccination to workers in the tourism sector as well as the consequent top ups to the initial Kshs 500.0 mn (USD 4.7 million) set aside under the economic stimulus package last year to help the tourism sector recover from the COVID-19 outbreak.
The sector, however, still faces setbacks from reduced budgetary allocations with tourism allocation for FY’2021/22 reducing by 11.3% to Kshs 18.1 bn compared to Kshs 20.4 bn and the uncertainties emanating from Covid-19 infection waves. Therefore, our outlook for the tourism sector is NEUTRAL despite the huge strides being made to revive it after a tough 2020, due to the uncertainties of Covid-19 with new infections, waves and variants expected to constrain recovery in the sector.
- Land Sector
During H1’2021, the land sector recorded an overall annualized capital appreciation of 1.6%, with asking land prices in low rise residential areas recording a 4.9 % annualized capital appreciation, attributed to the relative affordability of land valued at Kshs 88.3mn per acre compared to high rise areas selling at Kshs 132.7mn per acre. Other factors making the areas attractive to people is the fact that they are sparely populated thereby offering exclusivity and privacy. Land in the commercial zone recorded a (3.7%) price correction to approximately Kshs 131.0 mn per acre compared to Kshs 133.0 mn per acre due to reduced demand for land in commercial zones as most developers have put on hold their activities as they await the absorption of the current office supply with the oversupply being at 7.3mn SQFT.
The table below shows the performance of the sector during the quarter:
(All Values are in Kshs unless stated otherwise)
|
Nairobi Metropolitan Area(NMA) Land Performance H1'2020 |
|||
|
Price Per Acre H1'2020 |
Price per acre H1'2021 |
Annualized Capital Appreciation |
|
|
Nairobi Suburbs- Low Rise Residential Areas |
84.3 mn |
88.3 mn |
4.9% |
|
Serviced land |
15.1 mn |
15.7 mn |
2.9% |
|
Satelite Towns Unserviced Land |
13.2 mn |
13.5 mn |
2.3% |
|
Nairobi Suburbs- High Rise Residential Areas |
133.2 mn |
132.7 mn |
(0.7%) |
|
Nairobi Suburbs- Commercial Areas |
419.2 mn |
404.6 mn |
(3.7%) |
|
Average |
133.0 mn |
131.0 mn |
1.6% |
Source: Cytonn Research 2021
Performance per node
- The asking prices of land in the low-rise areas recorded an annual capital appreciation of 4.9% attributable to high demand in the areas. These areas have also remained attractive due to their exclusivity and privacy with the areas being attractive for family units as they are sparsely populated. Kitisuru was the best performing submarket in the low-rise residential segment recording an annualized capital appreciation of 6.7% attributed to growing demand for land to develop and availability of good infrastructure allowing ease of access to the area.
(All Values are in Kshs unless stated otherwise)
|
Low Rise Residential Areas |
|||
|
Location |
Price Per Acre (Kshs) H1'2020 |
Price per acre (Kshs) H1'2021 |
Annualized Capital Appreciation |
|
Kitisuru |
72.7 mn |
77.9 mn |
6.7% |
|
Runda |
70.2 mn |
74.3 mn |
5.5% |
|
Karen |
56.4 mn |
59.6 mn |
5.4% |
|
Ridgeways |
65.9 mn |
68.8 mn |
4.1% |
|
Spring Valley |
156.1 mn |
161.0 mn |
3.0% |
|
Average |
84.3 mn |
88.3 mn |
4.9% |
Source: Cytonn Research 2021
- The asking price of unserviced land in satellite towns recorded an annualized capital appreciation of 3.3% attributed to increased demand for development land supported by; i) affordability with the average price of land going at Kshs 13.5 mn per acre compared to the market average of 131.0 mn, ii) continued focus on affordable housing, iii) positive demographics, and, iv) improving infrastructure thereby opening up areas for development. Juja was the best performing node with an annualized capital appreciation of 5.5% attributed to affordability with the asking prices coming in at an average of Kshs 10.6 mn per acre compared to an average of Kshs 13.5 mn for the satellite towns unserviced land, and availability of infrastructure with the area being served by Thika super highway.
(All Values are in Kshs unless stated otherwise)
|
Satellite Towns- Unserviced Land |
|||
|
Location |
Price Per Acre (Kshs) H1'2020 |
Price per acre (Kshs) H1'2021 |
Annualized Capital Appreciation |
|
Juja |
10.0 mn |
10.6 mn |
5.5% |
|
Athi River |
4.3 mn |
4.5 mn |
4.4% |
|
Utawala |
12.0 mn |
12.4 mn |
3.2% |
|
Ongata Rongai |
18.6 mn |
19.0 mn |
2.1% |
|
Limuru |
21.0 mn |
21.2 mn |
1.0% |
|
Average |
13.2 mn |
13.5 mn |
3.3% |
- The serviced land in satellite towns recorded an average annualized capital appreciation of 2.9% with Ongata Rongai recording an annualized capital appreciation of 8.1% compared to the satelite towns average of 2.9% attributed to i) increased demand for land especially from the middle-income population, ii) positive demographics and iii) availability of infrastructure with the area being served by the Magadi Road which is opening the area for real estate development. Ruai on the other hand recorded a price correction of (3.6%) attributed to reduced demand of land as investors focus on areas witnessing more real estate related activities.
(All Values are in Kshs unless stated otherwise)
|
Satellite Towns- Serviced Land |
|||
|
Location |
Price Per Acre (Kshs) H1'2020 |
Price per acre (Kshs) H1'2021 |
Annualized Capital Appreciation |
|
Ongata Rongai |
18.4 mn |
20.0 mn |
8.1% |
|
Athi River |
12.4 mn |
13.1 mn |
5.6% |
|
Ruiru |
24.0 mn |
25.3 mn |
5.2% |
|
Thika |
10.0 mn |
10.4 mn |
3.5% |
|
Syokimau-Mlolongo |
12.0 mn |
11.8 mn |
(1.4%) |
|
Ruai |
14.0 mn |
13.5 mn |
(3.6%) |
|
Average |
15.1 mn |
15.7 mn |
2.9% |
- The asking land prices in the high-rise residential areas recorded a 0.7% annualized capital appreciation in H1’2021 with Embakasi being the best perform node at 6.5% mainly attributable to affordability of land prices averaging at Kshs 67.2mn mn compared to the node’s average of Kshs 132.7 mn. The attractiveness is also supported by developers showing interest in the area to accommodate the growing middle-income population and availability of infrastructure with the area being served by the Airport Road and part of the Outer Ring Road.
(All Values are in Kshs unless stated otherwise)
|
High Rise Residential Areas |
|||
|
Location |
Price Per Acre (Kshs) H1'2020 |
Price per acre (Kshs) H1'2021 |
Annualized Capital Appreciation |
|
Embakasi |
62.8 mn |
67.2 mn |
6.5% |
|
Kasarani |
64.8 mn |
67.7 mn |
4.2% |
|
Kileleshwa |
303.1 mn |
300.9 mn |
(0.7%) |
|
Dagoretti |
102.1 mn |
95.2 mn |
(7.3%) |
|
Average |
133.2 mn |
132.7 mn |
0.7% |
Source: Cytonn Report 2021
- The commercial zones recorded a 3.7% price correction in the average asking land prices. This is attributed to reduced demand for development space mainly due to the high asking prices of Kshs 404.6 mn per acre thus limiting the ability of developers to generate favorable returns from the investments and decreased activities in the commercial office front. The existing oversupply in the commercial office spaces of 7.3 mn SQFT in the Nairobi metropolitan area has also affected the supply since developers have halted their development plans to allow for absorption of the existing spaces.
(All Values are in Kshs unless stated otherwise)
|
Commercial Zones |
|||
|
Location |
Price Per Acre (Kshs) H1'2020 |
Price per acre (Kshs) H1'2021 |
Annualized Capital Appreciation |
|
Westlands |
421.3 mn |
413.6 mn |
(1.9%) |
|
Upper Hill |
506.1 mn |
487.3 mn |
(3.9%) |
|
Kilimani |
398.5 mn |
381.7 mn |
(4.4%) |
|
Riverside |
350.9 mn |
335.7 mn |
(4.5%) |
|
Average |
419.2 mn |
404.6 mn |
(3.7%) |
Notable highlights in the land sector in H1’2021 include:
- President Uhuru Kenyatta officially launched the National Land Information Management System (NLIMS) marking the culmination of years of digitization of land records in Kenya. The launch of the digital land platform named ‘Ardhi Sasa’, which will be first rolled out in Nairobi then in other counties in phases, coincided with the opening of the National Geospatial Data Centre, an online depository that will contain all the land records in Kenya. For more analysis, please see Cytonn Monthly-April 2021, and,
- The Central Lands Registry, whose offices are located in Ardhi House, Upperhill Nairobi, was shut down after its operations were migrated to an online platform following the official launch of the National Land Information Management System (NLIMS) by President Uhuru Kenyatta last month. The launch of the digital land platform named ‘Ardhi Sasa’, first rolled out in Nairobi will be implemented in other counties in phases in an effort to contain fraud in the land sector. For more analysis, please see Cytonn Monthly-May 2021.
The land sector has continued to show resilience recording despite the ongoing pandemic which has affected some of the real estate sectors. We therefore hold a POSITIVE outlook for the land sector and we expect the performance of the land sector to continue being supported by factors such as; i) positive demographics, ii) growing demand for land particularly in the satellite areas, iii) improving infrastructure thereby opening up areas for investment, and, iv) the continued focus on the affordable housing initiative.
- Infrastructure Sector
Major developments in the infrastructure sector in H1’2021 include;
- Upgrading of the Kshs 10.8 bn Garsen- Minjilla- Mokowe 113-km road project linking Lamu and Tana River County was concluded and launched by President Uhuru Kenyatta. For more information, see Cytonn Weekly #23/2021,
- Cabinet Secretary for Transport, Infrastructure, Housing, Urban development and Public Works, Hon. James Macharia announced that the construction of the 233-km Nairobi-Mau Summit highway is expected to begin in September 2021 at a cost of Kshs 160.0 bn in a build, operate and transfer (BOT) 30-year partnership. For more information, see the Cytonn Monthly- May 2021,
- President Uhuru Kenyatta launched the first berth of the Lamu Port-South Sudan-Ethiopia-Transport (LAPSSET) corridor, a project that targets to link Kenya to South Sudan, Ethiopia and the middle belt of Africa. For more information, please see Cytonn Weekly #20/2021,
- Uganda signed a Public Private Partnership deal worth Kshs 5.0 bn with China Roads and Bridge Corporation (CRBC) to renovate its century-old meter gauge railway line between Malaba and Kampala, which will link the Standard Gauge Railway (SGR) track in Kenya through Naivasha to Malaba old railway. For more information, see Cytonn Weekly #20/2021, and,
- The Government of Kenya, through the State Department of infrastructure released Kshs 3.1 bn to complete tarmacking of the 192.0 km Kabati-Migwani-Mbondoni road in Kitui. The road will join the Lamu Port-South Sudan-Ethiopia Transport (LAPSSET) corridor hence linking Machakos, Makueni and Kitui counties to the coastal and northern areas such as Tharaka-Nithi, Meru to Moyale. For more information, see Cytonn Weekly #16/2021.
Infrastructural developments are expected to; i) open up areas for investments, ii) increase total returns to investors due to a boost in property prices, and, iii) enhance efficient real estate supply chains.
- Statutory Review
In H1’2021, the main policy reforms included;
- Nairobi’s City Hall announced plans to conduct public participation into the New Draft Valuation Roll, on 16th June 2021 in the 17 sub-counties in Nairobi, to pave way for its roll-out, since being tabled before the Nairobi County Assembly in February. For more information, see Cytonn Weekly #21/2021.
- Listed REITs
The Fahari I-REIT closed the month of June trading at Kshs 6.1 per share, a 5.2% YTD price increase having opened the year trading at Kshs 5.8 per share. However, the share price is generally low when compared to its Kshs 20.0 inception price in November 2015, which is an overall 69.5% decline, with Net Asset Value of the REIT being Kshs 19.8. The graph below shows performance of the Fahari I-REIT since inception;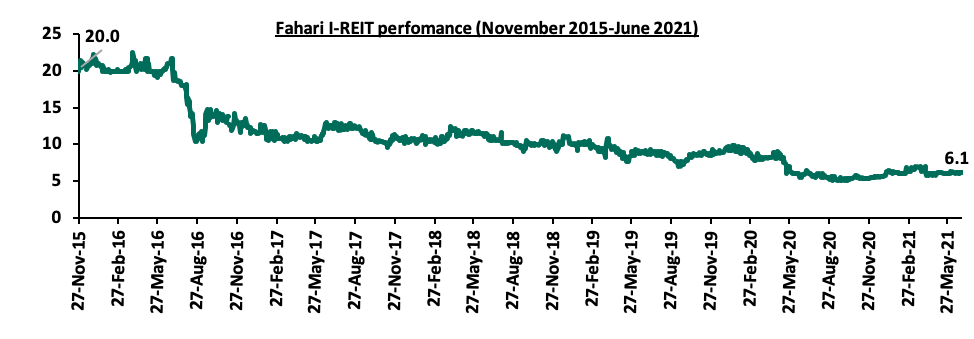
REITs offer various benefits which include low cost exposure to real estate, tax exemption, and diversification among many others, however, our outlook for the sector is NEUTRAL as its performance is expected to still be constrained by factors such as; i) inadequate investor knowledge of the instrument, ii) lengthy approval process, iii) high Minimum Capital Requirements for a Trustee of Kshs 100.0 mn, iv) subdued performance of some real estate sectors due to the COVID-19 pandemic, and, v) high Minimum Investment Amounts Set at Kshs 5.0 mn.
Real Estate Performance Summary and Outlook
Below is a summary of the sectorial performance in H1’2020 and investment opportunities:
|
Theme |
Thematic Performance and Outlook Q1’2021 |
Outlook |
|
Residential |
|
Neutral |
|
||
|
Office |
|
Negative |
|
||
|
Retail |
|
Neutral |
|
||
|
Mixed-Use Developments (MUDs) |
|
Neutral |
|
||
|
Hospitality |
|
Neutral |
|
||
|
Land |
|
Positive |
|
||
|
Listed Real Estate |
|
Neutral |
With the positive outlook for land sector, negative outlook for the commercial office sector and neutral outlook for the residential, retail, MUDs, hospitality and REITs sectors, our overall outlook for the real estate sector is NEUTRAL with performance expected to be supported by; government aggressiveness on affordable housing initiative, improved infrastructure activities, positive demographics, improved mortgage availability, and improved retail space uptake. However, performance of the sector is likely to be constrained by reduced demand for office and retail spaces due to remote working and online shopping, reduced purchasing power of people due to the tough economic conditions, high mortgage interest rates, and the existing oversupply in the retail and commercial sectors.
Disclaimer: The views expressed in this publication are those of the writers where particulars are not warranted. This publication, which is in compliance with Section 2 of the Capital Markets Authority Act Cap 485A, is meant for general information only and is not a warranty, representation, advice or solicitation of any nature. Readers are advised in all circumstances to seek the advice of a registered investment advisor.

- Talk to us
- Kenya
- P.O Box 20695 - 00200, Nairobi, Kenya
- Cell +254709101200
- Tel +254709101200
- WhatsApp +254741676635
- United States
- +254709101200
- DOWNLOAD OUR APP
-


- Kenya
- 8th Floor, Pinetree Plaza, Kaburu Drive, Ngong Road, Nairobi, Kenya
- USA
- Suite 1150, 1775 Eye Street NW, USA, Washington DC 20006, USA
- Investments
- High Yield
- Private Equity
- Real Estate
- Real Estate
- RiverRun Estates
- Cytonn Towers
- The Ridge
- Taraji Heights
- The Alma