Kenya Mortgage Refinance Company (KMRC) Review 2024, & Cytonn Weekly #15/2024
By Research Team, Apr 14, 2024
Executive Summary
Fixed Income
During the week, T-bills were oversubscribed, with the overall oversubscription rate coming in at 192.8%, higher than the oversubscription rate of 118.7% recorded the previous week. Investors’ preference for the shorter 91-day paper persisted, with the paper receiving bids worth Kshs 16.4 bn against the offered Kshs 4.0 bn, translating to an oversubscription rate of 410.4%, significantly higher than the oversubscription rate of 217.3% recorded the previous week. The subscription rates for the 182-day paper and 364-day paper increased to 105.6% and 192.9% respectively from 58.7% and 139.1% respectively, recorded the previous week. The government accepted a total of Kshs 45.7 bn worth of bids out of Kshs 46.3 bn of bids received, translating to an acceptance rate of 98.8%. The yields on the government papers were on a downward trajectory, with the yield on the 91-day paper decreasing the most by 99.1bps to 15.7% from the 16.7% recorded the previous week, while the yield on the 364-day decreased by 45.9 bps to 16.5%, from 17.0% recorded the previous week. Notably, the yield on the 182-day paper decreased the least by 0.5 bps to remain relatively unchanged at 16.9% recorded the previous week;
Equities
During the week, the equities market was on a downward trajectory, with both NASI and NSE 10 declining the most by 2.4%, while NSE 25 and NSE 20 declined by 2.3% and 1.3% respectively, taking the YTD performance to gains of 25.2%, 22.8%, 20.3% and 14.3% for NSE 10, NSE 25, NASI and NSE 20 respectively. The equities market performance was driven by losses recorded by large-cap stocks such as Stanbic Bank, DTB-K, and Cooperative Bank which were down by 6.7%, 6.5%, and 5.0% respectively. The performance was, however, supported by gains recorded by large cap stocks such as Bamburi Cement and EABL which increased by 10.1% and 1.1% respectively;
Real Estate
During the week, on the Unquoted Securities Platform, as per the last trading data recorded on 22nd March 2024, Acorn D-REIT and I-REIT traded at Kshs 24.4 and Kshs 21.7 per unit, respectively. The performance represented a 22.0% and 8.3% gain for the D-REIT and I-REIT, respectively, from the Kshs 20.0 inception price;
Focus of the Week
Over the years, Kenya has grappled with rapid population growth and high urbanization rates, exacerbating the country's housing shortage. In response to this challenge, the government has implemented different measures including the Affordable Housing Program (AHP) under the Bottom-Up Economic Transformation Agenda (BETA) and the establishment of the Kenya Mortgage Refinance Company (KMRC). KMRC's mandate is to provide long-term funds to primary mortgage lenders (PMLs) for onward lending to increase the availability of affordable home loans to Kenyans. Since its inception, KMRC has made notable progress, having disbursed 3,300 loans as of 2024, contributing to increased homeownership in the country. While KMRC has achieved significant milestones, there remains a substantial gap in the annual housing deficit and the mortgage market remains underdeveloped;
Investment Updates:
- Weekly Rates:
- Cytonn Money Market Fund closed the week at a yield of 17.07% p.a. To invest, dial *809# or download the Cytonn App from Google Play store here or from the Appstore here;
- We continue to offer Wealth Management Training every Monday and Thursday, from 7:00 pm to 8:00 pm. The training aims to grow financial literacy among the general public. To register for any of our Wealth Management Trainings, click here;
- If interested in our Private Wealth Management Training for your employees or investment group, please get in touch with us through wmt@cytonn.com;
- Cytonn Insurance Agency acts as an intermediary for those looking to secure their assets and loved ones’ future through insurance namely; Motor, Medical, Life, Property, WIBA, Credit and Fire and Burglary insurance covers. For assistance, get in touch with us through insuranceagency@cytonn.com;
- Cytonn Asset Managers Limited (CAML) continues to offer pension products to meet the needs of both individual clients who want to save for their retirement during their working years and Institutional clients that want to contribute on behalf of their employees to help them build their retirement pot. To more about our pension schemes, kindly get in touch with us through pensions@cytonn.com;
Real Estate Updates:
- For more information on Cytonn’s real estate developments, email us at sales@cytonn.com;
- Phase 3 of The Alma is now ready for occupation and the show house is open daily. To join the waiting list to rent, please email properties@cytonn.com;
- For Third Party Real Estate Consultancy Services, email us at rdo@cytonn.com;
- For recent news about the group, see our news section here;
Hospitality Updates:
- We currently have promotions for Staycations. Visit cysuites.com/offers for details or email us at sales@cysuites.com;
Money Markets, T-Bills Primary Auction:
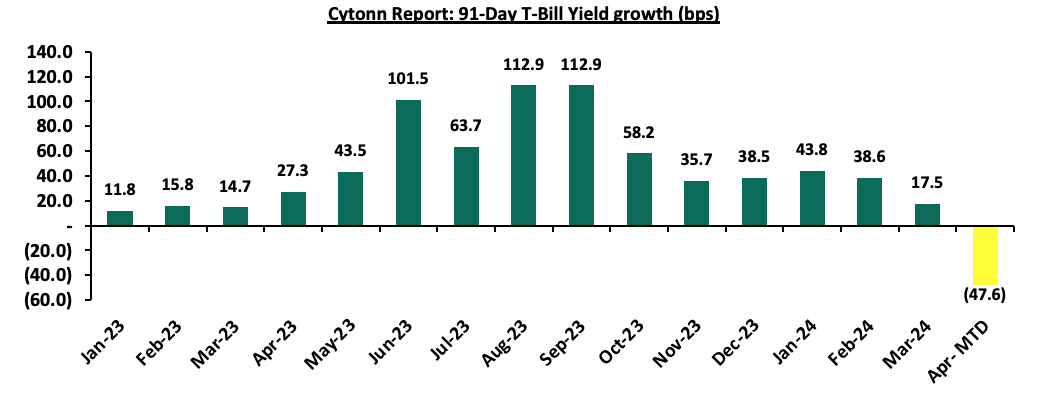
During the week, T-bills were oversubscribed, with the overall oversubscription rate coming in at 192.8%, higher than the oversubscription rate of 118.7% recorded the previous week. Investors’ preference for the shorter 91-day paper persisted, with the paper receiving bids worth Kshs 16.4 bn against the offered Kshs 4.0 bn, translating to an oversubscription rate of 410.4%, significantly higher than the oversubscription rate of 217.3% recorded the previous week. The subscription rates for the 182-day paper and 364-day paper increased to 105.6% and 192.9% respectively from 58.7% and 139.1% respectively, recorded the previous week. The government accepted a total of Kshs 45.7 bn worth of bids out of Kshs 46.3 bn of bids received, translating to an acceptance rate of 98.8%. The yields on the government papers were on a downward trajectory, with the yield on the 91-day paper decreasing the most by 99.1bps to 15.7% from the 16.7% recorded the previous week, while the yield on the 364-day decreased by 45.9 bps to 16.5%, from 17.0% recorded the previous week. Notably, the yield on the 182-day paper decreased the least by 0.5 bps to remain relatively unchanged at 16.9% recorded the previous week. The chart below shows the yield growth rate for the 91-day paper over the period:
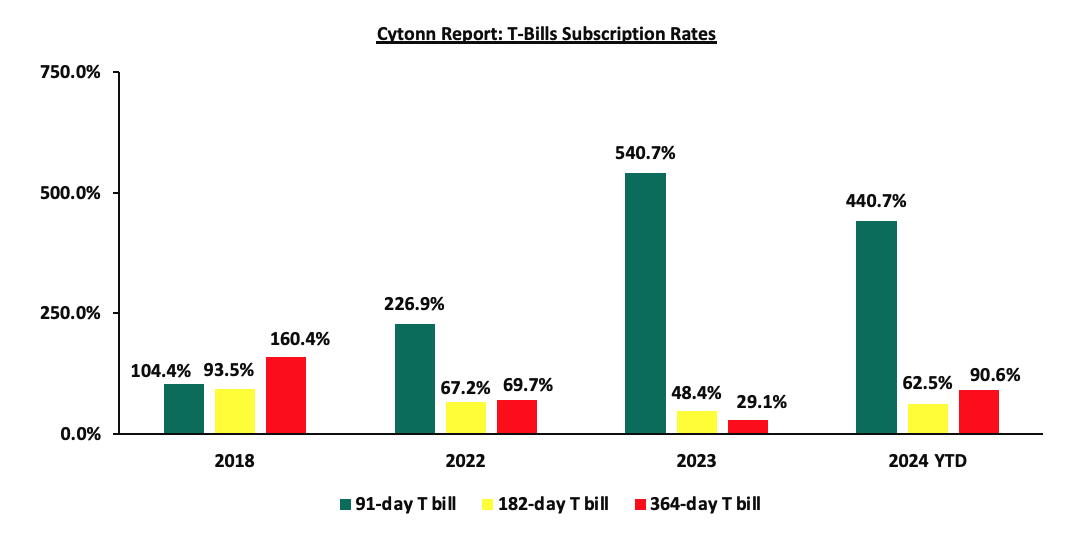
The chart below compares the overall average T-bill subscription rates obtained in 2018, 2022, 2023, and 2024 Year-to-date (YTD):
Money Market Performance:
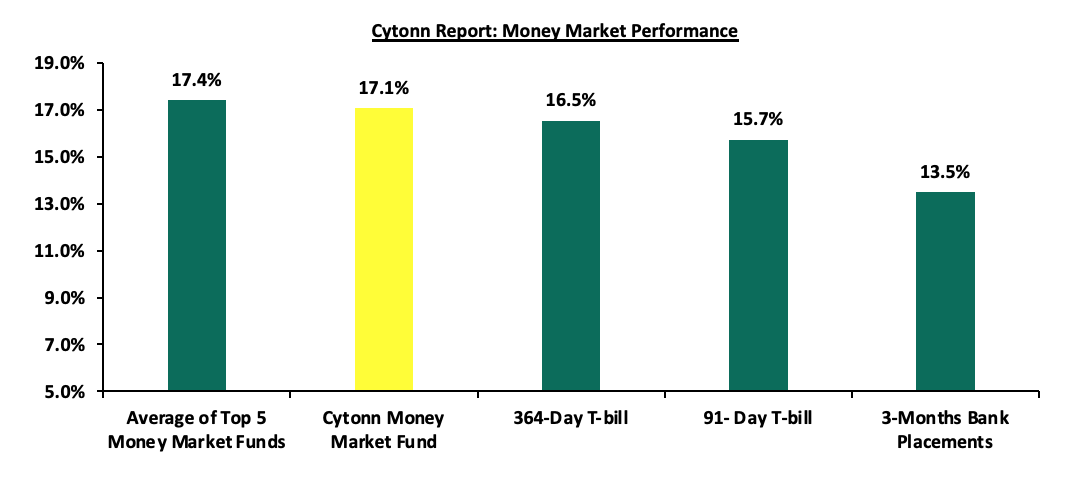
In the money markets, 3-month bank placements ended the week at 13.5% (based on what we have been offered by various banks), and the yields on the 364-day and 91-day papers decreased significantly by 45.9 bps and 99.1 bps to 16.5% and 15.7% respectively from the 17.0% and 16.7%, respectively recorded the previous week. The yields of the Cytonn Money Market Fund remained relatively unchanged at 17.1% while the average yields on the Top 5 Money Market Funds decreased marginally by 3.2 bps to 17.4% recorded the previous week.
The table below shows the Money Market Fund Yields for Kenyan Fund Managers as published on 12th April 2024:
|
Cytonn Report: Money Market Fund Yield for Fund Managers as published on 12th April 2024 |
||
|
Rank |
Fund Manager |
Effective Annual Rate |
|
1 |
Lofty-Corban Money Market Fund |
18.2% |
|
2 |
Etica Money Market Fund |
18.1% |
|
3 |
GenAfrica Money Market Fund |
17.2% |
|
4 |
Cytonn Money Market Fund (Dial *809# or download the Cytonn app) |
17.1% |
|
5 |
Nabo Africa Money Market Fund |
16.5% |
|
6 |
Enwealth Money Market Fund |
16.3% |
|
7 |
Kuza Money Market fund |
16.2% |
|
8 |
Apollo Money Market Fund |
15.9% |
|
9 |
Co-op Money Market Fund |
15.4% |
|
10 |
Jubilee Money Market Fund |
15.3% |
|
11 |
Absa Shilling Money Market Fund |
15.2% |
|
12 |
KCB Money Market Fund |
15.2% |
|
13 |
Madison Money Market Fund |
15.1% |
|
14 |
Mali Money Market Fund |
14.9% |
|
15 |
Equity Money Market Fund |
14.8% |
|
16 |
Sanlam Money Market Fund |
14.8% |
|
17 |
AA Kenya Shillings Fund |
14.7% |
|
18 |
GenCap Hela Imara Money Market Fund |
14.5% |
|
19 |
Mayfair Money Market Fund |
14.4% |
|
20 |
Orient Kasha Money Market Fund |
13.6% |
|
21 |
Old Mutual Money Market Fund |
13.6% |
|
22 |
Dry Associates Money Market Fund |
13.4% |
|
23 |
CIC Money Market Fund |
13.2% |
|
24 |
ICEA Lion Money Market Fund |
12.3% |
|
25 |
British-American Money Market Fund |
9.9% |
Source: Business Daily
Liquidity:
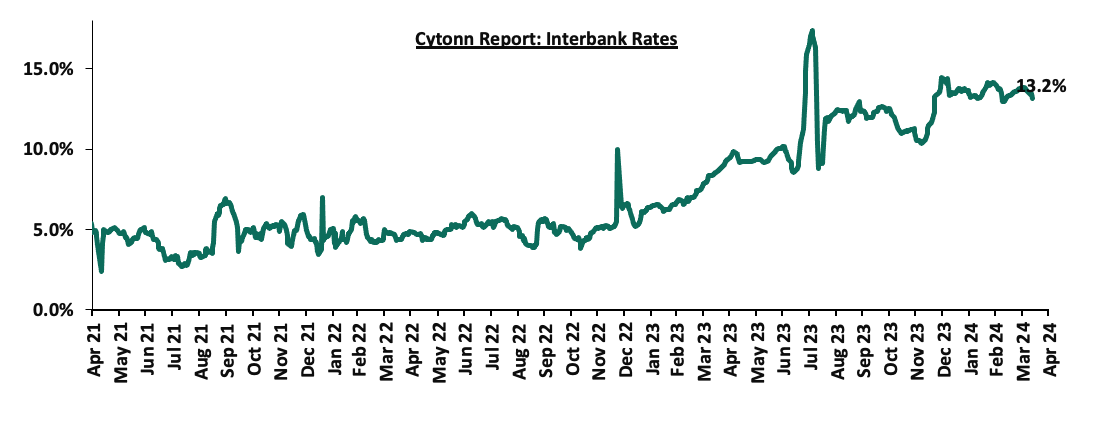
During the week, liquidity in the money markets eased, with the average interbank rate decreasing by 39.3 bps, to 13.4%, from 13.8% recorded the previous week, partly attributable to the government payments that offset tax remittances. The average interbank volumes traded increased marginally by 0.4% to Kshs 24.6 bn from Kshs 24.5 bn recorded the previous week. The chart below shows the interbank rates in the market over the years:
Kenya Eurobonds:
During the week, the yields on Eurobonds were on an upward trajectory, with the yields on the 7-year Eurobond issued in 2019 increasing the most by 35.6 bps to 8.8% from 8.5% recorded the previous week, while the 30-year Eurobond issued in 2018 increased the least by 14.1 bps to 9.9% from 9.8% recorded the previous week. The table below shows the summary of the performance of the Kenyan Eurobonds as of 11th April 2024;
|
Cytonn Report: Kenya Eurobonds Performance |
||||||
|
|
2018 |
2019 |
2021 |
2024 |
||
|
Tenor |
10-year issue |
30-year issue |
7-year issue |
12-year issue |
13-year issue |
6-year issue |
|
Amount Issued (USD) |
1.0 bn |
1.0 bn |
0.9 bn |
1.2 bn |
1.0 bn |
1.5 bn |
|
Years to Maturity |
3.9 |
23.9 |
3.1 |
8.1 |
10.2 |
6.8 |
|
Yields at Issue |
7.3% |
8.3% |
7.0% |
7.9% |
6.2% |
10.4% |
|
01-Jan-24 |
9.8% |
10.2% |
10.1% |
9.9% |
9.5% |
|
|
01-Apr-24 |
8.7% |
9.8% |
8.4% |
9.3% |
9.3% |
9.2% |
|
04-Apr-24 |
8.7% |
9.8% |
8.5% |
9.3% |
9.4% |
9.3% |
|
05-Apr-24 |
8.8% |
9.9% |
8.5% |
9.4% |
9.4% |
9.4% |
|
08-Apr-24 |
8.8% |
9.8% |
8.5% |
9.3% |
9.4% |
9.4% |
|
09-Apr-24 |
8.6% |
9.7% |
8.3% |
9.2% |
9.3% |
9.2% |
|
10-Apr-24 |
8.8% |
9.8% |
8.6% |
9.3% |
9.4% |
9.3% |
|
11-Apr-24 |
9.0% |
9.9% |
8.8% |
9.5% |
9.6% |
9.5% |
|
Weekly Change |
0.3% |
0.1% |
0.4% |
0.2% |
0.2% |
0.3% |
|
MTD Change |
0.3% |
0.1% |
0.4% |
0.3% |
0.3% |
0.3% |
|
YTD Change |
(0.9%) |
(0.2%) |
(1.3%) |
(0.4%) |
0.1% |
- |
Source: Central Bank of Kenya (CBK) and National Treasury
Kenya Shilling:
During the week, the Kenya Shilling gained marginally against the US Dollar by 0.3%, to close the week at Kshs 130.4, from Kshs 130.7 recorded the previous week. On a year-to-date basis, the shilling has appreciated by 17.0% against the dollar, a contrast to the 26.8% depreciation recorded in 2023.
We expect the shilling to be supported by:
- Diaspora remittances standing at a cumulative USD 4,380.5 mn in the 12 months to March 2024, 9.0% higher than the USD 4,019.6 mn recorded over the same period in 2023. America remains the largest source of remittances to Kenya accounting for 56.0% in the March, and,
- The tourism inflow receipts which came in at USD 352.5 bn in 2023, a 31.5% increase from USD 268.1 bn inflow receipts recorded in 2022. The increase is due to tourist arrivals that improved by 27.6% to 182,000 in the 12 months to January 2024, from 151,000 recorded during a similar period in 2023.
The shilling is however expected to remain under pressure in 2024 as a result of:
- An ever-present current account deficit which came at 3.5% of GDP in Q3’2023 from 6.4% recorded in a similar period in 2022,
- The need for government debt servicing, continues to put pressure on forex reserves given that 67.5% of Kenya’s external debt was US Dollar denominated as of September 2023, and,
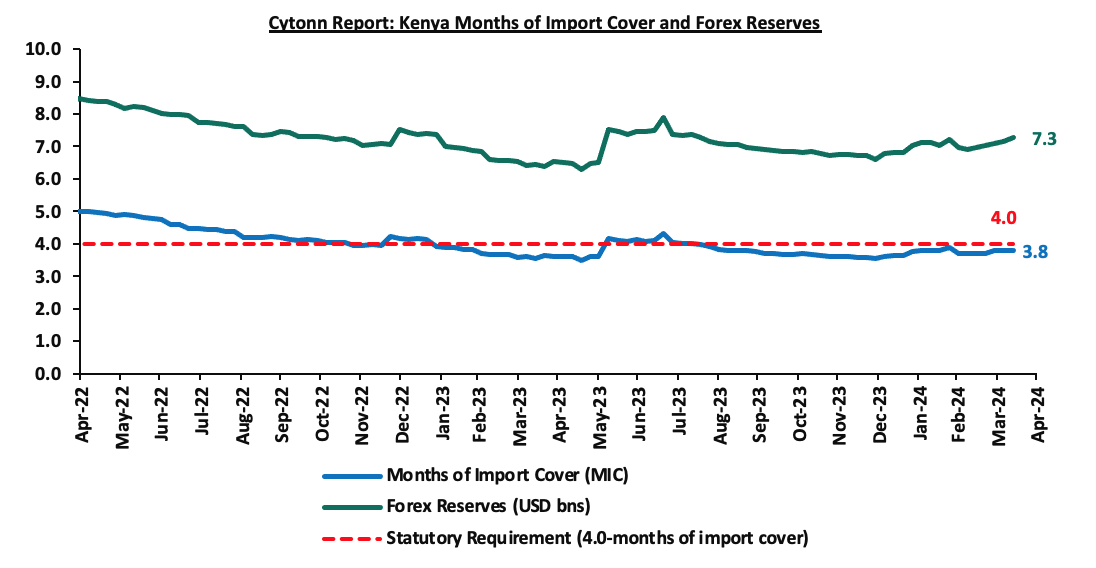
- Dwindling forex reserves, currently at USD 7.3 mn (equivalent to 3.8 months of import cover), which is below the statutory requirement of maintaining at least 4.0 months of import cover.
Key to note, Kenya’s forex reserves increased by 2.0% during the week to USD 7.3 bn from the USD 7.1 recorded the previous week. The current reserves are equivalent to 3.8 months of import cover and they were relatively unchanged from the months of import cover recorded the previous week. They remained below the statutory requirement of maintaining at least 4.0 months of import cover. The chart below summarizes the evolution of Kenya's months of import cover over the years:
Rates in the Fixed Income market have been on an upward trend given the continued high demand for cash by the government and the occasional liquidity tightness in the money market. The government is 14.8% ahead of its prorated net domestic borrowing target of Kshs 374.2 bn, having a net borrowing position of Kshs 429.7 bn out of the domestic net borrowing target of Kshs 471.4 bn for the FY’2023/2024. However, we expect a downward readjustment of the yield curve in the short and medium term, with the government looking to increase its external borrowing to maintain the fiscal surplus, hence alleviating pressure in the domestic market. As such, we expect the yield curve to normalize in the medium to long-term and hence investors are expected to shift towards the long-term papers to lock in the higher rates.
Market Performance:
During the week, the equities market was on a downward trajectory, with both NASI and NSE 10 declining the most by 2.4%, while NSE 25 and NSE 20 declined by 2.3% and 1.3% respectively, taking the YTD performance to gains of 25.2%, 22.8%, 20.3% and 14.3% for NSE 10, NSE 25, NASI and NSE 20 respectively. The equities market performance was driven by losses recorded by large-cap stocks such as Stanbic Bank, DTB-K, and Cooperative Bank of 6.7%, 6.5%, and 5.0% respectively. The performance was, however, supported by gains recorded by large cap stocks such as Bamburi Cement and EABL which increased by 10.1% and 1.1% respectively.
During the week, equities turnover decreased by 42.0% to USD 10.6 mn from USD 18.2 mn recorded the previous week, taking the YTD total turnover to USD 159.2 mn. Foreign investors became net buyers for the first time in three weeks with a net buying position of USD 2.4 mn, from a net selling position of USD 1.1 mn recorded the previous week, taking the YTD foreign net selling position to USD 15.1 mn.
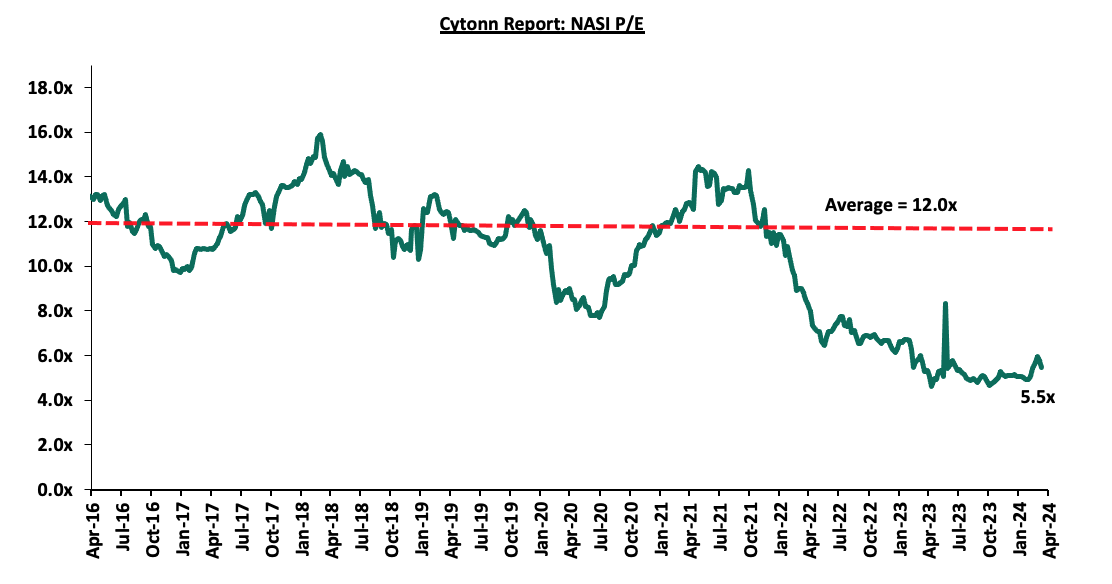
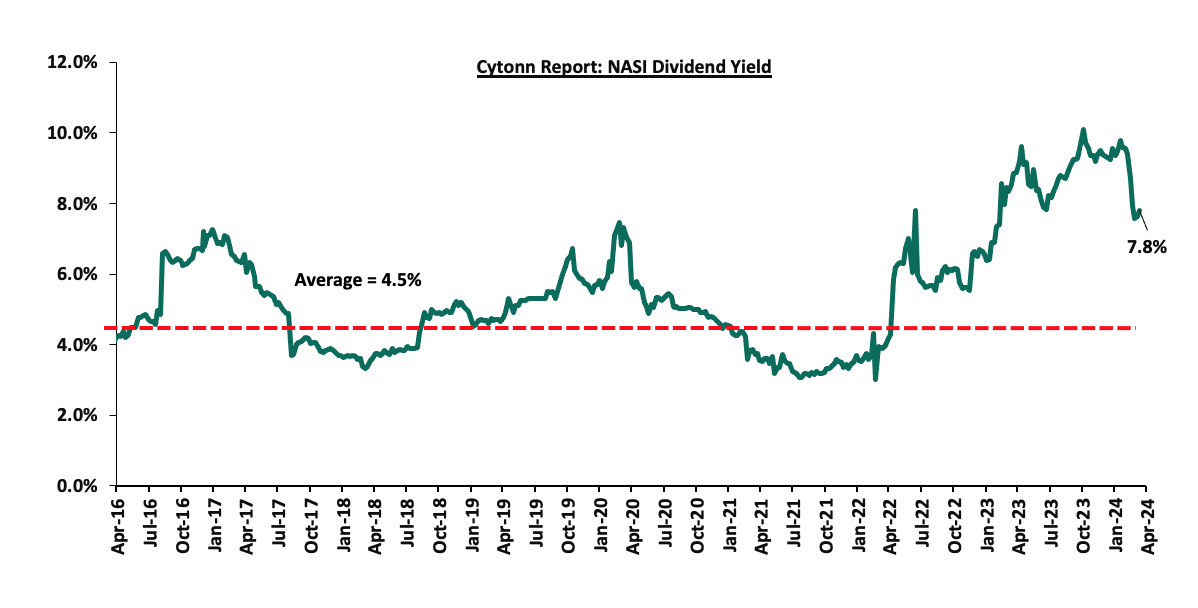
The market is currently trading at a price-to-earnings ratio (P/E) of 5.5x, 54.5% below the historical average of 12.0x. The dividend yield stands at 7.8%, 3.3% points above the historical average of 4.5%. Key to note, NASI’s PEG ratio currently stands at 0.7x, an indication that the market is undervalued relative to its future growth. A PEG ratio greater than 1.0x indicates the market is overvalued while a PEG ratio less than 1.0x indicates that the market is undervalued. The charts below indicate the historical P/E and dividend yields of the market:
Universe of Coverage:
|
Cytonn Report: Equities Universe of Coverage |
|||||||||
|
Company |
Price as at 05/04/2024 |
Price as at 12/04/2024 |
w/w change |
YTD Change |
Target Price* |
Dividend Yield |
Upside/ Downside** |
P/TBv Multiple |
Recommendation |
|
Sanlam |
7.0 |
6.9 |
(1.4%) |
14.7% |
10.3 |
0.0% |
49.6% |
1.9x |
Buy |
|
Co-op Bank*** |
15.0 |
14.2 |
(5.0%) |
25.1% |
19.3 |
10.6% |
46.5% |
0.7x |
Buy |
|
Diamond Trust Bank*** |
53.8 |
50.3 |
(6.5%) |
12.3% |
67.8 |
10.0% |
44.9% |
0.2x |
Buy |
|
Equity Group*** |
47.9 |
46.5 |
(2.9%) |
35.8% |
61.6 |
8.6% |
41.2% |
1.0x |
Buy |
|
ABSA Bank*** |
14.0 |
13.6 |
(3.2%) |
17.3% |
17.3 |
11.4% |
39.1% |
1.1x |
Buy |
|
Jubilee Holdings |
196.0 |
198.8 |
1.4% |
7.4% |
260.7 |
6.0% |
37.2% |
0.3x |
Buy |
|
Stanbic Holdings |
126.3 |
117.8 |
(6.7%) |
11.1% |
145.3 |
13.0% |
36.4% |
0.8x |
Buy |
|
NCBA*** |
45.2 |
44.5 |
(1.5%) |
14.5% |
55.2 |
10.7% |
34.7% |
0.9x |
Buy |
|
Standard Chartered*** |
201.3 |
199.3 |
(1.0%) |
24.3% |
232.1 |
14.6% |
31.0% |
1.3x |
Buy |
|
I&M Group*** |
21.9 |
21.7 |
(0.9%) |
24.4% |
25.6 |
11.8% |
29.7% |
0.5x |
Buy |
|
Kenya Reinsurance |
2.1 |
2.1 |
(1.4%) |
14.1% |
2.5 |
9.5% |
28.4% |
0.2x |
Buy |
|
KCB Group*** |
30.1 |
30.1 |
(0.2%) |
36.9% |
37.2 |
0.0% |
23.8% |
0.5x |
Buy |
|
Liberty Holdings |
5.1 |
5.1 |
0.0% |
32.6% |
6.1 |
0.0% |
19.1% |
0.4x |
Accumulate |
|
CIC Group |
2.4 |
2.3 |
(3.3%) |
0.9% |
2.5 |
5.6% |
13.9% |
0.7x |
Accumulate |
|
Britam |
5.1 |
5.8 |
12.9% |
12.1% |
6.5 |
0.0% |
12.8% |
0.8x |
Accumulate |
|
HF Group |
3.9 |
3.8 |
(2.3%) |
11.3% |
4.2 |
0.0% |
9.4% |
0.2x |
Hold |
We are “Neutral” on the Equities markets in the short term due to the current tough operating environment and huge foreign investor outflows, and, “Bullish” in the long term due to current cheap valuations and expected global and local economic recovery. With the market currently being undervalued for its future growth (PEG Ratio at 0.7x), we believe that investors should reposition towards value stocks with strong earnings growth and that are trading at discounts to their intrinsic value. We expect the current high foreign investors’ sell-offs to continue weighing down the equities outlook in the short term.
- Real Estate Investments Trusts (REITs)
On the Unquoted Securities Platform, as per the last trading data recorded on 22nd March 2024, Acorn D-REIT and I-REIT traded at Kshs 24.4 and Kshs 21.7 per unit, respectively. The performance represented a 22.0% and 8.3% gain for the D-REIT and I-REIT, respectively, from the Kshs 20.0 inception price. The volumes traded for the D-REIT and I-REIT came in at 12.3 mn and 30.7 mn shares, respectively, with a turnover of Kshs 257.5 mn and Kshs 633.8 mn, respectively, since inception in February 2021.
REITs offer various advantages such as tax exemptions, diversified portfolios, and consistent long-term returns. However, the ongoing decline in the performance of Kenyan REITs and the restructuring of their business portfolios are hindering significant investments previously made. Additional challenges include; i) insufficient understanding of the investment instrument among investors, ii) extended approval processes for establishing REITs, iii) high minimum capital requirements of Kshs 100.0 mn for trustees, and iv) minimum investment thresholds set at Kshs 5.0 mn, which continue to constrain the performance of the Kenyan REITs market.
We anticipate the Real Estate sector in Kenya to continue being supported by: i) favorable demographics, marked by population growth and urbanization leading to heightened demand for housing and Real Estate assets ii) increased activities in the residential sector by government in projects such as the affordable housing project and, iii) ongoing infrastructure enhancements are creating new investment prospects in emerging areas. However, challenges such as escalating construction costs, limited investor familiarity with Real Estate Investment Trusts (REITs), and existing oversupply in certain market segments may persist. These hurdles have the potential to impede sectoral performance by restricting development and investment opportunities.
The Kenya Mortgage Refinance Company (KMRC) is a non-deposit taking, public-private partnership (PPP) firm formed by the Government of Kenya and regulated by the Central Bank of Kenya (CBK). The primary mandate of KMRC is to ensure sustainable home financing in the country, by providing long-term funds to primary mortgage lenders (PMLs) such as; banks, microfinance institutions, and SACCOs at low and fixed interest rates. KMRC was incorporated in April 2018 under the Companies Act 2015, and authorized by the CBK to begin lending operations in September 2020. In 2023, KMRC had managed to disburse Kshs 8.4 bn
As a wholesale financial institution, KMRC does not take deposits nor lend directly to individuals. This strategic approach allows KMRC to concentrate on enhancing liquidity for primary mortgage lenders (PMLs) and fostering standardized lending practices in collaboration with governmental bodies and other stakeholders. The primary aim is to empower mortgage lending institutions to sustain their lending activities to homebuyers without concern over potential shortages in long-term funding. This is achieved by ensuring they have the capacity to manage any unforeseen short-term deposit fluctuations. Beyond providing extended funding, KMRC also plays a pivotal role in advancing Kenya's economic growth by expanding the capital markets through the issuance of corporate bonds tailored for long-term financing purposes. Below are some of the KMRC write ups we have released over the years:
- Update on Kenya Mortgage Refinance Company (KMRC) in February 2023 where we discussed key developments, challenges, and milestones the company had achieved towards the goal of sustainable home financing in the country,
- Kenya Mortgage Refinance Company (KMRC) Progress, in May 2022 where we analyzed the performance of KMRC since the company commenced its lending operations,
- Kenya Mortgage Refinance Company Update in August 2021, where we benchmarked with the Jordan Mortgage Refinance Company,
- Kenya Mortgage Refinance Company Recap in November 2020, where we drew lessons from Saudi Real Estate Refinance Company,
- Kenya Mortgage Refinance Company Update in April 2019, where we reintroduced what mortgage refinance companies are, why they are needed, how they operate, what benefits they give, and,
- Kenya Mortgage Refinance Company in April 2018, where we introduced KMRC as a mortgage liquidity facility and demystified the conditions necessary for the KMRC to thrive.
This week, we shall discuss the progress made by KMRC in the housing sector by noting the key developments, and the challenges faced. We shall offer suggestions to enhance mortgage funding by drawing insights from similar entities in different countries. In this article we shall write on:
- Overview of the Housing Sector in Kenya,
- Home Financing in Kenya,
- Kenya Mortgage Refinance Company (KMRC) Review,
- Case Studies and Lessons Learnt, and,
- Conclusion.
Disclaimer: The views expressed in this publication are those of the writers where particulars are not warranted. This publication, which is in compliance with Section 2 of the Capital Markets Authority Act Cap 485A, is meant for general information only and is not a warranty, representation, advice or solicitation of any nature. Readers are advised in all circumstances to seek the advice of a registered investment advisor


