Kenya Retirement Benefit Schemes FY'2023 Review & Cytonn Weekly #10/2024
By Cytonn Research, Mar 10, 2024
Executive Summary
Fixed Income
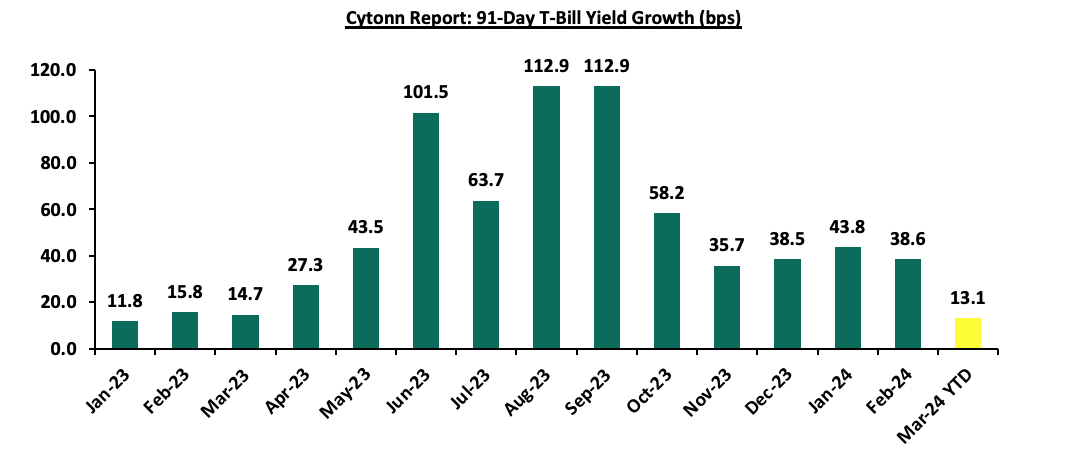
During the week, T-bills were oversubscribed, with the overall oversubscription rate coming in at 174.2%, a reversal from the undersubscription rate of 99.5% recorded the previous week. Investors’ preference for the shorter 91-day paper persisted, with the paper receiving bids worth Kshs 20.6 bn against the offered Kshs 4.0 bn, translating to an oversubscription rate of 515.5%, higher than the oversubscription rate of 306.5% recorded the previous week. The subscription rates for the 182-day paper and 364-day paper increased significantly to 100.6% and 111.3% respectively, from 20.4% and 95.8% respectively, recorded the previous week. The government accepted a total of Kshs 40.3 bn worth of bids out of Kshs 41.8 bn of bids received, translating to an acceptance rate of 96.3%. The yields on the government papers continued to rise, with the yields on the 364-day, 182-day, and 91-day papers increasing by 1.2 bps, 6.3 bps, and 3.8 bps to 17.0%, 16.8%, and 16.7%, respectively;
During the week, the Central Bank of Kenya released the auction results for the re-opened bond FXD1/2024/03 with a tenor to maturity of 2.9 years and a fixed coupon rate of 18.4%. The bond was oversubscribed with the overall subscription rate coming in at 107.7%, receiving bids worth Kshs 43.1 bn against the offered Kshs 40.0 bn. The government accepted bids worth Kshs 34.3 bn, translating to an acceptance rate of 79.6%. The weighted average yield of accepted bids came in at 18.42%, only 3.7 bps above the prior accepted average rate of 18.39%, which was in line with our expectation of the government rejecting expensive bids to remain within the initial issue rate. With the Inflation rate at 6.3% as of February 2024, the real return of the bond is 12.1%;
During the week, Stanbic Bank released its monthly Purchasing Manager's Index (PMI)-Kenya highlighting that the index for the month of February 2024 improved, coming in at 51.3, up from 49.8 in January 2024. The index was also at its highest level in over a year, with positive directional influences seen in all five of its sub-components. Notably, private sector conditions improved into the expansionary zone for the first time in six months. The upturn of the general business environment is mainly attributable to eased inflationary pressures, appreciating Shilling, and reduced fuel prices;
Equities
During the week, the equities market was on an upward trajectory, with NASI gaining the most by 1.8%, while NSE 10, NSE 25, and NSE 20 gained by 1.4%, 1.3%, and 1.1% respectively, taking the YTD performance to gains of 3.2%, 3.1%, 5.8%, and 6.0% for NASI, NSE 20, NSE 25, and NSE 10 respectively. The equities market performance was driven by gains recorded by large-cap stocks such as EABL, Bamburi, and Stanbic of 8.7%, 4.6%, and 4.1% respectively. The gains were, however, weighed down by losses recorded by large-cap stocks such as Coop, KCB, and DTB-K of 2.7%, 2.4%, and 2.2% respectively;
During the week, Stanbic Holdings released their FY’2023 financial results, highlighting that core earnings per share (EPS) grew by 34.2% to Kshs 30.8, from Kshs 22.9 in FY’2022, driven by the 28.8% growth in total operating income to Kshs 41.3 bn, from Kshs 32.1 bn in FY’2022;
Additionally, during the week, Bamburi Cement Plc announced the successful completion of the sale of 1.3 mn ordinary shares in Hima Cement Limited, representing 70.0% of the total shares owned by Bamburi Cement Plc through its parent company Himcem Holdings Limited, to Sarrai Group Limited and Rwimi Holdings Limited. This milestone, following the approval by Bamburi's shareholders in a virtual general meeting held on December 14, 2023, is a bid to divest from fragmented markets and concentrate in countries where it is among the biggest players;
Real Estate
During the week, President William Ruto witnessed the signing of a Memorandum of Understanding (MoU) between Kenya and the United Arab Emirates to develop a 1-Gigawatt (GW) data centre that is powered by geothermal energy. Additionally, the President also witnessed the signing of another MoU between Kenya’s BioVax Institute and Hayat Biotech, an international vaccine institute based in the United Arab Emirates (UAE) to set up its African regional institute in Kenya;
In the Unquoted Securities Platform, Acorn D-REIT and I-REIT traded at Kshs 24.4 and Kshs 21.7 per unit, respectively, as of 8th March 2024. The performance represented a 22.0% and 8.3% gain for the D-REIT and I-REIT, respectively, from the Kshs 20.0 inception price
Focus of the Week
According to the ACTSERV 2023 Retirement Benefits Schemes Investments Performance Survey, segregated retirement benefits schemes recorded a 3.1% return in Q4’2023, up from the 2.3% recorded in Q4’2022. The increase was largely supported by the performance of offshore investments made by the schemes which recorded a significant 10.6% points gain to 18.0%, up from the 7.4% gain recorded in 2022, on the back of positive investor sentiment from higher valuations, and the shilling depreciation which made for better earnings prospects from foreign currencies. Additionally, in H1’2023, the retirement benefits schemes’ Assets under Management increased by 12.4% to Kshs 1.7 tn, from Kshs 1.5 tn in H1’2022 and 8.1% from the Kshs 1.6 tn recorded in December 2022. The growth of the assets can be attributed to the enhanced contributions to the mandatory scheme, NSSF, which began in earnest in February 2023 following the court of appeal ruling and the improved performance of the offshore assets arising from the exchange rate fluctuations. Despite the continued growth, Kenya is characterized by a low saving culture with research by the Federal Reserve Bank showing that only 14.2% of the adult population in the labor force save, including for their retirement in Retirement Benefits Schemes (RBSs). According to the World Bank, our Gross savings to GDP stands at just 16%, indicating that more still needs to be done to boost the numbers. This week, we shall focus on understanding Retirement Benefits Schemes and look into the historical and current state of retirement benefits schemes in Kenya with a key focus on 2023 and what can be done going forward;
Company Updates
Investment Updates:
- Weekly Rates:
- Cytonn Money Market Fund closed the week at a yield of 16.94% p.a. To invest, dial *809# or download the Cytonn App from Google Play store here or from the Appstore here;
- Cytonn High Yield Fund closed the week at a yield of 19.30% p.a. To invest, email us at sales@cytonn.com and to withdraw the interest, dial *809# or download the Cytonn App from Google Play store here or from the Appstore here;
- We continue to offer Wealth Management Training every Monday, from 10:00 am to 12:00 pm. The training aims to grow financial literacy among the general public. To register for any of our Wealth Management Trainings, click here;
- If interested in our Private Wealth Management Training for your employees or investment group, please get in touch with us through wmt@cytonn.com;
- Cytonn Insurance Agency acts as an intermediary for those looking to secure their assets and loved ones’ future through insurance namely; Motor, Medical, Life, Property, WIBA, Credit and Fire and
Burglary insurance covers. For assistance, get in touch with us through insuranceagency@cytonn.com;
- Cytonn Asset Managers Limited (CAML) continues to offer pension products to meet the needs of both individual clients who want to save for their retirement during their working years and Institutional clients that want to contribute on behalf of their employees to help them build their retirement pot. To more about our pension schemes, kindly get in touch with us through pensions@cytonn.com;
Real Estate Updates:
- For more information on Cytonn’s real estate developments, email us at sales@cytonn.com;
- Phase 3 of The Alma is now ready for occupation and the show house is open daily. To join the waiting list to rent, please email properties@cytonn.com;
- For Third Party Real Estate Consultancy Services, email us at rdo@cytonn.com;
- For recent news about the group, see our news section here;
Hospitality Updates:
We currently have promotions for Staycations. Visit cysuites.com/offers for details or email us at sales@cysuites.com;
Money Markets, T-Bills Primary Auction:
During the week, T-bills were oversubscribed, with the overall oversubscription rate coming in at 174.2%, a reversal from the undersubscription rate of 99.5% recorded the previous week. Investors’ preference for the shorter 91-day paper persisted, with the paper receiving bids worth Kshs 20.6 bn against the offered Kshs 4.0 bn, translating to an oversubscription rate of 515.5%, higher than the oversubscription rate of 306.5% recorded the previous week. The subscription rates for the 182-day paper and 364-day paper increased significantly to 100.6% and 111.3% respectively, from 20.4% and 95.8% respectively, recorded the previous week. The government accepted a total of Kshs 40.3 bn worth of bids out of Kshs 41.8 bn of bids received, translating to an acceptance rate of 96.3%. The yields on the government papers continued to rise, with the yields on the 364-day, 182-day, and 91-day papers increasing by 1.2 bps, 6.3 bps, and 3.8 bps to 17.0%, 16.8%, and 16.7%, respectively. The chart below shows the yield growth rate for the 91-day paper over the period:
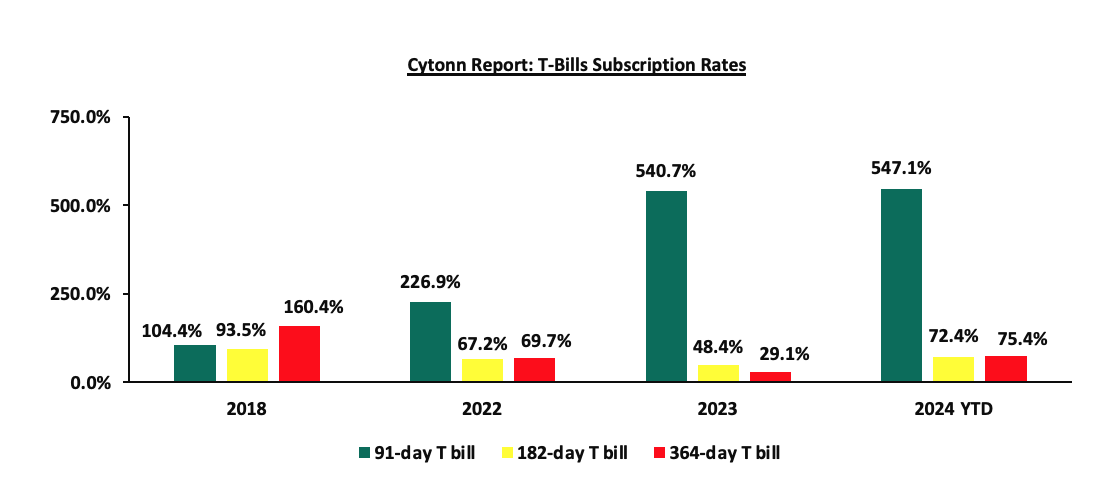
The chart below compares the overall average T-bill subscription rates obtained in 2018, 2022, 2023, and 2024 Year-to-date (YTD):
In the primary bond market, the Central Bank of Kenya released the auction results for the re-opened bond FXD1/2024/03 with a tenor to maturity of 2.9 years and a fixed coupon rate of 18.4%. The bond was oversubscribed with the overall subscription rate coming in at 107.7%, receiving bids worth Kshs 43.1 bn against the offered Kshs 40.0 bn. The government accepted bids worth Kshs 34.3 bn, translating to an acceptance rate of 79.6%. The weighted average yield of accepted bids came in at 18.42%, only 3.7 bps above the prior accepted average rate of 18.39%, which was in line with our expectation of the government rejecting expensive bids to remain within the initial issue rate. With the Inflation rate at 6.3% as of February 2024, the real return of the bond is 12.1%.
Money Market Performance:
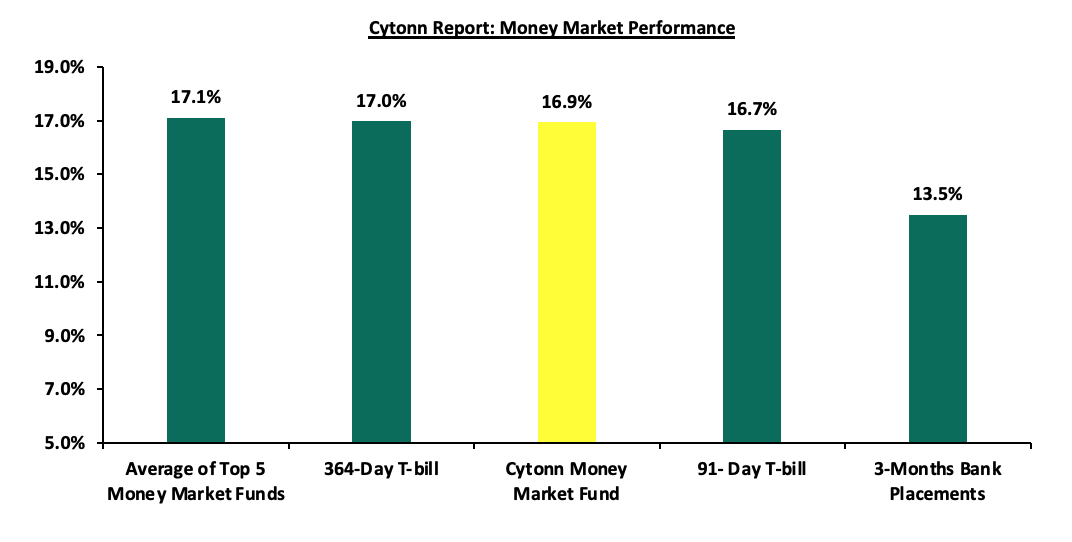
In the money markets, 3-month bank placements ended the week at 13.5% (based on what we have been offered by various banks), and the yields on the 364-day and 91-day papers increased by 1.2 bps and 3.8 bps to 17.0% and 16.7%, respectively. The yields of the Cytonn Money Market Fund increased marginally by 1.0 bps to remain relatively unchanged at 16.9% recorded the previous week, while the average yields on the Top 5 Money Market Funds increased by 29.4 bps to 17.1% from the 16.8% recorded the previous week.
The table below shows the Money Market Fund Yields for Kenyan Fund Managers as published on 8th March 2024:
|
Cytonn Report: Money Market Fund Yield for Fund Managers as published on 8th March 2024 |
||
|
Rank |
Fund Manager |
Effective Annual Rate |
|
1 |
Etica Money Market Fund |
17.7% |
|
2 |
Lofty-Corban Money Market Fund |
17.5% |
|
3 |
Cytonn Money Market Fund (Dial *809# or download the Cytonn App) |
16.9% |
|
4 |
GenAfrica Money Market Fund |
16.7% |
|
5 |
Nabo Africa Money Market Fund |
16.7% |
|
6 |
Apollo Money Market Fund |
15.9% |
|
7 |
Enwealth Money Market Fund |
15.9% |
|
8 |
Kuza Money Market fund |
15.7% |
|
9 |
Mali Money Market Fund |
15.1% |
|
10 |
Jubilee Money Market Fund |
15.0% |
|
11 |
Absa Shilling Money Market Fund |
14.8% |
|
12 |
Co-op Money Market Fund |
14.7% |
|
13 |
AA Kenya Shillings Fund |
14.6% |
|
14 |
Madison Money Market Fund |
14.5% |
|
15 |
Sanlam Money Market Fund |
14.4% |
|
16 |
KCB Money Market Fund |
14.4% |
|
17 |
GenCap Hela Imara Money Market Fund |
14.4% |
|
18 |
Mayfair Money Market Fund |
14.3% |
|
19 |
Equity Money Market Fund |
13.9% |
|
20 |
Dry Associates Money Market Fund |
13.5% |
|
21 |
Old Mutual Money Market Fund |
13.3% |
|
22 |
Orient Kasha Money Market Fund |
12.8% |
|
23 |
CIC Money Market Fund |
12.5% |
|
24 |
ICEA Lion Money Market Fund |
12.3% |
|
25 |
British-American Money Market Fund |
10.0% |
Source: Business Daily
Liquidity:
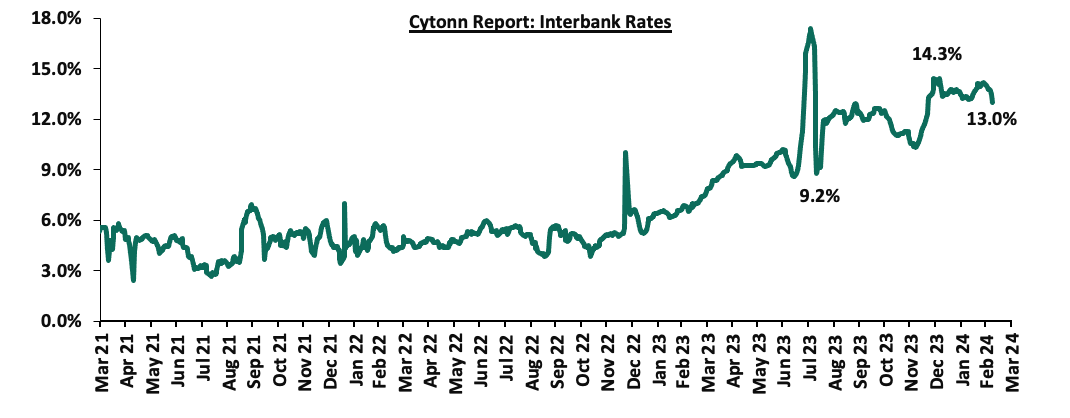
During the week, liquidity in the money markets eased, with the average interbank rate decreasing by 54.5 bps to 13.6% from 14.1% recorded the previous week, partly attributable to government payments that offset tax remittances. The average interbank volumes traded increased significantly by 31.2% to Kshs 20.5 bn from Kshs 15.7 bn recorded the previous week. The chart below shows the interbank rates in the market over the years:
Kenya Eurobonds:
During the week, the yields on Eurobonds were on a downward trajectory, with the yields on the 7-year Eurobond issued in 2019 decreasing the most by 0.6% to 8.9% from 9.6% recorded the previous week, indicating improved investor perception of the country. The table below shows the summary of the performance of the Kenyan Eurobonds as of 8th March 2024;
|
Cytonn Report: Kenya Eurobonds Performance |
||||||
|
|
2018 |
2019 |
2021 |
2024 |
||
|
Tenor |
10-year issue |
30-year issue |
7-year issue |
12-year issue |
12-year issue |
6-year issue |
|
Amount Issued (USD) |
1.0 bn |
1.0 bn |
0.9 bn |
1.2 bn |
1.0 bn |
1.5 bn |
|
Years to Maturity |
4.0 |
24.0 |
3.2 |
8.2 |
10.3 |
6.0 |
|
Yields at Issue |
7.3% |
8.3% |
7.0% |
7.9% |
6.2% |
10.4% |
|
1-Jan-24 |
9.8% |
10.2% |
10.1% |
9.9% |
9.5% |
|
|
29-Feb-24 |
9.6% |
10.4% |
9.6% |
10.0% |
9.8% |
9.8% |
|
1-Mar-24 |
9.5% |
10.3% |
9.2% |
9.9% |
9.8% |
9.8% |
|
4-Mar-24 |
9.4% |
10.3% |
9.1% |
9.8% |
9.7% |
9.6% |
|
5-Mar-24 |
9.4% |
10.3% |
9.0% |
9.8% |
9.7% |
9.7% |
|
6-Mar-24 |
9.3% |
10.2% |
9.1% |
9.7% |
9.7% |
9.7% |
|
7-Mar-24 |
9.2% |
10.2% |
8.9% |
9.7% |
9.6% |
9.5% |
|
Weekly Change |
(0.3%) |
(0.2%) |
(0.6%) |
(0.3%) |
(0.2%) |
(0.3%) |
|
MTD Change |
(0.2%) |
(0.2%) |
(0.3%) |
(0.2%) |
(0.2%) |
(0.3%) |
|
YTD Change |
(0.6%) |
(0.0%) |
(1.2%) |
(0.2%) |
0.1% |
9.5% |
Source: Central Bank of Kenya (CBK) and National Treasury
Kenya Shilling:
During the week, the Kenya Shilling gained against the US Dollar by 0.5%, to close at Kshs 142.8, from Kshs 143.5 recorded the previous week. On a year-to-date basis, the shilling has appreciated by 9.0% against the dollar, a contrast to the 26.8% depreciation recorded in 2023.
We expect the shilling to be supported by:
- Diaspora remittances standing at a cumulative USD 4,253.0 mn in the 12 months to January 2024, 5.3% higher than the USD 4,039.0 mn recorded over the same period in 2023, which has continued to cushion the shilling against further depreciation. In the January 2024 diaspora remittances figures, North America remained the largest source of remittances to Kenya accounting for 55.2% in the period, and,
- The tourism inflow receipts which came in at USD 333.9 mn in 2023, a 24.6% increase from USD 268.1 mn inflow receipts recorded in 2022, and owing to tourist arrivals that improved by 30.7% to 192,000 in the 12 months to December 2023, from 161,000 recorded during a similar period in 2022.
The shilling is however expected to remain under pressure in 2024 as a result of:
- An ever-present current account deficit which came at 3.5% of GDP in Q3’2023 from 6.4% recorded in a similar period in 2022,
- The need for government debt servicing, continues to put pressure on forex reserves given that 67.5% of Kenya’s external debt was US Dollar denominated as of September 2023, and,
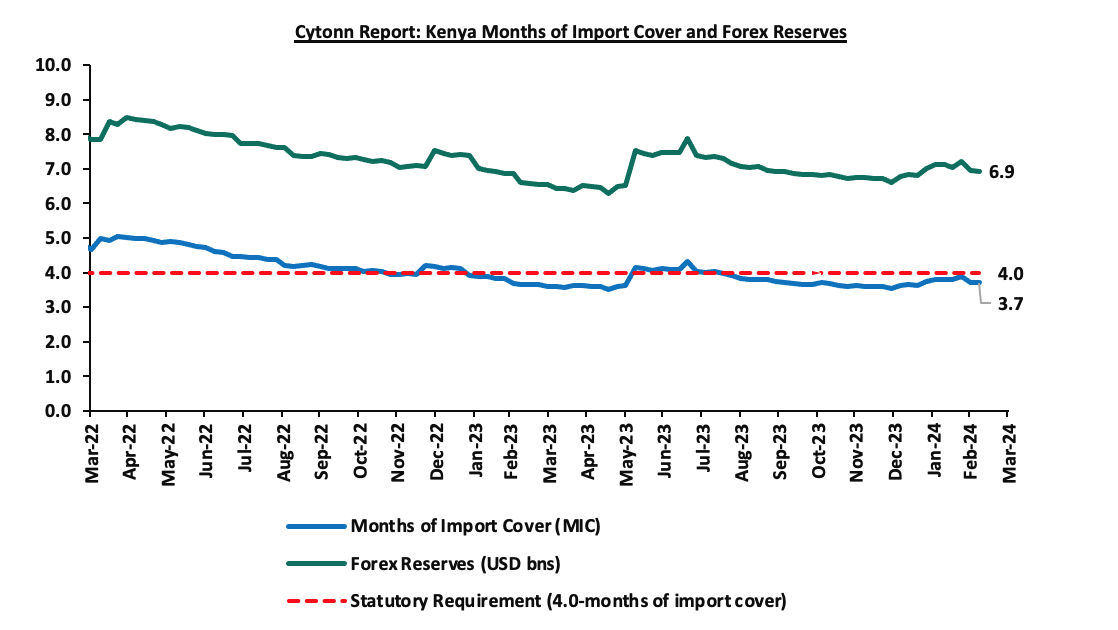
- Dwindling forex reserves, currently at USD 6.9 bn (equivalent to 3.7 months of import cover), which is below the statutory requirement of maintaining at least 4.0 months of import cover.
Key to note, Kenya’s forex reserves decreased by 0.6% during the week to USD 6.9 bn from the USD 7.0 bn recorded the previous week, equivalent to 3.7 months of import cover, to remain relatively unchanged from the previous week, and remained below the statutory requirement of maintaining at least 4.0 months of import cover. The chart below summarizes the evolution of Kenya's months of import cover over the years:
Weekly Highlights
- Stanbic Bank’s February 2024 Purchasing Manager’s Index (PMI)
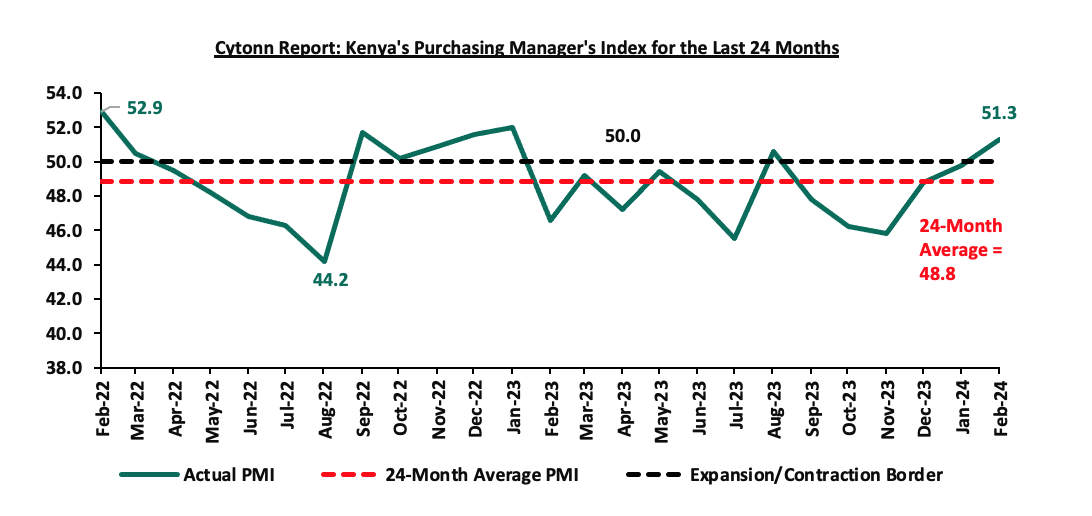
During the week, Stanbic Bank released its monthly Purchasing Manager's Index (PMI)-Kenya highlighting that the index for the month of February 2024 improved, coming in at 51.3, up from 49.8 in January 2024. The index was also at its highest level in over a year, with positive directional influences seen in all five of its sub-components. Notably, private sector conditions improved into the expansionary zone for the first time in six months. The upturn of the general business environment is mainly attributable to eased inflationary pressures, appreciating Shilling, and reduced fuel prices.
Input costs rose at the weakest pace in over two years in February, as inflation continued to ease, with the y/y inflation in February 2024 easing by 0.6% points to 6.3%, from the 6.9% recorded in January 2024, mainly on the back of appreciating Shilling and reduced fuel prices, with fuel prices decreasing by Kshs 1.0 per litre, to retail at Kshs 206.4, Kshs 195.5 and Kshs 193.2 per litre for Super Petrol, Diesel, and Kerosene, respectively. The fuel prices however still remain high relative, to global fuel prices, despite the recent appreciation of the Kenyan shilling, having gained by 10.7% against the US Dollar, to close the month at Kshs 143.6, from Kshs 160.8 recorded at the end of January 2024.
The greatest movement was found in the Output sub-index in February, which rose to its highest for 13 months, with output increasing in the Agriculture, Manufacturing, and Service sectors. Similarly, companies reported improving client demand resulting from easing inflation, new product releases, and improved stock levels, which drove the fastest upturn in sales since January 2023. However, sector data signaled that construction and wholesale & retail were still greatly impacted, with sales declining sharply in these segments. Additionally, employment levels rose in February on the back of higher new order intakes, with firms citing the hiring of casual workers to meet workloads. Staff increases were modest, but the fastest since last August.
Overall business confidence regarding future activity fell to a survey low, suggesting a broad degree of uncertainty that activity growth will be sustained. Key to note, a PMI reading of above 50.0 indicates an improvement in the business conditions, while readings below 50.0 indicate a deterioration. The chart below summarizes the evolution of PMI over the last 24 months:
Going forward, we anticipate that the business environment will be constrained in the short to medium term as a result of the tough economic environment driven by high interest rates from the tightened monetary policy, increased taxes, and overall rise in the cost of living. However, we expect businesses to be supported by the easing of inflationary pressures coupled with the appreciating Shilling, which are set to reduce input costs.
Rates in the Fixed Income market have been on an upward trend given the continued high demand for cash by the government and the occasional liquidity tightness in the money market. The government is 9.2% ahead of its prorated net domestic borrowing target of Kshs 328.9 bn, having a net borrowing position of Kshs 359.0 bn out of the domestic net borrowing target of Kshs 471.4 bn for the FY’2023/2024. Therefore, we expect a continued upward readjustment of the yield curve in the short and medium term, with the government looking to maintain the fiscal surplus through the domestic market. Owing to this, our view is that investors should be biased towards short-term fixed-income securities to reduce duration risk.
Market Performance:
During the week, the equities market was on an upward trajectory, with NASI gaining the most by 1.8%, while NSE 10, NSE 25, and NSE 20 gained by 1.4%, 1.3%, and 1.1% respectively, taking the YTD performance to gains of 3.2%, 3.1%, 5.8%, and 6.0% for NASI, NSE 20, NSE 25, and NSE 10 respectively. The equities market performance was driven by gains recorded by large-cap stocks such as EABL, Bamburi, and Stanbic of 8.7%, 4.6%, and 4.1% respectively. The gains were, however, weighed down by losses recorded by large-cap stocks such as Coop, KCB, and DTB-K of 2.7%, 2.4%, and 2.2% respectively.
During the week, equities turnover decreased by 49.3% to USD 5.4 mn from USD 10.6 mn recorded the previous week, taking the YTD total turnover to USD 55.8 mn. Foreign investors remained net sellers for the ninth consecutive week with a net selling position of USD 0.5 mn, from a net selling position of USD 3.4 mn recorded the previous week, taking the YTD foreign net selling position to USD 8.5 mn.
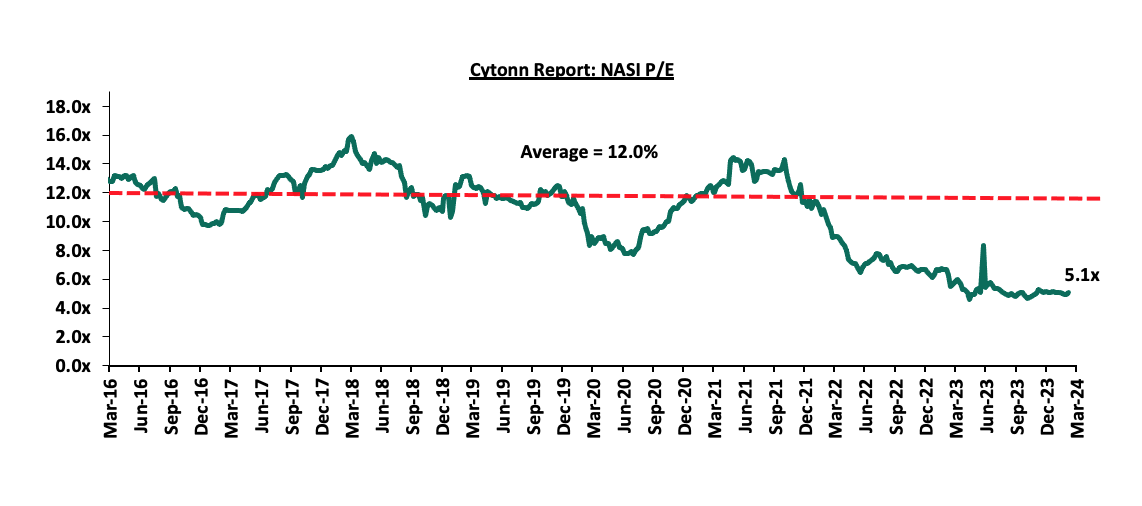
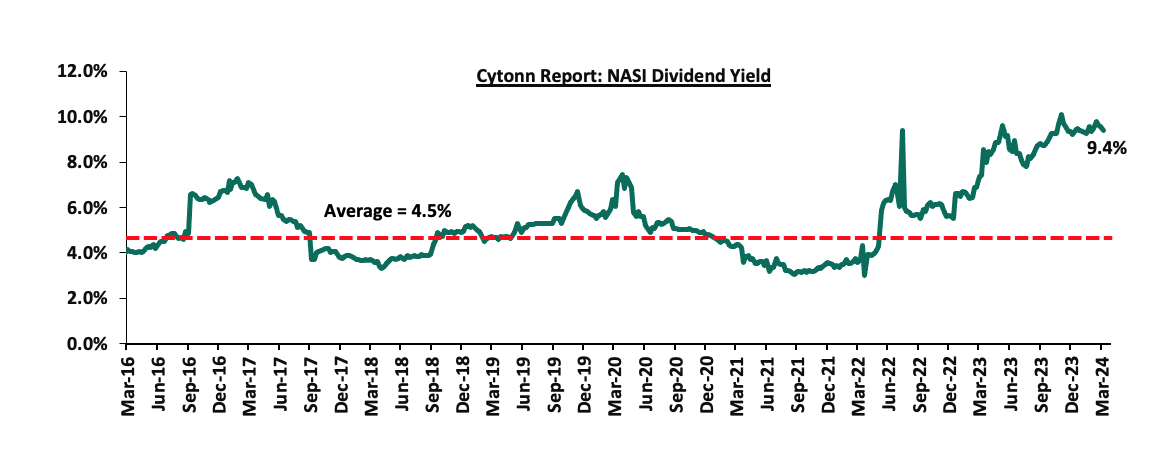
The market is currently trading at a price-to-earnings ratio (P/E) of 5.1x, 57.9% below the historical average of 12.0x. The dividend yield stands at 9.4%, 4.9% points above the historical average of 4.5%. Key to note, NASI’s PEG ratio currently stands at 0.6x, an indication that the market is undervalued relative to its future growth. A PEG ratio greater than 1.0x indicates the market is overvalued while a PEG ratio less than 1.0x indicates that the market is undervalued. The charts below indicate the historical P/E and dividend yields of the market;
Universe of Coverage:
|
Cytonn Report: Equities Universe of Coverage |
|||||||||||
|
Company |
Price as at 01/03/2024 |
Price as at 08/03/2024 |
w/w change |
m/m change |
YTD Change |
Year Open 2024 |
Target Price* |
Dividend Yield |
Upside/ Downside** |
P/TBv Multiple |
Recommendation |
|
KCB Group*** |
21.2 |
20.7 |
(2.4%) |
3.0% |
(5.7%) |
22.0 |
31.2 |
9.7% |
60.4% |
0.4x |
Buy |
|
Sanlam |
6.1 |
7.0 |
14.7% |
(3.1%) |
17.0% |
6.0 |
10.3 |
0.0% |
46.6% |
2.0x |
Buy |
|
Jubilee Holdings |
185.0 |
189.8 |
2.6% |
2.2% |
2.6% |
185.0 |
260.7 |
6.3% |
43.7% |
0.3x |
Buy |
|
Kenya Reinsurance |
2.0 |
2.0 |
0.5% |
8.2% |
7.0% |
1.9 |
2.5 |
10.1% |
36.9% |
0.2x |
Buy |
|
I&M Group*** |
18.9 |
18.1 |
(4.2%) |
6.0% |
3.7% |
17.5 |
22.1 |
12.4% |
34.5% |
0.4x |
Buy |
|
Diamond Trust Bank*** |
49.0 |
47.9 |
(2.2%) |
(1.5%) |
6.9% |
44.8 |
58.5 |
10.4% |
32.7% |
0.2x |
Buy |
|
NCBA*** |
39.1 |
39.7 |
1.5% |
4.1% |
2.2% |
38.9 |
48.3 |
10.7% |
32.4% |
0.8x |
Buy |
|
Standard Chartered*** |
162.3 |
162.5 |
0.2% |
0.3% |
1.4% |
160.3 |
185.5 |
13.5% |
27.7% |
1.1x |
Buy |
|
CIC Group |
2.0 |
2.1 |
2.5% |
1.0% |
(10.0%) |
2.3 |
2.5 |
6.3% |
27.7% |
0.7x |
Buy |
|
Britam |
4.5 |
4.7 |
3.5% |
(12.3%) |
(8.6%) |
5.1 |
6.0 |
0.0% |
27.0% |
0.6x |
Buy |
|
Stanbic Holdings |
115.0 |
119.8 |
4.1% |
(1.6%) |
13.0% |
106.0 |
132.8 |
12.8% |
23.7% |
0.9x |
Buy |
|
ABSA Bank*** |
13.0 |
13.0 |
0.0% |
9.8% |
12.1% |
11.6 |
14.6 |
10.4% |
23.2% |
1.0x |
Buy |
|
Co-op Bank*** |
13.1 |
12.7 |
(2.7%) |
7.4% |
11.9% |
11.4 |
13.8 |
11.8% |
20.5% |
0.6x |
Buy |
|
Equity Group*** |
40.0 |
40.0 |
0.0% |
6.4% |
17.0% |
34.2 |
42.8 |
10.0% |
17.0% |
0.9x |
Accumulate |
|
Liberty Holdings |
5.0 |
5.5 |
10.0% |
10.0% |
42.5% |
3.9 |
5.9 |
0.0% |
7.6% |
0.4x |
Hold |
|
HF Group |
4.0 |
4.1 |
2.3% |
6.7% |
18.6% |
3.5 |
3.9 |
0.0% |
(4.6%) |
0.2x |
Sell |
|
Target Price as per Cytonn Analyst estimates **Upside/ (Downside) is adjusted for Dividend Yield ***For Disclosure, these are stocks in which Cytonn and/or its affiliates are invested in |
|||||||||||
Weekly Highlights:
- Earnings Release
During the week, Stanbic Holdings released their FY’2023 financial results. Below is a summary of the performance;
|
Balance Sheet Items (Kshs bn) |
FY'2022 |
FY'2023 |
y/y change |
|
Net Loans and Advances |
236.0 |
260.5 |
10.4% |
|
Kenya Government Securities |
58.0 |
42.1 |
(27.4%) |
|
Total Assets |
399.8 |
459.3 |
14.9% |
|
Customer Deposits |
282.1 |
330.9 |
17.3% |
|
Deposits Per Branch |
10.1 |
10.0 |
(0.5%) |
|
Total Liabilities |
337.6 |
390.7 |
15.7% |
|
Shareholders' Funds |
62.2 |
68.6 |
10.2% |
|
Balance Sheet Ratios |
FY'2022 |
FY'2023 |
y/y change |
|
Loan to Deposit ratio |
83.7% |
78.7% |
(5.0%) |
|
Government Securities to Deposits ratio |
20.6% |
12.7% |
(7.9%) |
|
Return on Average Equity |
15.3% |
18.6% |
3.3% |
|
Return on Average Assets |
2.5% |
2.8% |
0.3% |
|
Income Statement (Kshs bn) |
FY'2022 |
FY'2023 |
y/y change |
|
Net interest Income |
18.9 |
25.6 |
35.4% |
|
Net non-interest income |
13.1 |
15.7 |
19.3% |
|
Total Operating income |
32.1 |
41.3 |
28.8% |
|
Loan loss provision |
(4.9) |
(6.2) |
26.1% |
|
Total Operating expenses |
(19.9) |
(24.2) |
21.7% |
|
Profit before tax |
12.2 |
17.1 |
40.4% |
|
Profit after tax |
9.1 |
12.2 |
34.2% |
|
Core EPS |
22.9 |
30.8 |
34.2% |
|
Income Statement Ratios |
FY'2022 |
FY'2023 |
% point change |
|
Yield from interest-earning assets |
8.2% |
11.7% |
3.5% |
|
Cost of funding |
2.6% |
3.9% |
1.3% |
|
Net Interest Margin |
6.0% |
7.9% |
1.9% |
|
Net Interest Income as % of operating income |
59.1% |
62.1% |
3.0% |
|
Non-Funded Income as a % of operating income |
40.9% |
37.9% |
(3.0%) |
|
Cost to Income Ratio |
62.1% |
58.6% |
(3.5%) |
|
Cost to Income without LLP |
46.7% |
43.5% |
(3.2%) |
|
Cost to Assets |
3.7% |
3.9% |
0.2% |
|
Capital Adequacy Ratios |
FY'2022 |
FY'2023 |
% points change |
|
Core Capital/Total Liabilities |
16.5% |
15.1% |
(1.4%) |
|
Minimum Statutory ratio |
8.0% |
8.0% |
|
|
Excess |
8.5% |
7.1% |
(1.4%) |
|
Core Capital/Total Risk Weighted Assets |
13.8% |
13.0% |
(0.8%) |
|
Minimum Statutory ratio |
10.5% |
10.5% |
|
|
Excess |
3.3% |
2.5% |
(0.8%) |
|
Total Capital/Total Risk Weighted Assets |
16.8% |
16.6% |
(0.2%) |
|
Minimum Statutory ratio |
14.5% |
14.5% |
|
|
Excess |
2.3% |
2.1% |
(0.2%) |
|
Liquidity Ratio |
45.2% |
40.3% |
(4.9%) |
|
Minimum Statutory ratio |
20.0% |
20.0% |
|
|
Excess |
25.2% |
20.3% |
(4.9%) |
Key Take-Outs:
- Strong earnings growth - Core earnings per share (EPS) grew by 34.2% to Kshs 30.8, from Kshs 22.9 in FY’2022, driven by the 28.8% growth in total operating income to Kshs 41.3 bn, from Kshs 32.1 bn in FY’2022, and,
- Improved asset quality – The bank’s gross NPL ratio decreased to 9.5% in FY’2023 from 11.2% in FY’2022, attributable to 7.0% decrease in Gross non-performing loans to Kshs 26.5 bn, from Kshs 28.4 bn in FY’2022, compared to the 9.9% increase in gross loans to Kshs 279.1 bn, from Kshs 254.0 bn recorded in FY’2022.
- Increased dividends – Dividends paid increased by 21.8% to Kshs 15.35 in FY’2023, from Kshs 12.60 in FY’2022
For a more detailed analysis, please see the Stanbic Holdings FY’2023 Earnings Note
Asset Quality:
The table below shows the asset quality of listed banks that have released their FY’2023 results using several metrics:
|
Cytonn Report: Listed Banks Asset Quality in FY’2023 |
||||||
|
|
FY'2023 NPL Ratio* |
FY'2022 NPL Ratio** |
% points change in NPL Ratio |
FY'2023 NPL Coverage* |
FY'2022 NPL Coverage** |
% point change in NPL Coverage |
|
Stanbic Bank |
9.5% |
11.2% |
(1.7%) |
70.4% |
63.1% |
7.4% |
|
Mkt Weighted Average* |
9.5% |
11.7% |
(2.2%) |
70.4% |
67.4% |
3.0% |
|
*Market cap weighted as at 08/03/2024 |
||||||
|
**Market cap weighted as at 20/04/2023 |
||||||
Key take-outs from the table include;
- Asset quality for the listed bank that has released improved during FY’2023, with market-weighted average NPL ratio declining by 2.2% points to 9.5% from 11.7% in FY’2022, and,
- Market-weighted average NPL Coverage for the listed bank increased by 3.0% points to 70.4% in FY’2023 from 67.4% recorded in FY’2022. The increase was attributable to Stanbic Holding’s NPL coverage ratio increasing by 7.4% points to 70.4% from 63.1% in FY’2022.
Summary Performance
The table below shows the performance of listed banks that have released their FY’2023 results using several metrics:
|
Cytonn Report: Listed Banks Performance in FY’2023 |
|||||||||||||
|
Bank |
Core EPS Growth |
Interest Income Growth |
Interest Expense Growth |
Net Interest Income Growth |
Net Interest Margin |
Non-Funded Income Growth |
NFI to Total Operating Income |
Growth in Total Fees & Commissions |
Deposit Growth |
Growth in Government Securities |
Loan to Deposit Ratio |
Loan Growth |
Return on Average Equity |
|
Stanbic Holdings |
34.2% |
48.0% |
71.7% |
35.4% |
7.9% |
19.3% |
37.9% |
31.9% |
17.3% |
(27.4%) |
78.7% |
10.4% |
18.6% |
|
FY'23 Mkt Weighted Average* |
34.2% |
48.0% |
71.7% |
35.4% |
7.9% |
19.3% |
37.9% |
31.9% |
17.3% |
(27.4%) |
78.7% |
10.4% |
18.6% |
|
FY'22 Mkt Weighted Average** |
26.6% |
19.7% |
20.1% |
19.2% |
7.2% |
31.6% |
37.7% |
13.8% |
13.7% |
3.1% |
71.8% |
18.1% |
21.8% |
|
*Market cap weighted as at 08/03/2024 |
|||||||||||||
|
**Market cap weighted as at 20/04/2023 |
|||||||||||||
Key take-outs from the table include:
- The listed bank recorded a 34.2% growth in core Earnings per Share (EPS) in FY’2023, compared to the weighted average growth of 26.6% in FY’2022, an indication of sustained performance despite the tough operating environment experienced during the year,
- Non-Funded Income grew by 19.3% compared to market-weighted average growth of 31.6% in FY’2022, despite the increased revenue diversification efforts by the bank, and,
- The Bank recorded a deposit growth of 17.3%, higher than the market-weighted average deposit growth of 13.7% in FY’2022.
- Bamburi Cement Plc Successfully Completes Sale of Shares in Hima Cement Limited
During the week, Bamburi Cement Plc announced the successful completion of the sale of 1.3 mn ordinary shares in Hima Cement Limited, representing 70.0% of the total shares owned by Bamburi Cement Plc through its parent company Himcem Holdings Limited, to Sarrai Group Limited and Rwimi Holdings Limited. This milestone, following the approval by Bamburi's shareholders in a virtual general meeting held on December 14, 2023, is a bid to divest from fragmented markets and concentrate in countries where it is among the biggest players.
The transaction, detailed in the cautionary announcement released by Bamburi on November 14, 2023, has now been finalized, with all conditions precedent satisfied, culminating in the completion of the sale on March 5, 2024. With this development, Bamburi Cement Plc has fully divested its proprietary interest in Hima Cement Limited, marking a significant shift in its corporate structure and operational focus.
Hima Cement Limited will no longer be reported as a subsidiary of Bamburi, underlining the material impact of this transaction on the company's financial reporting and organizational landscape. This change is pertinent for shareholders and investors of Bamburi Cement Plc, who are urged to exercise caution when trading in the company's shares, considering the substantial transformation in its corporate structure.
This strategic move aligns with Bamburi Cement Plc's strategy of “Accelerating Green Growth” and progressing further on its objectives, enabling the company to reallocate resources and focus on core operations. By divesting its interest in Hima Cement Limited, Bamburi Cement Plc aims to streamline its operations, enhance efficiency, and unlock new opportunities for growth and value creation in the Kenyan market.
The successful completion of the sale of shares in Hima Cement Limited marks a significant milestone for Bamburi Cement Plc, injecting an estimated Kshs 12.0 bn into their books, and allowing them to consider paying a special dividend. As the company continues its journey of transformation, shareholders and investors can expect Bamburi Cement Plc to capitalize on emerging opportunities and deliver sustainable value creation in the years ahead.
We are “Neutral” on the Equities markets in the short term due to the current tough operating environment and huge foreign investor outflows, and, “Bullish” in the long term due to current cheap valuations and expected global and local economic recovery. With the market currently being undervalued for its future growth (PEG Ratio at 0.6x), we believe that investors should reposition towards value stocks with strong earnings growth and that are trading at discounts to their intrinsic value. We expect the current high foreign investors’ sell-offs to continue weighing down the equities outlook in the short term.
- Industrial Sector
During the week, President William Ruto witnessed the signing of a Memorandum of Understanding (MoU) between Kenya and the United Arab Emirates to develop a 1-Gigawatt (GW) data centre that is powered by geothermal energy. In the partnership deal, Kenya's EcoCloud, a leading provider of data centre solutions and the first-ever green data centre in Africa powered entirely by geothermal energy, and UAE's G42 will develop a robust digital infrastructure and ecosystem. Notably, the agreement will extend beyond the development of infrastructure. This will include provision of other services such as cloud computing and Artificial Intelligence intended to cater to the vibrant and youthful population of Kenya. The partnership signifies a significant step towards positioning Kenya as a key player in the digital economy, fostering innovation, and driving economic growth in the region, making Kenya the center of technological innovation in Africa and a competitive player on the global stage.
Additionally, the President also witnessed the signing of another MoU between Kenya’s BioVax Institute and Hayat Biotech, an international vaccine institute based in the United Arab Emirates (UAE) to set up its Africa regional institute in Kenya. This strategic move underscores the government's commitment to enhancing vaccine research and manufacturing capabilities. The institute's presence in Kenya aligns perfectly with the nation's Bottom-Up Economic Transformation Agenda (BETA), particularly focusing on strengthening healthcare infrastructure under the Universal Health Coverage (UHC) initiative. By hosting the International Vaccine Institute's regional institute, Kenya is poised to become a hub for vaccine research and production, contributing to both regional health security and economic development.
These partnerships coincide with investors’ high appetite for investments in alternative burgeoning Real Estate asset classes in Kenya such as the health sector, data centres, cold storage systems, and purpose-built housing.
We expect the collaboration between BioVax Institute and Hayat Biotech will; i) bolster Kenya's vaccine research capacity and accelerate the nation's journey towards self-sufficiency in vaccine production, ii) facilitate knowledge transfer and skills development thus fostering innovation, and, iii) create employment opportunities in the healthcare sector. Furthermore, the partnership between EcoCloud and G42 will catalyze Kenya's digital transformation and establish the nation as a global digital hub. The construction of the data center powered by geothermal energy sets a precedent for environmentally conscious infrastructure development, showcasing Kenya's leadership in sustainable industrialization.
- Real Estate Investments Trusts (REITs)
In the Unquoted Securities Platform, Acorn D-REIT and I-REIT traded at Kshs 24.4 and Kshs 21.7 per unit, respectively, as of 8th March 2024. The performance represented a 22.0% and 8.3% gain for the D-REIT and I-REIT, respectively, from the Kshs 20.0 inception price. The volumes traded for the D-REIT and I-REIT came in at 12.3 mn and 30.7 mn shares, respectively, with a turnover of Kshs 257.5 mn and Kshs 633.8 mn, respectively, since inception in February 2021.
REITs provide various benefits like tax exemptions, diversified portfolios, and stable long-term profits. However, the continuous deterioration in the performance of Kenyan REITs and restructuring of their business portfolio is hampering major investments that had previously been made. The other general challenges include; i) inadequate comprehension of the investment instrument among investors, ii) prolonged approval processes for REITs creation, iii) high minimum capital requirements of Kshs 100.0 mn for trustees, and, iv) minimum investment amounts set at Kshs 5.0 mn, continue to limit the performance of the Kenyan REITs market.
Going forward, we anticipate continued growth in the Real Estate sector, supported by several factors: i) positive demographics, including high population and urbanization rate at 1.9% and 3.7% respectively driving demand for Real Estate upwards, ii)increased)activities by players in the industrial sector, and, iii) rising demand for data centres and cold rooms in the region. However, we expect the sector to be dampened by continued rise in the cost of construction materials, inadequate knowledge of REITs and the prevailing tough macro-economic environment.
According to the ACTSERV 2023 Retirement Benefits Schemes Investments Performance Survey, segregated retirement benefits schemes recorded a 3.1% return in 2023, up from the 2.3% recorded in 2022. The increase was largely supported by the performance of offshore investments made by the schemes which recorded a significant 10.6% gain to 18.0%, up from the 7.4% gain recorded in 2022, on the back of positive investor sentiment from higher valuations, and the shilling depreciation which made for better earnings prospects from foreign currencies. Additionally, in H1’2023, the retirement benefits schemes’ Assets under Management increased by 12.4% to Kshs 1.7 tn, from Kshs 1.5 tn in H1’2022 and 8.1% from the Kshs 1.6 tn recorded in December 2022. The growth of the assets can be attributed to the enhanced contributions to the mandatory scheme, NSSF, which began in earnest in February 2023 following the court of appeal ruling and the improved performance of the offshore assets arising from the exchange rate fluctuations. Despite the continued growth, Kenya is characterized by a low saving culture with research by the Federal Reserve Bank showing that only 14.2% of the adult population in the labor force save, including for their retirement in Retirement Benefits Schemes (RBSs). According to the World Bank, our Gross savings to GDP stands at just 16%, indicating that more still needs to be done to boost the savings numbers.
Notably, in February 2024, the Kenyan Supreme Court referred back to the court of appeal the case regarding the validity and constitutionality of the NSSF Act 2013. The Act, which increased the contribution rates from Kshs 400 to 12% of an employee’s monthly earnings, with a 6% deduction from the employee and an equivalent 6% deduction from the employer, was rendered unconstitutional, null, and void by the Employment and Labour Relations Court in September 2022. This decision was on the basis that, among others, the Act had the effect of making NSSF the sole provider of social and security Services. In February 2023, the Court of Appeal gave the nod on the implementation of the Act, saying that the Employment and Labour Relations Court had no jurisdiction to determine the petitions as filed. The new Act replaced the NSSF Act Cap 258 of 1965, which only covered workers in formal employment, with the new Act requiring employers to contribute 6.0% of employees’ gross earnings to NSSF while the employers match the contribution, with the maximum contribution capped at Kshs 2,160.0. This new regulation has played a role in the growth of the pension industry both in membership and AUM. Additionally, members will be able to access a bigger retirement package upon retirement through the Act.
We have been tracking the performance of Kenya’s Pension schemes with the most recent topicals being Progress of Kenya’s Pension Schemes-2022 done on August 2022 and Kenya Retirement Benefits Schemes FY’2021 Performance done on March 2022. This week, we shall focus on understanding Retirement Benefits Schemes and look into the historical and current state of retirement benefits schemes in Kenya with a key focus on 2023 and what can be done going forward. We shall also analyze other asset classes such as offshore investments that the schemes can tap into to achieve higher returns. Additionally, we shall look into factors and challenges influencing the growth of the RBSs in Kenya as well as the actionable steps that can be taken to improve the pension industry. We shall do this by looking into the following:
- Introduction to Retirement Benefits Schemes in Kenya,
- Historical and Current State of Retirement Benefits Schemes in Kenya,
- Factors Influencing the Growth of Retirement Benefits Scheme in Kenya
- Challenges that Have Hindered the Growth of Retirement Benefit Schemes, and,
- Recommendations on Enhancing the Performance of Retirement Benefit Schemes in Kenya;

Disclaimer: The views expressed in this publication are those of the writers where particulars are not warranted. This publication, which is in compliance with Section 2 of the Capital Markets Authority Act Cap 485A, is meant for general information only and is not a warranty, representation, advice or solicitation of any nature. Readers are advised in all circumstances to seek the advice of a registered investment advisor.

- Talk to us
- Kenya
- P.O Box 20695 - 00200, Nairobi, Kenya
- Cell +254709101200
- Tel +254709101200
- WhatsApp +254741676635
- United States
- +254709101200
- DOWNLOAD OUR APP
-


- Kenya
- 8th Floor, Pinetree Plaza, Kaburu Drive, Ngong Road, Nairobi, Kenya
- USA
- Suite 1150, 1775 Eye Street NW, USA, Washington DC 20006, USA
- Investments
- High Yield
- Private Equity
- Real Estate
- Real Estate
- RiverRun Estates
- Cytonn Towers
- The Ridge
- Taraji Heights
- The Alma