Kenya’s FY’2026/2027 Budget Review, & Cytonn Weekly #25/2026
By Cytonn Research, Jun 28, 2026
Executive Summary
Fixed Income
During the week, T-bills were oversubscribed for the fourth consecutive week, with the overall subscription rate coming in at 116.9%, lower than the subscription rate of 204.1%, recorded the previous week. Investors’ preference for the shorter 91-day paper persisted, with the paper receiving bids worth 23.0 bn against the offered Kshs 4.0 bn, translating to a subscription rate of 575.3%, lower than the subscription rate of 921.2%, recorded the previous week. The subscription rate for the 182-day paper decreased to 22.7% from 32.2% recorded the previous week, while that of the 364-day paper decreased significantly to 27.8% from 89.2% recorded the previous week. The government accepted a total of Kshs 17.4 bn worth of bids out of Kshs 28.1 bn bids received, translating to an acceptance rate of 62.1%. The yields on the government papers were on an upward trajectory with the yields on the 182-day paper increasing the most by 6.6 bps to 8.84% from 8.78% recorded the previous week. The yield on the 364-day paper increased by 1.9 bps to remain relatively unchanged at the 9.0% recorded the previous week, while the yield on the 91-day paper increased by 0.7 bps to remain relatively unchanged at 8.8% recorded the previous week;
Also, during the week, the Central Bank of Kenya released the tap sale results for the re-opened treasury bonds FXD1/2018/020 and FXD1/2021/025 with tenors to maturities of 11.8 years and 20 years respectively and fixed coupon rates of 13.2% and 13.9% respectively. The bonds were oversubscribed, with the overall subscription rate coming in at 155.1%, receiving bids worth Kshs 31.0 bn against the offered Kshs 20.0 bn. The government accepted bids worth Kshs 29.2 bn, translating to an acceptance rate of 94.3%. The weighted average yields for the accepted bids for the FXD1/2018/020 and FXD1/2021/025 came in at 14.0% and 14.9% respectively. Notably, the 14.0% and 14.9% yields on FXD1/2018/020 and FXD1/2025/025 remained unchanged, equal to the rate recorded for the reopened bond last week;
The government is also looking to raise Kshs 10.0 bn through the switch auction from FXD1/2021/005 to FXD1/2012/020 with fixed coupon rates of 11.3% and 12.0% respectively and tenors to maturity of 0.3 years and 6.3 years respectively. The period of sale for the two bonds opened on Friday 26th June 2026 and will close on Monday 13th July 2026. Our bidding ranges for the switch to FXD1/2012/020 from FXD1/2021/005 is 11.25% - 11.75%;
We are projecting the y/y inflation rate for June 2026 will increase to within the range of 6.8% - 7.0%, primarily driven by the elevated fuel prices;
Equities
During the week, the equities market was on an upward trajectory, with NSE 20, NSE 10, NASI, and NSE 25 gaining by 2.6%, 2.5%, 2.3% and 2.3% respectively, taking the YTD performance to gains of 20.9%, 20.8%, 19.2% and 18.7% for NSE 10, NSE 25, NSE 20 and NASI respectively. The week-on-week equities market performance was mainly driven by gains recorded by large cap stocks such as ABSA, BAT and KCB of 5.7%, 5.2% and 3.8% respectively. However, the performance was weighed down by losses recorded by large cap stocks such as EABL, Standard Chartered and DTB-K of 1.0%, 0.6% and 0.5% respectively;
During the week, the banking sector index increased by 2.1% to 254.5 from 249.2 recorded the previous week. This is attributable to gains recorded by large cap stocks such Absa, KCB and Cooperative Bank of 5.7%, 3.8% and 3.6% respectively. However, the performance was weighed down by losses recorded by large cap stocks such as Standard Chartered, DTB-K and Equity of 0.6%, 0.5% and 0.3% respectively;
Real Estate
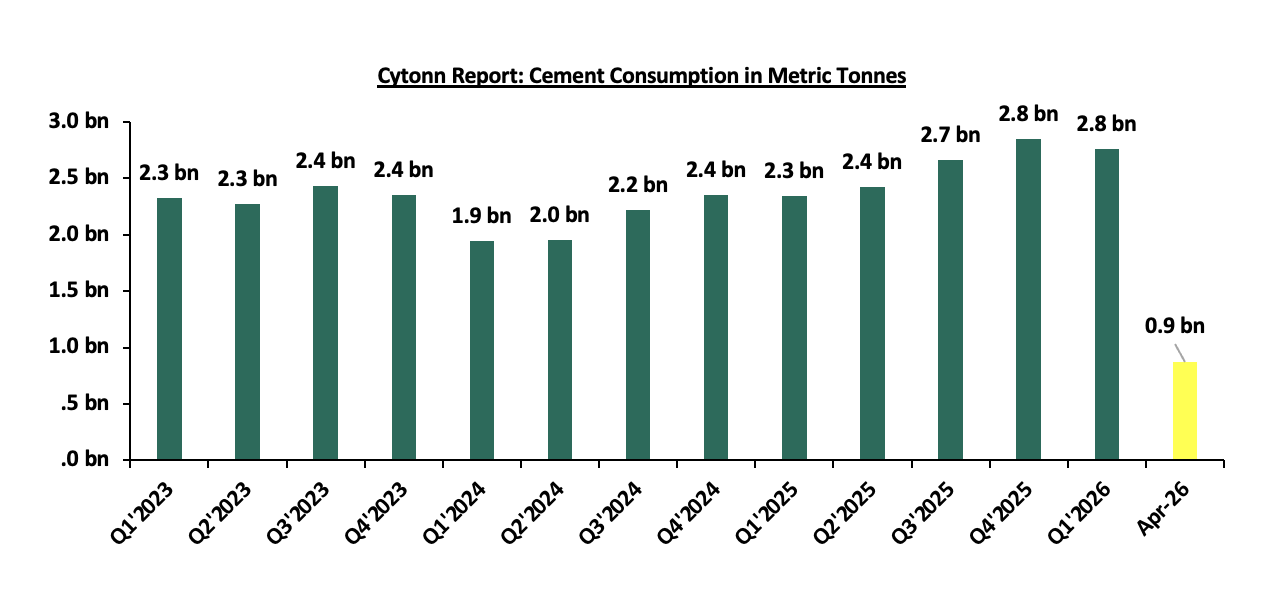
During the week, the Kenya National Bureau of Statistics (KNBS) released the Leading Economic Indicators (LEI) April 2026 Report, which highlighted the performance of major economic indicators. In April 2026, cement consumption reached 0.9 metric tonnes, representing a 9.9% y/y increase from 0.8 metric tonnes in April 2025;
During the week, the Government signed a Kshs 154.2 bn contract with China Road and Bridge Corporation (CRBC) for the expansion of Jomo Kenyatta International Airport (JKIA), with financing structured through a combination of Kshs 100.0 bn in debt and Kshs 50.0 bn in equity contributions, as the Government moves to nearly triple annual passenger capacity from 7.5 mn to 22.0 mn and cement Kenya's position as a leading regional aviation hub;
During the week, President Ruto announced plans to expand the Kshs 30.0 bn Bomas International Convention Complex to include two hotels, a shopping mall, and an arena, with the broader project expected to boost annual tourism arrivals to more than 5.0 mn visitors and generate over Ksh 1.0 tn in economic activity by 2028, reinforcing the Government's strategy of deploying large-scale public infrastructure as a catalyst for hospitality, retail, and mixed-use real estate demand;
On the Unquoted Securities Platform Acorn D-REIT and I-REIT traded at Kshs 29.6 and Kshs 23.8 per unit, respectively, as per the last updated data on 19th June 2026. The performance represented a 48.0% and 18.8% gain for the D-REIT and I-REIT, respectively, from the Kshs 20.0 inception price. Additionally, ILAM Fahari I-REIT traded at Kshs 13.8 per share as of 19th June 2026, representing a 31.0% loss from the Kshs 20.0 inception price;
Digital Payments
During the week, the European Central Bank secured key parliamentary backing for the proposed Digital Euro, moving the project closer to formal legislative approval. The initiative is strategically designed to reduce Europe’s reliance on U.S.-dominated payment networks such as Visa Inc. and Mastercard Incorporated, while strengthening Europe’s monetary sovereignty in digital payments infrastructure. A pilot phase is expected in 2027, with a potential full rollout by 2029;
The digital payment stocks we track (AXP, Visa, Mastercard, Circle, Block and Paypal) are currently trading at an average P/E of 26.0x, implying that investors are pricing in strong future earnings growth expectations and are willing to pay a significant premium for current earnings, which may also suggest that valuations may be stretched relative to near-term fundamentals;
Focus of the Week
Following the release of Kenya’s FY’2026/2027 National Budget, this week we analyze the fiscal components of the budget including revenue expectation, expenditure, and public debt. We shall also look at the key tax changes in the recently signed Finance Act 2026;
Money Markets, T-Bills Primary Auction:
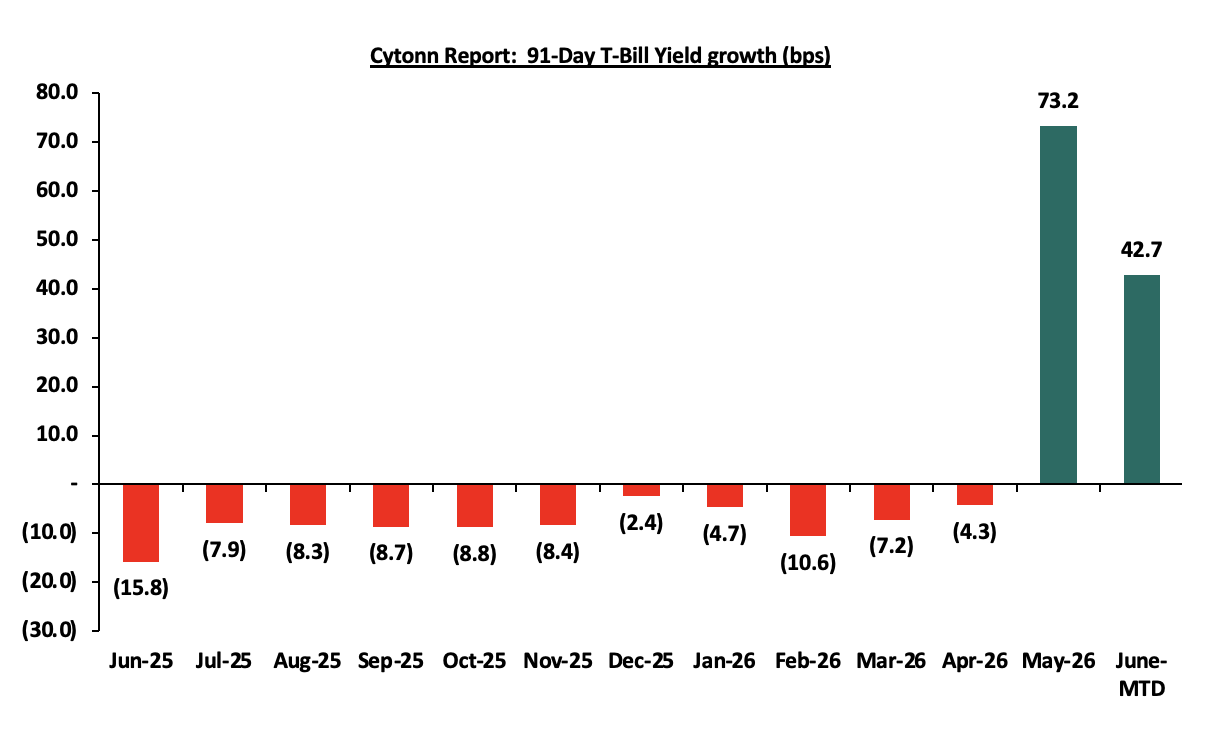
This week, T-bills were oversubscribed for the fourth consecutive week, with the overall subscription rate coming in at 116.9%, lower than the subscription rate of 204.1%, recorded the previous week. Investors’ preference for the shorter 91-day paper persisted, with the paper receiving bids worth 23.0 bn against the offered Kshs 4.0 bn, translating to a subscription rate of 575.3%, lower than the subscription rate of 921.2%, recorded the previous week. The subscription rate for the 182-day paper decreased to 22.7% from 32.2% recorded the previous week, while that of the 364-day paper decreased significantly to 27.8% from 89.2% recorded the previous week. The government accepted a total of Kshs 17.4 bn worth of bids out of Kshs 28.1 bn bids received, translating to an acceptance rate of 62.1%. The yields on the government papers were on an upward trajectory with the yields on the 182-day paper increasing the most by 6.6 bps to 8.84% from 8.78% recorded the previous week. The yield on the 364-day paper increased by 1.9 bps to remain relatively unchanged from the 9.0% recorded the previous week, while the yield on the 91-day paper increased by 0.7bps to remain relatively unchanged from 8.8% recorded the previous week. The chart below shows the yield growth rate for the 91-day paper from June 2025 to date:
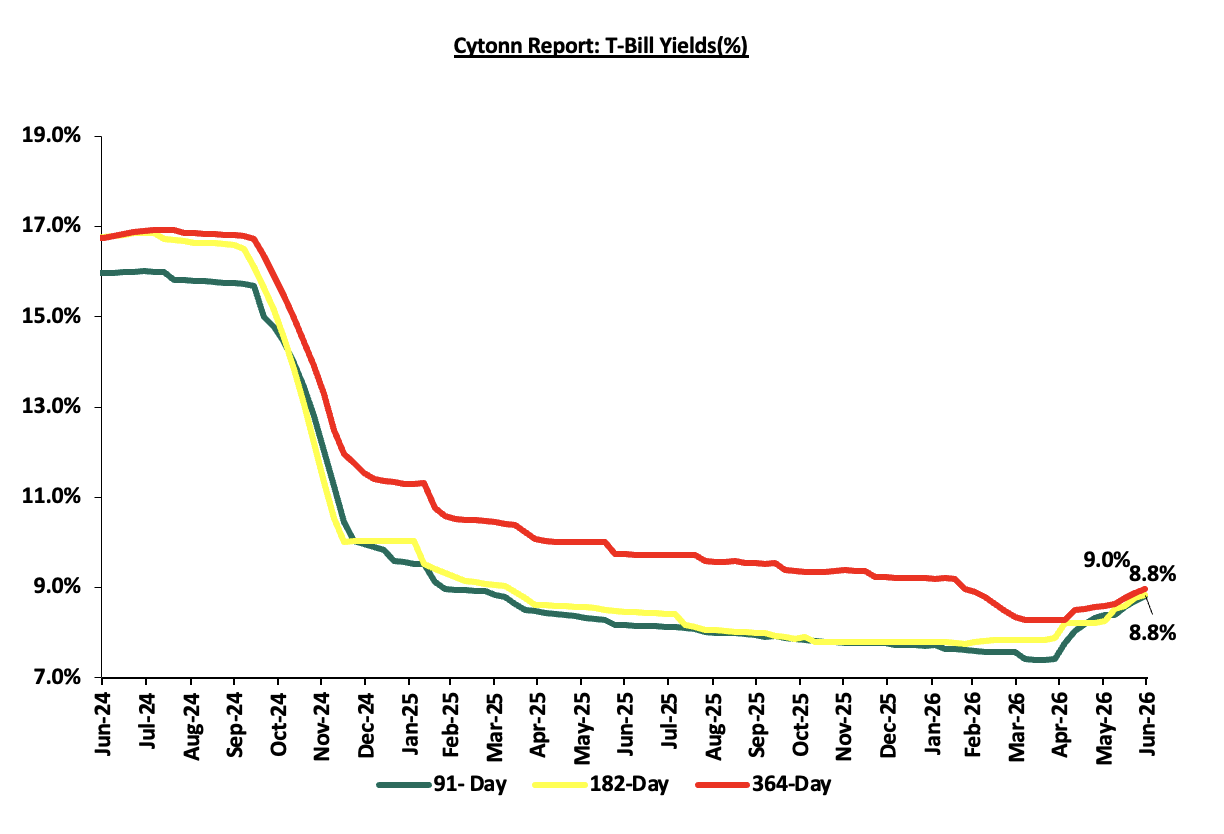
The chart below shows the performance of the 91-day, 182-day and 364-day papers from June 2024 to June 2026:
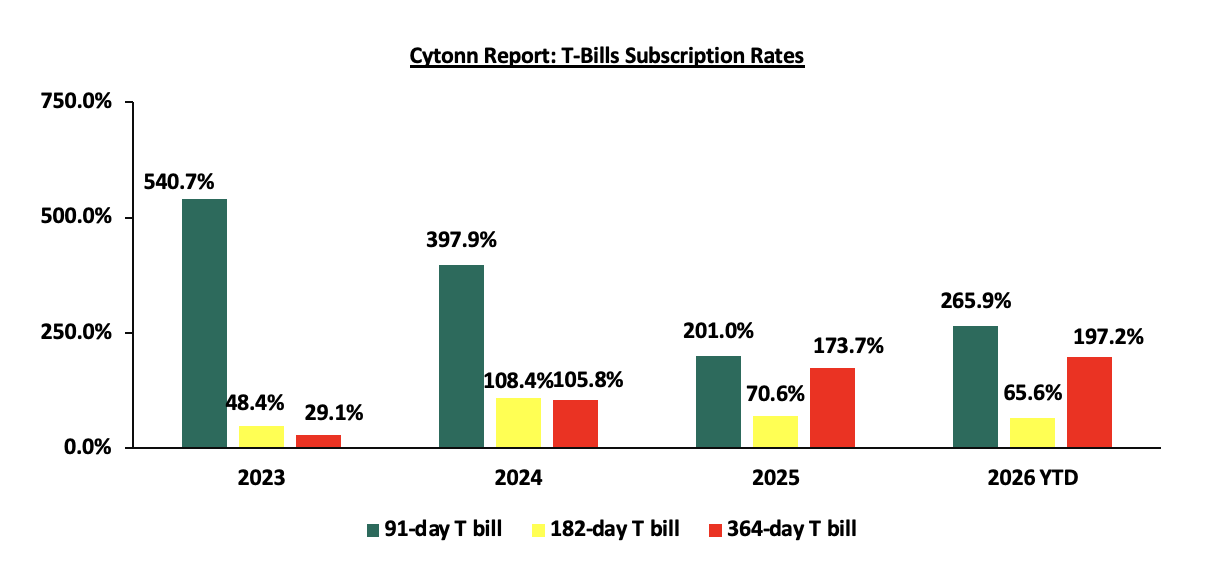
The chart below compares the overall average T-bill subscription rates obtained in 2023, 2024, 2025 and 2026 Year-to-date (YTD):
T-Bonds Primary Auction:
This week, the Central Bank of Kenya released the tap sale results for the re-opened treasury bonds FXD1/2018/020 and FXD1/2021/025 with tenors to maturities of 11.8 years and 20 years respectively and fixed coupon rates of 13.2% and 13.9% respectively. The bonds were oversubscribed, with the overall subscription rate coming in at 155.1%, receiving bids worth Kshs 31.0 bn against the offered Kshs 20.0 bn. The government accepted bids worth Kshs 29.2 bn, translating to an acceptance rate of 94.3%. The weighted average yields for the accepted bids for the FXD1/2018/020 and FXD1/2021/025 came in at 14.0% and 14.9% respectively. Notably, the 14.0% and 14.9% yields on FXD1/2018/020 and FXD1/2025/025 remained unchanged, equal to the rate recorded for the reopened bond last week.
The government is also looking to raise Kshs 10.0 bn through the switch auction from FXD1/2021/005 to FXD1/2012/020 with fixed coupon rates of 11.3% and 12.0% respectively and tenors to maturity of 0.3 years and 6.3 years respectively. The period of sale for the two bonds opened on Friday 26th June 2026 and will close on Monday 13th July 2026. Our bidding ranges for the switch to FXD1/2012/020 from FXD1/2021/005 is 11.25% - 11.75%.
Money Market Performance:
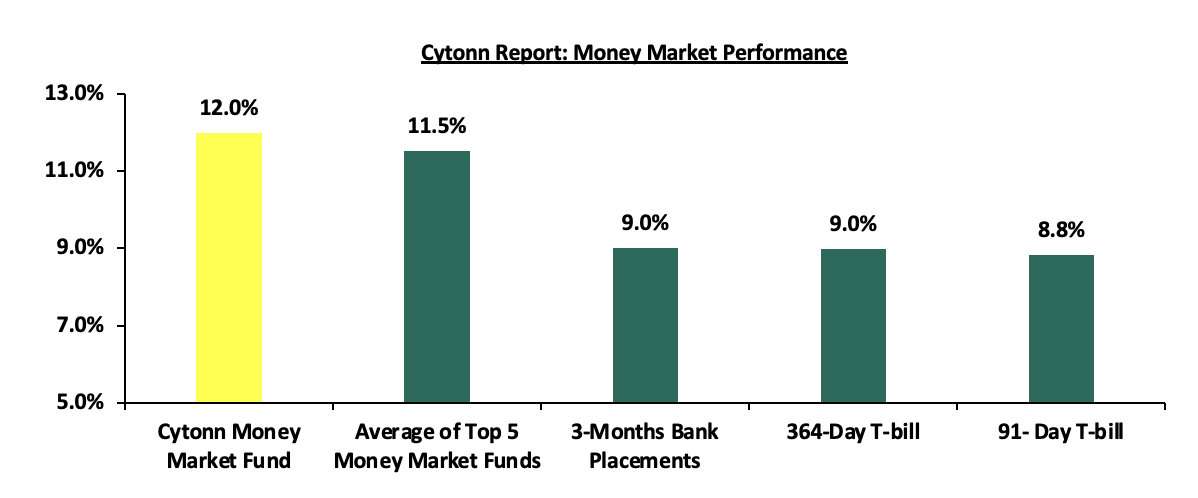
In the money markets, 3-month bank placements ended the week at 9.0% (based on rates offered by various banks. The yields on the government papers were on an upward trajectory with the yields on the 91-day paper increasing by 0.7 bps to remain relatively unchanged from 8.8% recorded the previous week, while the yield on the 364-day paper also increased by 1.9 bps to remain relatively unchanged from 9.0% recorded the previous week. The yield on the Cytonn Money Market Fund remained relatively unchanged from the 12.0% recorded the previous week, while the average yields on the Top 5 Money Market Funds increased by 5.8 bps to 11.52% from 11.47% recorded the previous week.
The table below shows the Money Market Fund Yields for Kenyan Fund Managers as published on 26th June 2026:
|
Money Market Fund Yield for Fund Managers as published on 26th June 2026 |
||
|
Rank |
Fund Manager |
Effective Annual Rate |
|
1 |
Nabo Africa Money Market Fund |
13.8% |
|
2 |
Cytonn Money Market Fund ( Dial *809# or download Cytonn App) |
12.0% |
|
3 |
Etica Money Market Fund |
10.7% |
|
4 |
Lofty-Corban Money Market Fund |
10.6% |
|
5 |
Madison Money Market Fund |
10.5% |
|
6 |
Enwealth Money Market Fund |
10.5% |
|
7 |
Ndovu Money Market Fund |
10.5% |
|
8 |
Arvocap Money Market Fund |
10.3% |
|
9 |
Kuza Money Market fund |
10.3% |
|
10 |
Faulu Money Market Fund |
10.3% |
|
11 |
Gulfcap Money Market Fund |
10.1% |
|
12 |
Old Mutual Money Market Fund |
10.1% |
|
13 |
Orient Kasha Money Market Fund |
10.0% |
|
14 |
Jubilee Money Market Fund |
10.0% |
|
15 |
British-American Money Market Fund |
9.8% |
|
16 |
GenAfrica Money Market Fund |
9.4% |
|
17 |
Apollo Money Market Fund |
9.2% |
|
18 |
KCB Money Market Fund |
9.1% |
|
20 |
Dry Associates Money Market Fund |
9.0% |
|
21 |
Genghis Money Market Fund |
9.0% |
|
22 |
SanlamAllianz Money Market Fund |
8.7% |
|
23 |
CIC Money Market Fund |
8.4% |
|
24 |
CPF Money Market Fund |
8.1% |
|
25 |
Co-op Money Market Fund |
8.0% |
|
26 |
Mali Money Market Fund |
7.9% |
|
27 |
ICEA Lion Money Market Fund |
7.7% |
|
28 |
Mayfair Money Market Fund |
7.7% |
|
29 |
Absa Shilling Money Market Fund |
7.1% |
|
30 |
AA Kenya Shillings Fund |
6.0% |
|
31 |
Ziidi Money Market Fund |
5.9% |
|
32 |
Stanbic Money Market Fund |
5.2% |
|
33 |
Equity Money Market Fund |
5.2% |
Source: Business Daily
Liquidity:
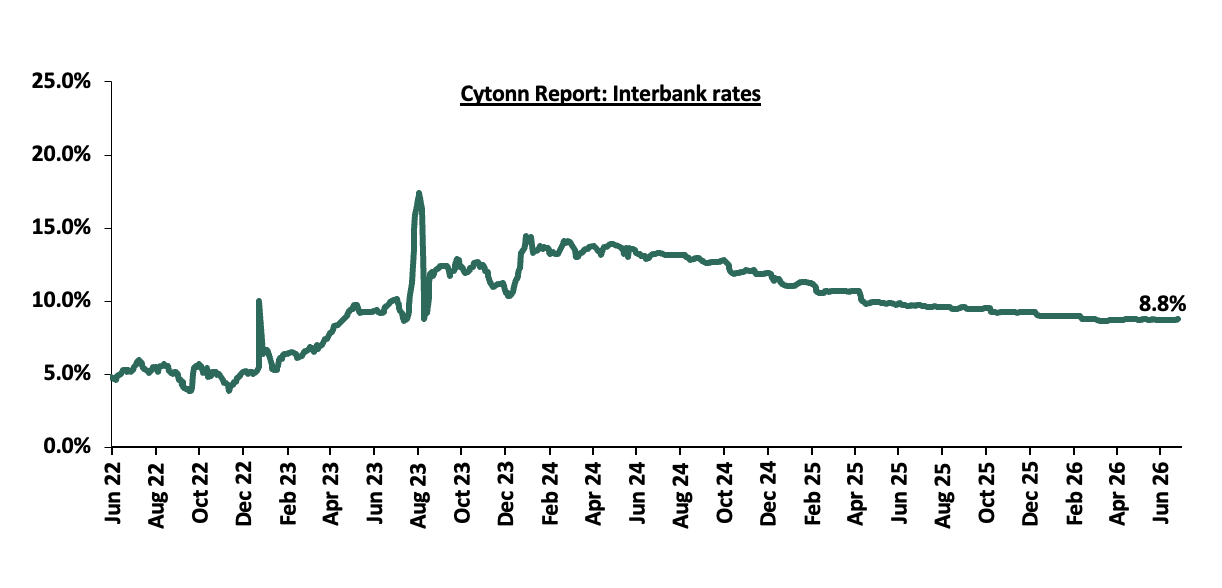
During the week, liquidity in the money markets eased with the average interbank rate decreasing marginally by 0.1 bps to 8.7% from 8.8% recorded last week, partly attributable to tax remittances that offset government payments. The average interbank volumes traded increased significantly by 187.7% to Kshs 16.1 bn from Kshs 5.6 bn recorded the previous week. The chart below shows the interbank rates in the market over the years:
Kenya Eurobonds:
During the week, the yields on the Eurobonds were on an upward trajectory with the yield on the 12-year Eurobond issued in 2019, increasing the most by 9.0 bps to 7.3% from 7.2% recorded the previous week. The table below shows the summary performance of the Kenyan Eurobonds as of 25th June 2026;
|
Cytonn Report: Kenya Eurobonds Performance |
||||||
|
|
2018 |
2019 |
2021 |
2024 |
||
|
Tenor |
10-year issue |
30-year issue |
12-year issue |
13-year issue |
7-year issue |
|
|
Amount Issued (USD) |
1.0 bn |
1.0 bn |
1.0 bn |
1.5 bn |
1.5 bn |
|
|
Years to Maturity |
2.5 |
22.5 |
8.8 |
5.5 |
10.5 |
|
|
Yields at Issue |
7.3% |
8.3% |
6.2% |
10.4% |
9.9% |
|
|
02-Jan-26 |
6.1% |
8.8% |
7.2% |
7.8% |
7.1% |
|
|
01-Jun-26 |
7.1% |
8.9% |
7.7% |
8.2% |
7.3% |
|
|
18-Jun-26 |
6.6% |
8.6% |
7.2% |
7.8% |
6.8% |
|
|
19-Jun-26 |
6.6% |
8.6% |
7.2% |
7.8% |
6.8% |
|
|
22-Jun-26 |
6.6% |
8.6% |
7.2% |
7.7% |
6.9% |
|
|
23-Jun-26 |
6.7% |
8.7% |
7.3% |
7.8% |
6.9% |
|
|
24-Jun-26 |
6.7% |
8.7% |
7.3% |
7.8% |
6.9% |
|
|
25-Jun-26 |
6.6% |
8.7% |
7.3% |
7.8% |
6.9% |
|
|
Weekly Change |
0.0% |
0.0% |
0.1% |
0.0% |
0.1% |
|
|
MTD Change |
(0.5%) |
(0.2%) |
(0.4%) |
(0.4%) |
(0.5%) |
|
|
YTD Change |
0.6% |
(0.2%) |
0.1% |
(0.0%) |
(0.2%) |
|
Source: Central Bank of Kenya (CBK) and National Treasury
Kenya Shilling:
During the week, the Kenya Shilling depreciated against the US Dollar by 13.1 bps to Kshs 129.6 from Kshs 129.5 recorded the previous week. On a year-to-date basis, the shilling has depreciated by 45.7 bps against the dollar, as compared to the 22.9 bps appreciation recorded in 2025.
We expect the shilling to be supported by:
- Diaspora remittances standing at a cumulative USD 5,007.6 mn in the twelve months to May 2026, 0.5% lower than the USD 5,032.8 mn recorded over the same period in 2025. These have continued to cushion the shilling against further depreciation. In the May 2026 diaspora remittances figures, North America remained the largest source of remittances to Kenya accounting for 51.9% in the period, and,
- Tourism inflows, which strengthened significantly. Tourism receipts reached Kshs 560.0 bn in 2025, up from Kshs 452.2 bn in 2024, representing a 23.9% increase, supported by improved international arrivals through the country’s major airports, and,
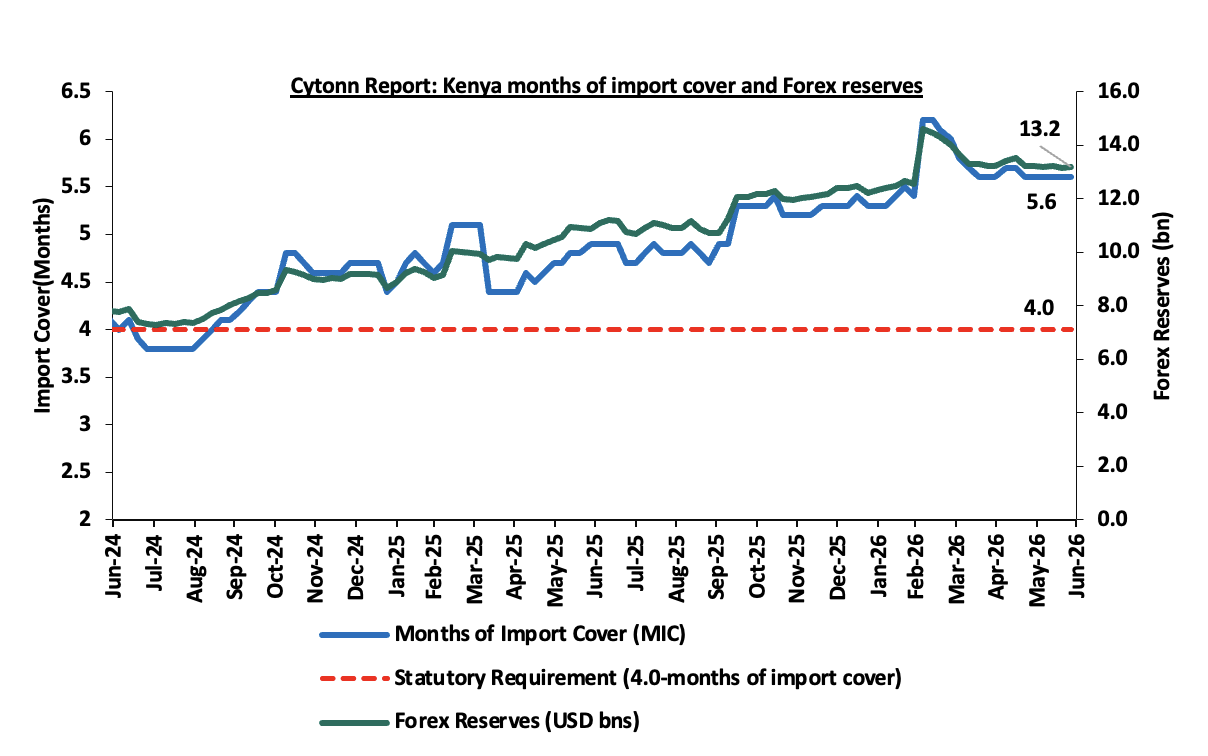
- Improved forex reserves currently at USD 13.2 bn (equivalent to 5.6-months of import cover), which is above the statutory requirement of maintaining at least 4.0-months of import cover and above the EAC region’s convergence criteria of 4.5-months of import cover.
The shilling is however expected to remain under pressure in 2026 as a result of:
- An ever-present current account deficit which came at 2.6% of GDP in the twelve months to April 2026, and,
- The need for government debt servicing, continues to put pressure on forex reserves given that 52.0% of Kenya’s external debt is US Dollar-denominated as of September 2025.
- Rising geopolitical tensions in the Middle East, which could exert pressure on the shilling through higher global oil prices and increased uncertainty in international markets. Given that Kenya is a net importer of petroleum products, any sustained increase in oil prices would widen the import bill, increase demand for US Dollars, and consequently put depreciation pressure on the shilling.
Kenya’s forex reserves increased by 18.3 bps during the week to USD 13.2 bn from USD 13.1 bn recorded the previous week, equivalent to 5.6 months of import cover, and above the statutory requirement of maintaining at least 4.0-months of import cover. The chart below summarizes the evolution of Kenya's months of import cover over the years:
Weekly Highlights
- June Inflation Projection
We are projecting the y/y inflation rate for June 2026 will increase to within the range of 6.8% - 7.0%, mainly on the back of:
- Fuel prices – The Energy and Petroleum Regulatory Authority (EPRA) released their monthly statement on the maximum retail fuel prices in Kenya, effective from 15th June 2026 to 14th July 2026. Notably, the maximum allowed prices for Super Petrol, and Diesel decreased by Kshs 0.2, and Kshs 10.0 per litre to Kshs 214.0, and Kshs 222.9 per litre from Kshs 214.3, and Kshs 232.9 per litre respectively in May 2026. While Kerosene remain unchanged at Kshs 191.4 per litre. Although the reduction is expected to provide some relief to transport and production costs, fuel prices remain elevated by historical standards, and the lower prices applied only during the second half of the month. As a result, the overall impact on inflation is expected to be limited, with persistently high fuel costs continuing to exert upward pressure on consumer prices over the projection period.
- Depreciation of the Kenya Shilling against the US Dollar - The Kenya Shilling recorded a 14.7 bps month-to-date depreciation as of 26th June 2026 to Kshs 129.6 from Kshs 129.5 recorded at the beginning of the month. This depreciation in the exchange rate could tighten inflationary pressures, making imported goods more expensive.
- The Central Bank Rate (CBR) – In June 2026, the CBK Monetary Policy Committee maintained the Central Bank Rate (CBR) at 8.75%, unchanged from April 2026, in a bid to keep inflation expectations anchored amid geopolitical tensions in the Middle East. However, overall, policy rates had eased in recent months, declining by a cumulative 1.0% points in the 12 months to June 2026 to 8.75% from 9.75% in June 2025. The decision to keep the CBR unchanged reflects a neutral monetary policy stance. However, with cheaper credit from earlier rate cuts, external supply shocks, and potential exchange rate depreciation, inflationary pressures are likely to persist. A higher policy rate could have helped moderate these pressures, but maintaining the current rate is expected to support higher inflation over the projection period .The Monetary Policy Committee is expected to adopt a more cautious approach to rate adjustments in the coming meetings while monitoring the effects of the Middle East Conflict.
We, however expect the inflation to be supported by:
- Decreased electricity forex adjustments charges - In June 2026, electricity prices decreased marginally with EPRA setting the fuel cost charge to remain relatively unchanged from Kshs 3.1 in May 2026, while the forex adjustment was dropped to Kshs 0.7 from Kshs 1.1 in May 2026. Although the lower forex adjustment is expected to modestly reduce electricity costs, the unchanged fuel cost charge implies a broadly neutral effect on electricity tariffs. A reduction in the fuel cost charge would have provided greater relief to production and household electricity costs, further easing inflationary pressures, while an increase would have intensified cost-push inflation. Overall, the modest decline in electricity costs is expected to exert slight downward pressure on inflation given that electricity is a key driver of inflation. The decline is expected to ease production costs for businesses and reduce electricity expenses for households.
The ongoing US–Iran tensions disrupted global oil logistics, particularly around the Strait of Hormuz, sustaining volatility and a persistent risk premium in crude oil prices. Although recent diplomatic engagements and indirect de-escalations talks have sought to ease maritime tensions in the Strait of Hormuz, disruptions have shifted from acute shocks to more intermittent and structural supply frictions. Murban crude, Kenya’s key import grade, remains elevated and volatile, keeping upward pressure on future pump prices. Any pass through into fuel price have significant implications for inflation, given fuel’s central role in transport, logistics, and production costs. The depreciation of the Kenyan Shilling is expected to exert upward pressure on inflation by increasing the landed cost of imports such as fuel, raw materials, and intermediate goods. Given the economy’s reliance on imported inputs, the weaker currency is likely to raise production and transportation costs across various sectors, with businesses potentially passing these additional costs on to consumers through higher prices of goods and services. While the recent marginal decrease of the electricity forex adjustment charges offers some temporary relief on inflation, this support remains vulnerable to renewed geopolitical risks and sustained oil price volatility. We however still expect inflationary pressures to remain anchored within the CBK’s target range of 2.5%-7.5%, but above the midpoint in the short to medium term.
Rates in the Fixed Income market have been on an upward trend due to tightened liquidity in the money market which has limited the government to front load most of its borrowing. The government is 29.3% ahead of its prorated net domestic borrowing target of Kshs 995.9 bn, having a net borrowing position of Kshs 1287.8 bn (inclusive of T-bills). However, we expect the yield curve to remain under upward pressure in the short and medium term, driven by the inflationary pressure, with the government looking to increase its domestic borrowing to finance the fiscal deficit. As such, we expect the yields to rise across maturities and hence investors are expected to shift towards the short to medium-term papers to lock in the high returns while maintaining flexibility in the event of further increase in interest rates.
Market Performance:
During the week, the equities market was on an upward trajectory, with NSE 20, NSE 10, NASI, and NSE 25 gaining by 2.6%, 2.5%, 2.3% and 2.3% respectively, taking the YTD performance to gains of 20.9%, 20.8%, 19.2% and 18.7% for NSE 10, NSE 25, NSE 20 and NASI respectively. The week-on-week equities market performance was mainly driven by gains recorded by large cap stocks such as ABSA, BAT and KCB of 5.7%, 5.2% and 3.8% respectively. However, the performance was weighed down by losses recorded by large cap stocks such as EABL, Standard Chartered and DTB-K of 1.0%, 0.6% and 0.5% respectively;
During the week, the banking sector index increased by 2.1% to 254.5 from 249.2 recorded the previous week. This is attributable to gains recorded by large cap stocks such Absa, KCB and Cooperative Bank of 5.7%, 3.8% and 3.6% respectively. However, the performance was weighed down by losses recorded by large cap stocks such as Standard Chartered, DTB-K and Equity of 0.6%, 0.5% and 0.3% respectively;
During the week, equities turnover increased by 14.1% to USD 56.8 mn from USD 49.8 mn recorded the previous week, taking the YTD total turnover to USD 840.6 mn. Foreign investors became net buyers for the second time in three weeks with a net buying position of USD 3.5 mn, from a net selling position of USD 0.2 mn recorded the previous week, taking the YTD foreign net selling position to USD 76.2 mn, compared to a net selling position of USD 92.9 mn recorded in 2025;
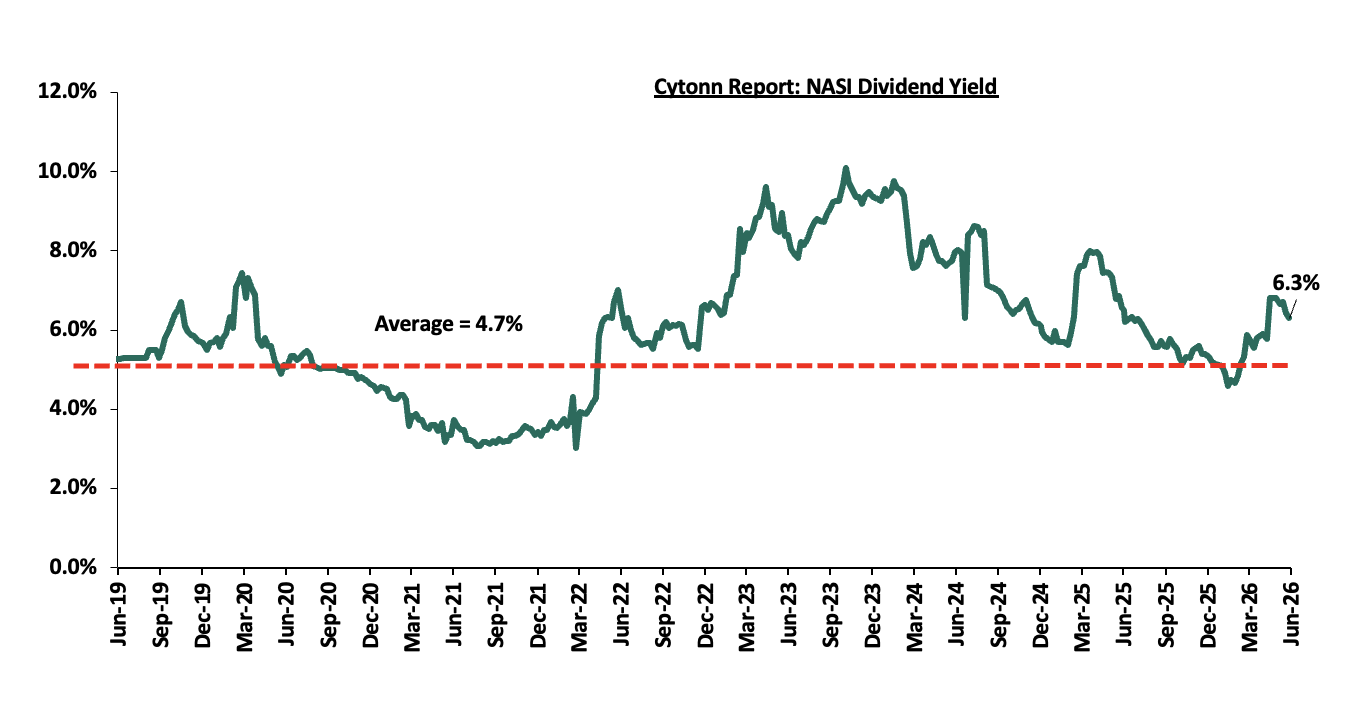
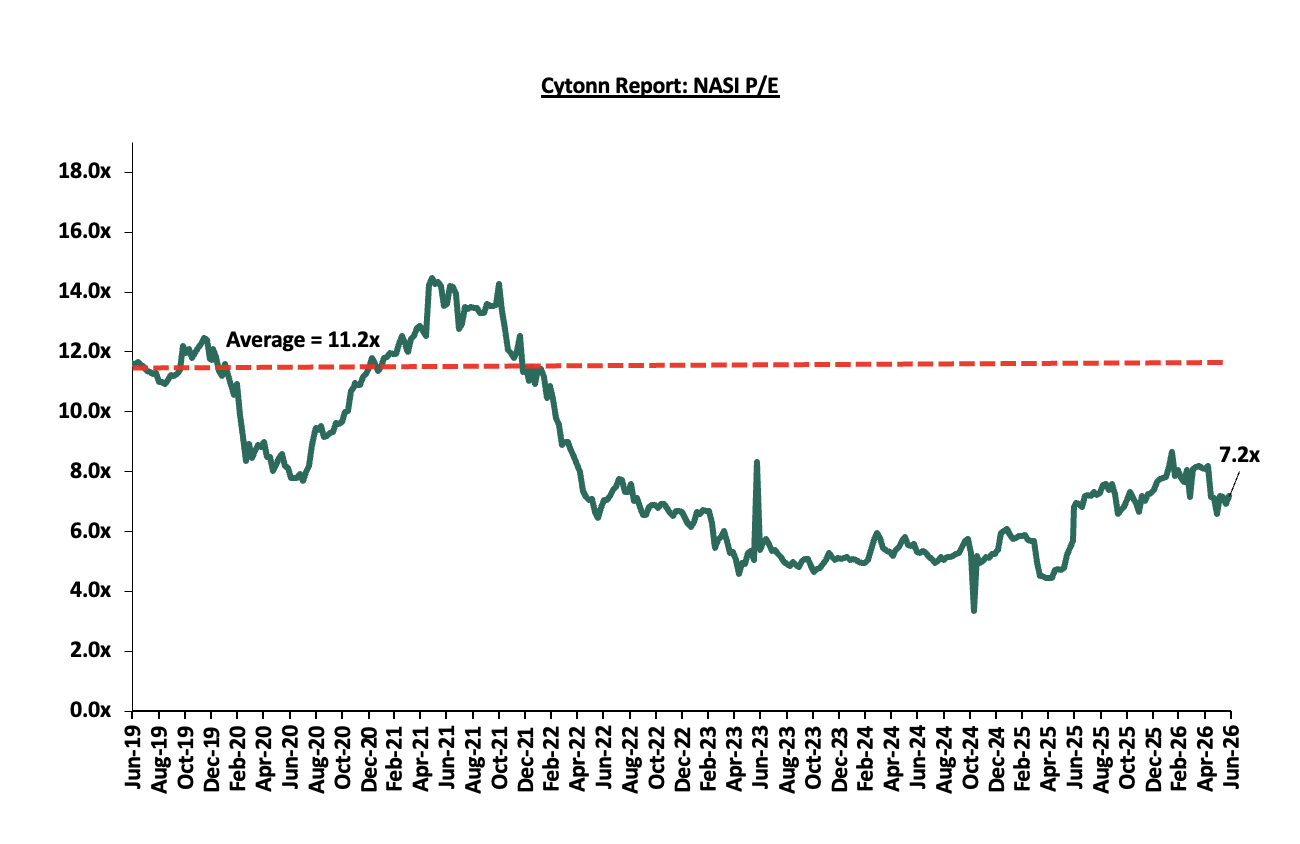
The market is currently trading at a price to earnings ratio (P/E) of 7.2x, 36.1% below the historical average of 11.2x, and a dividend yield of 6.3%, 1.6% points above the historical average of 4.7%. Key to note, NASI’s PEG ratio currently stands at 0.9x, an indication that the market is slightly undervalued relative to its future growth. A PEG ratio greater than 1.0x indicates the market may be overvalued while a PEG ratio less than 1.0x indicates that the market is undervalued;
The charts below indicate the historical P/E and dividend yields of the market:
Universe of Coverage:
|
Cytonn Report: Equities Universe of Coverage |
|||||||||||
|
Company |
Price as at 19/06/2026 |
Price as at 26/06/2027 |
w/w change |
m/m change |
YTD Change |
Year Open 2026 |
Target Price* |
Dividend Yield |
Upside/ Downside** |
P/TBv Multiple |
Recommendation |
|
NCBA |
90.0 |
91.8 |
1.9% |
5.2% |
7.9% |
85.0 |
108.9 |
7.7% |
26.5% |
1.3x |
Buy |
|
CIC Group |
4.2 |
4.5 |
6.2% |
6.7% |
(1.5%) |
4.5 |
5.5 |
2.9% |
26.0% |
1.1x |
Buy |
|
Diamond Trust Bank |
141.8 |
141.0 |
(0.5%) |
(4.2%) |
22.9% |
114.8 |
161.4 |
6.4% |
20.9% |
0.4x |
Buy |
|
KCB Group |
73.3 |
76.0 |
3.8% |
13.9% |
15.6% |
65.8 |
83.9 |
9.2% |
19.7% |
0.8x |
Accumulate |
|
ABSA Bank |
30.8 |
32.5 |
5.7% |
13.0% |
30.8% |
24.9 |
36.8 |
6.3% |
19.7% |
1.8x |
Accumulate |
|
Family Bank |
18.0 |
24.5 |
36.1% |
36.1% |
36.1% |
18.0 |
27.6 |
4.9% |
17.6% |
1.3x |
Accumulate |
|
Jubilee Holdings |
360.3 |
359.5 |
(0.2%) |
(2.1%) |
11.5% |
322.5 |
407.5 |
4.2% |
17.5% |
0.5x |
Accumulate |
|
Equity Group |
80.0 |
79.8 |
(0.3%) |
7.4% |
19.0% |
67.0 |
87.5 |
7.2% |
16.9% |
1.0x |
Accumulate |
|
Co-op Bank |
33.3 |
34.5 |
3.6% |
7.5% |
44.4% |
23.9 |
36.9 |
7.2% |
14.3% |
1.3x |
Accumulate |
|
Standard Chartered Bank |
336.8 |
334.8 |
(0.6%) |
0.5% |
11.7% |
299.8 |
345.8 |
9.3% |
12.6% |
2.1x |
Accumulate |
|
Stanbic Holdings |
289.0 |
291.0 |
0.7% |
8.0% |
47.2% |
197.8 |
300.3 |
7.7% |
10.9% |
1.6x |
Accumulate |
|
I&M Group |
61.8 |
65.8 |
6.5% |
29.6% |
53.6% |
42.8 |
67.9 |
5.7% |
9.0% |
1.1x |
Hold |
|
Britam |
12.4 |
12.8 |
2.8% |
3.7% |
40.7% |
9.1 |
13.5 |
0.0% |
5.9% |
1.0x |
Hold |
|
*Target Price as per Cytonn Analyst estimates **Upside/ (Downside) is adjusted for Dividend Yield ***Dividend Yield is calculated using FY’2025 Dividends |
|||||||||||
We maintain a “cautiously optimistic” short-term outlook supported primarily by attractive valuations due better returns`, despite rising yields on short-term government papers, which increase competition for capital by drawing investors towards risk-free government securities, as well as heightened geopolitical risks such as Iran war that may weigh on investor sentiment, and, “neutral” in the long term as persistent foreign investor outflows continue to constrain market liquidity and limit broad-based market re-rating. With the market currently trading at a discount to its future growth (PEG Ratio at 0.9x), where performance will be driven by company-specific fundamentals rather than general market direction, we believe that investors should reposition towards value stocks exhibiting strong earnings growth, attractive dividend yields, solid balance sheets, sustainable competitive advantages and trading at compelling discounts to their intrinsic value. While foreign investor sell-offs are expected to continue exerting pressure in the near term, we believe this will create selective entry opportunities for long-term investors.
- Industry Report
- April Leading Economic Indicators (LEI)
During the week, the Kenya National Bureau of Statistics (KNBS) released the Leading Economic Indicators (LEI) April 2026 Report, which highlighted the performance of major economic indicators. The key highlights related to the Real Estate sector include:
- In April 2026, cement consumption reached 0.9 metric tonnes, representing a 9.9% y/y increase from 0.8 metric tonnes in April 2025. Month-on-month, consumption decreased by 7.4%, to 869,943 from 939,681 in March 2026 reflecting a decrease in momentum in the construction sector. The y/y performance was anchored by (i) continued private sector construction activity in urban hubs such as Nairobi, Mombasa, and Kisumu, (ii) government-led infrastructure investments under the Bottom-Up Economic Transformation Agenda (BETA), including roads, affordable housing, water, and sanitation projects, and (iii) public works initiatives in rural and semi-urban areas, which both support livelihoods and expand critical infrastructure.
The chart below shows cement consumption in metric tonnes in Kenya between Q1’2023 and April 2026.
- Hospitality Sector
- Government plans Kshs 154.2 bn JKIA expansion through debt and infrastructure funding
During the week, President William Ruto announced plans to expand the ongoing Kshs 30.0 bn Bomas International Convention Complex project to include two hotels, a shopping mall and an arena, reaffirming the Government's commitment to delivering large-scale, infrastructure-led development projects across the country. Construction of the complex, which is being undertaken by the Kenya Defence Forces, began in March 2025 and is set on more than 100,000 SQM of land. The facility will feature an 11,000-seat convention centre, a sports and recreation complex, cultural facilities, a hotel, and an animal orphanage, with the additional components announced by the President representing a further expansion of the project's scope.
The Bomas Complex is one of several flagship projects the Government is positioning as catalysts for conference tourism, investment attraction and employment generation. Once completed, the project is expected to help boost tourism arrivals to more than 5.0 mn visitors annually and generate more than Ksh 1.0 tn in economic activity by 2028. President Ruto also emphasized the administration's broader development agenda, noting that infrastructure investments are being extended across all regions of the country, including the ongoing construction of a stadium in Lodwar, as part of efforts to promote inclusive and geographically balanced growth.
Going forward, the expansion of the Bomas Complex is expected to have significant positive spillover effects on the Real Estate sector, particularly within the hospitality, retail and mixed-use segments. The addition of two hotels and a large-format mall will directly stimulate demand for hospitality accommodation and retail space, while the arena and convention centre are likely to drive ancillary demand for commercial office space, food and beverage facilities and short-stay accommodation in the surrounding areas. More broadly, the project reinforces the Government's strategy of using public infrastructure investment as a lever for economic transformation, with the KDF's role as the implementing contractor reflecting a continued preference for leveraging state capacity to deliver strategic developments.
- Infrastructure Sector
- Government signs Kshs 154.2 bn JKIA expansion through debt and infrastructure funding
During the week, the Government signed a Kshs 154.2 bn contract with China Road and Bridge Corporation (CRBC) for the expansion and modernization of Jomo Kenyatta International Airport (JKIA). Transport Cabinet Secretary Davis Chirchir confirmed the award of the contract following a procurement process that spanned approximately three months, during which more than 40 companies participated in a pre-bid conference held in April 2026. The signing was witnessed between CRBC General Manager Yu Xiaodong and Aviation and Aerospace Development Principal Secretary Teresia Mbaika, with Kenya Airports Authority (KAA) designated as the implementing agent.
The financing structure for the project combines debt and equity, with the State expected to borrow up to Kshs 100.0 bn and inject approximately Kshs 50.0 bn in equity, leveraging future airport revenues to service the financing obligations. This blended model reflects the Government's broader strategy of utilizing alternative financing mechanisms to support large-scale infrastructure development while reducing direct pressure on public finances. The project follows the cancellation of a prior 2024 agreement with India's Adani Group, whose founder was indicted in the United States, making the CRBC contract a significant milestone in reviving the long-delayed expansion agenda.
The proposed expansion, expected to be completed within 36 months, includes the construction of a new terminal building and associated support facilities, upgrading of existing infrastructure and improvement of both airside and landside operations. Annual passenger handling capacity is projected to nearly triple, rising from the current 7.5 mn passengers to 22.0 mn passengers, while arrival capacity is set to increase from 25 to 31 aircraft per hour, significantly enhancing the airport's operational throughput.
Going forward, the JKIA expansion is expected to reinforce Kenya's position as a leading regional aviation and logistics hub, supporting growth in tourism, trade, and investment inflows. Enhanced airport infrastructure is likely to stimulate demand across multiple sectors, including hospitality, commercial office space, logistics and warehousing, particularly within Nairobi and its surrounding growth corridors. For the Real Estate sector, improved connectivity and increased passenger and cargo traffic could generate positive spillover effects, driving demand for mixed-use developments near the airport and along key transport corridors. The successful conclusion of the procurement process also signals growing investor confidence in Kenya's infrastructure pipeline and the Government's commitment to delivering strategic projects through structured, alternative financing arrangements.
- Real Estate Investments Trusts
- REITs Weekly Performance
On the Unquoted Securities Platform Acorn D-REIT and I-REIT traded at Kshs 29.6 and Kshs 23.8 per unit, respectively, as per the last updated data on 19th June 2026. The performance represented a 48.0% and 18.8% gain for the D-REIT and I-REIT, respectively, from the Kshs 20.0 inception price. The volumes traded for the D-REIT and I-REIT came in at 13.5 mn and 43.9 mn shares, respectively. Additionally, ILAM Fahari I-REIT traded at Kshs 13.8 per share as of 19th June 2026, representing a 31.0% loss from the Kshs 20.0 inception price. The volume traded to date came in at 1.2 mn shares for the I-REIT, REITs offer various benefits, such as tax exemptions, diversified portfolios, and stable long-term profits. However, the ongoing decline in the performance of Kenyan REITs and the restructuring of their business portfolios are hindering significant previous investments. Additional general challenges include:
- Insufficient understanding of the investment instrument among investors leading to a slower uptake of REIT products,
- Lengthy approval processes for REIT creation,
- High minimum capital requirements of Kshs 100.0 mn for REIT trustees compared to Kshs 10.0 mn for pension funds Trustees, essentially limiting the licensed REIT Trustee to banks only
- The rigidity of choice between either a D-REIT or and I-REIT forces managers to form two REITs, rather than having one Hybrid REIT that can allocate between development and income earning properties
- Limiting the type of legal entity that can form a REIT to only a trust company, as opposed to allowing other entities such as partnerships, and companies,
- We need to give time before REITS are required to list – they would be allowed to stay private for a few years before the requirement to list given that not all companies maybe comfortable with listing on day one, and,
- Minimum subscription amounts or offer parcels set at Kshs 0.1 mn for D-REITs and Kshs 5.0 mn for restricted I-REITs. The significant capital requirements still make REITs relatively inaccessible to smaller retail investors compared to other investment vehicles like unit trusts or government bonds, all of which continue to limit the performance of Kenyan REITs.
We expect the performance of Kenya's Real Estate sector to remain resilient, supported by several factors: i) The signing of the Kshs 154.2 bn JKIA expansion contract; and ii) President Ruto's announcement of plans to expand the Bomas International Convention Complex. However, challenges such the weak investor appetite in listed REITs like ILAM Fahari I-REIT and high capital requirements will continue to constrain the sector's optimal performance.
- European Central Bank Advances Digital Euro Project
During the week, the European Central Bank secured key parliamentary backing for the proposed Digital Euro, moving the project closer to formal legislative approval. The initiative is strategically designed to reduce Europe’s reliance on U.S.-dominated payment networks such as Visa Inc. and Mastercard Incorporated, while strengthening Europe’s monetary sovereignty in digital payments infrastructure. A pilot phase is expected in 2027, with a potential full rollout by
The initiative represents a strategic effort by Europe to strengthen monetary sovereignty and reduce dependence on foreign-controlled payment infrastructure, particularly dominant U.S. payment networks such as Visa Inc. and Mastercard Incorporated, which currently process a significant share of digital transactions across the region. Beyond improving payment autonomy, the Digital Euro is expected to enhance financial resilience, promote innovation in digital finance, and ensure Europe remains competitive as global payment systems increasingly shift toward real-time, digital-first, and blockchain-enabled transaction infrastructure.
- Digital Payments Stock Performance
The table below presents a snapshot of NYSE-listed digital payments stocks, covering Visa, Mastercard, American Express (AXP), Circle, Block and Paypal.
|
Cytonn Report: Digital Payments NYSE stock perfomance |
||||||
|
Company |
Year Open 2026 |
Price 6/19/2026 |
Price 6/26/2026 |
w/w change |
YTD change |
P/E |
|
American Express |
372.7 |
338.0 |
340.4 |
0.7% |
(8.7%) |
27.6x |
|
Visa |
346.5 |
327.2 |
336.2 |
2.7% |
(3.0%) |
17.0x |
|
Mastercard |
563.1 |
489.8 |
499.0 |
1.9% |
(11.4%) |
31.0x |
|
Circle |
83.5 |
80.2 |
73.6 |
(8.3%) |
(11.9%) |
40.4x |
|
Block |
65.2 |
74.8 |
77.8 |
4.1% |
19.4% |
32.2x |
|
Paypal Holdings |
58.1 |
42.5 |
44.3 |
4.2% |
(23.8%) |
8.0x |
|
Average |
|
|
|
|
|
26.0x |
Source: Visa, AXP, Circle, Mastercard, Block and Paypal financials. NYSE
The stocks are currently trading at an average P/E multiple of 26.0x, indicating that investors are pricing in strong future earnings growth and are prepared to pay a substantial premium for current earnings. This also suggests that valuations may be stretched relative to near-term fundamentals.
We expect the global digital payments sector to continue evolving toward greater payment sovereignty, digital infrastructure modernization, and reduced reliance on traditional card-based payment networks as governments and financial institutions increasingly prioritize control over domestic payment ecosystems. Recent developments, particularly the European Central Bank’s progress toward launching the Digital Euro, signal a growing global shift toward central bank-backed digital payment infrastructure aimed at enhancing financial resilience, improving transaction efficiency, and strengthening monetary independence in an increasingly digital economy. This trend is likely to accelerate competition between public-sector digital currencies and established private payment networks such as Visa Inc. and Mastercard Incorporated, while driving broader innovation across digital finance infrastructure. However, despite these favorable long-term structural tailwinds, valuations within the sector remain relatively elevated, with the companies under coverage currently trading at an average P/E of 26.0x, suggesting that a significant portion of future growth expectations may already be priced in. As such, we expect near-term performance to remain sensitive to regulatory developments, execution risk, and the pace at which both incumbents and emerging digital payment infrastructure providers adapt to the rapidly changing payments landscape.
On 11th June 2026, the National Treasury presented Kenya’s FY’2026/2027 National Budget to the National Assembly highlighting that the total budget estimates for FY’2024/25 increased by 3.9% to Kshs 4.8 tn from the Kshs 4.6 tn in FY’2025/2026 revised estimates, while the total revenue inclusive of grants increased by 6.8% to Kshs 3.7 tn from the Kshs 3.4 tn in FY’2025/2026 revised estimates . The increase is mainly due to an 7.2% increase in ordinary revenue to Kshs 3.0 tn for FY’2026/2027, from the Kshs 2.9 tn in FY’2025/26 revised estimates.
The FY’2026/2027 budget focuses mainly on providing solutions to the heightened concerns on the high cost of living, the measures put in place to stimulate sustainable economic recovery as well as undertaking a growth-friendly fiscal consolidation to preserve the country’s debt sustainability. Notably, the government projects to narrow the fiscal deficit to 5.5% of GDP in FY’2026/27, from the estimate of 6.4% of GDP in FY’2025/26 revised estimates. As such, this week, we shall discuss the recently released budget and the Finance Act 2026 with a key focus on Kenya’s fiscal components. We shall do this in four sections, namely:
- FY’2025/2026 Budget Outturn as at May 2026,
- Comparison between FY'2026/2027 and FY'2025/2026 Budget estimates,
- Analysis and House-view on Key Aspects of the 2025 Budget,
- Finance Act 2026, and,
- Conclusion and Our View.
Section I: FY’2025/2026 Budget Outturn as at May 2026
The National Treasury gazetted the revenue and net expenditures for the eleventh month of FY’2025/2026, ending 29th May 2026, highlighting that the total revenue collected as at the end of May 2026 amounted to Kshs 2,324.8 bn, equivalent to 83.5% of the revised estimates of Kshs 2,784.4 bn for FY’2025/2026 and is 91.1% of the prorated estimates of Kshs 2,552.4 bn. Below is a summary of the performance:
|
Cytonn Report: FY'2025/2026 Budget Outturn - As at 29th May 2026 |
||||||
|
Amounts in Kshs billions unless stated otherwise |
||||||
|
Item |
12-months Original Estimates |
Revised Estimates |
Actual Receipts/Release |
Percentage Achieved |
Prorated |
% achieved of the Prorated |
|
Opening Balance |
6.4 |
|||||
|
Tax Revenue |
2,627.1 |
2,600.8 |
2,174.5 |
83.6% |
2,384.0 |
91.2% |
|
Non-Tax Revenue |
127.6 |
183.6 |
143.9 |
78.3% |
168.3 |
85.5% |
|
Total Revenue |
2,754.7 |
2,784.4 |
2,324.8 |
83.5% |
2,552.4 |
91.1% |
|
External Loans & Grants |
569.8 |
824.9 |
569.6 |
69.1% |
756.1 |
75.3% |
|
Domestic Borrowings |
1,098.3 |
1,539.1 |
1,179.3 |
76.6% |
1,410.8 |
83.6% |
|
Other Domestic Financing |
10.8 |
10.8 |
8.7 |
80.4% |
9.9 |
87.7% |
|
Total Financing |
1,678.9 |
2,374.8 |
1,757.5 |
74.0% |
2,176.9 |
80.7% |
|
Recurrent Exchequer issues |
1,470.4 |
1,676.6 |
1,457.4 |
86.9% |
1,536.9 |
94.8% |
|
CFS Exchequer Issues |
2,141.0 |
2,584.6 |
1,873.0 |
72.5% |
2,369.2 |
79.1% |
|
Development Expenditure & Net Lending |
407.1 |
483.0 |
383.5 |
79.4% |
442.7 |
86.6% |
|
County Governments + Contingencies |
415.0 |
415.0 |
346.5 |
83.5% |
380.4 |
91.1% |
|
Total Expenditure |
4,433.6 |
5,159.2 |
4,060.4 |
91.6% |
4,729.2 |
85.9% |
|
Fiscal Deficit excluding Grants |
1,678.9 |
2,374.8 |
1,735.7 |
73.1% |
2,176.9 |
79.7% |
|
Total Borrowing |
1,668.1 |
2,364.0 |
1,748.8 |
74.0% |
2,167.0 |
80.7% |
The key take-outs from the release include;
- Total revenue collected as at the end of May 2026 amounted to Kshs 2,324.8 bn, equivalent to 83.5% of the revised estimates of Kshs 2,784.4 bn for FY’2025/2026 and is 91.1% of the prorated estimates of Kshs 2,552.4 bn. Cumulatively, tax revenues amounted to Kshs 2,174.5 bn, equivalent to 83.6% of the revised estimates of Kshs 2,600.8 bn and 91.2% of the prorated estimates of Kshs 2,384.0 bn,
- Total financing amounted to Kshs 1,757.5 bn, equivalent to 74.0% of the revised estimates of Kshs 2,374.8 bn and is equivalent to 80.7% of the prorated estimates of Kshs 2,176.9 bn. Additionally, domestic borrowing amounted to Kshs 1,179.3 bn, equivalent to 76.6% of the revised estimates of Kshs 1,539.1 bn and is 83.6% of the prorated estimates of Kshs 1,410.8 bn.
- The total expenditure amounted to Kshs 4,060.4 bn, equivalent to 91.6% of the revised estimates of Kshs 5,159.2 bn, and is 85.9% of the prorated target expenditure estimates of Kshs 4,729.2 bn. Additionally, the net disbursements to recurrent expenditures came in at Kshs 1,457.4 bn, equivalent to 86.9% of the revised estimates of Kshs 1,676.6 and are equivalent to 94.8% of the prorated estimates of Kshs 1,536.9 bn,
- Consolidated Fund Services (CFS) Exchequer issues came in at Kshs 1,873.0 bn, equivalent to 72.5% of the revised estimates of Kshs 2,584.6 bn, and are 72.5% of the prorated amount of Kshs 2,369.2 bn. The cumulative public debt servicing cost amounted to Kshs 1,707.5 bn which is 72.8% of the revised estimates of Kshs 2,344.6 bn and is 79.4% of the prorated estimates of Kshs 2,149.2 bn. Additionally, the Kshs 1,707.5 bn debt servicing cost is equivalent to 73.4% of the actual cumulative revenues collected as at the end of May 2026.
- Total borrowings as at the end of May 2026 amounted to Kshs 1,748.8 bn, equivalent to 74.0% of the revised estimates of Kshs 2,364.0 bn for FY’2025/2026 and are 80.7% of the prorated estimates of Kshs 2,167.0 bn. The cumulative domestic borrowing of Kshs 1,539.1 bn comprises of Net Domestic Borrowing Kshs 994.8 bn and Internal Debt Redemptions (Rollovers) Kshs 544.3 bn. Additionally the debt service-to-revenue ratio stood at 73.4% in May 2026, representing an increase of 1.3% points from 72.1% recorded at the end of April 2026, highlighting the continued pressure of debt servicing obligations on government finances.
The government underachieved its prorated revenue targets as at the eleventh month of the FY’2025/2026, achieving 91.1% of the prorated revenue targets in May 2026, higher than 90.7% achieved in April 2026. This was driven by shortfall in tax revenues and non-tax revenues, which stood at 91.2% and 85.5% of prorated levels respectively, with collections amounting to Kshs 2,174.5 bn in tax revenue and Kshs 143.9 bn in non-tax revenue. External loans and grants were behind target at 69.1%, increasing reliance on domestic borrowing, which came in at 75.3% of the prorated target of Kshs 1,282.6 bn. The business environment, additionally, showed signs of deterioration, with the Purchasing Managers’ Index (PMI) standing at 46.6 in May 2026 from 49.4 in April 2026, remaining below the 50.0 neutral mark and signaling a contraction of business activity. Expenditure absorption stood at 85.9% of prorated levels, with development spending still lagging at 86.6%, reflecting slow implementation of capital projects. Future revenue performance will depend on how quickly private sector activity strengthens and the continued efforts to broaden the tax base. However, the outlook remains vulnerable to external shocks, particularly the ongoing Iran-Israel conflict, which has heightened global oil price volatility and supply chain disruptions, posing upside risks to inflation and production costs, and potentially constraining private sector expansion and revenue mobilization.
Section II: Comparison between FY’2025/2026 and FY’2026/2027 Budgets estimates
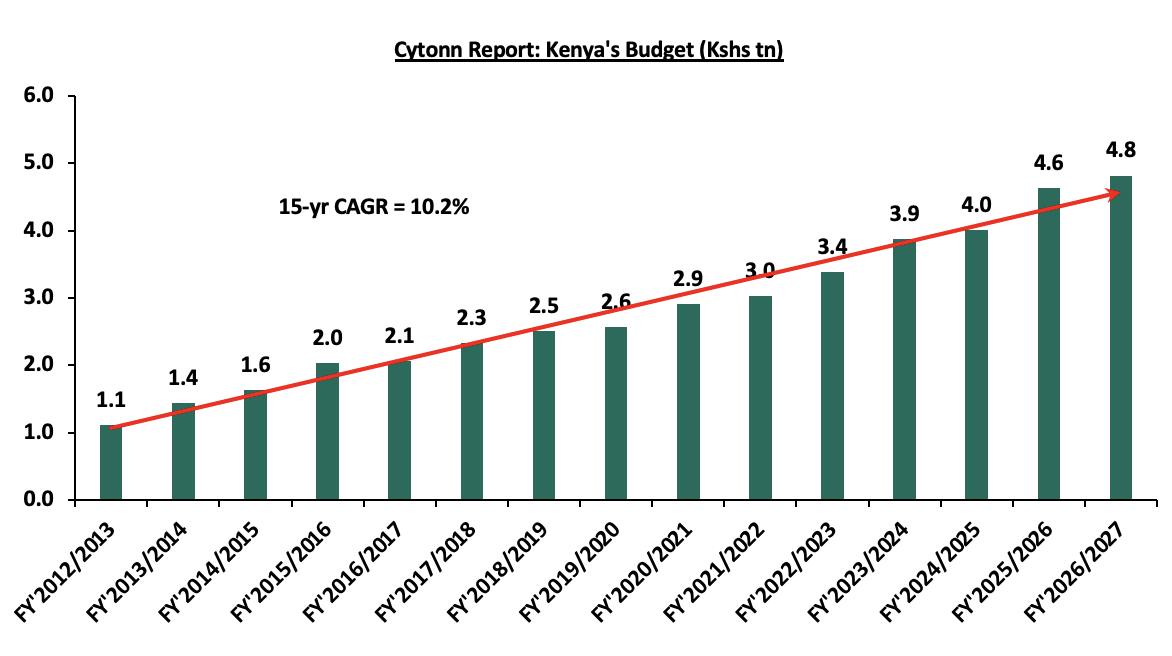
The Kenyan Government budget has been growing over the years on the back of increasing recurrent and development expenditures. The chart below shows the evolution of the government budget over a fifteen-year period:
Source: National Treasury of Kenya
For the FY’2026/2027, the budget is projected to increase by 3.9% to Kshs 4.8 tn, from Kshs 4.6 tn in FY’2025/2026 revised estimates. The expenditure will be funded by revenue collections and grants of Kshs 3.7 tn and borrowings amounting to Kshs 1.1 tn. The table below summarizes the key buckets and the projected changes:
|
Amounts in Kshs billions unless stated otherwise |
|||
|
Cytonn Report: Comparison between FY’2025/2026 and FY’2025/2026 Budgets Estimates |
|||
|
Item |
FY'2025/26 Revised Estimates |
FY'2026/27 Estimates |
Change y/y |
|
Ordinary Revenue |
2,784.4 |
2,985.7 |
7.2% |
|
Ministerial Appropriation-in-Aid |
619.8 |
644.8 |
4.0% |
|
Total grants |
34.8 |
43.6 |
25.3% |
|
Total Revenue & Grants |
3,439.0 |
3,674.1 |
6.8% |
|
National Government expenditure |
2,837.0 |
2,081.1 |
(26.6%) |
|
Consolidated Funds Services (CFS) |
1,366.6 |
1,501.3 |
9.9% |
|
Development expenditure |
831.1 |
809.0 |
(2.7%) |
|
County Transfer(Equitable share) & Contingencies |
415.0 |
429.0 |
3.4% |
|
Total expenditure |
4,638.4 |
4,820.4 |
3.9% |
|
Fiscal deficit inclusive of grants |
(1199.4) |
(1146.3) |
(4.4%) |
|
Projected Deficit as % of GDP |
(6.4%) |
(5.5%) |
(0.3%) pts |
|
Net foreign borrowing |
225.8 |
116.2 |
(48.5%) |
|
Net domestic borrowing |
973.6 |
1030.1 |
5.8% |
|
Total borrowing |
1199.4 |
1146.3 |
(4.4%) |
Source: National Treasury of Kenya, www.parliament.go.ke
Some of the key take-outs include;
- The government projects total revenue inclusive of grants for FY’2026/27 to increase by 6.8% to Kshs 3.7 tn (equivalent to 17.6% of GDP), from the Kshs 3.4 tn in FY’2025/2026 revised estimates (equivalent to 18.4% of GDP). The increase is mainly due to a 7.2% increase in ordinary revenue to Kshs 3.0 tn (equivalent to 14.3% of GDP) for FY’2026/2027, from the Kshs 2.8 tn in FY’2025/26 revised estimates (equivalent to 14.9% of GDP),
- Total expenditure is set to increase by 3.9% to Kshs 4.8 tn (equivalent to 23.2% of GDP), from Kshs 4.6 tn (equivalent to 24.9% of GDP) in the FY’2025/26 revised Budget estimates,
- National government expenditure is set to decrease by 26.6% to Kshs 2.1 tn (equivalent to 16.2% of GDP), in FY’2025/2026, from Kshs 2.8 tn in the FY’2025/2026 revised budget estimates. Consolidated Funds Services expenditure is set to increase by 9.9% to Kshs 1.5 tn in FY’2026/2027, from Kshs 1.3 tn in the FY’2025/2026 revised budget estimates. Also, Development expenditure is set to decrease by 2.7% to Kshs 809.0 bn, from Kshs 831.1 bn in the FY’2025/2026 revised budget estimates,
- Although the fiscal deficit is projected to decline by 4.4% to Kshs 1,146.3 bn in FY’2026/2027 from Kshs 1,199.4 bn in FY’2025/2026, the government remains heavily reliant on borrowing to finance its expenditure plans. With the total deficit expected be financed through domestic debt totaling Kshs 1,030.1 bn and foreign debts totaling Kshs 116.2 bn. Notably, Kenya’s public debt burden which stood at 2% of GDP as of March 2026, surpassing the 55.0% recommended threshold by 15.2% points, continues to exert pressure on fiscal sustainability and increase the risk of debt distress in the country, and,
- The budget deficit is projected to decline by 0.3% points to 5.5% of GDP, from the 6.4% of GDP in the FY’2025/2026 budget, mainly as growth in revenues outpace growth in expenditure.
Section III: Analysis and House-view on Key Aspects of the FY’2026/2027 Budget
- Revenue
Revenue is projected to increase by 6.8% to Kshs 3.6 tn in FY’2025/26, from Kshs 3.4 tn in the FY’2025/26 supplementary budget. The increased revenue projections in the FY’2026/27 are mainly attributable to the projected 7.2% growth in ordinary revenue to Kshs 3.0 tn in FY’2026/27, from Kshs 2.8 tn in the FY’2025/26 budget. The main sources of revenue will be:
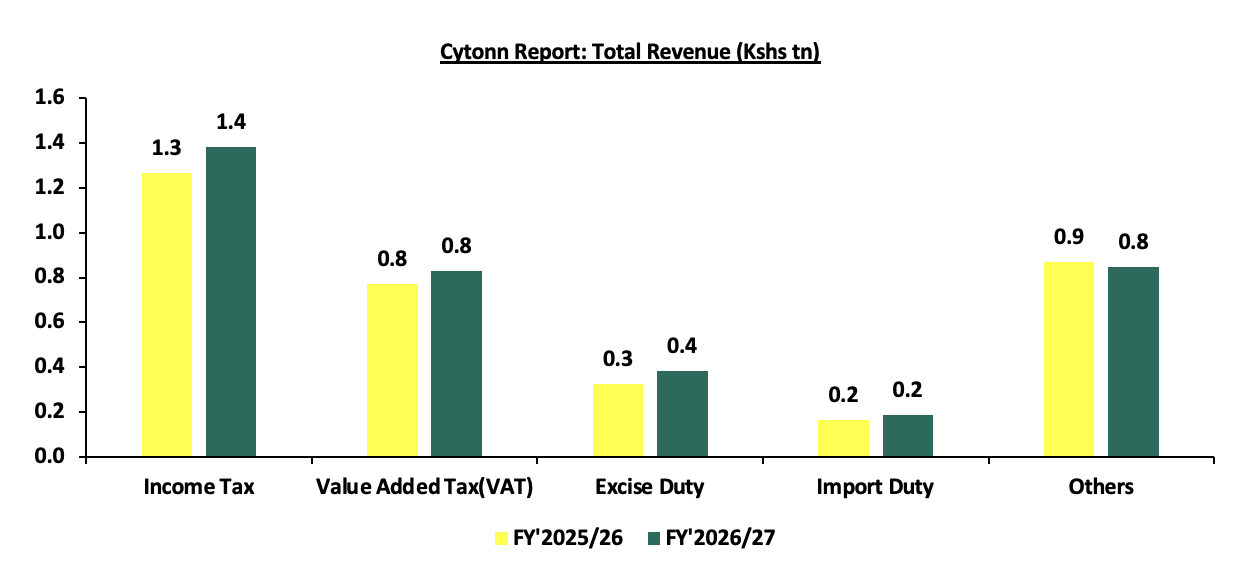
- Income Tax, which remains the highest contributor to government revenue, contributing 38.1% of the total revenue projections of Kshs 3.6 tn, is expected to increase by 9.2% to Kshs 1.4 tn in FY’2026/27, from Kshs 1.3 tn in FY’2025/2026,
- Value Added Tax (VAT) contributing 22.8% of the projected total revenue is projected to increase by 7.5% to Kshs 829.2 bn in FY’2026/27 budget, from Kshs 771.7 bn in the FY’2025/26 budget,
- Excise Duty contributing 10.6% to the projected revenues for the FY’2026/27 is expected to increase by 18.1% to Kshs 383.4 bn, from Kshs 324.6 bn in FY’2025/26 supplementary budget estimates, and,
- Import Duty contributing 5.1% to the projected revenues for the FY’2026/27 is expected to increase by 11.5% to Kshs 186.2 bn, from Kshs 167.0 bn in FY’2025/26 supplementary budget estimates.
The chart below compares ordinary revenue projections for FY’2026/27 and FY’2025/26:
Source: National Treasury
The government relies on the effectiveness of the Kenya Revenue Authority (KRA) in collecting taxes, as well as enhancements to existing tax measures, to meet its revenue targets. This strategy has seemingly resulted in improved revenue collection, as evidenced by the attainment of 97.4% of the revenue target in FY'2024/25 and 91.1% of the prorated revenue target for FY'2025/26 as of May 2026. To support the FY'2026/27 revenue target of Kshs 3.6 tn, the government intends to enhance domestic resource mobilization through the continued implementation of the National Tax Policy and the Medium-Term Revenue Strategy. Key measures include broadening the tax base, deepening tax administration reforms through technology, strengthening customs valuation, sealing revenue leakages, and enhancing the collection of non-tax revenues from government agencies. These initiatives are expected to improve tax compliance, increase efficiency in revenue administration, and reduce reliance on external financing.
However, despite these efforts, the government has historically struggled to consistently meet its revenue collection targets, resulting in persistent fiscal deficits and increased borrowing requirements. As such, concerns remain regarding the government's ability to achieve its FY'2026/27 revenue target, particularly against the backdrop of a challenging operating environment characterized by elevated living costs, with inflation standing at 6.7% in May 2026. Additionally, the ambitious revenue growth assumptions, coupled with potential tax compliance challenges and slower than expected economic activity, could weigh on revenue performance. External risks also remain elevated, with the recent Iran-Israel-USA conflict underscoring the susceptibility of global supply chains and energy markets to geopolitical shocks. While the ceasefire agreement has helped alleviate immediate concerns over supply disruptions and escalating oil prices, geopolitical tensions in the region remain elevated, leaving global markets vulnerable to renewed uncertainty. As such, any resurgence in hostilities could trigger higher global oil prices, heighten inflationary pressures, increase production and transportation costs, dampen consumer spending and economic activity, and ultimately constrain revenue collection, increasing the likelihood of additional borrowing to finance government expenditure. The chart below shows the ordinary revenue performance in the previous fiscal years:
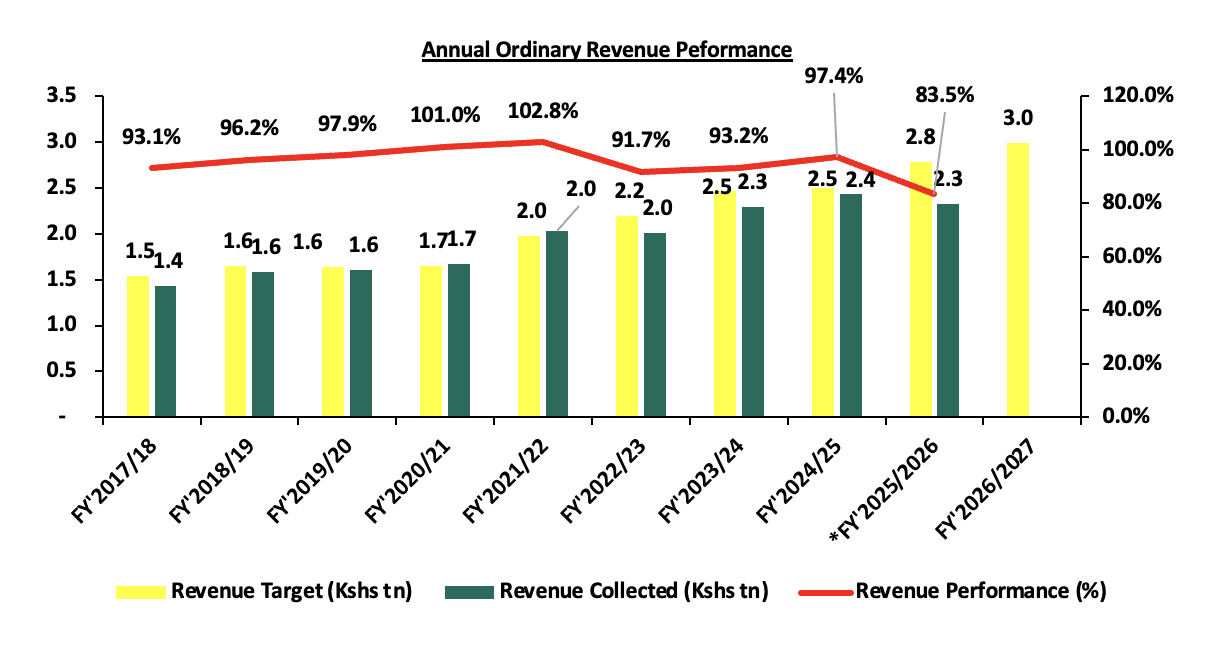
Source: National Treasury of Kenya and Kenya Revenue Authority
*Total Revenue collection as of 31 May 2026
- Expenditure
Expenditure is expected to increase by 3.9% to Kshs 4.8 tn, from Kshs 4.6 tn in the FY’2025/26 revised budget with recurrent expenditure taking up 74.0% of the total expenditure for FY’2026/2027, in comparison to the 73.0% in FY’2025/2026. The chart below shows the comparison between the recurrent expenditure allocations and development expenditure allocations over the past five fiscal years:
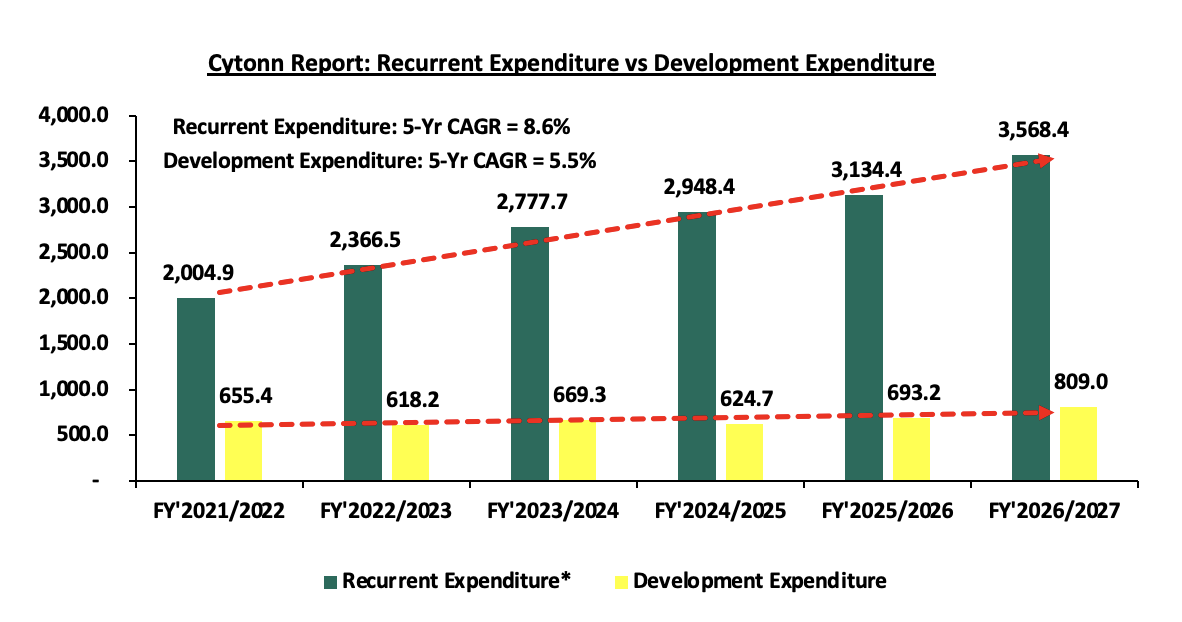
Source: National Treasury of Kenya
*Recurrent Expenditure includes the Consolidated Fund Services (CFS) Expenditure
Some of the key take-outs include;
- Recurrent expenditure takes the largest proportion of government expenditure over the last five fiscal years growing at a 5-year CAGR of 8.6% to Kshs 3,568.4 bn in FY’2026/27, from Kshs 2,366.5 bn in FY’2022/2023. For the FY’2026/2027, the recurrent expenditure is estimated to increase by 13.8% to Kshs 3,568.4 bn, from Kshs 3,134.4 bn in FY’2025/2026 mainly due to a 9.9% increase in Consolidated Fund Services (CFS) expenditure to Kshs 1,501.3 bn from Kshs 1,366.6 bn in FY’2025/2026 revised estimates. The increase can be mainly attributed to the increased debt servicing cost which represented 91.2% of the CFS expenditure in FY’2025/2026 as of 30th May 2026. We expect the debt servicing cost to continue increasing as the government is expected to borrow more to close the revenue gap, and,
- Development expenditure on the other hand continues to lag behind contributing only 16.8% of the FY’2026/27 expenditure estimates. Allocation to infrastructure remains the highest taking 75.7% of the development expenditure. In the FY’2026/2027, infrastructure expenditure is set to decrease marginally by 0.8% to Kshs 531.3 bn, from Kshs 535.3 bn estimate in FY’2025/2026 in line with the government’s agenda of increasing the development of critical infrastructure in the road, rail, sea, and airport sectors in order to open many areas to economic activities and spur growth in cross border trade and regional integration. The table below shows the sectors with the highest expenditure allocation over the last five fiscal years:
|
Amounts in Kshs billions unless stated otherwise |
||||||||
|
Cytonn Report: Kenya Budget Highest Expenditure Allocations |
||||||||
|
Item |
FY'2022/2023 |
FY'2023/2024 |
FY'2024/2025 |
FY'2025/2026 |
FY'2026/2027 |
Change (FY2026/27 and FY2025/26) |
5-year CAGR |
|
|
Interest Payments, Pensions & Net Lending |
867.8 |
1057.7 |
1242.7 |
1337.0 |
1501.3 |
12.3% |
11.6% |
|
|
Education |
544.4 |
628.6 |
656.6 |
659.8 |
784.5 |
18.9% |
7.6% |
|
|
Infrastructure |
416.4 |
468.2 |
477.2 |
535.6 |
531.3 |
(0.8%) |
5.0% |
|
|
County Shareable Revenue |
399.6 |
423.9 |
445.6 |
474.9 |
502.0 |
5.7% |
4.7% |
|
|
Public Admin & Int. Relations |
342.2 |
327.0 |
322.4 |
335.4 |
373.7 |
11.4% |
1.8% |
|
|
Total |
2570.4 |
2905.4 |
3144.5 |
3342.7 |
3692.8 |
10.5% |
7.5% |
|
Source: The Mwananchi Guide for the FY’2026/27, National Treasury of Kenya
Notably, the allocation to interest payment, pension and net lending increased by 12.3% to Kshs 1,501.3 bn in FY’2026/27 from Kshs 1,337.0 bn in FY’2025/26, partly attributable to high cost of servicing debt.
- Borrowing
The total borrowing for the FY’2026/27 is set to decrease by 4.4% to Kshs 1,146.3 bn, from Kshs 1,199.4 bn, in FY’2025/26 revised budget estimates. The public debt mix is projected to comprise of 10.1% foreign debt and 89.9% domestic debt, from 18.8% foreign financing and 81.2% domestic financing as per the FY’2025/26 revised Budget estimates. The rise in debt servicing expenses can be partly attributed to the government’s high affinity for debt to finance the wide budget deficits, partly fueled by the ballooning recurrent expenditure and debt costs. As the government works towards maintaining sustainable debt levels, it will be crucial to implement debt management reforms, prioritize concessional borrowing, and develop the domestic debt market to lower borrowing costs further. Additionally, the government will explore innovative financing options such as debt swaps, diaspora bonds, and sustainability-linked instruments to diversify funding sources, and support fiscal consolidation. The chart below shows the evolution of public borrowing to fill the fiscal deficit gap over the last five years:
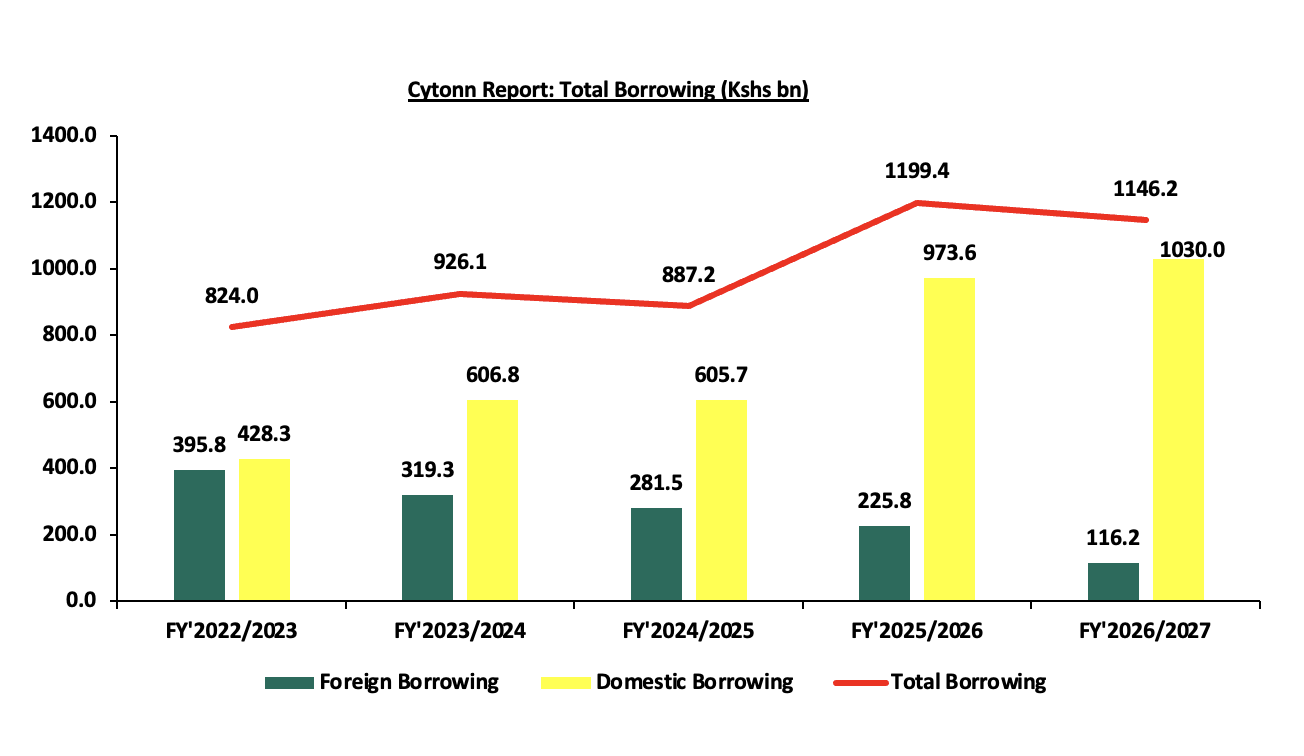
The key take-outs from the chart include:
- The proportion of domestic financing is estimated to rise to 89.9% in FY’2026/27 from 81.2% in FY’2025/26. While this may heighten the risk of crowding out the private sector given banks' preference for lending to the government due to lower perceived risk, it is worth noting that yields on government securities had generally been on a downward trajectory following the Central Bank of Kenya's monetary policy easing cycle. However, yields have recently begun to edge upwards, with the average yield on the 91-day Treasury Bill increasing to 8.6% in June 2026 from 8.2% in June 2025, partly reflecting rising inflationary pressures and the Monetary Policy Committee's decision to maintain the Central Bank Rate at 8.75%, signalling a pause in the easing cycle. If sustained, the increase in yields could raise borrowing costs and exert pressure on private sector access to credit, and,
- The total borrowing is expected to decrease by 4.4% to Kshs 1,146.2 bn, from Kshs 1,199.4 bn in FY’2025/26 revised estimates, reflecting the dependence on debt to finance the fiscal deficit. This underscores the need for sustained fiscal consolidation efforts, including enhanced revenue mobilization and prudent expenditure management, to reduce long-term debt dependence and ensure fiscal sustainability.
We therefore note the persistent fiscal deficit is mainly on the back of low revenue collection and high expenditure. As such, the government needs to minimize spending through the implementation of structural reforms and the reduction of amounts extended to recurrent expenditure. This would allow the government to refinance other critical sectors, such as agriculture, resulting in increased revenue.
Section IV: Finance Act 2026
On 18th June 2026, the Kenyan Parliament approved the Finance Bill 2026. On 23rd June 2026 the president assented the bill into law (Finance Act 2026), with its provisions set to take effect from 1st July 2026. Rather than introducing aggressive tax hikes, the Finance Act focuses on plugging revenue leakages. The raft of tax changes in the Finance Act 2026 are geared towards expanding the tax base and increasing revenues through sealing revenue leakages to meet the government’s budget for the fiscal year 2026/2027 of Kshs 4.8 tn, as well as reduce the budget deficit and borrowing.
Against this backdrop of fiscal consolidation and cautious borrowing, the Finance Act 2026 introduces a series of targeted measures that aim to broaden the tax base, seal revenue leakages, and support the government’s drive toward a more sustainable fiscal framework. Below we highlight some of the key tax changes, effective from 1st July 2026 contained in the Finance Act 2026 and the implications:
a) Under the Income Tax Act, the Act provides:
- A tax amnesty on penalties and interest for tax liabilities relating to periods up to 31st December 2025, provided the principal tax is paid by 31st December 2026. This is expected to encourage settlement of outstanding tax obligations, improve voluntary compliance, and enhance revenue collection without increasing tax rates.
- A 1.5% withholding tax on the sale of scrap metal, expanding the tax net into sectors perceived to have historically low compliance levels while improving traceability of transactions within the scrap metal value chain.
- A withholding tax on interchange fees and merchant service fees arising from card payment transactions. This effectively brings Visa, Mastercard, and other card-processing related payments into the withholding tax framework, broadening the tax base within the financial services ecosystem.
- A 20.0% withholding tax on winnings from gambling activities, enhancing taxation within the betting sector and increasing revenue collection from gaming-related transactions.
- Clariification the definition of immovable property by separating land-related interests from mining and petroleum rights, reducing ambiguity in tax interpretation and strengthening legal clarity in taxation of extractive and property-related transactions.
- Expansion the scope of withholding tax to selected digital and platform-based transactions, enhancing monitoring and taxation of the digital economy while increasing compliance obligations for digital service providers.
- Introduction of measures aimed at strengthening enforcement of tax compliance among informal sector participants and hard-to-tax sectors, supporting the government’s broader revenue mobilization agenda.
b) Under the Excise Duty Act, the Act provides:
- A 50.0% excise duty on antique and vintage motor vehicles that are at least thirty years old. This proposal is expected to target luxury and collector assets, significantly raising the cost of acquiring and importing historic automobiles into the country, while also expanding government revenue collection from high-net-worth hobbyists and the luxury automotive sector.
- A detailed definition of “amount deposited” for purposes of betting and gambling excise duty to include money, cash equivalents, tokens, credits, and similar instruments used in gambling transactions. This broadens the excise duty base by capturing alternative forms of value used in betting and gaming platforms, reducing loopholes within digital gambling ecosystems.
- Introduction of definitions for “virtual asset” and “virtual asset service provider” by linking them to the Virtual Asset Service Providers Act, 2025. This aligns the Excise Duty Act with the emerging digital asset regulatory framework and strengthens the government’s ability to tax virtual asset-related transactions.
- Extend excise duty exemptions to goods imported or acquired for official use by the National Intelligence Service (NIS), including machinery, equipment, supplies, and motor vehicles. This lowers procurement costs for strategic national security operations.
- Introduce excise duty measures targeting selected digital and technology-related transactions, reflecting the government’s continued shift toward taxation of emerging digital economic activities.
c) Under the Value Added Tax (VAT) Act, the Act provides:
- Exemption of scrap metal from VAT, reducing input costs for recyclers and manufacturers dependent on recycled raw materials while potentially formalizing activity within the recycling sector.
- Exemptions of inputs and raw materials used in the manufacture of animal feeds and pharmaceutical products from VAT, lowering production costs for manufacturers and potentially supporting affordability within the agriculture and healthcare sectors.
- Exemption of dialyzers used in kidney treatment from VAT, reducing treatment costs for dialysis patients and improving affordability of renal healthcare services.
- Exemption of goods and services used in public-private partnership infrastructure projects from VAT subject to approval by the Cabinet Secretary, lowering project costs and potentially encouraging private sector participation in infrastructure development.
- Introduction of VAT on selected digital and platform-based financial services, broadening taxation within the digital economy and increasing the tax burden on fintech and platform-based financial service providers.
- VAT relief on selected renewable energy and electric mobility products including electric buses and bicycles, supporting the government’s transition toward green mobility and clean energy adoption.
- Expands VAT administration and compliance measures aimed at strengthening revenue collection efficiency and reducing tax leakages within the VAT framework.
d) Under the Tax Procedures Act, the Act provides:
- Reduction the income tax return filing period from six months to four months ( 30th April) for individuals while requiring corporations to file returns by 30th June accelerates compliance timelines and enhances the Kenya Revenue Authority’s ability to reconcile taxes earlier; however, this shift may increase compliance pressure for businesses managing complex reporting structures under tighter deadlines.
- A tax amnesty programme on penalties and interest for liabilities accrued up to 31st December 2025, provided principal taxes are settled by 31st December 2026. This is expected to improve voluntary compliance, encourage settlement of historical tax liabilities, and support short-term revenue collection.
- Introduction of a requirement for Virtual Asset Service Providers (VASPs) to file an annual information return with the Commissioner in respect of all virtual asset transactions involving reportable users or those with controlling persons. The information return applies where a VASP provides exchange transaction services or makes available a trading platform on behalf of a customer, including where it acts as a counterparty or intermediary. The Act further empowers the Government to enter into agreements with other countries for the automatic exchange of information relating to virtual asset transactions, strengthening cross-border tax transparency and increasing compliance obligations for digital asset businesses operating in or from Kenya
e) Key Proposals Dropped or Amended During Parliamentary Deliberations
During the legislative process, several provisions contained in the Finance Bill, 2026 faced significant opposition from Members of Parliament and stakeholders, resulting in their rejection or amendment before the Bill was enacted into law. Key proposals that were dropped include:
- The proposed increase in the Residential Rental Income Tax rate from 7.5% to 10.0% was withdrawn. The proposal would have reversed a reduction introduced under the Finance Act, 2023, which lowered the rate from 10.0% to 7.5% to encourage compliance among residential landlords. Legislators opposed the proposal on the grounds that it would increase the tax burden on landlords without addressing the compliance challenges that necessitated the earlier reduction.
- The proposed introduction of a 25.0% excise duty on all mobile phones activated in Kenya, whether imported or locally manufactured, was removed. While the National Treasury argued that the measure would simplify taxation by replacing multiple levies with a single consolidated charge, Parliament found the activation-based collection mechanism impractical and likely to create compliance challenges, implementation delays, and uncertainty for consumers.
- The proposal to empower the Kenya Revenue Authority (KRA) to issue agency notices despite ongoing tax disputes, objections, or court proceedings was rejected. Legislators argued that the measure would undermine taxpayers' rights to fair administrative action and could adversely affect business cash flows and operations.
- The proposal to calculate timelines for filing tax objections and appeals using calendar days instead of working days was also dropped. Parliament maintained that including weekends and public holidays in statutory timelines would significantly reduce the effective period available to taxpayers to comply with procedural requirements.
- The proposed introduction of a deemed dividend tax requiring companies to distribute at least 60.0% of undistributed income as dividends was rejected following strong opposition from the private sector. Stakeholders argued that the measure would limit the ability of businesses to retain earnings for reinvestment, expansion, and working capital needs, potentially constraining private sector growth and investment.
The Finance Act 2026 reflects the government’s continued preference for administrative revenue mobilization and compliance enhancement as opposed to politically sensitive broad-based tax increases. The proposals place significant emphasis on expanding withholding tax coverage, tightening filing and enforcement timelines, enhancing taxation of digital and informal sector transactions, and improving the efficiency of tax collection within the existing framework. This approach is likely informed by the need to sustain fiscal consolidation efforts while minimizing the political and economic disruption associated with aggressive tax hikes.
The Act comes at a time when the government seeks to strengthen domestic revenue mobilization amid elevated debt servicing obligations and constrained fiscal space. While inflation currently at 6.7% as of May 2026 well within the CBK’s target range of 2.5%-7.5%, inflationary pressures still remain, particularly from the potential pass-through effects of new tax measures, exchange rate movements, geopolitical tensions and food and energy price volatility. At the same time, the Central Bank of Kenya's decision to maintain the Central Bank Rate (CBR) at 8.75% in June 2026 is expected to sustain favorable credit conditions, support private sector activity, and underpin economic growth. As such, the effectiveness of the Finance Act, 2026 will depend not only on the successful implementation of its revenue measures and improved taxpayer compliance, but also on prudent expenditure management and fiscal discipline. Going forward, achieving a sustainable fiscal position will require a balanced approach that enhances revenue collection, contains expenditure growth, supports economic activity, and preserves macroeconomic stability.
Section V: Conclusion and Our View
The Kenyan economy has continued to remain resilient despite recording a slowdown in growth to 4.6% in FY’2025 compared to a growth of 4.7% recorded in FY’2024. We expect the economic activity to remain resilient given the improved business environment as result of the declining cost of credit providing some relief to businesses and households. Additionally, the Central Bank of Kenya's Monetary Policy Committee (MPC) maintained the Central Bank Rate (CBR) at 8.75% during its meeting on 10th June 2026, the same level maintained in April 2026, in a bid to support economic growth while sustaining price and exchange rate stability. The accommodative monetary policy stance is expected to support credit growth and sustain lower borrowing costs, hence encouraging borrowing, which will in turn lead to increased investment spending in the economy by both individuals and businesses. Moreover, the economy is expected to record a growth rate of 4.7% in 2026, mainly supported by private sector growth, continued strong growth of the financial services sector, and recoveries in the agricultural sector. Furthermore, in the FY’2026/2027 budget, the government has allocated Kshs 18.0 bn for the fertilizer subsidy program aimed at lowering the cost of farm input and enhancing food supply in the country.
The government has sustained its appetite for debt, projecting to borrow Kshs 1,146.2 bn in total debt in the FY’2026/27, albeit a 4.4% marginal decrease from 1,199.4 bn in the FY’2025/26. The move is expected to increase the cost of debt servicing, given that both foreign and domestic debt has been ballooning as a result of wide budget deficits. Additionally, with the government's continued inclination towards domestic borrowing, by projecting to increase its domestic borrowing by 5.8% to Kshs 1030.1 bn in FY’2026/27, from Kshs 973.6 bn in FY’2025/26, remains a risk to private sector credit growth, with increased competition by the government in the absence of alternative borrowing.
Overall, we are of the view that the main driver of the growing public debt is the fiscal deficit occasioned by expenditures consistently outpacing revenues. As a result, implementing robust fiscal consolidation would help the government bridge the deficit gap and improve debt sustainability. This can be achieved through expenditure rationalization, implementation of structural reforms, and reducing the share of recurrent expenditure. Fiscal consolidation would also create fiscal space for increased investment in productive sectors such as agriculture, thereby supporting economic growth and enhancing revenue generation. However, the overall risk to the economy remains elevated, owing to the high debt servicing costs in the next fiscal year.
Disclaimer: The views expressed in this publication are those of the writers where particulars are not warranted. This publication, which is in compliance with Section 2 of the Capital Markets Authority Act Cap 485A, is meant for general information only and is not a warranty, representation, advice or solicitation of any nature. Readers are advised in all circumstances to seek the advice of a registered investment advisor.

- Talk to us
- Kenya
- P.O Box 20695 - 00200, Nairobi, Kenya
- Cell +254709101200
- Tel +254709101200
- WhatsApp +254741676635
- United States
- +254709101200
- DOWNLOAD OUR APP
-


- Kenya
- 8th Floor, Pinetree Plaza, Kaburu Drive, Ngong Road, Nairobi, Kenya
- USA
- Suite 1150, 1775 Eye Street NW, USA, Washington DC 20006, USA
- Investments
- High Yield
- Private Equity
- Real Estate
- Real Estate
- RiverRun Estates
- Cytonn Towers
- The Ridge
- Taraji Heights
- The Alma