Kenya’s FY'2023/2024 Budget Review, & Cytonn Weekly #25/2023
By Research, Jun 25, 2023
Executive Summary
Fixed Income
During the week, T-bills were undersubscribed for the second consecutive week, with the overall subscription rate coming in at 63.9% a decrease from the under-subscription rate of 94.2% recorded the previous week. Investor’s preference for the shorter 91-day paper persisted as they sought to avoid duration risk, with the paper receiving bids worth Kshs 11.0 bn against the offered Kshs 4.0 bn, translating to an oversubscription rate of 275.3%, albeit lower than the 454.9% recorded the previous week. The subscription rate for the 364-day paper increased to 23.4%, from 17.5% recorded the previous week. However, the subscription rate for the 182-day paper decreased to 19.9%, from 26.6% recorded the previous week. The government accepted all the bids of Kshs 15.3 bn. The yields on the government papers were on an upward trajectory, with the yields on the 364-day, 182-day and 91-day papers increasing by 20.0 bps, 21.4 bps and 14.5 bps to 11.9%, 11.9% and 11.8%, respectively;
In the primary bond market, the Central Bank of Kenya released the auction results for the third tap sale of FXD1/2023/03 with a tenor to maturity of 2.9 years, with the government seeking to raise Kshs 15.0 bn for budgetary support. In line with our expectations, the bond was oversubscribed, receiving bids worth Kshs 18.6 bn, against the offered Kshs 15.0 bn, translating to an oversubscription rate of 123.7%, partly attributable to investors’ preference for shorter-dated bonds as they seek to avoid duration risk. The government accepted all the Kshs 18.6 bn. The yield on the bond and coupon rate is at 14.2%;
Additionally, we are projecting the y/y inflation rate for June 2023 to come in at the range of 7.7%-8.1%, mainly on the back of the high fuel and food prices;
Equities
During the week, the equities market was on an upward trajectory with NASI, NSE 20 and NSE 25 gaining by 6.9%, 1.1% and 3.1% respectively, taking the YTD performance to losses of 15.8%, 5.5% and 13.4% for NASI, NSE 20 and NSE 25, respectively. The equities market performance was mainly driven by gains recorded by large-cap stocks such as Safaricom, Diamond Trust Bank (DTB-K), ABSA Bank, and BAT of 17.4%, 8.2%, 1.7% and 1.1 %, respectively. The gains were however weighed down by losses recorded by stocks such as Bamburi and EABL of 6.7% and 4.3%, respectively;
During the week, the Central Bank of Kenya (CBK) released the Quarterly Economic Review for the period ending 31 March 2023, highlighting that the banking sector remained stable and resilient during the period on the back of strong liquidity and capital adequacy;
Real Estate
During the week, the Central Bank of Kenya (CBK) released the Quarterly Economic Review Q1’2023 Report, highlighting that the year-on-year (y/y) gross loans advanced to the Real Estate sector increased by 4.6% to Kshs 481.0 bn in Q1’2023, from Kshs 460.0 bn in Q1’2022. Additionally, the Kenya National Bureau of Statistics (KNBS) released the Leading Economic Indicators (LEI) March 2023 Report which highlighted that overall international arrivals through Jomo Kenyatta International Airport (JKIA) and Moi International Airport (MIA) increased by 0.2% to 114,295 in February 2023, from the 114,048 recorded in January 2023;
In the industrial sector, Unilever East Africa (EA) opened its Kshs 500.0 mn new modern warehousing facility located in Nairobi, Kenya. In the Regulated Real Estate Funds, under the Real Estate Investment Trusts (REITs) segment, Fahari I-REIT closed the week trading at an average price of Kshs 6.24 per share in the Nairobi Securities Exchange, representing a 1.0% increase from Kshs 6.18 per share recorded the previous week. On the Unquoted Securities Platform as at 16 June 2023, Acorn D-REIT and I-REIT closed the week trading at Kshs 23.9 and Kshs 21.6 per unit, respectively, a 19.4% and 8.0% gain for the D-REIT and I-REIT, respectively, from the Kshs 20.0 inception price. In addition, Cytonn High Yield Fund (CHYF) closed the week with an annualized yield of 13.7%, remaining relatively unchanged from the previous week;
Focus of the Week
Following the release of Kenya’s FY’2023/204 National Budget, this week we analyze the fiscal components of the budget including revenue expectation, expenditure, and public debt. We shall also look at the key tax changes and the expected impacts of the proposed Finance Bill 2023;
Investment Updates:
- Weekly Rates:
- Cytonn Money Market Fund closed the week at a yield of 11.79%. To invest, dial *809# or download the Cytonn App from Google Playstore here or from the Appstore here;
- Cytonn High Yield Fund closed the week at a yield of 13.71% p.a. To invest, email us at sales@cytonn.com and to withdraw the interest, dial *809# or download the Cytonn App from Google Playstore here or from the Appstore here;
- We continue to offer Wealth Management Training every Wednesday, from 9:00 am to 11:00 am. The training aims to grow financial literacy among the general public. To register for any of our Wealth Management Trainings, click here;
- If interested in our Private Wealth Management Training for your employees or investment group, please get in touch with us through wmt@cytonn.com;
- Cytonn Insurance Agency acts as an intermediary for those looking to secure their assets and loved ones’ future through insurance namely; Motor, Medical, Life, Property, WIBA, Credit and Fire and Burglary insurance covers. For assistance, get in touch with us through insuranceagency@cytonn.com;
- Cytonn Asset Managers Limited (CAML) continues to offer pension products to meet the needs of both individual clients who want to save for their retirement during their working years and Institutional clients that want to contribute on behalf of their employees to help them build their retirement pot. To more about our pension schemes, kindly get in touch with us through pensions@cytonn.com;
Real Estate Updates:
- For more information on Cytonn’s real estate developments, email us at sales@cytonn.com;
- Phase 3 of The Alma is now ready for occupation and the show house is open daily. To join the waiting list to rent, please email properties@cytonn.com;
- For Third Party Real Estate Consultancy Services, email us at rdo@cytonn.com;
- For recent news about the group, see our news section here;
Hospitality Updates:
- We currently have promotions for Staycations. Visit cysuites.com/offers for details or email us at sales@cysuites.com;
Money Markets, T-Bills Primary Auction:
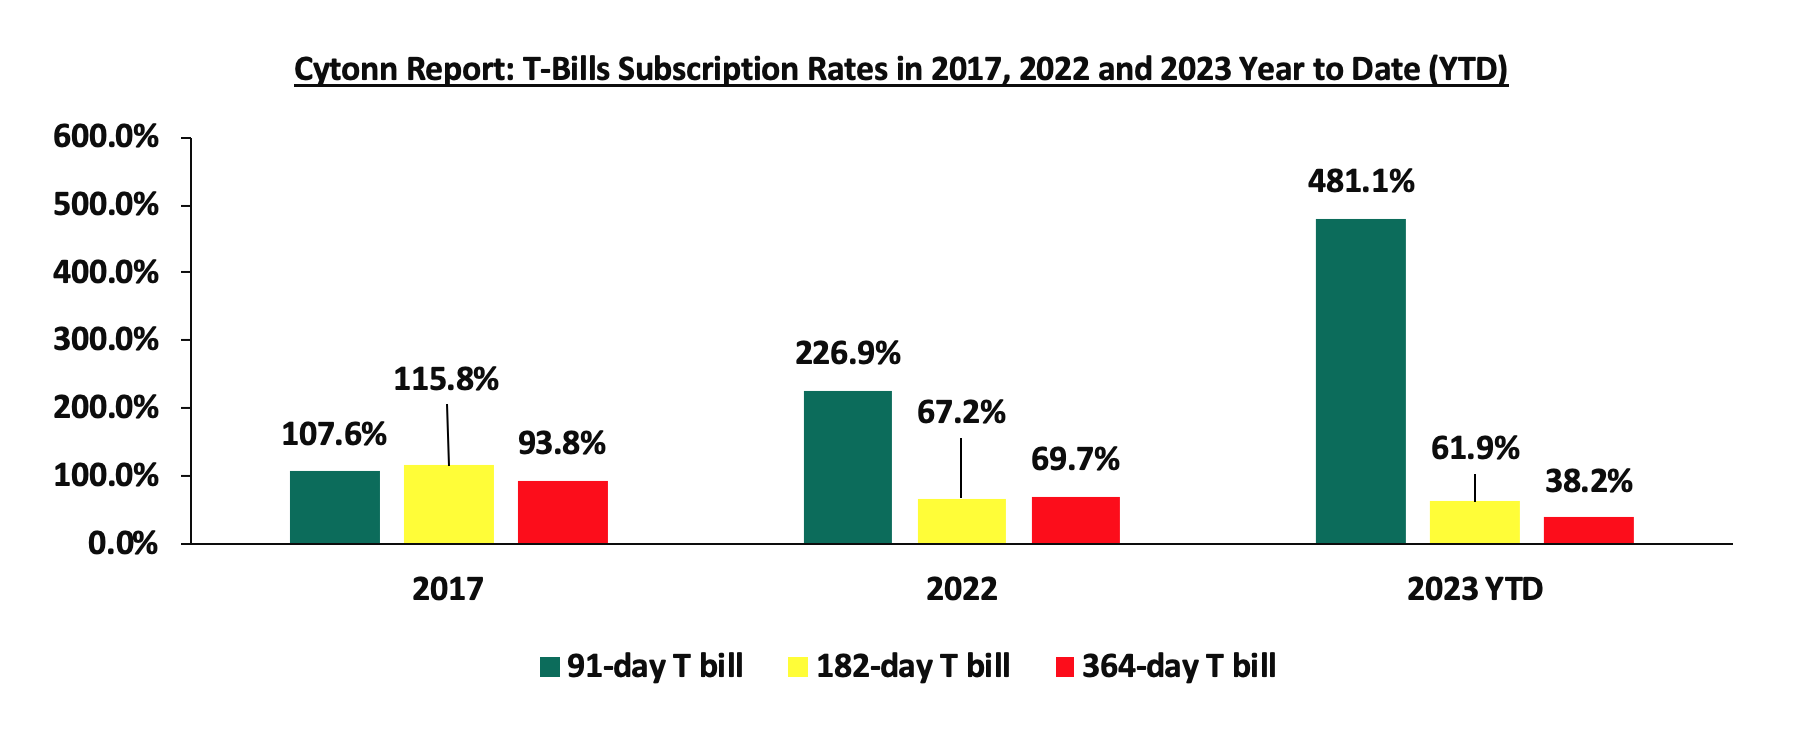
During the week, T-bills were undersubscribed for the second consecutive week, with the overall subscription rate coming in at 63.9% a decrease from the under-subscription rate of 94.2% recorded the previous week. Investor’s preference for the shorter 91-day paper persisted as they sought to avoid duration risk, with the paper receiving bids worth Kshs 11.0 bn against the offered Kshs 4.0 bn, translating to an oversubscription rate of 275.3%, albeit lower than the 454.9% recorded the previous week. The subscription rate for the 364-day paper increased to 23.4%, from 17.5% recorded the previous week. However, the subscription rate for the 182-day paper decreased to 19.9%, from 26.6% recorded the previous week. The government accepted all the bids of Kshs 15.3 bn. The yields on the government papers were on an upward trajectory, with the yields on the 364-day, 182-day and 91-day papers increasing by 20.0 bps, 21.4 bps, and 14.5 bps to 11.9%, 11.9%, and 11.8%, respectively. The chart below compares the overall average T- bills subscription rates obtained in 2017, 2022 and 2023 Year to Date (YTD):
In the primary bond market, the Central Bank of Kenya released the auction results for the third tap sale of FXD1/2023/03 with a tenor to maturity of 2.9 years, with the government seeking to raise Kshs 15.0 bn for budgetary support. In line with our expectations, the bond was oversubscribed, receiving bids worth Kshs 18.6 bn, against the offered Kshs 15.0 bn, translating to an oversubscription rate of 123.7%, partly attributable to investors’ preference for shorter-dated bonds as they seek to avoid duration risk. The government accepted all the Kshs 18.6 bn. The yield on the bond and coupon rate is at 14.2%.
Key to note is that, on its first auction, the FXD1/2023/003 received bids worth Kshs 20.7 bn against the offered Kshs 20.0 bn, translating to an oversubscription rate of 103.7% with the government accepting bids worth Kshs 20.3 bn, translating to an acceptance rate of 97.8%. The bond’s first tap sale received bids worth Kshs 10.6 bn against the offered Kshs 10.0 bn, translating to an oversubscription rate of 106.0%, with the government accepting bids worth Kshs 10.6 bn translating to an acceptance rate of 100.0%. The second tap-sale received bids worth Kshs 27.2 bn against the offered 20.0 bn translating to an oversubscription rate of 136.0%, with the government accepting bids worth Kshs 27.2 bn translating to an acceptance rate of 100.0%.
Money Market Performance:
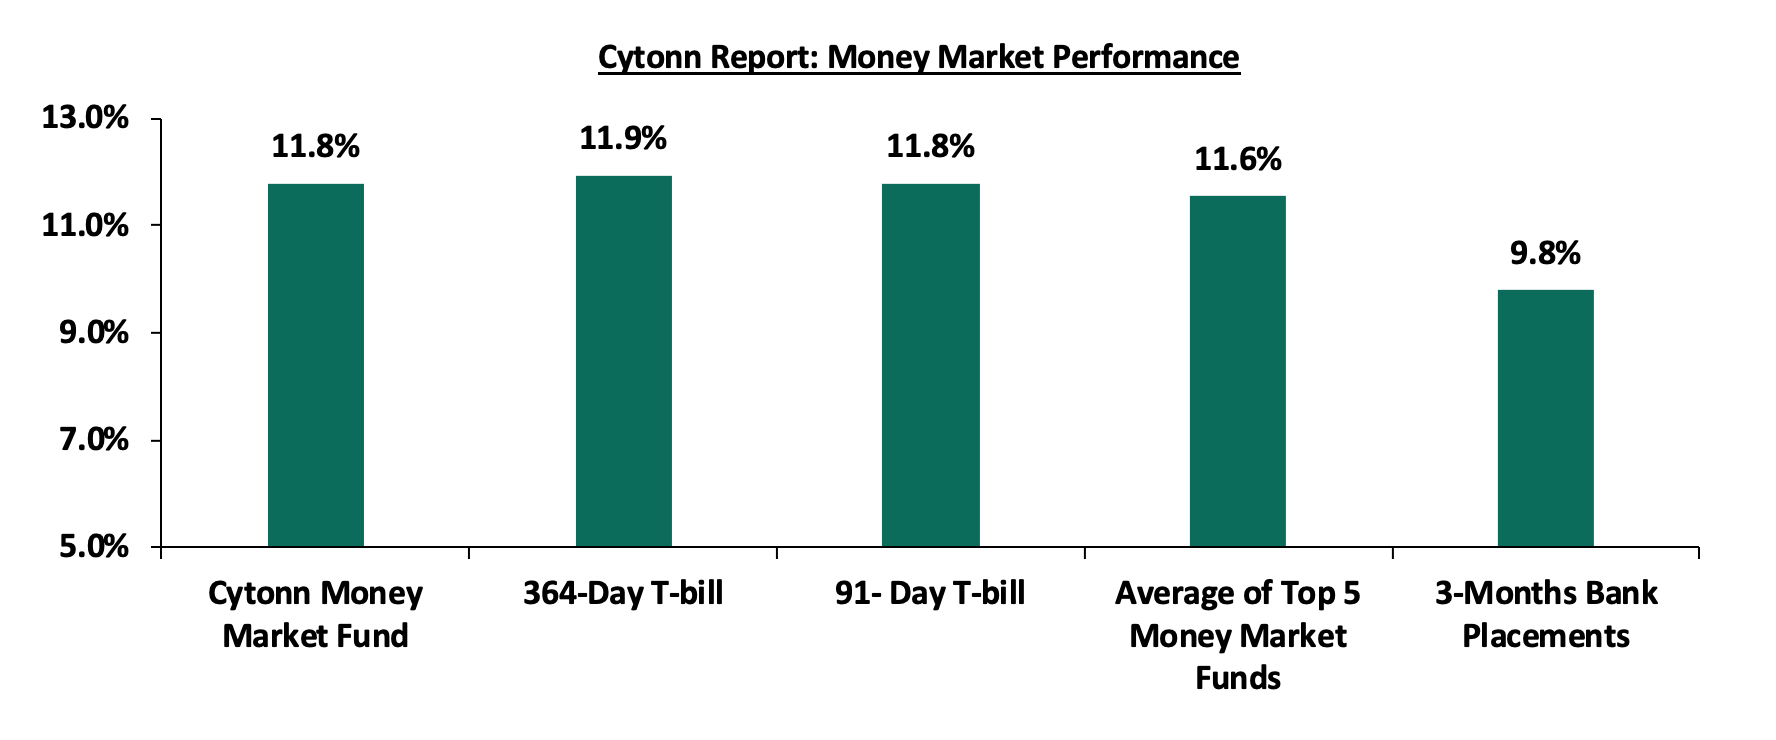
In the money markets, 3-month bank placements ended the week at 9.8% (based on what we have been offered by various banks), while the yields on the 364-day and 91-day paper increased by 20.0 bps and 14.5 bps to 11.9% and 11.8% respectively. The yield of Cytonn Money Market Fund increased by 1.0 bps to remain relatively unchanged at 11.8% from what was recorded in the previous week, while the average yields of Top 5 Money Market Funds increased by 28.0 bps to 11.6%, from 11.3% recorded the previous week.
The table below shows the Money Market Fund Yields for Kenyan Fund Managers as published on 23 June 2023:
|
Cytonn Report: Money Market Fund Yield for Fund Managers as published on 23 June 2023 |
||
|
Rank |
Fund Manager |
Effective Annual Rate |
|
1 |
Enwealth Money Market Fund |
12.0% |
|
2 |
Etica Money Market Fund |
12.0% |
|
3 |
Cytonn Money Market Fund (dial *809# or download the Cytonn app) |
11.8% |
|
4 |
Madison Money Market Fund |
11.0% |
|
5 |
GenAfrica Money Market Fund |
11.0% |
|
6 |
Dry Associates Money Market Fund |
10.8% |
|
7 |
Apollo Money Market Fund |
10.8% |
|
8 |
Kuza Money Market fund |
10.8% |
|
9 |
Jubilee Money Market Fund |
10.7% |
|
10 |
AA Kenya Shillings Fund |
10.6% |
|
11 |
Co-op Money Market Fund |
10.5% |
|
12 |
KCB Money Market Fund |
10.5% |
|
13 |
Old Mutual Money Market Fund |
10.5% |
|
14 |
Sanlam Money Market Fund |
10.4% |
|
15 |
NCBA Money Market Fund |
10.2% |
|
16 |
GenCap Hela Imara Money Market Fund |
10.2% |
|
17 |
Nabo Africa Money Market Fund |
10.1% |
|
18 |
Zimele Money Market Fund |
9.9% |
|
19 |
ICEA Lion Money Market Fund |
9.8% |
|
20 |
CIC Money Market Fund |
9.6% |
|
21 |
British-American Money Market Fund |
9.5% |
|
22 |
Orient Kasha Money Market Fund |
9.4% |
|
23 |
Absa Shilling Money Market Fund |
9.2% |
|
24 |
Mali Money Market Fund |
8.8% |
|
25 |
Equity Money Market Fund |
8.2% |
Source: Business Daily
Liquidity:
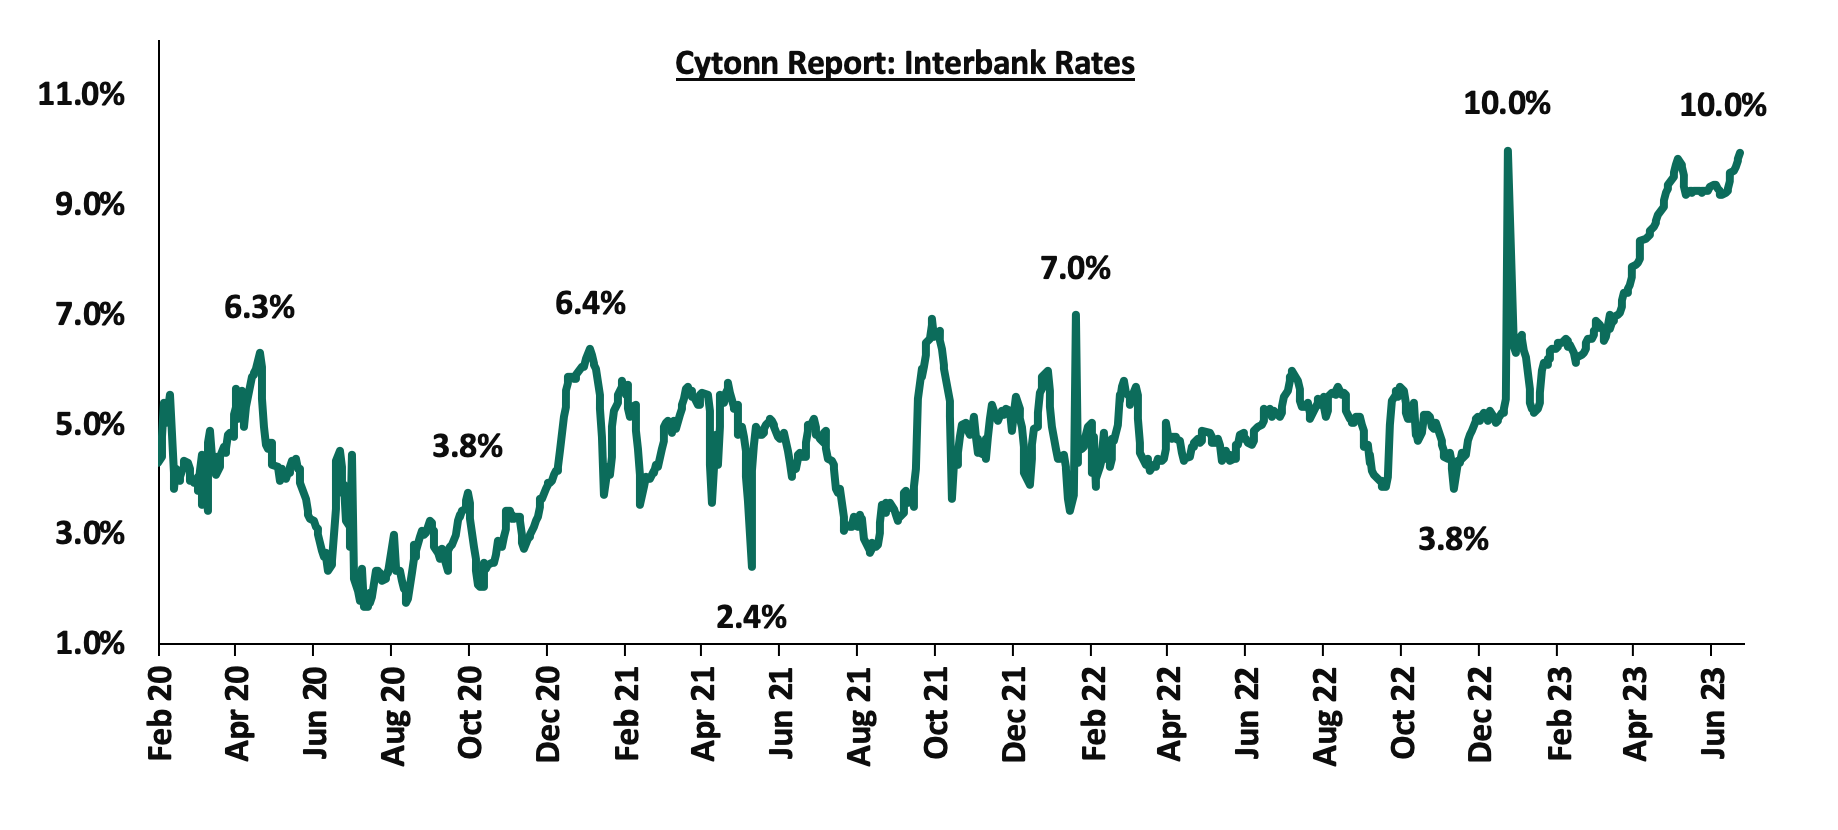
During the week, liquidity in the money markets tightened, with the average interbank rate increasing to 9.8% from 9.4% recorded the previous week, partly attributable to tax remittances that offset government payments. The average interbank volumes traded declined by 25.9% to Kshs 12.7 bn, from Kshs 17.2 bn recorded the previous week. The chart below shows the interbank rates in the market over the years:
Source: CBK
Kenya Eurobonds:
During the week, the yields on Eurobonds recorded mix performance, with the yield on the 10-year Eurobond issued in 2018 gaining by 0.1% points to 11.1% from 11.0% recorded the previous week, while the yield on the 10-year Eurobond issued in 2014 declined the most by 0.4% points to 12.7% from 13.1% recorded the previous week. The table below shows the summary of the performance of the Kenyan Eurobonds as of 22 June 2023;
|
Cytonn Report: Kenya Eurobonds Performance |
||||||
|
|
2014 |
2018 |
2019 |
2021 |
||
|
Date |
10-year issue |
10-year issue |
30-year issue |
7-year issue |
12-year issue |
12-year issue |
|
Amount Issued (USD) |
2.0 bn |
1.0 bn |
1.0 bn |
0.9 bn |
1.2 bn |
1.0 bn |
|
Years to Maturity |
1.1 |
4.8 |
24.8 |
4.0 |
9.0 |
11.1 |
|
Yields at Issue |
6.6% |
7.3% |
8.3% |
7.0% |
7.9% |
6.2% |
|
2-Jan-23 |
12.9% |
10.5% |
10.9% |
10.9% |
10.8% |
9.9% |
|
1-Jun-23 |
15.5% |
11.9% |
11.5% |
13.0% |
11.9% |
11.0% |
|
15-Jun-23 |
13.1% |
11.0% |
11.0% |
11.3% |
11.1% |
10.3% |
|
16-Jun-23 |
12.4% |
10.9% |
10.9% |
11.1% |
11.0% |
10.2% |
|
19-Jun-23 |
12.4% |
10.9% |
10.9% |
11.1% |
11.0% |
10.2% |
|
20-Jun-23 |
12.3% |
10.9% |
10.9% |
11.1% |
11.0% |
10.2% |
|
21-Jun-23 |
12.5% |
11.0% |
11.0% |
11.3% |
11.0% |
10.3% |
|
22-Jun-23 |
12.7% |
11.1% |
11.0% |
11.3% |
11.0% |
10.3% |
|
Weekly Change |
(0.4%) |
0.1% |
0.0% |
0.0% |
(0.1%) |
0.0% |
|
MTD change |
(2.8%) |
(0.8%) |
(0.5%) |
(1.7%) |
(0.9%) |
(0.7%) |
|
YTD Change |
(0.2%) |
0.6% |
0.1% |
0.4% |
0.2% |
0.4% |
Source: Central Bank of Kenya (CBK) and National Treasury
Kenya Shilling:
During the week, the Kenya Shilling depreciated by 0.4% against the US dollar to close the week at Kshs 140.4, from Kshs 139.9 recorded the previous week, partly attributable to the persistent high dollar demand from importers, especially in the oil and energy sectors. On a year-to-date basis, the shilling has depreciated by 13.8% against the dollar, adding to the 9.0% depreciation recorded in 2022. We expect the shilling to remain under pressure in 2023 as a result of:
- An ever-present current account deficit estimated at 4.9% of GDP in twelve months to January 2023, from 5.6% recorded in a similar period last year, and,
- The need for government debt servicing, continues to put pressure on forex reserves given that 67.3% of Kenya’s external debt was US Dollar denominated as of March 2023, and,
The shilling is however expected to be supported by:
- Diaspora remittances standing at a cumulative USD 1,688.0 mn in 2023 as of May 2023, albeit 1.8% lower than the USD 1,718.6 mn recorded over the same period in 2022, and,
- The tourism inflow receipts came in at USD 268.1 bn in 2022, a significant 82.9% increase from USD 146.5 bn inflow receipts recorded in 2021.
Key to note is that Kenya’s forex reserves decreased during the week by 1.1% to USD 7.4 bn as of June 22, 2023, from USD 7.5 bn as of June 15, 2023. The country’s month of import cover remained relatively unchanged at 4.1 months of import cover, which is above the statutory requirement of maintaining at least 4.0 months of import cover. The chart below summarizes the evolution of Kenya months of import cover over the last 10 years:
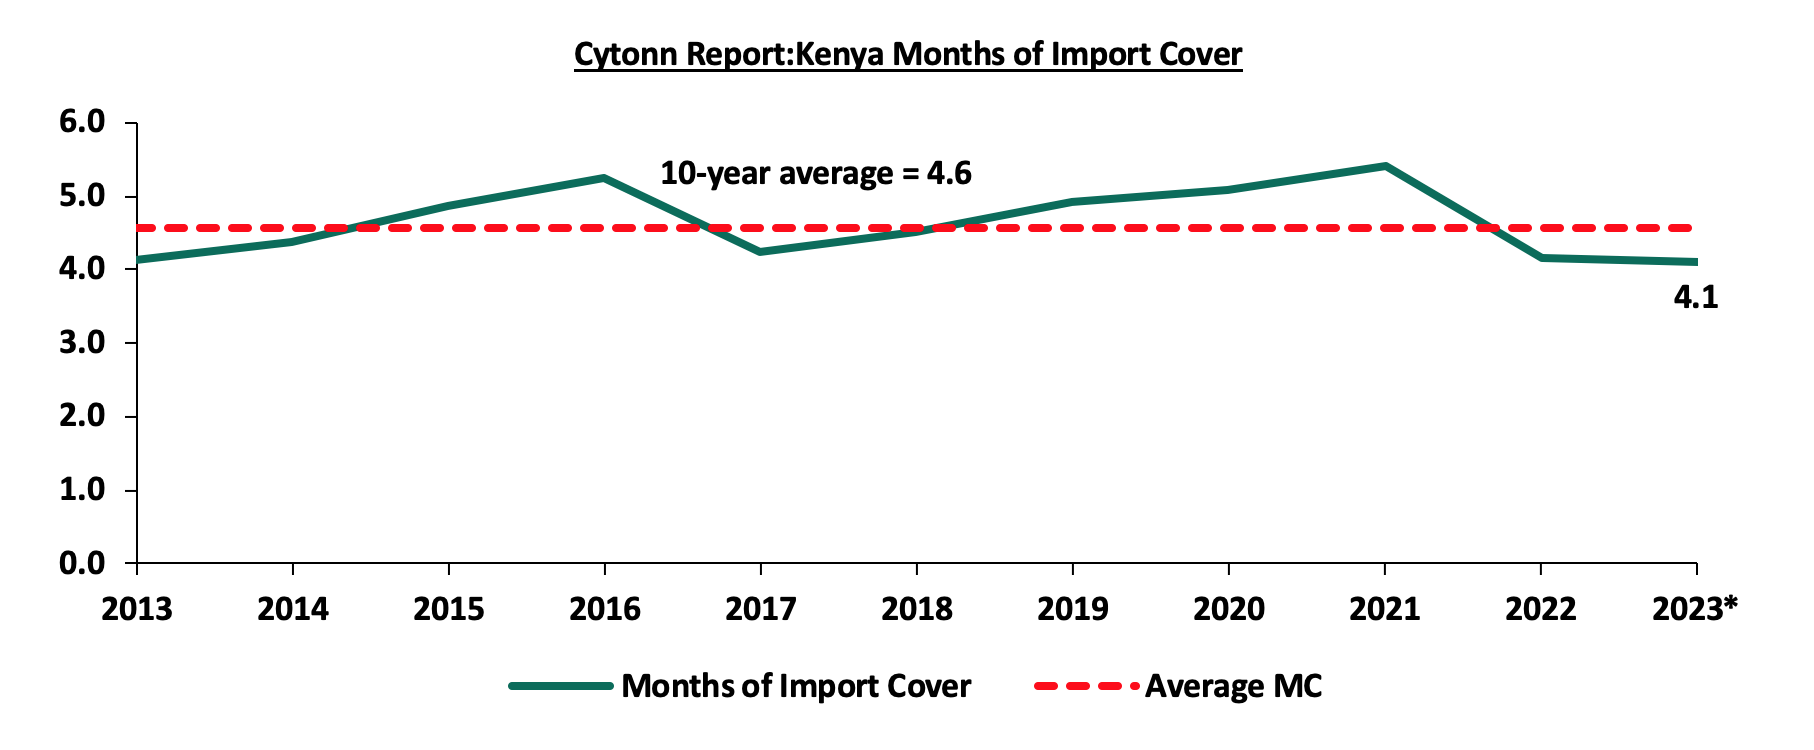
*Figure as at 22 June 2023
Weekly Highlights:
June 2023 Inflation Projection
We are projecting the y/y inflation rate for June 2023 to come in at the range of 7.7%-8.1% mainly on the back of:
- High Fuel Prices –The Fuel prices in the country remain elevated despite the global fuel prices dropping by 8.6% to USD 76.8 per barrel as of 22 June 2023, from a high of USD 84.1 per barrel recorded on 1 April 2023 and the average landed costs declining during the month of May except for Diesel. Notably, for the period between 15 June 2023 to 14 July 2023, the prices for Kerosene increased by 0.2% to Kshs 161.48, from Kshs 161.13 per liter. However, the prices for Diesel and Super Petrol declined slightly by 0.7% and 0.4% to Kshs 167.28 and Kshs 182.04, from Kshs 168.40 and 182.70 per liter, respectively. The fuel prices remain high mainly on the back of the government’s decision to completely remove fuel subsidy program coupled with the continued currency depreciation being experienced in the economy hence elevating the cost of fuel importation,
- Elevated food prices - Food prices have remained elevated mainly on the back of uneven weather patterns as well as supply chain bottlenecks experienced globally. The elevated prices were evidenced by the 10.2% y/y increase in the prices of food and non-alcoholic beverages in May 2023. Given that food is a major input in the inflation index, we expect the resulting high prices to underpin inflationary pressures.
The high commodity prices in the country are also attributed to the sustained depreciation of the Kenya Shilling which has inflated the import bill. As a result, manufacturers pass on the cost to consumers through increases in commodity prices. Going forward, we expect inflationary pressures to persist in the short term, however, to ease in the medium term to CBK’s target range of 2.5% to 7.5% aided by easing in global fuel prices and easing of domestic food prices on account of favorable weather conditions. We also expect the measures taken by the government to subsidize major inputs of agricultural production such as fertilizers to lower the cost of farm inputs and support the easing of inflation in the long term.
Rates in the Fixed Income market have been on an upward trend given the continued government’s demand for cash and the highly tightened liquidity in the money market. The government is 34.3% ahead of its prorated borrowing target of Kshs 423.5 bn having borrowed Kshs 568.7 bn of the revised domestic borrowing target of Kshs 428.3 bn for the FY’2022/2023. Revenue collections are lagging behind, with total revenue as of May 2023 coming in at Kshs 1.8 tn in the FY’2022/2023, equivalent to 82.7% of its revised target of Kshs 2.2 tn and 90.2% of the prorated target of Kshs 2.0 tn. Therefore, we expect a continued upward readjustment of the yield curve in the short and medium term, with the government looking to bridge the fiscal deficit through the domestic market. Owing to this, our view is that investors should be biased towards short-term fixed-income securities to reduce duration risk.
Market Performance:
During the week, the equities market was on an upward trajectory with NASI, NSE 20 and NSE 25 gaining by 6.9%, 1.1% and 3.1% respectively, taking the YTD performance to losses of 15.8%, 5.5% and 13.4% for NASI, NSE 20 and NSE 25, respectively. The equities market performance was mainly driven by gains recorded by large-cap stocks such as Safaricom, Diamond Trust Bank (DTB-K), ABSA Bank, and BAT of 17.4%, 8.2%, 1.7% and 1.1 % respectively. The gains were however weighed down by losses recorded by stocks such as Bamburi and EABL of 6.7% and 4.3%, respectively;
During the week, equities turnover decreased by 57.5% to USD 5.0 mn, from USD 11.8 mn, recorded the previous week, taking the YTD turnover to USD 447.1 mn. Foreign investors remained net buyers with a net buying position of USD 0.4 mn, from a net buying position of USD 0.2 mn recorded the previous week, taking the YTD net selling position to USD 53.2 mn.
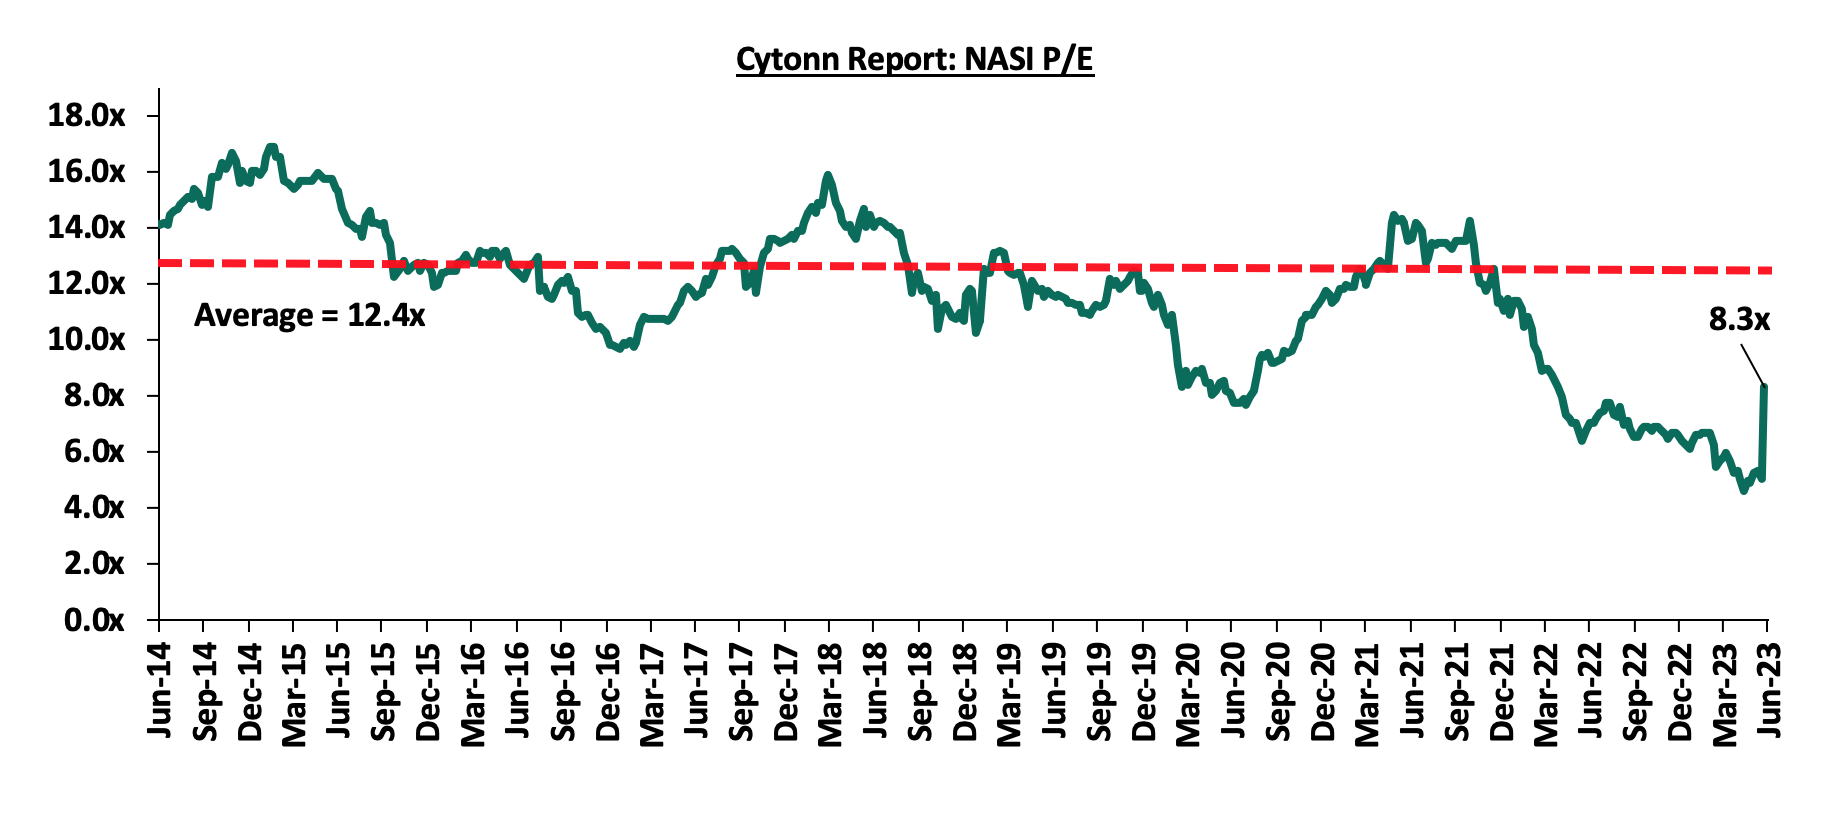
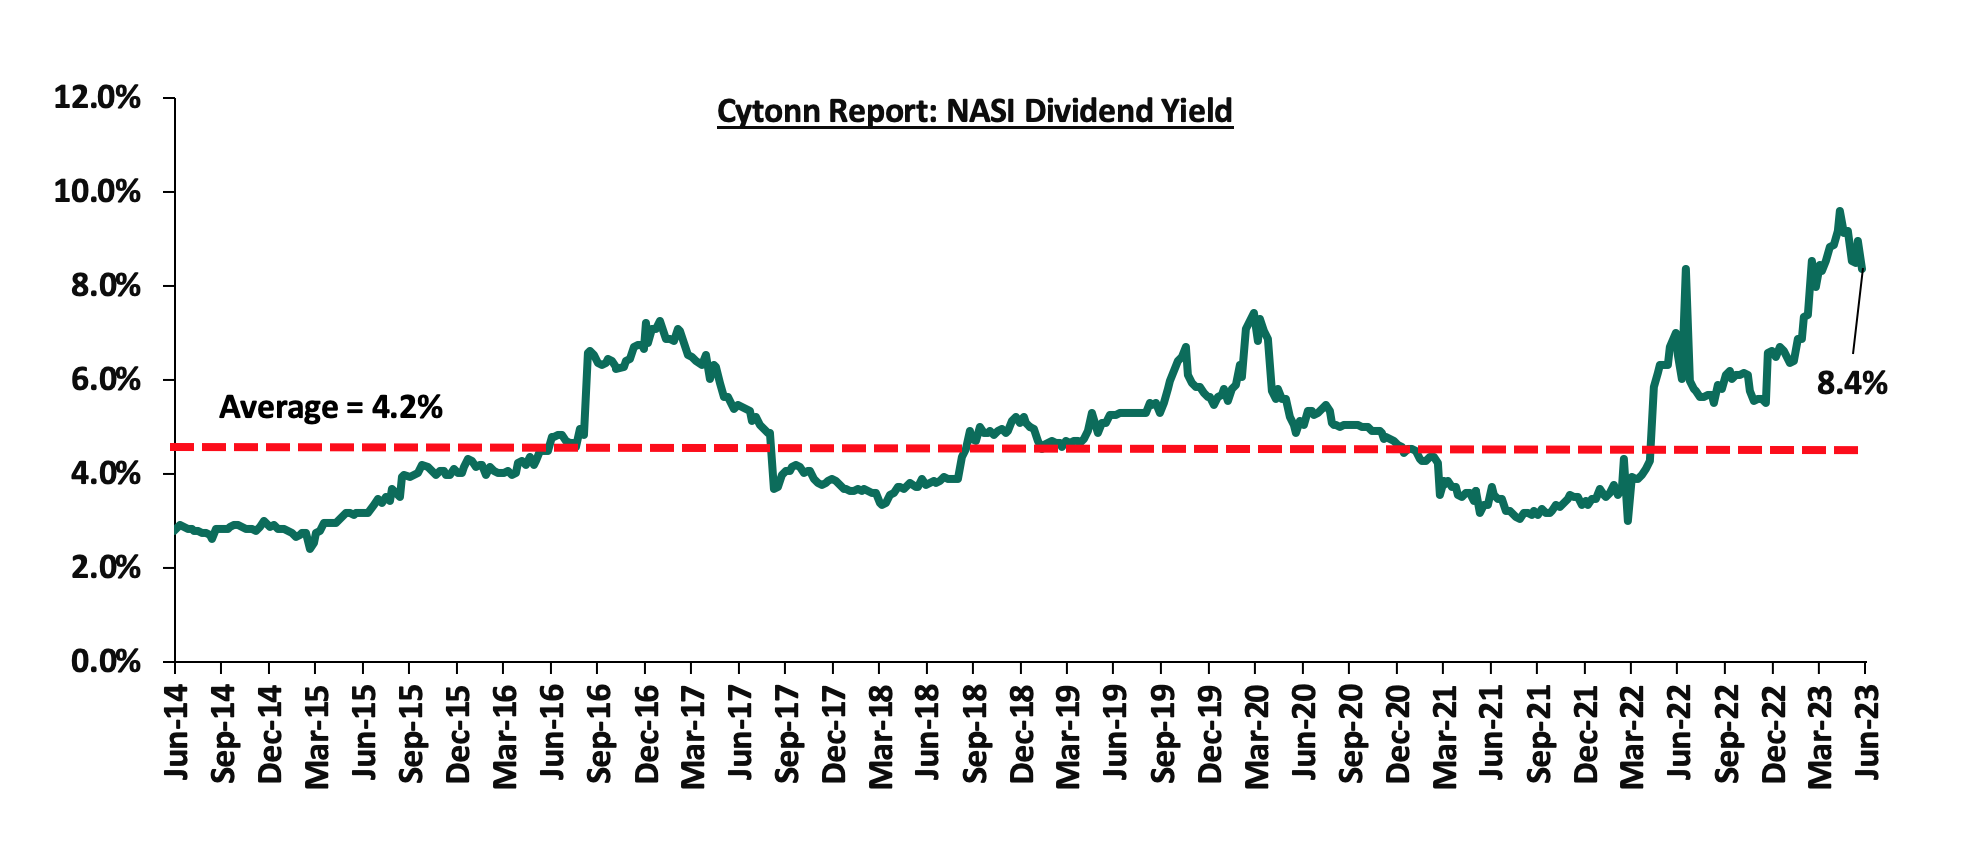
The market is currently trading at a price to earnings ratio (P/E) of 8.3x, 32.6% below the historical average of 12.4x. The dividend yield stands at 8.4%, 4.2% points above the historical average of 4.2%. Key to note, NASI’s PEG ratio currently stands at 1.1x, an indication that the market is overvalued relative to its future growth. A PEG ratio greater than 1.0x indicates the market is overvalued while a PEG ratio less than 1.0x indicates that the market is undervalued. The charts below indicate the historical P/E and dividend yields of the market;
Weekly Highlight:
- Q1’2023 Quarterly Economic Review
During the week, the Central Bank of Kenya (CBK) released the Quarterly Economic Review for the period ending 31 March 2023, highlighting that the banking sector remained stable and resilient during the period on the back of strong liquidity and capital adequacy. According to the report, the sector’s total assets increased by 2.7% to Kshs 6.8 tn in March 2023, from Kshs 6.6 tn in December 2022. The increase was mainly attributable to a 4.8% increase in loans and advances to Kshs 3.9 tn, from Kshs 3.7 tn recorded in Q4’2022. On a yearly basis, total assets increased by 11.0% to Kshs 6.7 tn, from Kshs 6.1 tn in Q1’2022. Notably, loans and advances accounted for 56.9% of total assets in Q1’2023, which was an increase from 55.7% of total assets in Q4’2022.
Other key take-outs from the report include:
- The banking sector recorded a 13.8% increase in Profit before Tax (PBT) q/q with the increase in profitability mainly attributable to 1.4% increase in quarterly income, coupled with a 3.6% decrease in quarterly expenses. On a yearly basis, PBT increased by 13.6%, to Kshs 65.1 bn, from Kshs 57.3 bn recorded in Q1’2022,
- The sector’s Return on Asset (ROA) rose marginally by 0.1% points to 3.1%, from 3.0% in both Q4’2022 and Q1’2022. Additionally, Return on Equity (ROE) recorded 1.8% points increase to 27.0% in Q1’2023, from 25.2% in Q4’2022, and 1.9% points increase from 25.1% recorded in Q1’2022,
- Lending increased by 4.8% to Kshs 3.9 tn in Q1’2023, from Kshs 3.7 tn in Q4’2022, attributable to an increase in credit advanced to individual borrowers as well as for working capital purposes in sectors such as transport and communication, personal and household, and agriculture which increased by 9.7%, 3.5% and 3.1%, respectively. On a yearly basis, lending was up by 13.9% to Kshs 3.9 tn, from Kshs 3.4 tn in Q1’2022,
- Deposits recorded a 2.1 % increase to Kshs 4.8 tn in Q1’2023, from Kshs 4.7 tn in Q4’2022, attributable to a 7.3% increase in foreign currency deposits which increased to Kshs 1.3 tn in Q1’2023, from Kshs 1.2 bn recorded in Q4’2022. Notably, on a year on year basis, deposits increased by 8.1% to Kshs 4.8 tn in Q1’2023, from Kshs 4.5 tn in Q1’2021. Key to note, customer deposits remain the main source of funding for banks, accounting for 71.3% of the sector’s total liabilities. The shareholder’s funds as at Q1’2023, 0.4% points lower than the 71.7% recorded in Q4’2022 and a further 1.9% points decline from the 73.2% recorded in Q1’2022,
- Credit risk remained elevated in the sector with the gross NPLs to gross loans ratio increasing to 14.0% in Q1’2023, from 13.3% in Q4’2022. The increase in gross NPL ratio was driven by a faster 10.9% increase in gross Non-Performing Loans (NPLs) to Kshs 540.8 bn in Q1’2023 from 487.7 bn in Q4’2022 relative to a slower 4.8% increase in gross loans in the period under review. Financial Services, Building and Construction, Manufacturing, Personal and Household, and Transport and Communication sectors registered increases in NPLs by Kshs 33.4 bn as a result of delayed repayments attributed to a challenging operating environment. Notably, Mining and Quarrying, registered a major decrease in NPLs, mainly due to repayments. Key to note, the asset quality remained unchanged on a year-on-year basis at 14.0% in Q1’2023 similar to what was recorded in Q1’2022,
- The sector’s NPL coverage ratio decreased to 40.4% in Q1’2023, from 43.3% in Q4’2022, attributable to a faster 10.9% increase in gross Non-Performing Loan, which outpaced the slower 3.8% increase in specific provisions to Kshs 183.8 bn, from Kshs 177.0 bn in Q4’2022. We expect increased provisioning levels owing to the elevated credit risks brought by the tough operating environments,
- The banking sector remained adequately capitalized, with the aggregate Core Capital to Total Risk-weighted Assets ratio despite the ratio decreasing by 0.6% points to 15.5% in Q12023, from 16.1% in Q4’2022, and 0.7% points lower than 16.2% recorded in Q1’2022. The core capital to Total Risk-Weighted Assets ratio was 5.0% points above the CBK’s minimum statutory ratio of 10.5%. On the other hand, Total Capital to Total Risk-Weighted Asset ratio, decreased by 0.6% points to 18.4% in Q1’2023, from 19.0% recorded in Q4’2022 and 0.5% points lower than 18.9% recorded in Q1’2022. The Q1’2023 Total Capital to Total Risk-Weighted Assets ratio was 3.9% points above the CBK’s minimum statutory ratio of 14.5%. Key to note, the decreases in the capital ratios were mainly due to a higher increase in Total Risk-Weighted Asset by 4.9% as compared to the increases in capital during the period under review, and,
- The sector remained sufficiently liquid during the period under review, despite the liquidity ratio decreasing to 49.9% in Q1’2023, from 50.8% in Q4’2022. Year on year, the ratio decreased by 5.1% points from 55.0% recorded in Q1’2022. This was 29.9% points above the minimum statutory level of 20.0%. The decrease in the banking sector’s liquidity is attributable to 2.7% increase in short-term liabilities, as compared to a 0.8% decrease in total liquid assets between the periods under review.
The increased profitability in Q1’2023 indicates the banking sector’s continued resilience and profitability despite the deterioration of the business environment in Q1’2023 with the average Purchasing Managers Index (PMI) coming in at 49.3 as compared to an average of 50.3 in the similar period last year. Additionally, the sector remains sufficiently capitalized and with adequate liquidity levels above the minimum statutory requirement, evidenced by the capital adequacy and liquidity ratios remaining above the minimum statutory ratios. However, credit risk level remained elevated with Gross Non-Performing Loan ratio increasing in Q1’2023, attributable to increased cost of living exacerbated by inflationary pressures and continued depreciation of the Kenyan shilling. Overall, we expect the sector’s profitability to be boosted by expected increase in interest income as a result of the continued adoption of risk-based pricing models.
Universe of coverage:
|
Company |
Price as at 16/06/2023 |
Price as at 23/06/2023 |
w/w change |
YTD Change |
Target Price* |
Dividend Yield |
Upside/ Downside** |
P/TBv Multiple |
Recommendation |
|
Liberty Holdings |
3.9 |
3.6 |
(8.2%) |
(28.6%) |
5.9 |
0.0% |
64.4% |
0.3x |
Buy |
|
Jubilee Holdings |
184.3 |
180.0 |
(2.3%) |
(9.4%) |
260.7 |
6.7% |
51.5% |
0.3x |
Buy |
|
Kenya Reinsurance |
2.0 |
1.8 |
(8.6%) |
(3.2%) |
2.5 |
11.0% |
49.7% |
0.1x |
Buy |
|
Equity Group*** |
37.2 |
37.5 |
0.9% |
(16.8%) |
51.2 |
10.7% |
47.1% |
0.8x |
Buy |
|
KCB Group*** |
29.5 |
29.5 |
0.2% |
(23.1%) |
41.3 |
6.8% |
46.6% |
0.5x |
Buy |
|
CIC Group |
1.9 |
1.9 |
2.2% |
(0.5%) |
2.5 |
6.8% |
38.4% |
0.6x |
Buy |
|
ABSA Bank*** |
11.6 |
11.8 |
1.7% |
(3.7%) |
14.7 |
11.5% |
36.3% |
0.9x |
Buy |
|
NCBA*** |
39.3 |
39.0 |
(0.9%) |
0.0% |
48.9 |
10.9% |
36.3% |
0.8x |
Buy |
|
Co-op Bank*** |
12.2 |
12.3 |
0.8% |
1.7% |
15.0 |
12.2% |
33.7% |
0.6x |
Buy |
|
Sanlam |
7.8 |
8.0 |
2.6% |
(16.7%) |
10.3 |
0.0% |
28.9% |
2.3x |
Buy |
|
I&M Group*** |
17.0 |
17.0 |
0.0% |
(0.6%) |
19.5 |
13.3% |
28.1% |
0.4x |
Buy |
|
Standard Chartered*** |
160.8 |
161.8 |
0.6% |
11.6% |
183.9 |
13.6% |
27.3% |
1.1x |
Buy |
|
Stanbic Holdings |
111.3 |
112.0 |
0.7% |
9.8% |
127.9 |
11.3% |
25.4% |
0.8x |
Buy |
|
Diamond Trust Bank*** |
45.8 |
49.6 |
8.2% |
(0.6%) |
54.6 |
10.1% |
20.2% |
0.2x |
Buy |
|
HF Group |
5.0 |
5.0 |
0.8% |
58.7% |
5.8 |
0.0% |
16.2% |
0.2x |
Accumulate |
|
Britam |
5.0 |
5.2 |
5.1% |
0.0% |
6.0 |
0.0% |
14.8% |
0.7x |
Accumulate |
|
Target Price as per Cytonn Analyst estimates **Upside/ (Downside) is adjusted for Dividend Yield ***For Disclosure, these are stocks in which Cytonn and/or its affiliates are invested in |
|||||||||
We are “Neutral” on the Equities markets in the short term due to the current tough operating environment and huge foreign investor outflows, and, “Bullish” in the long term due to current cheap valuations and expected global and local economic recovery.
With the market currently being overvalued to its future growth (PEG Ratio at 1.1x), we believe that investors should reposition towards value stocks with strong earnings growth and that are trading at discounts to their intrinsic value. We expect the current high foreign investors sell-offs to continue weighing down the equities outlook in the short term.
- Industry Reports
- Quarterly Economic Report Q1’2023
During the week, the Central Bank of Kenya (CBK) released the Quarterly Economic Review Q1’2023 Report, which highlighted the status and performance of Kenya’s economy for the period under review. The following were the key takeouts from the report, with regard to the Real Estate and related sectors;
- The year-on-year (y/y) gross loans advanced to the Real Estate sector increased by 4.6% to Kshs 481.0 bn in Q1’2023, from Kshs 460.0 bn in Q1’2022. The advanced loans also represented a 1.3% quarter-on-quarter (q/q) increase from Kshs 475.0 bn realized in Q4’2022. The increase was mainly on the back of increased construction activities in select Real Estate sectors particularly the residential sector, fuelled by private firms, individuals, and the government’s continuous drive to provide affordable housing to its citizens,
- The gross loans advanced to the hospitality sector increased by 0.9% to Kshs 112.0 bn in Q1’2023, from Kshs 111.0 bn in Q1’2022 on a y/y basis. This was attributed to an increased need for operational capital in the sector driven by; i) increased operational expenses due to rising inflation on the back of supply chain disruptions, exacerbated by the Russia-Ukraine war, ii) completion of acquisitions and mergers amid expansionary efforts by players seeking market dominance in the sector, iii) increased costs associated with mergers and acquisitions as a result of increased capital gains tax, iv) aggressive marketing initiatives both locally and internationally by industry players through initiatives such as the annual Magical Kenya Travel Expo, and, v) increased need for financial infusion, following the reopening of hotels and facilities in order to ensure sustain business towards recovery to pre-COVID levels,
- Gross loans advanced to the building and construction sector recorded a y/y growth of 8.7% to Kshs 150.0 bn in Q1’2023, from Kshs 138.0 bn in Q1’2022. This also represented a 5.6% q/q increase from Kshs 142.0 bn recorded in Q4’2022. The growth was mainly driven by continuous construction activities, particularly in the housing and infrastructure sectors. Furthermore, construction costs per SQFT increased by 5.0% averaging at Kshs 5,210 in 2022, from Kshs 4,960 in 2021, necessitating the need for more funding, and,
- The gross Non-Performing Loans (NPLs) in the Real Estate sector realized a y/y increase of 12.2% to Kshs 88.1 bn in Q1’2023, from Kshs 78.5 bn in Q1’2022 whereas in q/q basis, the performance represented a 9.7% increase from Kshs 80.3 bn realized in Q4’2022. This was majorly attributed to delayed repayments as a result of a challenging operating and business environment occasioned by; i) elevated local and global inflationary pressures, and, ii) continuous weakening of the Kenyan Shilling, currently with a Year-To-Date (YTD) depreciation of 13.8% against the United States Dollar (USD) currency, adding to the 9.0% depreciation recorded in 2022. The graph below shows the total Real Estate Non-Performing Loans against the total loans advanced to the sector from Q1’2019 to Q1’2023;
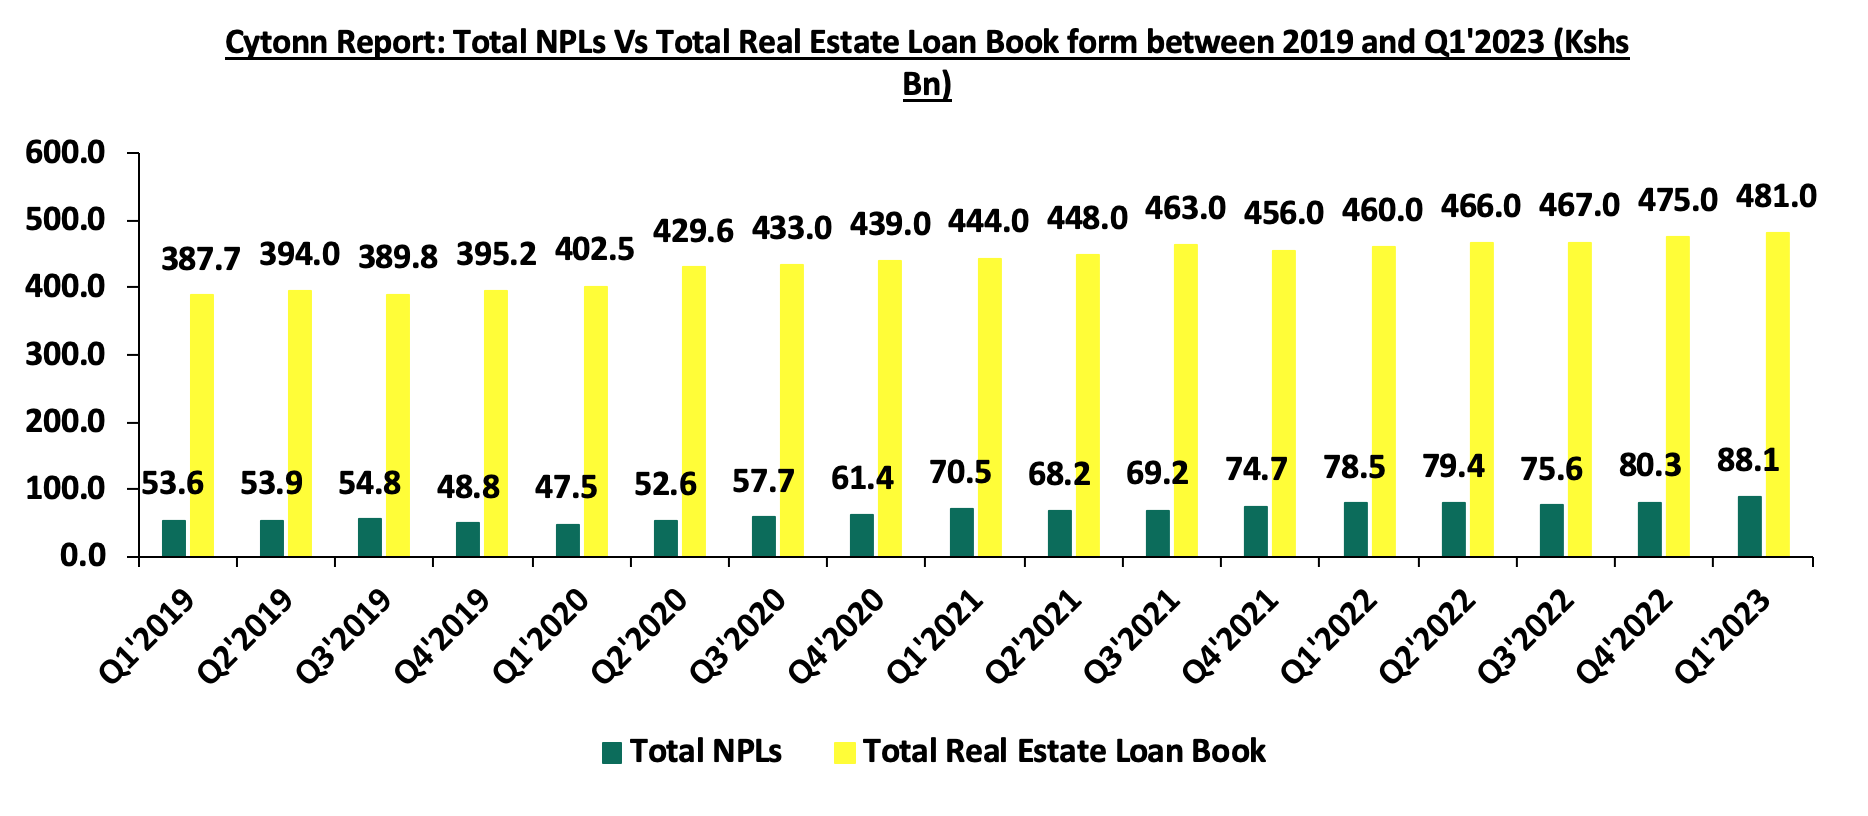
Source: Central Bank of Kenya (CBK)
- Leading Economic Indicators (LEI) Report March 2023
The Kenya National Bureau of Statistics (KNBS) released the Leading Economic Indicators (LEI) March 2023 Report which highlighted the performance of major economic indicators. The key highlights related to the Real Estate sector include;
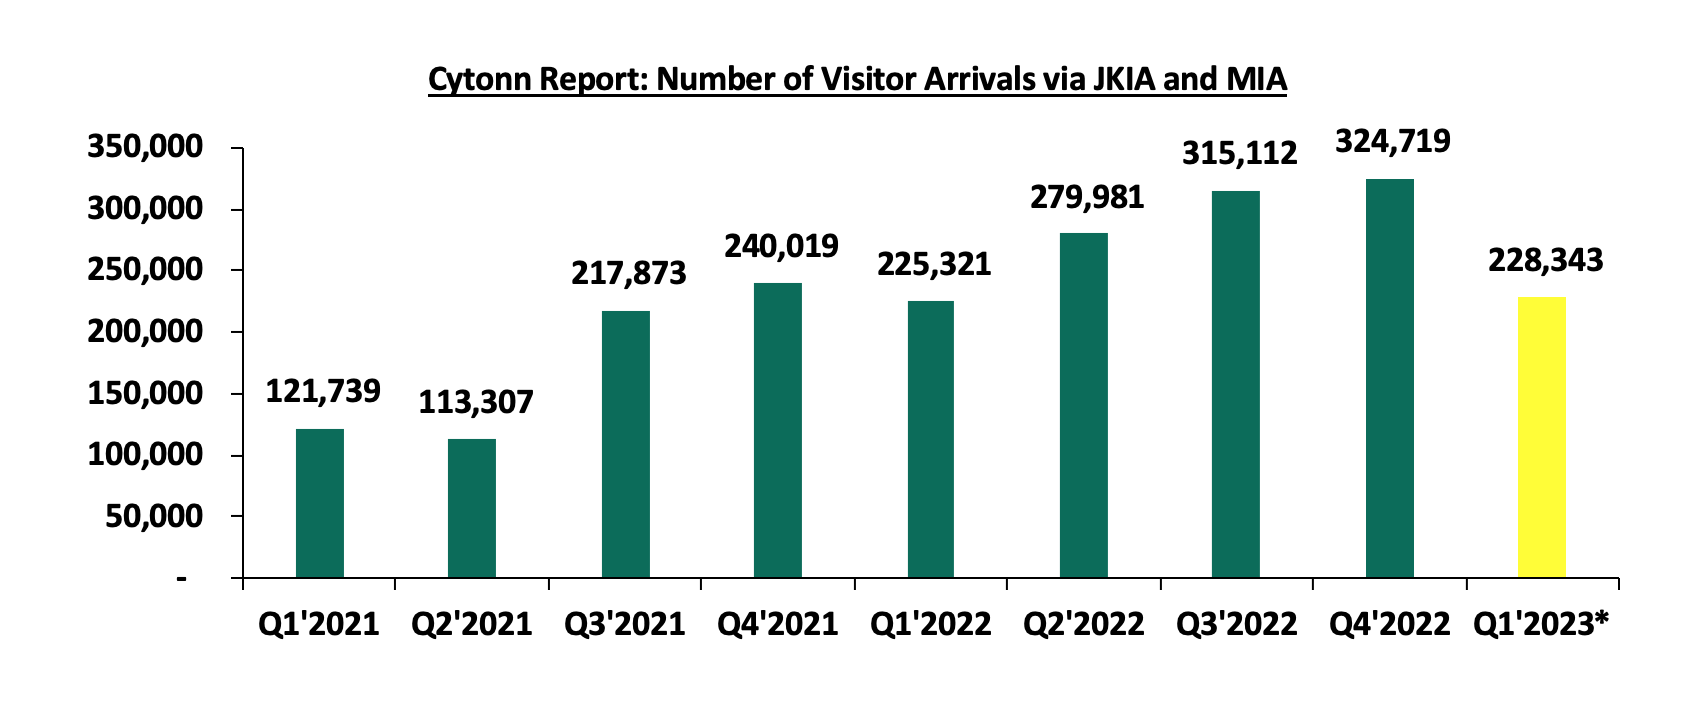
- Overall international arrivals through Jomo Kenyatta International Airport (JKIA) and Moi International Airport (MIA) increased by 0.2% to 114,295 in February 2023, from the 114,048 recorded in January 2023. On a y/y basis, the performance represented a 58.7% increase to 228,343 persons recorded for the months of January and February 2023 compared to the 114,882 persons recorded in January and February 2022. The improved performance is attributable to; i) increased international marketing of Kenya’s tourism market by the Ministry of Tourism in collaboration with the Kenya Tourism Board, through platforms such as the Magical Kenya platform, ii) the tourism board alignment of its marketing initiatives towards targeting emerging and established source markets, and, iii) an increase in corporate and business Meetings, Events, and Conferences (MICE) from both the public and private sectors. The chart below shows the number of international arrivals in Kenya between 2021 and February 2023;
Source: Kenya National Bureau of Statistics (KNBS)
Q1’2023 - January & February 2023
- The consumption of cement decreased by 3.8% to 0.7 mn metric tonnes in February 2023, from 0.8 mn metric tonnes realized in January 2023. This was attributable to increased costs of the commodity driven by prevailing inflationary pressures on the back of local and external shocks. On a year-on-year (y/y) basis, the performance represented a 7.7% decrease to 1.5 mn metric tonnes recorded for January and February 2023, from 1.6 mn metric tonnes recorded in January and February 2022. This was attributable to the consistency in the rising costs of cement, coupled with an increase in pending approvals amid delays in processing construction permits owing to backlogs in registry systems, which led to an overall decrease in the consumption of construction materials. The chart below shows cement consumption in metric tonnes in Kenya between 2021 and February 2023;
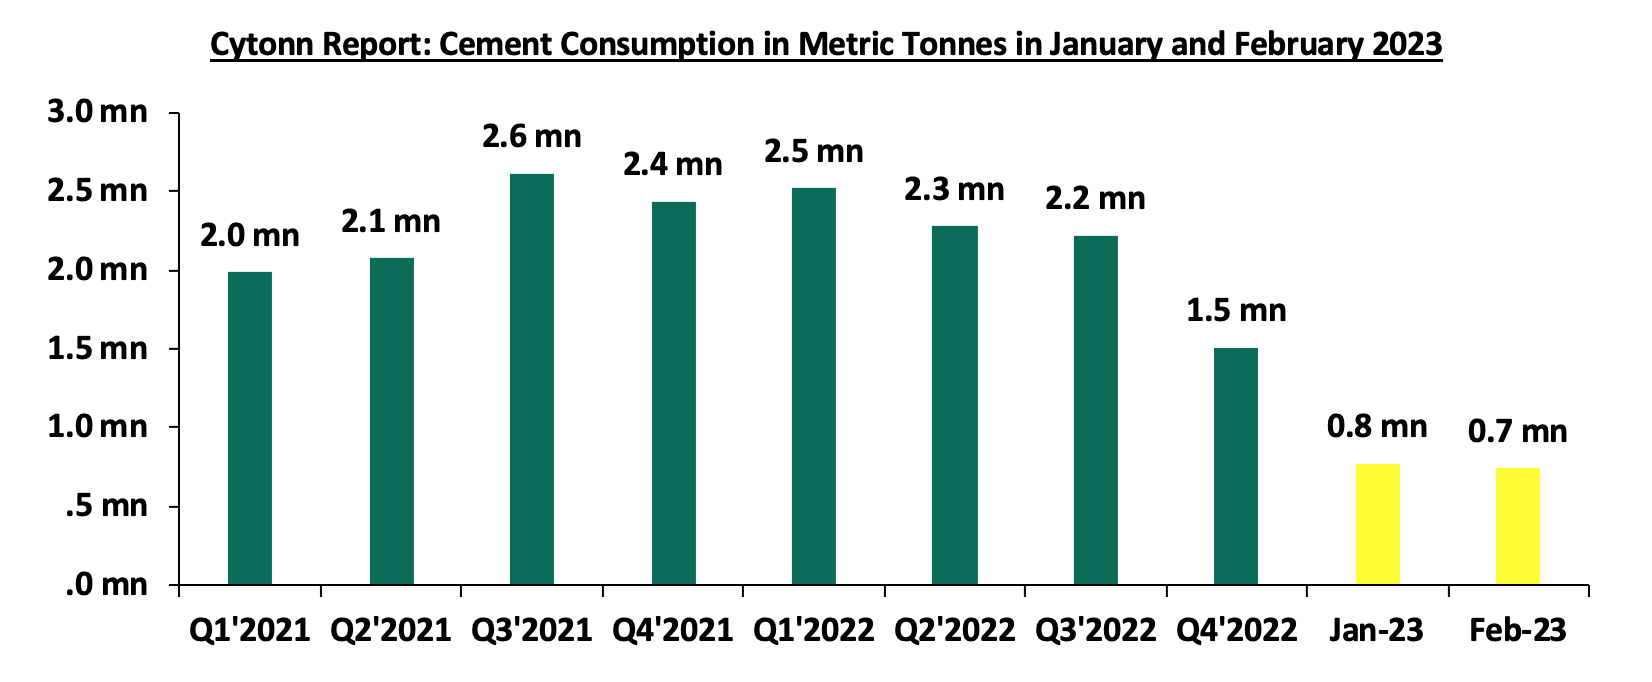
Source: Kenya National Bureau of Statistics (KNBS)
Going forward, we expect Kenya’s Real Estate sector to register positive growth and improved performance mainly driven by the increasing number of visitor arrivals into the country which will enhance the performance of serviced apartments and hotels by boosting room and bed occupancies. However, the decline in construction activities evidenced by a 3.8% reduction in the consumption of cement, is expected to continue hindering the optimal performance of the sector. The decline is driven by high construction costs on the back of inflationary pressures, as well as an increase in pending approvals amid delays in processing construction permits.
- Industrial sector
During the week, Unilever East Africa (EA) opened its Kshs 500.0 mn new modern warehousing facility located in Nairobi, Kenya. The move is part of the firm’s growth bid and expansion in the East Africa region and reinforces its commitment to invest in Kenya, which is a significant market for the firm in the region. Spanning over an extensive surface area of 23,000 SQM, the newly opened warehouse is designed to efficiently handle Fast Moving Consumer Goods (FMCGs) coupled with a diverse range of health and beauty products across the East African region. The facility is equipped with advanced automated storage and retrieval systems and boasts an enhanced pallet capacity exceeding 10,000. The design is intended to facilitate seamless storage, processing, and shipment of Unilever's products. This strategic move underscores the significance of localizing raw and packaging materials in Unilever's production processes, with 70.0% of raw and packaging materials used being sourced from Africa. This localization approach will positively impact the accessibility and affordability of Unilever's products. As such, the facility is expected to; i) achieve multiple outcomes, including augmenting the firm's turnover growth, ii) expanding Unilever's warehousing capabilities across the region, iii) generating employment opportunities both within Kenya and the broader region, iv) bridging the gap between the high demand for quality warehousing facilities in Kenya and the limited supply available, and, v) reduce operation costs, and in turn cushion consumers from high product prices through innovative and cheaper strategies in the production of goods amid the soaring inflation.
We expect Kenya’s industrial sector to continue recording positive performance as a result of increasing demand for superior industrial facilities, specifically targeting the expanding need for premium warehousing and logistics solutions in conveniently accessible locations beyond the conventional hub of Nairobi's Industrial Area and along Mombasa Road. This trend will unlock additional investment prospects within the industry, fostering further diversification of Kenya's Real Estate sector.
- Regulated Real Estate Funds
- Real Estate Investment Trusts (REITs)
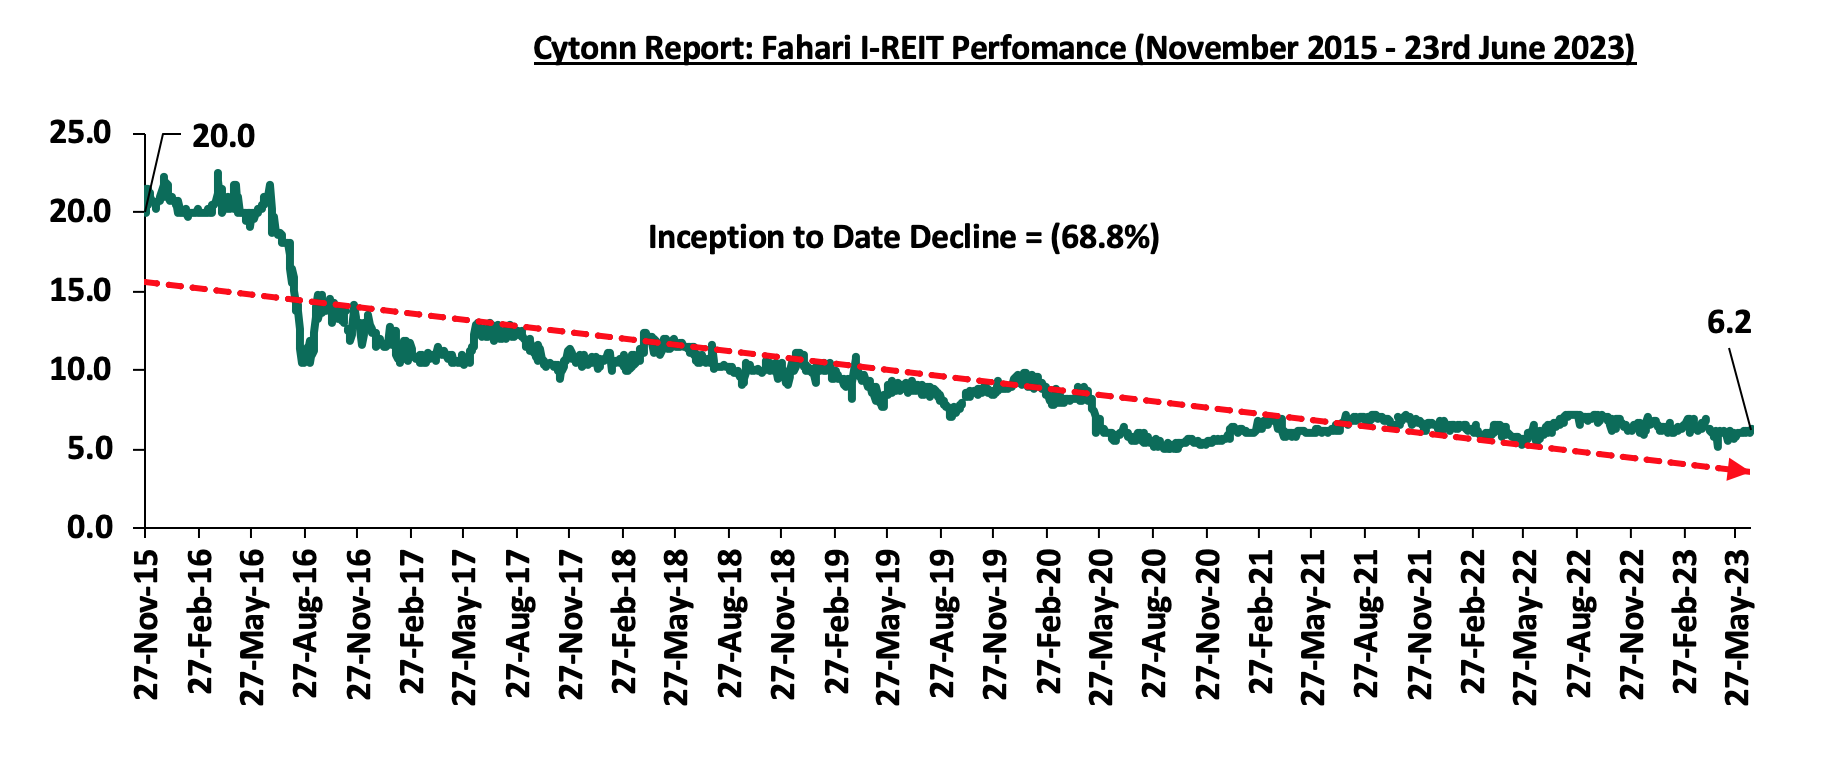
In the Nairobi Securities Exchange, ILAM Fahari I-REIT closed the week trading at an average price of Kshs 6.24 per share. The performance represented a 1.0% increase from Kshs 6.18 per share recorded the previous week, taking it to an 8.0% Year-to-Date (YTD) decline from Kshs 6.8 per share recorded on 3 January 2023. In addition, the performance represented a 68.8% Inception-to-Date (ITD) loss from the Kshs 20.0 price. The dividend yield currently stands at 10.5%. The graph below shows Fahari I-REIT’s performance from November 2015 to 23 June 2023;
In the Unquoted Securities Platform, Acorn D-REIT and I-REIT traded at Kshs 23.9 and Kshs 21.6 per unit, respectively, as at 23 June 2023. The performance represented a 19.4% and 8.0% gain for the D-REIT and I-REIT, respectively, from the Kshs 20.0 inception price. The volumes traded for the D-REIT and I-REIT came in at 12.3 mn and 30.1 mn shares, respectively, with a turnover of Kshs 257.5 mn and Kshs 620.7 mn, respectively, since inception in February 2021.
REITs provide numerous advantages, including; access to more capital pools, consistent and prolonged profits, tax exemptions, diversified portfolios, transparency, liquidity, and flexibility as an asset class. Despite these benefits, the performance of the Kenyan REITs market remains limited by several factors such as; i) insufficient investor understanding of the investment instrument, ii) time-consuming approval procedures for REIT creation, iii) high minimum capital requirements of Kshs 100.0 mn for trustees, and, iv) high minimum investment amounts set at Kshs 5.0 mn discouraging investments.
- Cytonn High Yield Fund (CHYF)
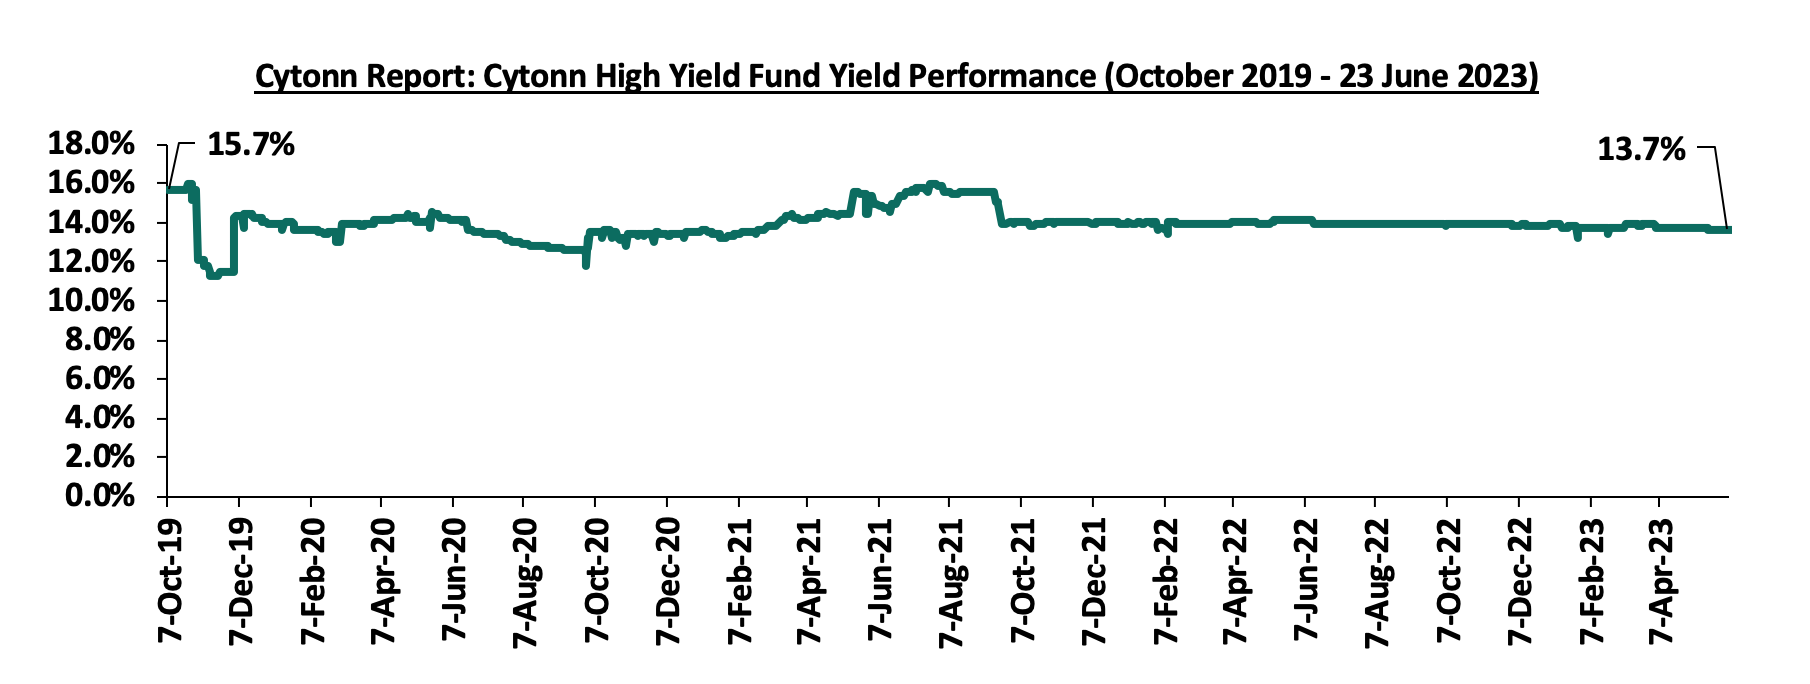
Cytonn High Yield Fund (CHYF) closed the week with an annualized yield of 13.7%, remaining relatively unchanged from the previous week. The performance also represented a 0.2% points Year-to-Date (YTD) decline from 13.9% yield recorded on 1 January 2023, and 2.0% points Inception-to-Date (ITD) loss from the 15.7% yield. The graph below shows Cytonn High Yield Fund’s performance from October 2019 to 23 June 2023;
Notably, the CHYF has outperformed other regulated Real Estate funds with an annualized yield of 13.7%, as compared to Fahari I-REIT and Acorn I-REIT with yields of 10.5%, and 6.8% respectively. As such, the higher yields offered by CHYF makes the fund one of the best alternative investment resource in the Real Estate sector. The graph below shows the yield performance of the Regulated Real Estate Funds:
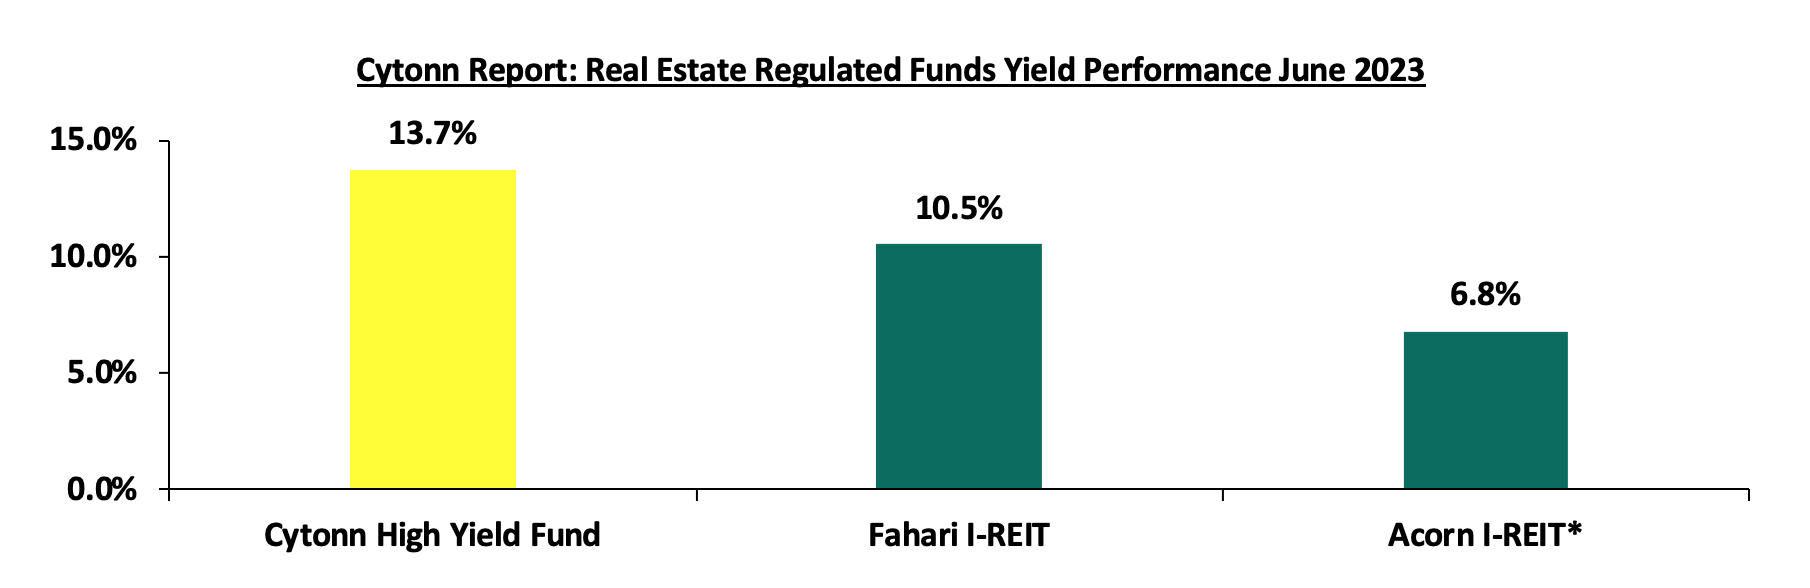
*FY’2022
Source: Cytonn Research
We expect the performance of Kenya’s Real Estate sector to remain on an upward trajectory, supported by factors such as; i) initiation and development of housing projects expected to boost the residential sector, ii) relatively positive demographics in the country increasing demand for housing, iii) the increasing number of visitor arrivals into the country expected to continue boosting performance of serviced apartments and hotels in the country, and, iv) positive performance in the industrial sector driven by increasing demand for superior industrial facilities. However, factors such as; i) the rising costs of construction which have led to the decline in construction activities on the back of rising inflation, ii) increase in pending approvals amid delays in processing construction permits owing to backlogs in registry systems, iii) limited investor knowledge in REITs, and, iv) an increase in gross non-performing loans advanced to the sector signifying elevated credit risk will continue to hinder optimal performance of the sector by limiting developments and investments.
On 15 June 2023, the National Treasury presented Kenya’s FY’2023/2024 National Budget, to the National Assembly highlighting that the total budget estimates for FY’2023/24 increased by 8.7% to Kshs 3.7 tn from the Kshs 3.4 tn in FY’2022/2023 while the total revenue inclusive of grants increased by 15.7% to Kshs 3.0 tn from the Kshs 2.6 tn in FY’2022/2023. The increase is mainly due to 17.3% increase in ordinary revenue to Kshs 2.6 tn for FY’2023/2024, from the Kshs 2.2 tn in FY’2022/23.
The FY’2023/2024 budget focuses mainly on providing solutions to the heightened concerns on the high cost of living, the measures put in to accelerate economic recovery as well as undertaking a growth-friendly fiscal consolidation to preserve the country’s debt sustainability. Notably, the government projects to narrow the fiscal deficit to 4.4% of GDP in FY’2023/24, from the estimate of 5.8% of GDP in FY’2022/23. As such, this week, we shall discuss the recently released budget and the tabled Finance Bill 2023 with a key focus on Kenya’s fiscal components. We shall do this in four sections, namely:
- FY’2022/2023 Budget Outturn as at May 2023,
- Comparison between FY'2022/2023 and FY'2023/2024 Budget estimates,
- Analysis and House-view on Key Aspects of the 2023 Budget,
- Key tax changes in the Finance Bill 2023 and their impact, and,
- Conclusion
Section I: FY’2022/2023 Budget Outturn as at May 2023
The National Treasury gazetted the revenue and net expenditures for the eleven months of FY’2022/2023, ending 31 May 2023. Below is a summary of the performance:
|
(Amounts in Kshs bn unless stated otherwise) |
||||||
|
Cytonn Report: FY'2022/2023 Budget Outturn - As at 31 May 2023 |
||||||
|
Item |
12-months Original Estimates
(A) |
Revised Estimates
(B) |
Actual Receipts/Release
(C) |
Percentage Achieved of the Revised Estimates
(D) = C/B |
Prorated
(E) = B *(11/12) |
% achieved of the Prorated
(F)= C / E |
|
Opening Balance |
0.6 |
|||||
|
Tax Revenue |
2,071.9 |
2,108.3 |
1,740.4 |
82.5% |
1,932.6 |
90.1% |
|
Non-Tax Revenue |
69.7 |
83.7 |
71.1 |
85.0% |
76.7 |
92.8% |
|
Total Revenue |
2,141.6 |
2,192.0 |
1,812.2 |
82.7% |
2,009.3 |
90.2% |
|
External Loans & Grants |
349.3 |
520.6 |
311.8 |
59.9% |
477.2 |
65.3% |
|
Domestic Borrowings |
1,040.5 |
886.5 |
464.7 |
52.4% |
812.6 |
57.2% |
|
Other Domestic Financing |
13.2 |
13.2 |
15.5 |
117.4% |
12.1 |
128.0% |
|
Total Financing |
1,403.0 |
1,420.3 |
792.0 |
55.8% |
1,302.0 |
60.8% |
|
Recurrent Exchequer issues |
1,178.4 |
1,266.0 |
975.1 |
77.0% |
1,160.5 |
84.0% |
|
CFS Exchequer Issues |
1,571.8 |
1,552.9 |
1,130.1 |
72.8% |
1,423.5 |
79.4% |
|
Development Expenditure & Net Lending |
424.4 |
393.8 |
191.1 |
48.5% |
361.0 |
52.9% |
|
County Governments + Contingencies |
370.0 |
399.6 |
305.3 |
76.4% |
366.3 |
83.3% |
|
Total Expenditure |
3,544.6 |
3,612.3 |
2,601.6 |
72.0% |
3,010.3 |
86.4% |
|
Fiscal Deficit excluding Grants |
1,403.0 |
1,420.3 |
789.5 |
55.6% |
1,302.0 |
60.6% |
|
Fiscal Deficit as a percentage of GDP |
|
|
5.9% |
|
|
|
|
Total Borrowing |
1,389.8 |
1,407.1 |
776.4 |
55.2% |
1,289.9 |
60.2% |
The key take-outs from the report include:
- Total revenue collected as at the end of May 2023 amounted to Kshs 1,812.2 bn, equivalent to 82.7% of the revised estimates of Kshs 2,192.0 bn for FY’2022/2023 and is 90.2% of the prorated estimates of Kshs 2,009.3 bn. We note that the government has not been able to meet its prorated revenue targets eleven months into the FY’2022/2023, partly attributable to the tough macroeconomic environment in the country as a result of elevated inflationary pressures with May 2023 inflation rate coming in at 8.0%, above the CBK target range of 2.5%-7.5%. Cumulatively, tax revenues amounted to Kshs 1,740.4 bn, equivalent to 82.5% of the revised estimates of Kshs 2,108.3 bn and 90.1% of the prorated estimates of Kshs 1,932.6 bn.
- Total financing amounted to Kshs 792.0 bn, equivalent to 55.8% of the revised estimates of Kshs 1,420.3 bn and is equivalent to 60.8% of the prorated estimates of Kshs 1,302.0 bn. Additionally, domestic borrowing amounted to Kshs 464.7 bn, equivalent to 52.4% of the revised estimates of Kshs 886.5 bn and is 57.2% of the prorated estimates of Kshs 812.6 bn,
- The total expenditure amounted to Kshs 2,601.6 bn, equivalent to 72.0% of the revised estimates of Kshs 3,612.3 bn, and is 86.4% of the prorated expenditure estimates of Kshs 3,010.3 bn. Additionally, the net disbursements to recurrent expenditures came in at Kshs 975.1 bn, equivalent to 77.0% of the revised estimates of Kshs 1,266.0 bn and 84.0% of the prorated estimates of Kshs 1,160.5 bn, and development expenditure amounted to Kshs 191.1 bn, equivalent to 48.5% of the revised estimates of Kshs 393.8 bn and is 52.9% of the prorated estimates of Kshs 361.0 bn. Further, Consolidated Fund Services (CFS) Exchequer issues came in at Kshs 1,130.1 bn, equivalent to 72.8% of the revised estimates of Kshs 1,552.9 bn, and 79.4% of the prorated amount of Kshs 1,423.5 bn.
- Total Borrowings as at the end of May 2023 amounted to Kshs 776.4 bn, equivalent to 55.2% of the revised estimates of Kshs 1,407.1 bn for FY’2022/2023, and are 64.4% of the prorated estimates of Kshs 1,134.2 bn. The cumulative domestic borrowing target of Kshs 886.5 bn comprises of adjusted Net domestic borrowings of Kshs 425.1 bn and Internal Debt Redemptions (rollovers) of Kshs 461.4 bn,
- The cumulative public debt servicing cost amounted to Kshs 1,019.8 bn which is 74.9% of the revised estimates of Kshs 1,361.0 bn, and is 89.9% of the prorated estimates of Kshs 1,134.2 bn. Notably, the Kshs 1,019.8 bn debt servicing cost is equivalent to 56.3% of the actual revenues collected as at the end of May 2023, which is 26.3% points above IMF’s recommended threshold of 30.0%. As such, the current budget deficit is 5.9% of GDP, 0.1% points above the government's projected budget deficit of 5.8% of GDP in FY'2022/2023, further emphasizing on how much public debt servicing weighs on the country’s expenditure.
The government has been unable to meet its revenue targets for the eleven months of the FY’2022/2023, mainly on the back of the tough economic situation exacerbated by the elevated inflationary pressures that have remained above the CBK target range of 2.5%-7.5%, with the year on year inflation rate in May 2023 coming in at 8.0%, up from 7.9% recorded in April 2023. But it is good to n ote that the absorption rate has also remained below the pro rated amounts. As such, the government is yet to fully benefit from the strategies put in place to improve revenue collection such as expanding the revenue base and sealing tax leakages, and suspension of all tax relief payments. However, we believe that the current measures such as the expected implementation of the Finance Bill 2023 that will lead to the upward readjustment of the Excise Duty Tax, Income Tax as well as the Value Added Tax will play a big role in expanding the tax base and consequently enhance revenue collection.
Section II: Comparison between FY’2022/2023 and FY’2023/2024 Budgets estimates
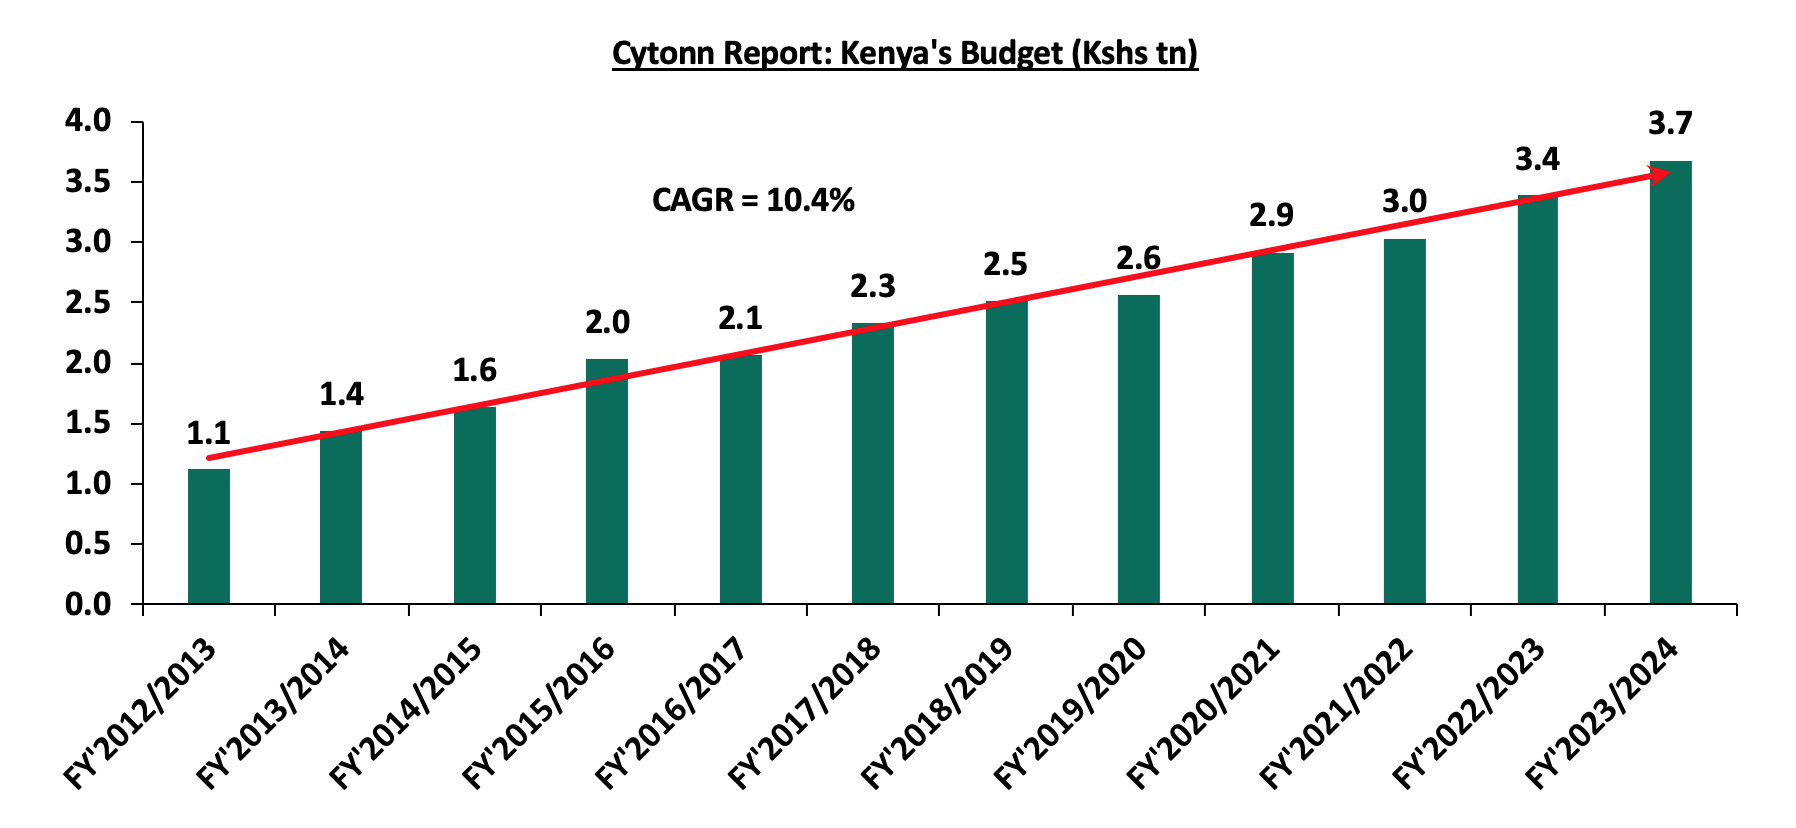
The Kenyan Government budget has been growing over the years on the back of increasing recurrent and development expenditures. The chart below shows the evolution of the government budget over an eleven-year period:
Source: National Treasury of Kenya
For the FY’2023/2024, the budget is projected to increase by 8.7% to Kshs 3.7 tn, from Kshs 3.4 tn in FY’2022/2023. The expenditure will be funded by revenue collections of Kshs 3.0 tn and borrowings amounting to Kshs 718.0 bn.
The table below summarizes the key buckets and the projected changes:
|
(Amounts in Kshs billions unless stated otherwise) |
|||
|
Cytonn Report: Comparison between FY’2022/2023 and FY’2023/2024 Budgets Estimates |
|||
|
Item |
FY'2022/23 Supplementary Budget I |
FY'2023/24 Estimates |
Change y/y (%) |
|
Ordinary Revenue |
2,192.0 |
2,571.2 |
17.3% |
|
Total Appropriation-in-Aid |
336.8 |
348.7 |
3.5% |
|
Total grants |
31.4 |
42.2 |
34.2% |
|
Total Revenue & Grants |
2,560.3 |
2,962.0 |
15.7% |
|
Recurrent expenditure |
1,498.7 |
1,564.9 |
4.4% |
|
Recurrent Consolidated Funds Services (CFS) |
867.8 |
986.2 |
13.6% |
|
Development expenditure |
618.2 |
743.5 |
20.3% |
|
County Transfer & Contingencies |
399.6 |
385.4 |
(3.5%) |
|
Total expenditure |
3,384.3 |
3,680.0 |
8.7% |
|
Fiscal deficit inclusive of grants |
(824.0) |
(718.0) |
(4.2%) |
|
Projected Deficit as % of GDP |
(5.8%) |
(4.4%) |
(1.4%) points |
|
Net foreign borrowing |
395.8 |
131.5 |
(66.8%) |
|
Net domestic borrowing |
428.3 |
586.5 |
37.0% |
|
Total borrowing |
824.0 |
718.0 |
(12.9%) |
|
Source: Financial Statement For the FY 2023/2024-Budget , The Mwananchi Guide for the FY’2023/24 National Treasury of Kenya |
|||
Some of the key take-outs include;
- The government projects total revenue inclusive of grants for FY’2022/23 to increase by 15.7% to Kshs 3.0 tn (equivalent to 18.2% of GDP), from the Kshs 2.6 tn in FY’2022/2023 (equivalent to 17.5% of GDP). The increase is mainly due to a 17.3% increase in ordinary revenue to Kshs 2.6 tn (equivalent to 15.8% of GDP) for FY’2023/2024, from the Kshs 2.2 tn in FY’2022/23 (equivalent to 15.3% of GDP),
- Total expenditure is set to increase by 8.7% to Kshs 3.7 tn (equivalent to 22.6% of GDP), from Kshs 3.4 tn (equivalent to 23.9% of GDP) in the FY’2022/23 Budget estimates,
- Recurrent expenditure is set to increase by 4.4% to Kshs 1.6 tn in FY’2023/2024, from Kshs 1.5 tn in the FY’2022/2023 budget estimates, while Consolidated Funds Services (CFS) expenditure is expected to increase by 13.6% to Kshs 986.2 bn, from Kshs 867.8 bn in the FY’2022/2023 budget estimates. Also, Development expenditure is set to increase by 20.3% to Kshs 743.5 bn, from Kshs 618.2 bn in the FY’2022/2023 budget estimates,
- Public debt is expected to continue growing in FY’2023/24, as the approximate Kshs 718.0 bn fiscal deficit will be financed through domestic debt totaling Kshs 586.5 bn and foreign debts totaling Kshs 131.5 bn. However, the total borrowing is expected to reduce by 12.9% to Kshs 718.0 bn in the FY’2023/24, from Kshs 824.0 bn as per the FY’2022/2023 supplementary budget, in a bid to reduce Kenya’s public debt burden which was estimated at 64.7% of GDP as of March 2023, surpassing the 50.0% recommended threshold by 14.7% points, and,
- The budget deficit is projected to decline by 1.4% points to 4.4% of GDP, from the 5.8% of GDP in the FY’2022/2023 budget, mainly as growth in revenues outpace growth in expenditure.
Section III: Analysis and House-view on Key Aspects of the FY’2022/2023 Budget
- Revenue
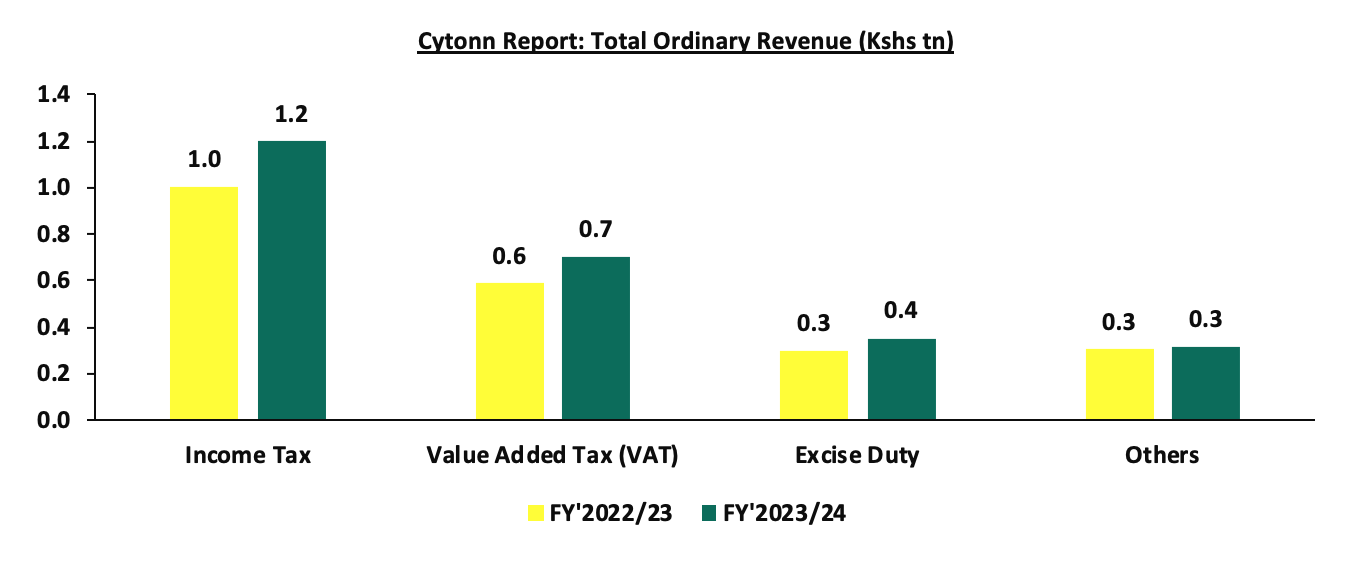
Revenue is projected to increase by 15.7% to Kshs 3.0 tn in FY’2023/24, from Kshs 2.6 tn in the FY’2022/23 supplementary budget. The increased revenue projections in the FY’2023/24 are mainly attributable to the projected 17.3% growth in ordinary revenue to Kshs 2.6 tn in FY’2023/24, from Kshs 2.2 tn in the FY’2022/23 budget. The main sources of revenue will be:
- Income Tax, which remains the highest contributor to government revenue, contributing 40.5% of the total revenue projections of Kshs 3.0 tn, is expected to increase by 19.3% to Kshs 1.2 tn in FY’2023/24, from Kshs 1.0 tn in FY’2022/2023,
- Value Added Tax (VAT) contributing 23.7% of the projected revenue collections is projected to increase by 19.7% to Kshs 703.3 bn in FY’2023/24 budget, from Kshs 587.7 bn in the FY’2022/23 budget, and,
- Excise Duty contributing 11.9% to the projected revenues for the FY’2023/24 is expected to increase by 18.7% to Kshs 352.7 bn, from Kshs 297.2 bn in FY’2023/24 budget estimates.
The chart below compares ordinary revenue projections for FY’2023/24 and FY’2022/23:
The government relies on the effectiveness of the Kenya Revenue Authority in collecting taxes as well as increase in some of the existing taxes to meet its revenue target. Historically, the government has struggled to meet its target revenue collections resulting to an ever-present fiscal deficit. As such, there are still concerns about the government's ability to meet its revenue collection targets in FY’2023/2024, on the back of the current operating environment. The business environment has deteriorated with the average PMI for the first 5 months in 2023 coming at 48.9 below the 50-mark threshold, mainly occasioned by high inflationary pressures and the rising interest rates. The chart below shows the ordinary revenue performance in the previous fiscal years:
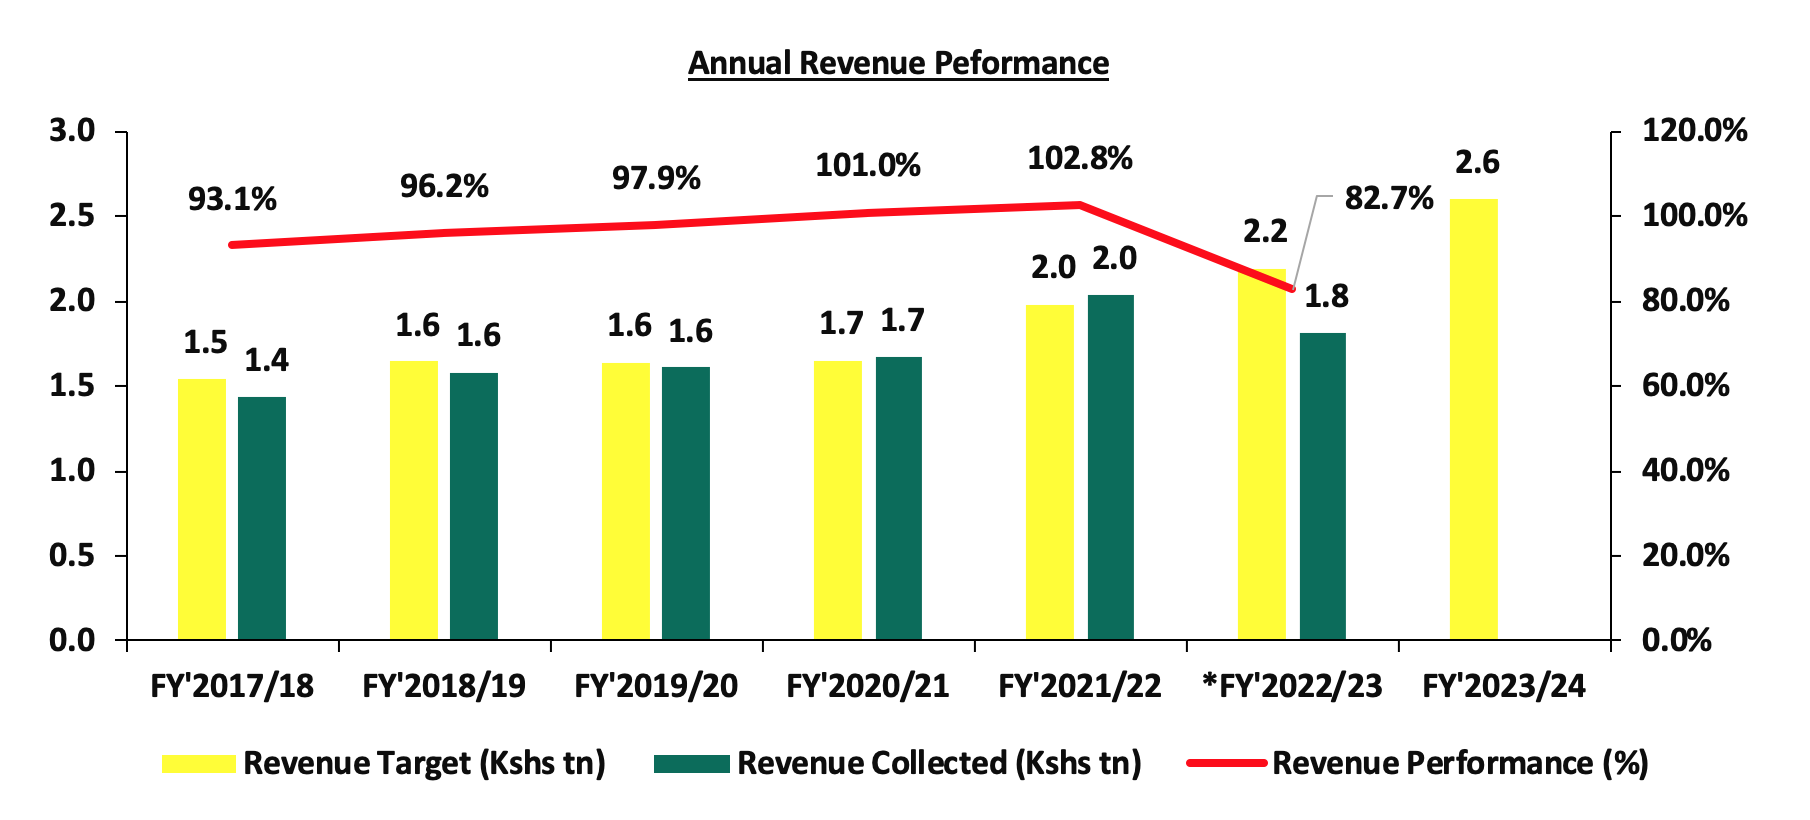
Source: National Treasury of Kenya and Kenya Revenue Authority
*Total Revenue collection as of 31 May 2022
- Expenditure
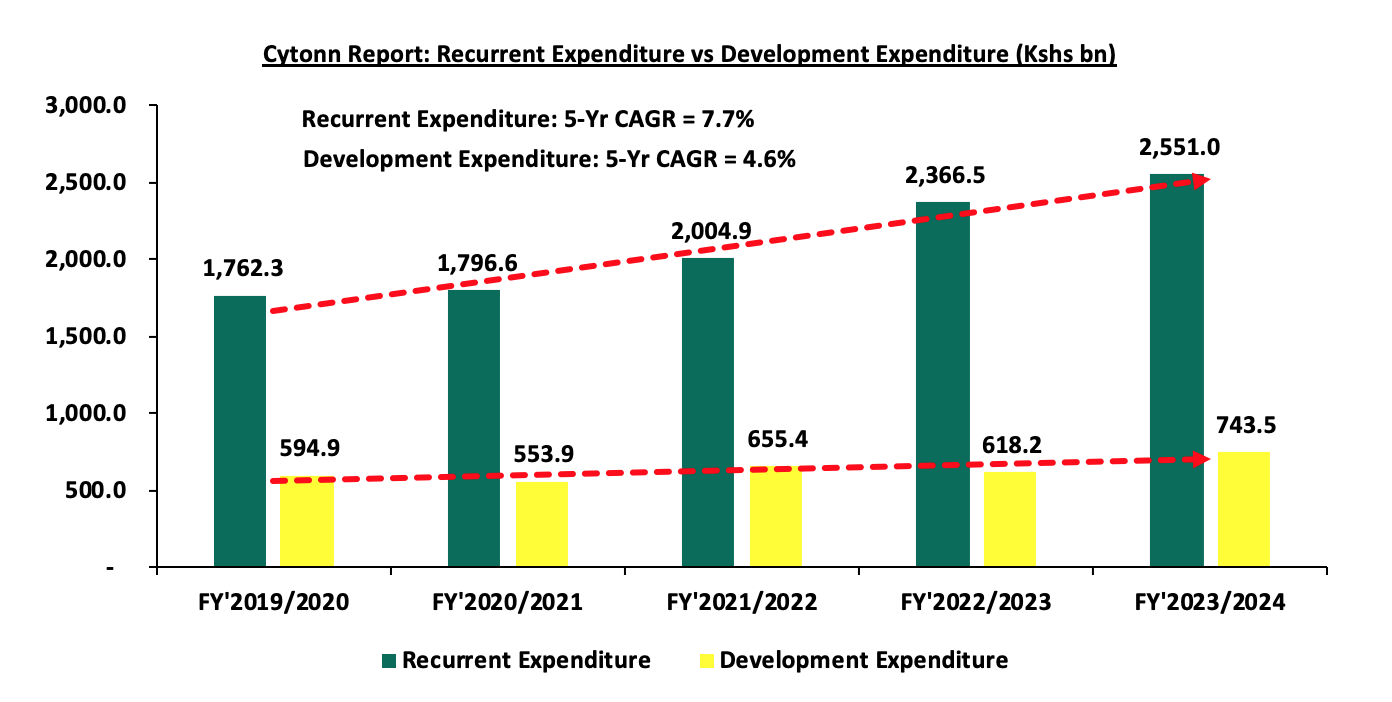
Expenditure is expected to increase by 8.7% to Kshs 3.7 tn, from Kshs 3.4 tn in the FY’2022/23 budget with recurrent expenditure taking up 69.3% of the total expenditure for FY’2023/2024, in comparison to the 69.9% in FY’2022/2023. The chart below shows the comparison between the recurrent expenditure allocations and development expenditure allocations over the past five fiscal years:
*Recurrent Expenditure includes the Consolidated Fund Services (CFS) Expenditure
Some of the key take-outs include;
- Recurrent expenditure takes the largest proportion of government expenditure over the last five fiscal years growing at a 5-year CAGR of 7.7% to Kshs 2,551.0 bn in FY’2023/24, from Kshs 1,762.3 bn in FY’2019/2020. For the FY’2023/2024, the recurrent expenditure increased by 7.8% to Kshs 2,551.0 bn, from Kshs 2,366.5 bn in FY’2022/2023 mainly due to a 13.6% increase in Consolidated Fund Services (CFS) expenditure to Kshs 986.2 bn from Kshs 867.8 bn in FY’2022/2023. The increase can be mainly attributed to the increased debt servicing cost which represented 88.5% of the CFS FY’2022/2023 budgetary allocation. We expect the debt servicing cost to continue increasing as the Kenyan shilling depreciates against the dollar, given that 67.3% of the country’s external debt is denominated in US Dollars as of March 2023, and,
- Development expenditure on the other hand continues to lag behind contributing only 20.2% of the FY’2023/24 expenditure estimates. Allocation to infrastructure remains the highest taking 63.0% of the development expenditure. In the FY’2023/2024, infrastructure expenditure is set to increase by 12.4% to Kshs 468.2 bn, from Kshs 416.4 bn in FY’2022/2023 in line with the government’s agenda of increasing the development of critical infrastructure in the road, rail, energy, and water sectors in order to open many areas to economic activities and spur growth in other sectors of the economy. The table below shows the sectors with the highest expenditure allocation over the last five fiscal years:
|
(Amounts in Kshs billions unless stated otherwise) |
|||||||
|
Cytonn Report: Kenya Budget Highest Expenditure Allocations |
|||||||
|
Item |
FY'2019/2020 |
FY'2020/2021 |
FY'2021/2022 |
FY'2022/2023 |
FY'2023/2024 |
Change |
CAGR |
|
Interest Payments, pensions & Net Lending |
553.3 |
586.5 |
718.3 |
867.8 |
986.2 |
13.6% |
12.3% |
|
Education |
494.8 |
505.1 |
503.9 |
544.4 |
628.6 |
15.5% |
4.9% |
|
Infrastructure |
435.1 |
363.3 |
383.3 |
416.4 |
468.2 |
12.4% |
1.5% |
|
County shareable Revenue |
310.0 |
316.5 |
370.0 |
399.6 |
385.4 |
(3.5%) |
4.5% |
|
Public Admin & Int. Relations |
298.9 |
289.3 |
299.7 |
342.2 |
327.0 |
(4.4%) |
1.8% |
|
Total |
2,092.1 |
2,060.7 |
2,275.2 |
2,570.4 |
2,795.4 |
8.8% |
6.0% |
Source: The Mwananchi Guide for the FY’2023/24 National Treasury of Kenya
Notably, the allocation to interest payment, pension and net lending increased by 13.6% to Kshs 986.2 bn in FY’2023/24 from Kshs 867.8 bn in FY’2023/24, partly attributable to high cost of servicing debt.
- Borrowing
The total borrowing for the FY’2023/24 is set to reduce by 12.9% to Kshs 718.0 bn, from Kshs 824.0 bn, in FY’2022/23 budget estimates. The public debt mix is projected to comprise of 18.3% foreign debt and 81.7% domestic debt, from 48.0% foreign financing and 52.0% domestic financing as per the FY’2022/23 budget. The debt servicing costs are set to rise by 19.4% to Kshs 1.6 tn in FY’2023/24, from Kshs 1.4 n in the FY’2022/23 budget. The rise in debt servicing expenses can be partly attributable to the depreciation of the Kenyan shilling given that a larger proportion of external debt is denominated in US dollars. The chart below shows the evolution of public borrowing to fill the fiscal deficit gap over the last five years:
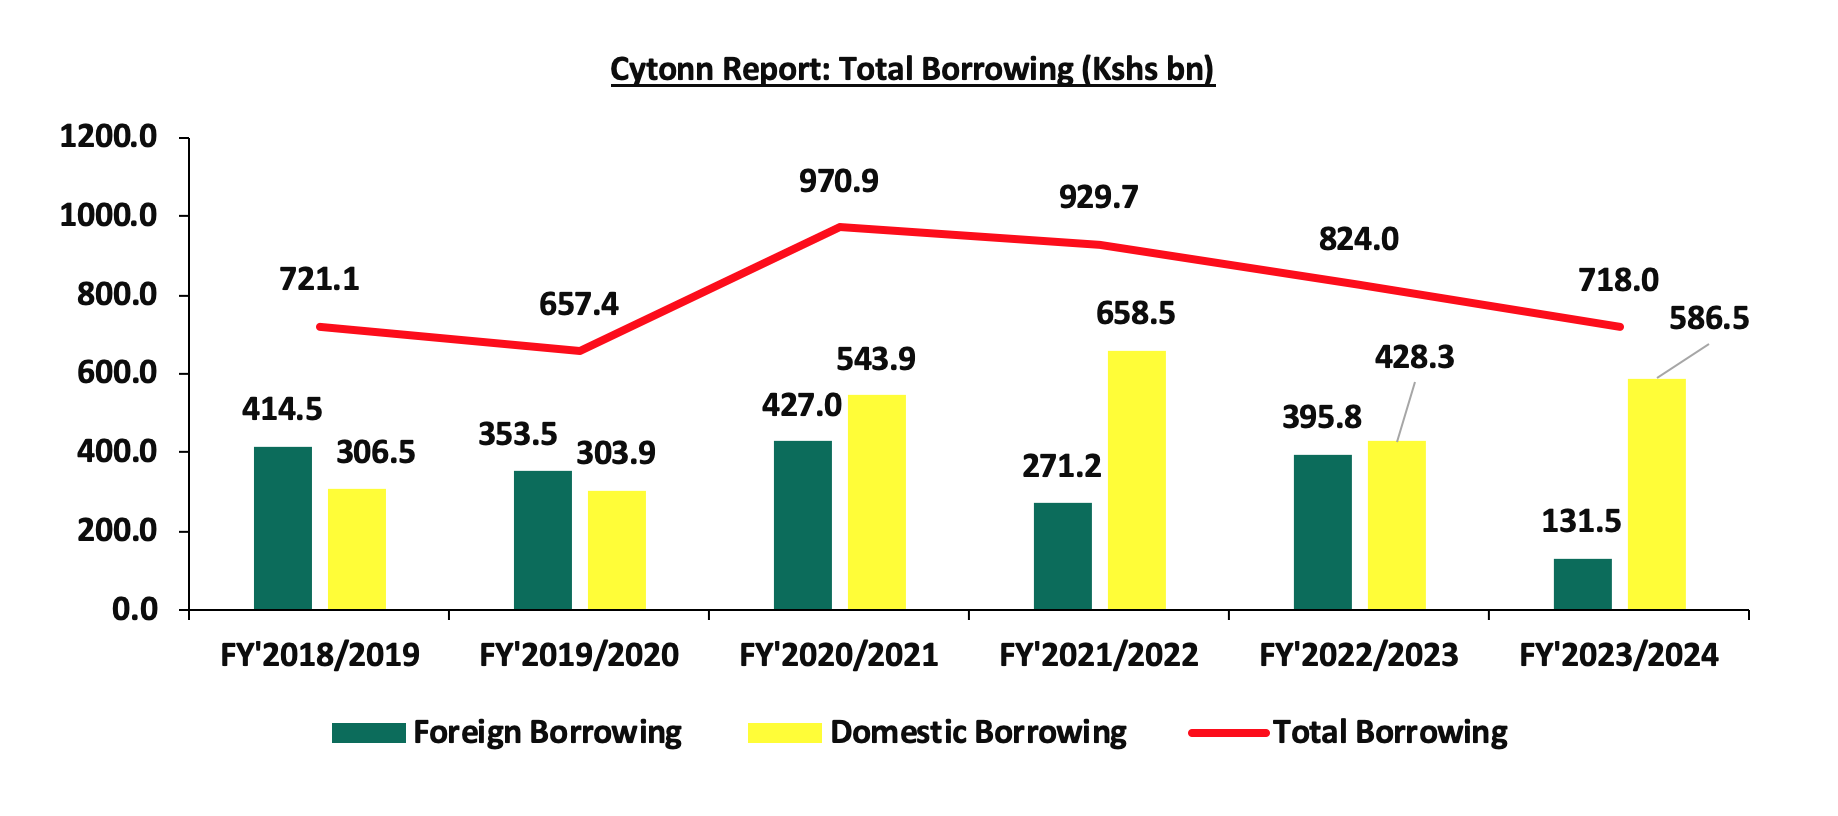
The key take-outs from the chart include:
- The proportion of foreign financing has been declining over time standing at 18.3% in FY’2023/24 from 57.5% in FY’2018/2019. The decline is expected to reduce Kenya’s exposure to external shocks, as the less we owe in foreign currency, the less exposed we are to any shocks in the foreign markets. However, the increased domestic borrowing by the government may lead to slow growth in the private sector lending as banks prefer lending to the government as opposed to the private sector which is considered riskier, and,
- The total borrowing has been declining in the last four years, reflecting the government’s fiscal consolidation efforts aimed at reducing the fiscal deficit and dependence on debt through rationalization of tax expenditures and ensuring the sustainability and value for money from the available resources.
We therefore note the persistent fiscal deficit is mainly on the back of low revenue collection and high expenditure. As such, the government needs to minimize spending through the implementation of structural reforms and the reduction of amounts extended to recurrent expenditure. This would allow the government to refinance other critical sectors, such as agriculture, resulting in increased revenue.
Section IV: Key Tax changes in the Finance Bill and their impact
The Cabinet Secretary for the National Treasury tabled the Finance Bill 2023 in Parliament for discussion and consideration. The proposed tax measures in the Finance Bill 2023 are expected to add about Kshs 379.2 bn to the exchequer for the fiscal year 2023/24. The bill was passed by Parliament following the third reading and now awaits the president's assent, after which the provisions will take effect. Among the proposals are:
Under the Income Tax Act;
- Introduction of withholding tax (WHT) on Payments made in respect of digital content monetization. The Finance Bill 2023 had proposed introduction of 15.0% WHT on collections made by digital content creators, however the finance committee made an amendment to the clause by capping the WHT at 3.0%. The government move to introduce the WHT on digital content is attributable to the growing popularity of digital content creation in Kenya due to increase access to internet, digital marketing and the growing youthful population, as such it will enable the government to widen its tax base,
- The Finance Bill 2023, introduced a new contribution to the National Housing Development Fund (NHDF). Initially, the bill had proposed a 3.0% deduction from employees’ basic monthly salary with the employer matching the contribution. However, the finance committee recommended a downward revision of the rate to 1.5% deduction from employees’ basic monthly salary, with the employer matching the contribution. Additionally, the committee proposed the removal of the maximum limit of individual contributions, and the contributors will not access their contributions at the end of the 7 years as earlier proposed,
- Introduction of a new tax at a rate of 15.0% for repatriated profit for non-residents who do not distribute dividends in Kenya, equivalent to the rate charged on dividend paid to non-residents,
- The Finance Bill 2023 proposes to change the bands for Turnover Tax (ToT) to a range of Kshs 500,000.0 to Kshs 25.0 mn from the current Kshs 1.0 mn to Kshs 50.0 mn. Additionally, the bill proposes to increase the turnover tax to 3.0%, from the current 1.0%. The move by the government to increase the turnover tax is mainly to increase its revenue,
- The bill also proposes reduction of the rate of Residential Rental Income tax to 7.5% from the current 10.0% in a bid to promote compliance of property owners and boost the government’s revenue collection,
- The Finance bill 2023 proposes to introduce a 5.0% WHT on payments made to residents’ persons or permanent establishments in respect to sales promotions, marketing and services. The move is to enhance compliance in the industry by tracking the revenues earned by the respective service providers and enhance compliance, and,
- The Finance Bill 2023, proposes to introduce two new tax band; i) 32.5% for monthly incomes between Kshs 500,000.0 and 800,000.0, and, ii) 35.0% for monthly incomes above Kshs 800,000.0. A move aimed at increasing the tax revenue to support the fiscal budget. However, with majority of Kenyans earning less than Kshs 100,000.0 per month, its impact on the tax revenue will be very negligible.
Under the Excise Duty Act;
- The Finance Bill 2023 proposes to repeal annual inflation adjustment, which currently the commissioner general has the power to adjust the specific rate of excise duty once per year to consider inflation. The proposal is a welcomed move since it will provide much-needed certainty for business planning,
- The finance bill 2023 proposes the introduction of excise duty on imported sugar at the rate of Kshs 5.0 per kg excluding the sugar imported or purchased locally for use in the manufacture of pharmaceutical products,
- The Finance bill 2023, proposes an introduction of 0% excise duty on fees charged on the advertisement on alcoholic beverages, betting, gaming, and lottery and prize competition, a move aimed at discouraging consumption of the services deemed inimical to citizens,
- The Finance bill 2023 proposes the introduction of excise duty on imported fish at Kshs 100,000.0 per metric ton or 10.0% of the value, a move aimed at protecting the local fishing industry,
- The bill proposes to introduce a fine of Kshs 5.0 mn or a jail term not exceeding 3 years upon conviction to offenses relating to excise stamps. A proposal aimed at curbing illicit trade in excisable goods and encourage compliance that may support revenue collection by the government, and,
- The bill proposes to decrease excise duty on telephone, internet, and fees charged on money transfer services agencies and other financial services to 15.0% from the current 20.0%. This proposal is aimed at increasing the affordability of mobile devices and promote accessibility to these services.
Under the Value Added Tax Act;
- The Finance Bill 2023 proposes to subject petroleum products excluding liquid petroleum gas (LPG) to a VAT at a standard rate of 16.0%, up from the 8.0% introduced in 2018, this was after a transition clause that provided for an exemption of VAT for such products for a period of 2 years expired. The proposed move is expected to increase the cost of production, given that fuel is a major input in most businesses. As such the cost of living is expected to rise given that producers will pass the cost to consumers through hike in consumer prices. On the other hand, the bill proposed the zero rate on LPG products to lower their cost, and,
- The bill also proposes the removal of VAT for Aircraft, parts and engines as part of the government's bid to support the aviation sector and improve the profitability of the airlines.
Given the tight fiscal space, the Finance Bill 2023 aims to shore tax revenue which is expected to support the 3.7 tn budget for FY’2023/2024. The government intends to mobilize ordinary revenue of Kshs 2.6 tn, 17.3% increase from the 2.2 tn in FY’2022/23. As such, the government will have a fiscal deficit inclusive of grants of Kshs 718.0 bn. However, we expect the increase and introduction of additional taxes in addition to the changes in National Health Insurance Fund (NHIF) contributions and the new contribution requirement in the National Social Security Fund (NSSF) to severely impact households’ disposable income.
Section IV: Conclusion
The Kenyan economy has continued to remain resilient despite recording a slowdown in growth to 4.8% in 2022 compared to a growth of 7.6% recorded in 2021. The slowdown was partly attributable to the uneven weather patterns experienced in 2022, which impacted agricultural production, given agriculture is the main contributor to the GDP. However, the economy is expected to rebound in 2023 and expand by 5.5%, mainly supported by private sector growth, continued strong growth of the financial services sector, and recoveries in the agricultural sector. Furthermore, in the FY’2023/2024 budget, the government has allocated Kshs 4.5 bn for the fertilizer subsidy program aimed at lowering the cost of farm input and enhance food supply in the country.
The government has reduced its appetite for foreign debt, projecting to borrow Kshs 131.5 bn in foreign debt in the FY’2023/24, a 66.8% decrease from 395.8 billion in the FY’2022/23. The move is expected to lower the cost of debt servicing, given that foreign debt has been ballooning as a result of the Kenya shilling's sustained depreciation against major currencies. However, the government's shift to borrow more domestically, by projecting to increase its domestic borrowing by 37.0% to Kshs 586.5 bn in FY’2023/24, from Kshs 428.3 bn in FY’2022/23, is expected to have an impact on credit to the private sector. This is mainly because bank’s view lending to the government as more secure than lending to the private sector in order to minimize losses given the elevated credit risk.
Overall, we are of the view that the main driver of the growing public debt is the fiscal deficit occasioned by lower revenues as compared to expenditures. As a result, implementing robust fiscal consolidation would help the government bridge the deficit gap. This can be achieved by minimizing spending through the implementation of structural reforms and the reduction of amounts extended to recurrent expenditure. Fiscal consolidation would also allow the government to refinance other critical sectors, such as agriculture, resulting in increased revenue. However, the overall risk to the economy remains high, owing to the high debt servicing costs in the next fiscal year given the maturing USD 2.0 bn Eurobond due in June 2024.
Disclaimer: The views expressed in this publication are those of the writers where particulars are not warranted. This publication, which is in compliance with Section 2 of the Capital Markets Authority Act Cap 485A, is meant for general information only and is not a warranty, representation, advice or solicitation of any nature. Readers are advised in all circumstances to seek the advice of a registered investment advisor.

- Talk to us
- Kenya
- P.O Box 20695 - 00200, Nairobi, Kenya
- Cell +254709101200
- Tel +254709101200
- WhatsApp +254741676635
- United States
- +254709101200
- DOWNLOAD OUR APP
-


- Kenya
- 8th Floor, Pinetree Plaza, Kaburu Drive, Ngong Road, Nairobi, Kenya
- USA
- Suite 1150, 1775 Eye Street NW, USA, Washington DC 20006, USA
- Investments
- High Yield
- Private Equity
- Real Estate
- Real Estate
- RiverRun Estates
- Cytonn Towers
- The Ridge
- Taraji Heights
- The Alma