Kenya’s Public Debt 2022; Debt Service Coverage, & Cytonn Weekly #29/2022
By Cytonn Research, Jul 24, 2022
Executive Summary
Fixed Income
During the week, T-bills remained oversubscribed, with the overall subscription rate coming in at 144.1%, an increase from the 105.8% recorded the previous week. The increase in the subscription rate was partly attributable to investors’ preference for the shorter dated papers as they sought to avoid duration risk coupled with ample liquidity in the money market with the average interbank rates declining to 5.3% from 5.6% recorded the previous week. Investors’ preference for the shorter 91-day paper persisted, with the paper receiving bids worth Kshs 13.5 bn against the offered Kshs 4.0 bn, translating to a subscription rate of 388.4%, an increase from the 329.8% recorded the previous week. The subscription rate for the 182-day paper also increased to 146.5% from 50.9% while that of the 364-day paper declined to 44.0% from 71.1% recorded the previous week. The yields on the government papers recorded mixed performance, with the yields on the 182-day and the 91-day papers increasing by 8.8 bps and 7.4 bps to 9.4% and 8.3%, respectively, while the yields on the 364-day paper declined by 1.8% bps to 10.0%. In the Primary Bond Market, the Central Bank of Kenya released results for the recently re-opened bonds; FXD2/2013/15 and FXD2/2018/15. The bonds recorded an undersubscription of 26.4% with the government receiving bids worth Kshs 10.6 bn against the offered Kshs 40.0 bn.
Additionally during the week, the International Monetary Fund (IMF) completed Kenya’s third review of the 38-month Extended Fund Facility (EFF) and Extended Credit Facility (ECF) - funded program, allowing for an immediate disbursement of USD 235.6 mn (Kshs 27.9 bn). We are projecting the y/y inflation rate for July 2022 to fall within the range of 7.7%-8.1%, with a bias towards a slight decline from the 7.9% recorded in July, mainly driven by high fuel and increasing food prices;
Equities
During the week, the equities market was on a downward trajectory with NASI, NSE 20 and NSE 25 declining by 4.0%, 0.4% and 1.9%, respectively, taking their YTD performance to losses of 18.3%, 12.4% and 16.1%, for NASI, NSE 20 and NSE 25, respectively. The equities market performance was mainly driven by losses recorded by large-cap stocks such as Safaricom, Bamburi, KCB Group and ABSA Bank of 7.8%, 7.1%, 4.8% and 3.7%, respectively. The losses were however mitigated by gains recorded by stocks such as BAT, EABL, NCBA Group and Co-operative Bank which recorded gains of 5.1%, 2.9%, 1.9% and 1.8%, respectively;
Real Estate
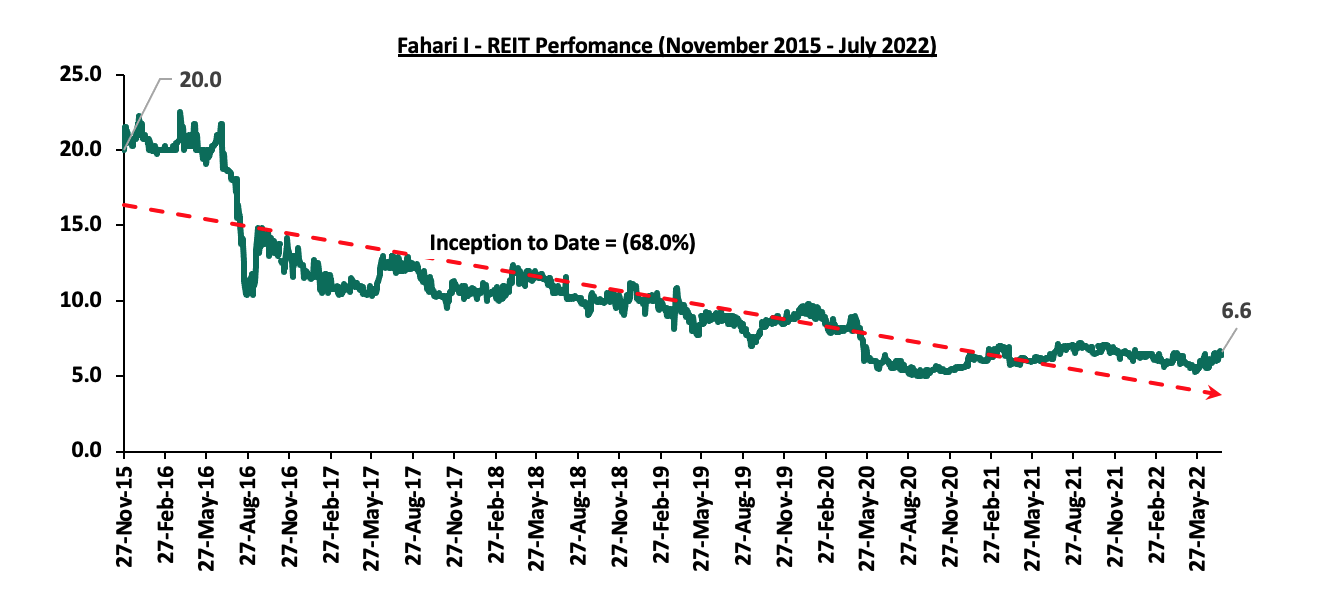
During the week, the African Development bank (AfDB) approved USD 150.0 mn (Kshs 17.7 bn) to be used in the rehabilitation of the Nairobi – Nakuru – Mau Summit Highway totaling 232.8 Km. Additionally, President Uhuru Kenyatta commissioned the rehabilitation of the Nairobi-Suguta-Maralal Road worth Kshs 1.1 bn. In Listed Real Estate, the Fahari I-REIT released its H1’2022 results highlighting a 104.1% increase in the net earnings to Kshs 86.2 mn, from the 42.4 mn recorded in H1’2021. Additionally, the I-REIT announced plans to sell some of its assets with an aim to increase its returns from its property investments. Assuming a distribution of 90.0% of its earnings, the annualized dividend yield would be 7.6%. In the Nairobi Stock Exchange, the I-REIT closed the week trading at an average price of Kshs 6.6 per share;
Focus of the Week
Over the years, Kenya’s debt level has been a point of discussion with institutions such as World Bank and the International Monetary Fund (IMF) stressing on the need for Kenya to focus on fiscal consolidation on the back of the high risk of debt distress. As of May 2022, Kenya’s debt to GDP ratio stood at 69.1%, 19.1% points above IMF’s recommended threshold of 50.0% for developing countries while debt service to revenue ratio stood at 50.0%, 20.0% points above IMF’s recommended threshold of 30.0% as of December 2021. Notably, the country’s debt servicing costs continues to increase with the costs representing 40.7% of the total expenditure in FY’2020/2021;
Investment Updates:
- Weekly Rates:
- Cytonn Money Market Fund closed the week at a yield of 10.52%. To invest, dial *809# or download the Cytonn App from Google Playstore here or from the Appstore here;
- Cytonn High Yield Fund closed the week at a yield of 13.93% p.a. To invest, email us at sales@cytonn.com and to withdraw the interest, dial *809# or download the Cytonn App from Google Playstore here or from the Appstore here;
- During the week, Kevin Karobia, an Investment Analyst at Cytonn was on Look Up TV for a discussion on the state of the economy. To listen to the conversation, click here
- We continue to offer Wealth Management Training every Wednesday and every third Saturday of the month, from 9:00 am to 11:00 am, through our Cytonn Foundation. The training aims to grow financial literacy among the general public. To register for any of our Wealth Management Trainings, click here;
- If interested in our Private Wealth Management Training for your employees or investment group, please get in touch with us through wmt@cytonn.com;
- Any CHYS and CPN investors still looking to convert are welcome to consider one of the five projects currently available for assignment, click here for the latest term sheet;
- Cytonn Insurance Agency acts as an intermediary for those looking to secure their assets and loved ones’ future through insurance namely; Motor, Medical, Life, Property, WIBA, Credit and Fire and Burglary insurance covers. For assistance, get in touch with us through insuranceagency@cytonn.com;
- Cytonnaire Savings and Credit Co-operative Society Limited (SACCO) provides a savings and investments avenue to help you in your financial planning journey. To enjoy competitive investment returns, kindly get in touch with us through clientservices@cytonn.com;
Real Estate Updates:
- For an exclusive tour of Cytonn’s real estate developments, visit: Sharp Investor's Tour, and for more information, email us at sales@cytonn.com;
- Phase 3 of The Alma is now ready for occupation and the show house is open daily. To rent please email properties@cytonn.com;
- We have 8 investment-ready projects, offering attractive development and buyer targeted returns; See further details here: Summary of Investment-ready Projects;
- For Third Party Real Estate Consultancy Services, email us at rdo@cytonn.com;
- For recent news about the group, see our news section here;
Hospitality Updates:
We currently have promotions for Staycations. Visit cysuites.com/offers for details or email us at sales@cysuites.com;
Money Markets, T-Bills Primary Auction:
During the week, T-bills remained oversubscribed, with the overall subscription rate coming in at 144.1%, an increase from the 105.8% recorded the previous week. The increase in the subscription rate was partly attributable to investors’ preference for the shorter dated papers as they sought to avoid duration risk coupled with ample liquidity in the money market with the average interbank rates declining to 5.3% from 5.6% recorded the previous week. Investors’ preference for the shorter 91-day paper persisted, with the paper receiving bids worth Kshs 13.5 bn against the offered Kshs 4.0 bn, translating to a subscription rate of 388.4%, an increase from the 329.8% recorded the previous week. The subscription rate for the 182-day paper also increased to 146.5% from 50.9% while that of the 364-day paper declined to 44.0% from 71.1% recorded the previous week. The yields on the government papers recorded mixed performance, with the yields on the 182-day and the 91-day papers increasing by 8.8 bps and 7.4 bps to 9.4% and 8.3%, respectively, while the yields on the 364-day paper declined by 1.8% bps to 10.0%. The government rejected expensive bids, accepting a total of Kshs 30.8 bn worth of bids out of the Kshs 34.6 bn worth of bids received, translating to an acceptance rate of 88.9%.
In the Primary Bond Market, the Central Bank of Kenya released results for the recently re-opened bonds; FXD2/2013/15 and FXD2/2018/15, with effective tenors to maturity of 6.0 years and 11.0 years and coupons of 12.0% and 12.8% respectively. The bonds recorded an undersubscription of 26.4%, partly attributable to investors’ preference for the shorter dated papers as they sought to avoid duration risks and partly due to tightened liquidity during the period of issue. The government issued the bonds seeking to raise Kshs 40.0 bn for budgetary support, received bids worth Kshs 10.6 bn and accepted bids worth Kshs 9.3 bn, translating to an 88.0% acceptance rate. The weighted average yields for the two bonds were 13.2% for FXD2/2013/15 and 13.9% for FXD2/2018/15.
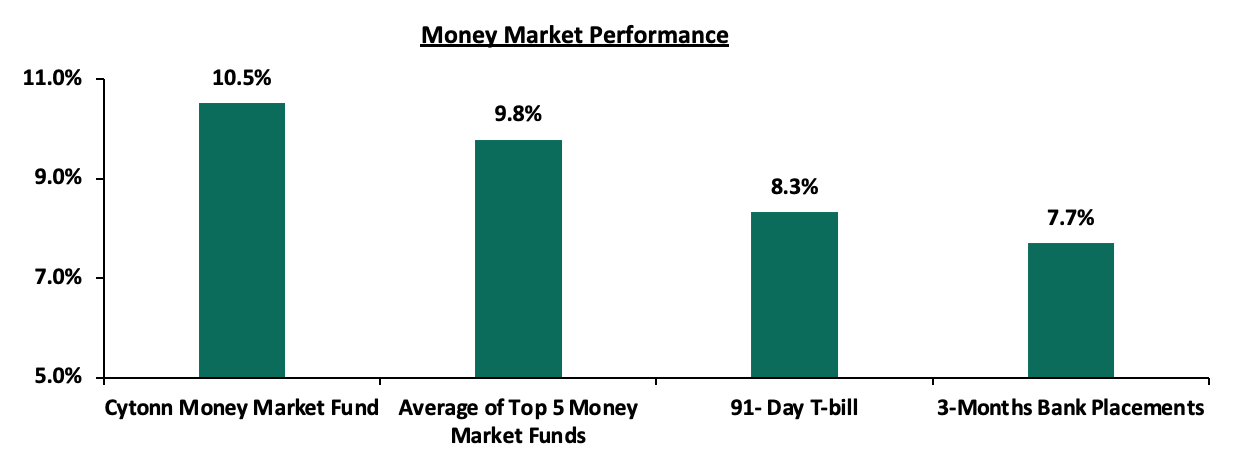
In the money markets, 3-month bank placements ended the week at 7.7% (based on what we have been offered by various banks), while the yield on the 91-day T-bill increased by 7.4 bps to 8.3%. The average yield of the Top 5 Money Market Funds and the Cytonn Money Market Fund remained relatively unchanged at 9.8% and 10.5% respectively, as was recorded last week.
The table below shows the Money Market Fund Yields for Kenyan Fund Managers as published on 22nd July 2022:
|
Money Market Fund Yield for Fund Managers as published on 22nd July 2022 |
||
|
Rank |
Fund Manager |
Effective Annual Rate |
|
1 |
Cytonn Money Market Fund |
10.5% |
|
2 |
Zimele Money Market Fund |
9.9% |
|
3 |
Nabo Africa Money Market Fund |
9.7% |
|
4 |
Sanlam Money Market Fund |
9.5% |
|
5 |
Madison Money Market Fund |
9.3% |
|
6 |
Apollo Money Market Fund |
9.3% |
|
7 |
NCBA Money Market Fund |
9.2% |
|
8 |
Dry Associates Money Market Fund |
9.1% |
|
9 |
Old Mutual Money Market Fund |
9.0% |
|
10 |
CIC Money Market Fund |
9.0% |
|
11 |
Co-op Money Market Fund |
8.9% |
|
12 |
GenCap Hela Imara Money Market Fund |
8.7% |
|
13 |
ICEA Lion Money Market Fund |
8.6% |
|
14 |
Orient Kasha Money Market Fund |
8.4% |
|
15 |
AA Kenya Shillings Fund |
7.9% |
|
16 |
British-American Money Market Fund |
7.4% |
Source: Business Daily
Liquidity:
During the week, liquidity in the money markets eased, with the average interbank rate declining to 5.3% from 5.6% recorded the previous week, partly attributable to government payments which offset tax remittances. The average interbank volumes traded increased by 0.9% to Kshs 29.5 bn from Kshs 29.2 bn recorded the previous week.
Kenya Eurobonds:
During the week, the yields on Eurobonds were on a downward trajectory, an indication of easing risk concerns over the economy by investors despite the prevailing risks surrounding the high inflation and the upcoming August elections. The yield on the 10-year Eurobond issued in 2014 recorded the highest decline having declined by 2.8% points to 19.3%, from 22.0%, recorded the previous week. The table below shows the summary of the performance of the Kenyan Eurobonds as of 21st July 2022;
|
Kenya Eurobond Performance |
||||||
|
2014 |
2018 |
2019 |
2021 |
|||
|
Date |
10-year issue |
10-year issue |
30-year issue |
7-year issue |
12-year issue |
12-year issue |
|
3-Jan-22 |
4.4% |
8.1% |
8.1% |
5.6% |
6.7% |
6.6% |
|
30-Jun-22 |
17.0% |
14.7% |
13.7% |
16.1% |
13.8% |
12.7% |
|
15-Jul-22 |
22.0% |
17.1% |
16.2% |
19.8% |
16.0% |
15.3% |
|
18-Jul-22 |
20.6% |
16.9% |
15.8% |
19.4% |
15.9% |
15.1% |
|
19-Jul-22 |
20.6% |
16.9% |
15.6% |
19.0% |
15.6% |
15.0% |
|
20-Jul-22 |
20.1% |
16.4% |
15.2% |
18.6% |
15.4% |
14.7% |
|
21-Jul-22 |
19.3% |
15.6% |
14.3% |
17.9% |
14.6% |
14.7% |
|
Weekly Change |
(2.8%) |
(1.5%) |
(1.9%) |
(1.9%) |
(1.5%) |
(0.5%) |
|
MTD Change |
2.3% |
0.9% |
0.5% |
1.8% |
0.8% |
2.0% |
|
YTD Change |
14.9% |
7.5% |
6.2% |
12.3% |
7.9% |
8.1% |
Source: Central Bank of Kenya (CBK)
Kenya Shilling:
During the week, the Kenyan shilling depreciated by 0.3% against the US dollar to close the week at Kshs 118.6, from Kshs 118.3 recorded the previous week, partly attributable to increased dollar demand from the oil and energy sectors against a slower supply of hard currency. On a year to date basis, the shilling has depreciated by 4.8% against the dollar, higher than the 3.6% depreciation recorded in 2021. We expect the shilling to remain under pressure in 2022 as a result of:
- High global crude oil prices on the back of persistent supply chain bottlenecks further exacerbated by the Russian-Ukrainian geopolitical pressures at a time when demand is picking up with the easing of COVID-19 restrictions and as economies continue to recover. Key to note, risks abound the recovery following the resurgence of COVID-19 infections in the country and the country’s trading partners,
- Increased demand from merchandise traders as they beef up their hard currency positions in anticipation for increased demand as economies gradually recover,
- An ever-present current account deficit due to an imbalance between imports and exports, with Kenya’s current account deficit estimated to come in at 5.3% of GDP in the 12 months to May 2022 compared to the 5.0% for a similar period in 2021. The wider deficit reflects a higher import bill, particularly for petroleum products, with the imports for Q1’2022 increasing by 14.5%, 5.7% points higher than the 8.8% increase in exports, and,
- The aggressively growing government debt, with Kenya’s public debt having increased at a 10-year CAGR of 18.2% to Kshs 8.6 tn in May 2022, from Kshs 1.6 tn in May 2012 thus putting pressure on forex reserves to service some of the public debt. It is worth noting that the average GDP growth over the same period has been 3.9%, an indicator that the increase in debt is not translating into GDP growth.
The shilling is however expected to be supported by:
- High Forex reserves currently at USD 7.7 bn (equivalent to 4.5-months of import cover), which is above the statutory requirement of maintaining at least 4.0-months of import cover, and the EAC region’s convergence criteria of 4.5-months of import cover. In addition, the reserves were boosted by the USD 750.0 mn World Bank loan facility received in March 2022 and are expected to be boosted further by the USD 235.6 mn funding from the International Monetary Fund (IMF), and,
- Improving diaspora remittances evidenced by a 6.6% y/y increase to USD 326.1 mn as of June 2022, from USD 305.9 mn recorded over the same period in 2021, which has continued to cushion the shilling against a faster depreciation. In the recently released June 2022 diaspora remittances figures, North America remained the largest source of remittances to Kenya accounting for 59.1% in the period, followed by Europe at 18.2% while the rest of the world accounted for 22.7% of the total.
Weekly Highlights:
- IMF Third Review on Kenya’s Extended Fund Facility and Extended Credit Facility Programme
During the week, the International Monetary Fund (IMF) completed Kenya’s third review of the 38-month Extended Fund Facility (EFF) and Extended Credit Facility (ECF) - funded program, allowing for immediate disbursement of USD 235.6 mn (Kshs 27.9 bn). This marks Kenya’s fourth tranche of the approved 38-month loan facility totaling to USD 2.34 bn (Kshs 270.9 bn) that was announced in April 2021, bringing the total support from IMF to Kenya to USD 1,208.2 mn (Kshs 140.5 bn). The credit facility is meant for budgetary support as well as helping the country navigate global shocks due to spillovers from the Russia-Ukraine invasion which has created new spending needs and added to inflationary pressures through rising global fuel, fertilizer, and food prices. The table below shows the funding the government has received so far out of the original amount:
|
International Monetary Fund (IMF) EFF and ECF Financing Programme |
||
|
Date |
Amount Received (USD mn) |
Amount Received (Kshs bn) |
|
Apr-21 |
307.5 |
35.6 |
|
Jun-21 |
407.0 |
47.1 |
|
Dec-21 |
258.1 |
29.9 |
|
Jul-22 |
235.6 |
27.9 |
|
Total Amount Received |
1,208.2 |
140.5 |
|
Amount pending |
1,131.8 |
130.4 |
The receipt of the Kshs 27.9 bn loan funds is expected to boost forex reserves and consequently help support the Kenyan shilling from an even faster depreciation, having depreciated by 4.8% year to date. We believe that the financing programme will continue to support the government’s fiscal consolidation efforts as well as progress towards achieving sustained economic growth in the long term. Additionally, the switch from expensive commercial debts to concessional loans will help save on the cost of borrowing since such loans have more favorable terms and conditions than those offered by the commercial finance markets including the lower interest rate and deferred or income-contingent repayments.
- June 2022 inflation projections
We are projecting the y/y inflation rate for July 2022 to fall within the range of 7.7%-8.1%, with a bias towards a slight decline from the 7.9% recorded in July. The key drivers include:
- Unchanged fuel prices - Fuel prices for the period 15th July 2022 to 14th August 2022 remained unchanged at 159.1 per litre for Super Petrol, Kshs 140.0 per litre for Diesel and Kshs 127.9 per litre for Kerosene, as result of the fuel subsidy program under the Petroleum Development Levy which resulted in subsidies of Kshs 50.7 on Super Petrol, Kshs 53.7 on Diesel and Kshs 53.2 on Kerosene during the month. With fuel being a major contributor to Kenya's headline inflation, we expect the unchanged fuel prices to exert minimal pressure on the inflation basket in the short term,
- Increasing food prices - This was evidenced by the 13.8% y/y increase in the prices of food & non-alcoholic beverages as of June 2022 due to increased costs of production. Food prices increased by 1.2% m/m from May 2022 mainly due to increases in the prices of wheat flour, carrots and cooking oil (salad) among other food items occasioned by adverse weather conditions in most parts of the country coupled with high fertilizer prices, and,
- The price of electricity which reduced by 15.7% in January 2022 marking the first phase of compliance with President Uhuru Kenyatta’s directive to cut the cost of electricity by 30.0% in order to reduce the cost of living. The reduction in electricity costs helped prices of goods remain stable during the month of July 2022 due to lower production costs.
Going forward, we expect the inflation rate to remain elevated on the back of high fuel and food prices. Additionally, the move by the Monetary Policy Committee (MPC) to increase the Central Bank Rate (CBR) by 50.0 bps to 7.5% in May 2022, from the previous 7.0% is expected to anchor inflation expectations as well as help prop the shilling given the current YTD depreciation of 4.8%. However, concerns remain high on the inflated import bill and widening trade deficit as global fuel prices continue to rise evidenced by increased average landed costs of Super Petrol, Diesel and Kerosene, which increased by 19.0%, 2.2% and 6.8% to USD 1,042.9 per cubic meter, USD 1,019.3 per cubic meter, and USD 967.4 in June 2022, from USD 876.1 per cubic meter, USD 997.4 per cubic meter, and USD 905.6 per cubic meter in May 2022 occasioned by supply bottlenecks worsened by the geopolitical tensions arising from the Russia-Ukraine invasion. We expect inflationary pressure to remain elevated mainly due to the increased global fuel prices as fuel prices are a substantial input cost in the bulk of Kenya’s sectors such as manufacturing, transport and energy.
Rates in the Fixed Income market have remained relatively stable due to the relatively ample liquidity in the money market. As is it early in the financial year, the government is 11.6% behind its prorated borrowing target of Kshs 35.2 bn having borrowed Kshs 31.1 bn of the Kshs 581.7 bn borrowing target for the FY’2022/2023. We expect sustained gradual economic recovery as evidenced by the revenue collections of Kshs 2.0 tn during the FY’2021/2022, which was equivalent to 102.8% of the prorated revenue collection target. Additionally, despite the projected high budget deficit of 8.1% and the affirmation of the `B+’ rating with negative outlook by Fitch Ratings, we believe that the support from the IMF and World Bank will mean that the interest rate environment will remain stable since the government is not desperate for cash. Owing to this, our view is that investors should be biased towards short-term fixed-income securities to reduce duration risk.
Market Performance:
During the week, the equities market was on a downward trajectory with NASI, NSE 20 and NSE 25 declining by 4.0%, 0.4% and 1.9%, respectively, taking their YTD performance to losses of 18.3%, 12.4% and 16.1%, for NASI, NSE 20 and NSE 25, respectively. The equities market performance was mainly driven by losses recorded by large-cap stocks such as Safaricom, Bamburi, KCB Group and ABSA Bank of 7.8%, 7.1%, 4.8% and 3.7%, respectively. The losses were however mitigated by gains recorded by stocks such as BAT, EABL, NCBA Group and Co-operative Bank which recorded gains of 5.1%, 2.9%, 1.9% and 1.8%, respectively.
During the week, equities turnover increased by 39.7% to USD 15.4 mn from USD 11.0 mn recorded the previous week, taking the YTD turnover to USD 522.2 mn. Additionally, foreign investors remained net sellers, with a net selling position of USD 5.3 mn, from a net selling position of USD 3.9 mn recorded the previous week, taking the YTD net selling position to USD 124.5 mn.
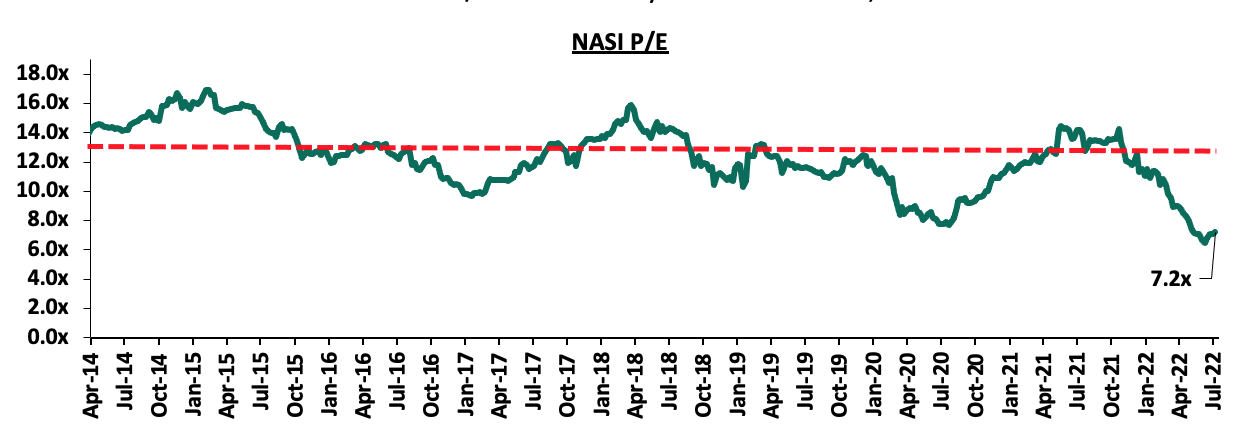
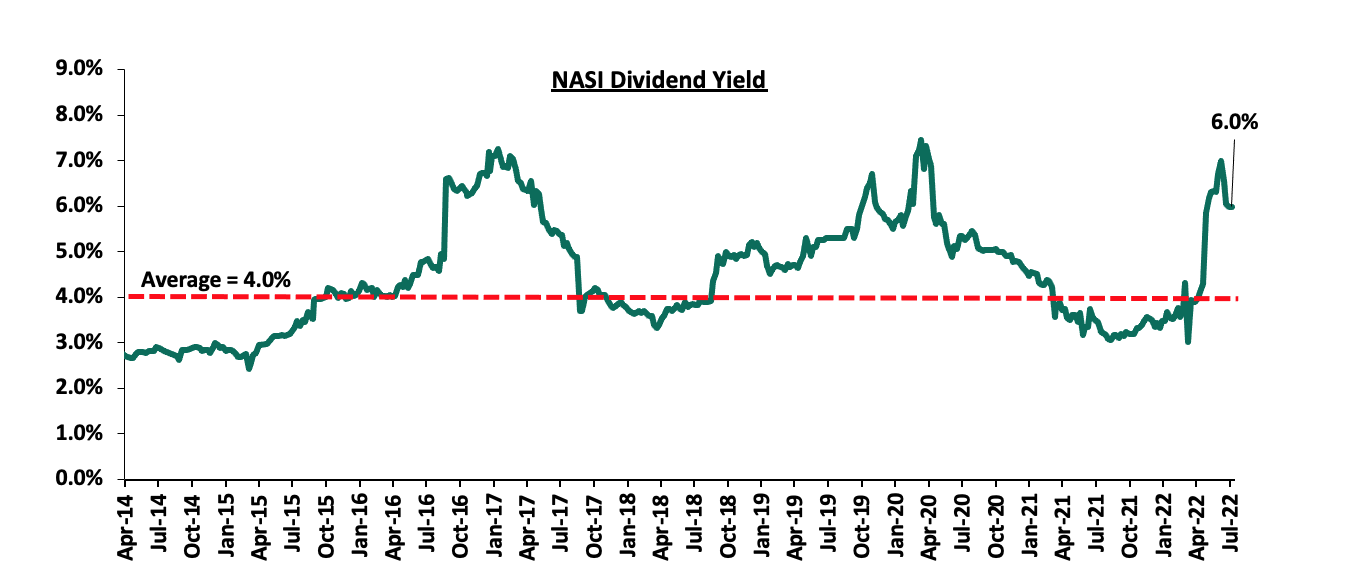
The market is currently trading at a price to earnings ratio (P/E) of 7.2x, 43.6% below the historical average of 12.8x, and a dividend yield of 6.0%, 2.0% points above the historical average of 4.0%. Key to note, NASI’s PEG ratio currently stands at 0.9x, an indication that the market is undervalued relative to its future growth. A PEG ratio greater than 1.0x indicates the market may be overvalued while a PEG ratio less than 1.0x indicates that the market is undervalued.
The charts below indicate the historical P/E and dividend yields of the market;
Cytonn coverage:
|
Company |
Price as at 15/07/2022 |
Price as at 22/07/2022 |
w/w change |
YTD Change |
Target Price* |
Dividend Yield |
Upside/ Downside** |
P/TBv Multiple |
Recommendation |
|
Kenya Reinsurance |
2.1 |
2.1 |
(1.9%) |
(8.7%) |
3.2 |
4.9% |
59.9% |
0.2x |
Buy |
|
Jubilee Holdings |
248.8 |
249.0 |
0.1% |
(21.5%) |
379.4 |
5.6% |
58.0% |
0.5x |
Buy |
|
KCB Group*** |
40.5 |
38.5 |
(4.8%) |
(11.2%) |
52.2 |
7.8% |
43.4% |
0.8x |
Buy |
|
Liberty Holdings |
5.3 |
5.5 |
3.0% |
(24.4%) |
7.8 |
0.0% |
41.8% |
0.4x |
Buy |
|
ABSA Bank*** |
10.9 |
10.5 |
(3.7%) |
(7.7%) |
13.6 |
10.5% |
40.7% |
1.0x |
Buy |
|
I&M Group*** |
17.0 |
17.1 |
0.3% |
(20.6%) |
22.3 |
8.8% |
39.6% |
0.5x |
Buy |
|
Sanlam |
11.0 |
11.6 |
5.5% |
(4.8%) |
15.9 |
0.0% |
37.1% |
1.2x |
Buy |
|
Co-op Bank*** |
11.1 |
11.3 |
1.8% |
(15.0%) |
14.1 |
8.9% |
34.2% |
0.8x |
Buy |
|
Diamond Trust Bank*** |
50.0 |
49.1 |
(1.8%) |
(16.1%) |
62.4 |
6.1% |
33.3% |
0.2x |
Buy |
|
NCBA*** |
24.1 |
24.5 |
1.9% |
(5.5%) |
29.1 |
12.2% |
31.0% |
0.6x |
Buy |
|
Britam |
6.0 |
6.0 |
0.3% |
(20.9%) |
7.7 |
0.0% |
28.3% |
1.0x |
Buy |
|
Equity Group*** |
44.6 |
45.0 |
1.0% |
(15.5%) |
54.4 |
6.7% |
27.6% |
1.2x |
Buy |
|
Standard Chartered*** |
130.8 |
132.0 |
1.0% |
0.6% |
137.0 |
10.6% |
14.4% |
1.0x |
Accumulate |
|
Stanbic Holdings |
90.0 |
106.0 |
17.8% |
3.4% |
109.8 |
8.5% |
12.1% |
0.9x |
Accumulate |
|
CIC Group |
2.1 |
2.0 |
(2.9%) |
(4.1%) |
2.1 |
0.0% |
4.0% |
0.7x |
Lighten |
|
HF Group |
3.5 |
3.4 |
(1.7%) |
(9.2%) |
2.8 |
0.0% |
(17.4%) |
0.2x |
Sell |
|
Target Price as per Cytonn Analyst estimates **Upside/ (Downside) is adjusted for Dividend Yield ***For Disclosure, these are stocks in which Cytonn and/or its affiliates are invested in |
|||||||||
We are “Neutral” on the Equities markets in the short term due to the current adverse operating environment and huge foreign investor outflows, and, “Bullish” in the long term due to current cheap valuations and expected global and local economic recovery.
With the market currently trading at a discount to its future growth (PEG Ratio at 0.9x), we believe that investors should reposition towards value stocks with strong earnings growth and that are trading at discounts to their intrinsic value. We expect the current high foreign investors sell-offs, the upcoming Kenyan general elections and the slow vaccine rollout to continue weighing down the economic outlook in the short term.
- Infrastructure Sector
During the week, the African Development bank (AfDB) approved USD 150.0 mn (Kshs 17.7 bn) to be used in the rehabilitation of the Nairobi – Nakuru – Mau Summit Highway totaling 232.8 km. This represents 9.8% funding of the Kshs 180.0 bn worth Public Private Partnership (PPP) project between the National Government through the Kenya National Highway Authority (KeNHA), and, a consortium made up of Vinci Highways SAS, Meridian Infrastructure Africa Fund, and, Vinci Concessions SAS. As per our Cytonn Weekly #23/2022, the remaining capital is to be provided by other ten financial institutions including the International Financial Corporation (IFC), and, the World Bank, among others. The three-year project which is the first PPP project to be approved by AFDB’s Board of Directors in its recently established PPP framework, will facilitate the transformation of the highway into a four-lane carriageway upon completion.
Additionally, during the week, President Uhuru Kenyatta commissioned the rehabilitation of the Nairobi-Suguta-Maralal Road worth Kshs 1.1 bn. The historic road project will be financed by the Government of Kenya and is expected to change the face of Samburu County. Additionally, this will ensure that the area attracts more investments, as well as eradicate transport challenges faced by citizens in the area hence boost its economic performance. This will be further enhanced by the Marala-Loosuk Road project worth Kshs 1.2 bn that the government also recently launched in Samburu County.
Both projects are expected to;
- Create employment opportunities particularly during the construction periods,
- Reduce existing traffic snarl-ups upon their completion, particularly the Nairobi – Nakuru – Mau Summit Highway,
- Enhance transport services whilst also reducing operational costs,
- Further open up areas for Real Estate investments whilst also improving the living standards of surrounding citizens, and,
- Promote trade activities in the surrounding areas.
Rapid infrastructure developments continue to take shape in the country as a result of the government’s continuous focus on the implementation and development of quality and adequate roads to make Kenya an intra-regional hub for trade in East Africa in the country. This is very much evidenced by the various projects initiated and ongoing such as; i) Nairobi Commuter Rail project, ii) Nairobi-Nakuru Highway project, iii) Standard Gauge Railway Phase 2A, and, iv) Nairobi Western Bypass, among other key projects. We expect a similar trend to continue taking shape in the country, with some of the strategies the government has used in order to realize it objectives including; i) project partnerships such as PPPs and Joint Ventures, ii) floating of infrastructure bonds in order to raise construction funds, and, iii) high priority in the budget allocations, with the sector having been allocated Kshs 212.5 bn in the FY’2022/2023 Budget Statement, a 16.4% increase from the Kshs 182.5 bn allocated in 2021/22 fiscal year.
- Listed Real Estate
During the week, ILAM Fahari I-REIT released its H1’2022 results highlighting a 104.1% increase in the net earnings to Kshs 86.2 mn, from the 42.4 mn that was recorded in H1’2021. Below is a summary of the ILAM Fahari I-REIT’s H1’2022 Performance;
Figures in Kshs bn Unless Stated Otherwise
|
Balance Sheet |
H1’2021 |
H1’2022 |
∆ (H1'22/ H1’21) |
|
Total Assets |
3.9 |
3.7 |
(5.3%) |
|
Total Equity |
3.7 |
3.5 |
(4.6%) |
|
Total Liabilities |
0.2 |
0.1 |
(20.3%) |
Figures in Kshs mn Unless Stated Otherwise
|
Income Statement |
H1’2021 |
H1’2022 |
∆ (H1'22/ H1’21) |
|
Rental Income |
136.7 |
171.8 |
25.7% |
|
Income from Other Sources |
11.8 |
14.5 |
23.0% |
|
Operating Expenses |
106.3 |
100.1 |
(5.8%) |
|
Profit Before Tax |
42.2 |
86.2 |
104.1% |
|
Basic EPS |
0.2 |
0.5 |
104.1% |
|
Ratios Summary |
H1’2021 |
H1’2022 |
∆ (H1'22/ H1’21) |
|
ROA |
1.1% |
2.3% |
1.2% |
|
ROE |
1.1% |
2.4% |
1.3% |
|
Debt Ratio |
4.8% |
4.0% |
(0.8%) |
|
PBT Margin |
31.2% |
51.2% |
20.0% |
|
H1’2022 Rental Yield |
3.9% |
5.3% |
1.3% |
|
Annualized Rental Yield |
8.0% |
10.9% |
2.9% |
|
Income Yield |
6.6% |
8.4% |
1.8% |
|
Dividend Yield (Assuming 90.0% distribution) |
8.1% |
7.6% |
(0.5%) |
Key Take Outs;
- The basic earnings per unit increased by 104.1% to Kshs 0.5 in H1’2022, from Kshs 0.2 in H1’2021. This was driven by a 24.4% increase in the total operating income which came in at Kshs 182.9 mn in H1’2022 from Kshs 147.1 mn in H1’2021, coupled with a 5.8% decline in the total operating expenses which came in at Kshs 100.2 mn in H1’2022, from Kshs 106.3 mn recorded in H1’2021,
- Rental income increased by 25.7% to Kshs 171.8 mn in H1’2022, from Kshs 136.7 mn recorded in H1’2021, mainly driven by an increase in the occupancy rate at the Greenspan Mall which is its most valuable property worth Kshs 2.2 bn, following Naivas’ take over as the anchor tenant from troubled Tuskys supermarket that in turn led to an increase in the rental income. The performance was also driven by the economic recovery from the effects of the pandemic, that led to normalcy in the property market,
- The rental income as a percent of interest earning asset implies a gross rental yield of 5.3% on the property portfolio,
- Expenses made up 54.8% of the total operating income leaving 45.2% as distributable to unit holders,
- The Net Income Yield to unit holders is 8.4%. Assuming a 90.0% distribution, the annualized dividend yield would be 6.8%, and,
- Total assets reduced by 5.3% to Kshs 3.7 bn in FY’2021 from Kshs 3.9 bn in H1’2021, driven by a 6.3% decline in investment property to Kshs 3.3 bn from Kshs 3.5 bn in H1’2021, coupled with an 8.7% decline in property and equipment to Kshs 12.7 bn from Kshs 13.9 bn in H1’2021.
The chart below shows the comparison of ILAM Fahari I-REIT yield performance versus other yields;
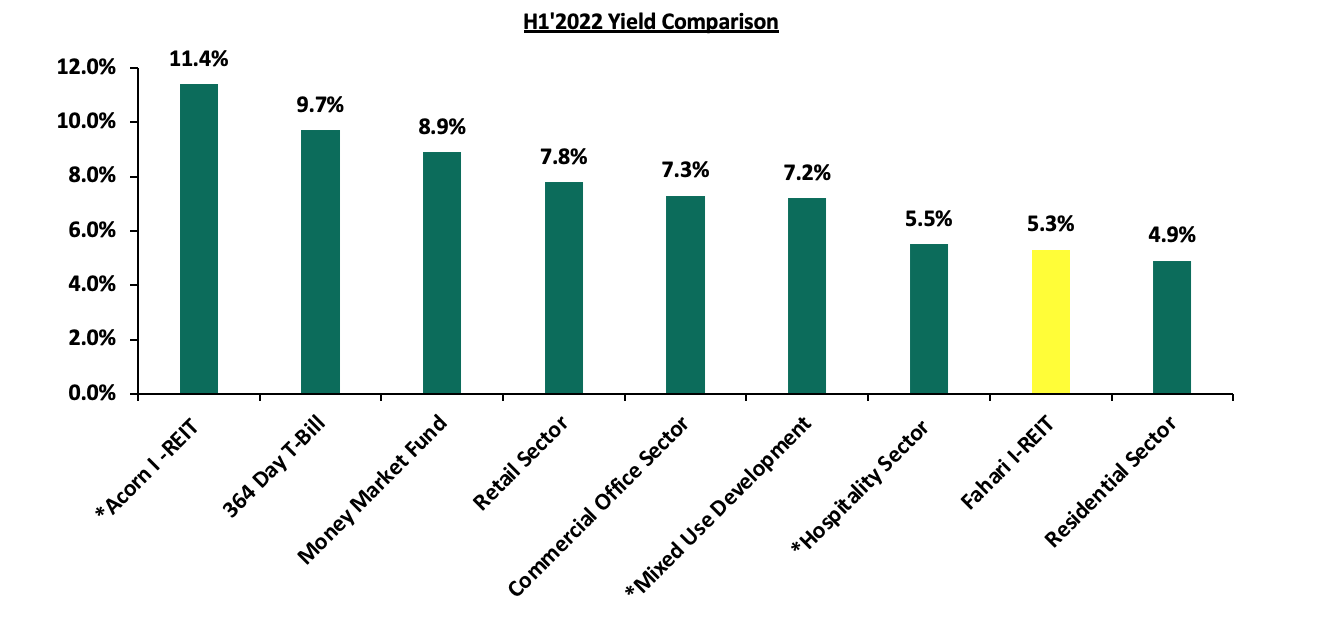
Source: Cytonn Research, *Yield as at FY’2021
For a more comprehensive analysis, please see our ILAM Fahari I-REIT H1’2022 Earnings Note.
Given the underperformance of the yield as shown by the charge above, it is commendable that during the week, property fund manager ILAM Fahari I-REIT announced plans to sell some of its assets in an aim to increase its returns from its property investments. The expected sale transaction is part of its proposed restructuring plans which is currently awaiting approval by the Capital Markets Authority (CMA). However, ILAM Fahari did not disclose the details of the assets to be sold, whereas Fahari currently owns properties worth Kshs 3.3 bn; Greenspan Mall which is the largest property worth Kshs 2.2 bn, Bay Holdings (a semi-office and light industrial building) worth Kshs 0.2 bn, Highway House (an industrial building) worth Kshs 24.7 mn, and 67 Gitanga office building worth Kshs 0.8 bn. Upon successful transaction, we expect the move to further boost the REIT’s performance amidst increased revenue.
In the Nairobi Stock Exchange, the REIT closed the week trading at an average price of Kshs 6.6 per share. The performance represents a 3.1% Year-to-Date (YTD) increase from Kshs 6.4 per share. On an Inception-to-Date (ITD) basis, the REIT’s performance continues to be weighed down having realized a 68.0% decline from Kshs 20.0. The graph below shows Fahari I-REIT’s performance from November 2015 to July 2022:
We expect Kenya’s property market to continue being shaped by government’s aggressiveness towards infrastructural development, bearing in mind that infrastructure is a key factor boosting performance of the Real Estate market. However, setbacks such investor’s minimal appetite for the REIT instrument is expected to continue weighing down the overall investments in REITs.
Kenya’s public debt has been on the rise, increasing by a 10-year CAGR of 18.2% to Kshs 8.6 tn in May 2022, from Kshs 1.6 tn in May 2012 owing primarily to the government’s significant borrowing to fund infrastructural projects and bridge the fiscal deficit which has averaged 7.4% of GDP over the last 10 years coupled with the increasing debt servicing costs especially for US Dollar denominated commercial loans given the shilling’s continuous depreciation. Additionally, the continued guaranteeing of state corporations that have been performing poorly has placed a burden on the government to support them. The debt mix, as at May 2022 stood at 50:50 external to domestic debt, compared to 45:55 external to domestic debt in May 2012. Notably, Kenya’s debt stock has increased significantly due to advances from multilateral lenders with the debt to GDP ratio coming in at 69.1% as of May 2022, 19.1% points above the IMF recommended threshold of 50.0% for developing countries and higher than the 42.1% as of 2012. As such, the Kenyan Senate approved an increase of the debt ceiling to an absolute figure of Kshs 10.0 tn from the initial 9.0 tn in October 2021 providing the government with a headroom to borrow an additional Kshs 0.4 tn before the current debt ceiling is exceeded.
We have been tracking the evolution of Kenya’s public debt with the most recent topical being Kenya’s Public Debt: On a path to Distress?, which was done in October 2021. Here we highlighted the state of affairs concerning the country’s public debt profile and levels and concluded that Kenya’s risk of debt distress remained elevated. In this week’s topical, we shall focus on the current status of Kenya’s public debt as we begin the FY’2022/2023 and highlight some of the economic consequences resulting from high debt levels. We shall do this by taking a look into the following:
- The Current State of Kenya’s Public Debt,
- Kenya’s Debt Servicing Cost,
- Economic Consequences of high Debt levels, and
- Conclusion and Recommendations
Section 1: The Current state of Kenya’s Public Debt
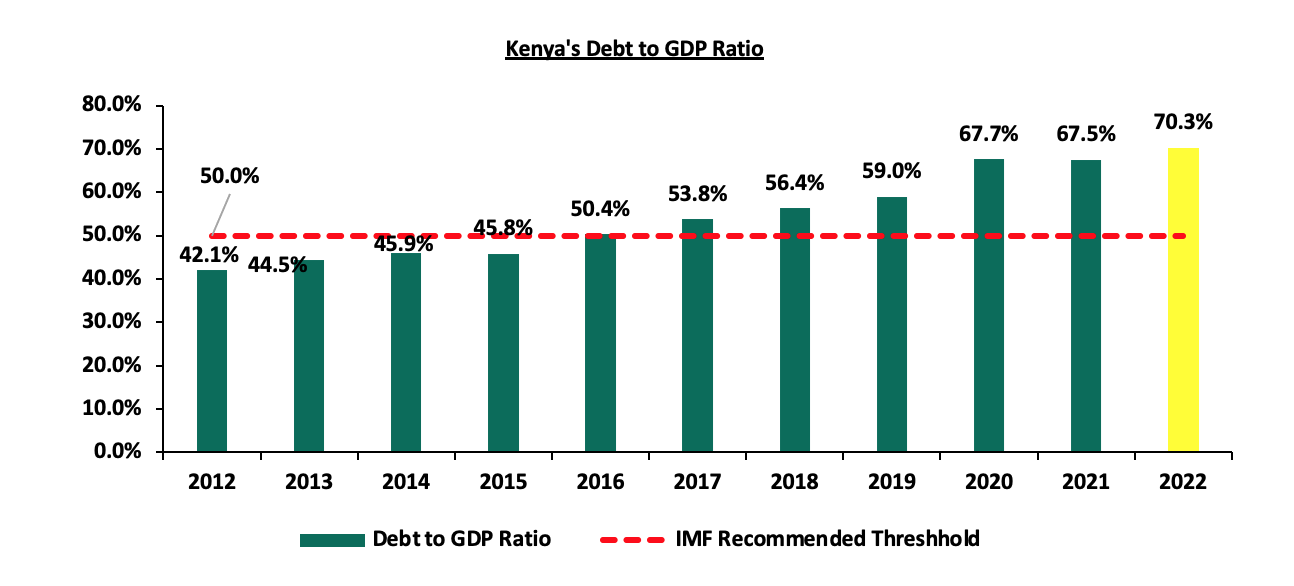
Kenya’s Public Debt stands at Kshs 8.6 tn, (equivalent to 69.1% of GDP) as of May 2022, a 14.4% increase from the Kshs 7.5 tn (equivalent to 66.4% of GDP) recorded in May 2021. The government debt is expected to marginally increase to 70.3% of GDP in 2022 on the back of rising debt levels which continues to outpace the economic growth. Kenya’s debt mix shifted to 50:50 domestic to external debt as of May 2022, from 49:51 in May 2021, an indication of increasing domestic borrowing in a bid to reduce exposure to external shocks stemming from foreign exchange risks. Notably, banking institutions account for the highest percentage of domestic debt in terms of government securities holdings, at 48.4% as at July 2022.
Below is a graph highlighting the trend in the Kenya’s debt to GDP ratio;
Source: National Treasury
- The Nature of Kenya’s Debt Composition (Domestic vs External)
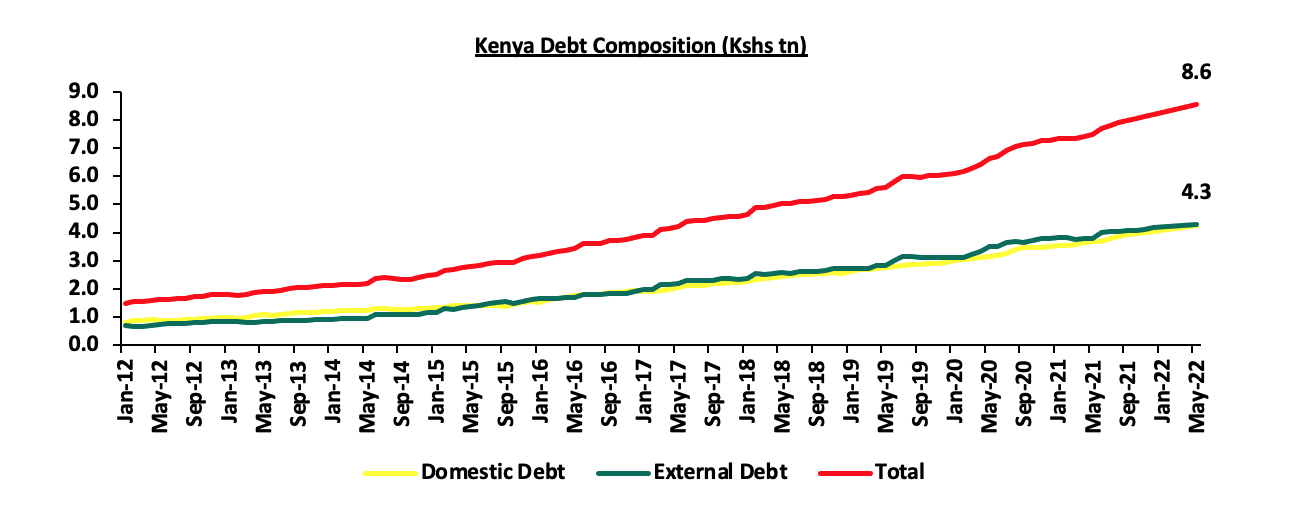
As of May 2022, Kenya’s domestic borrowing stood at Kshs 4.27 tn, equivalent to 34.4% of GDP while external debt stood at Kshs 4.30 tn, equivalent to 34.7% of GDP. Over time, the country’s debt composition has evolved, with the government increasing foreign borrowing to Kshs 4.30 tn as at May 2022 compared to Kshs 0.7 tn in May 2012, representing a 10-year CAGR of 19.6%. Below is a graph highlighting the trend in the external and domestic debt composition over the last 10 years:
Source: Central Bank of Kenya
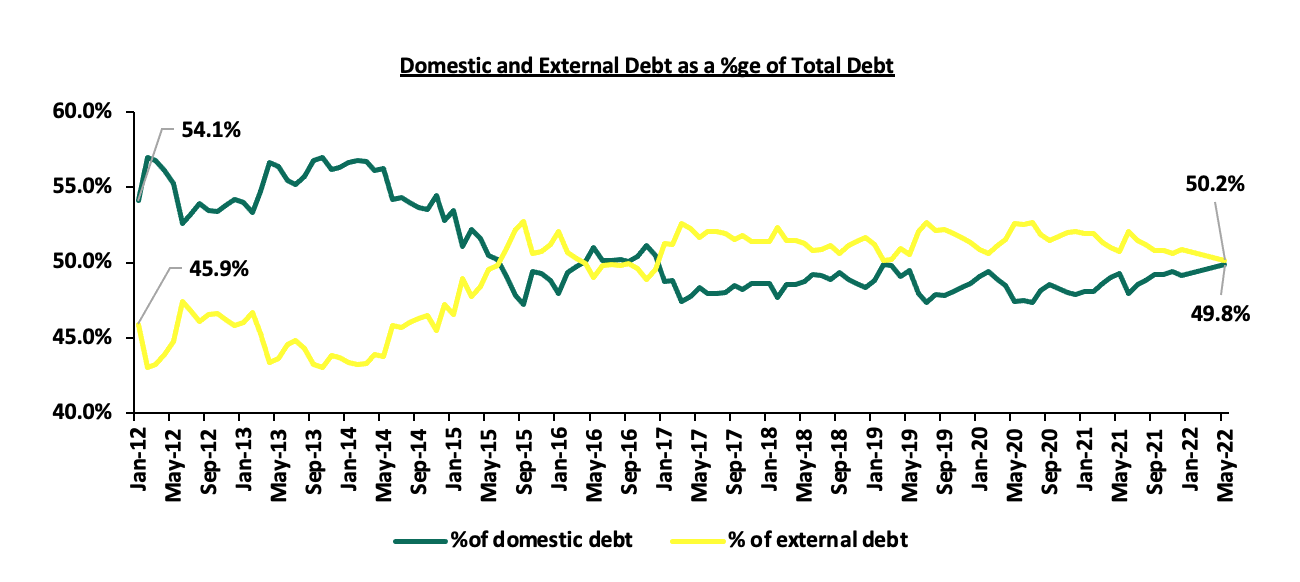
Over time, Kenya’s domestic debt has continued to grow, coming in at Kshs 4.27 tn as at May 2022 compared to Kshs 0.9 tn in May 2012, representing a 10-year CAGR of 16.8%, a slower rate as compared to external debt, highlighting the government’s continued preference for external debt. This can be attributed to advances from multilateral lenders such as the World Bank and IMF to boost the country’s COVID-19 recovery efforts and respond to global shocks such as the geopolitical pressures from the Russian-Ukrainian conflict. The chart below shows the external debt versus domestic debt as a percentage of total debt:
Source: Central Bank of Kenya
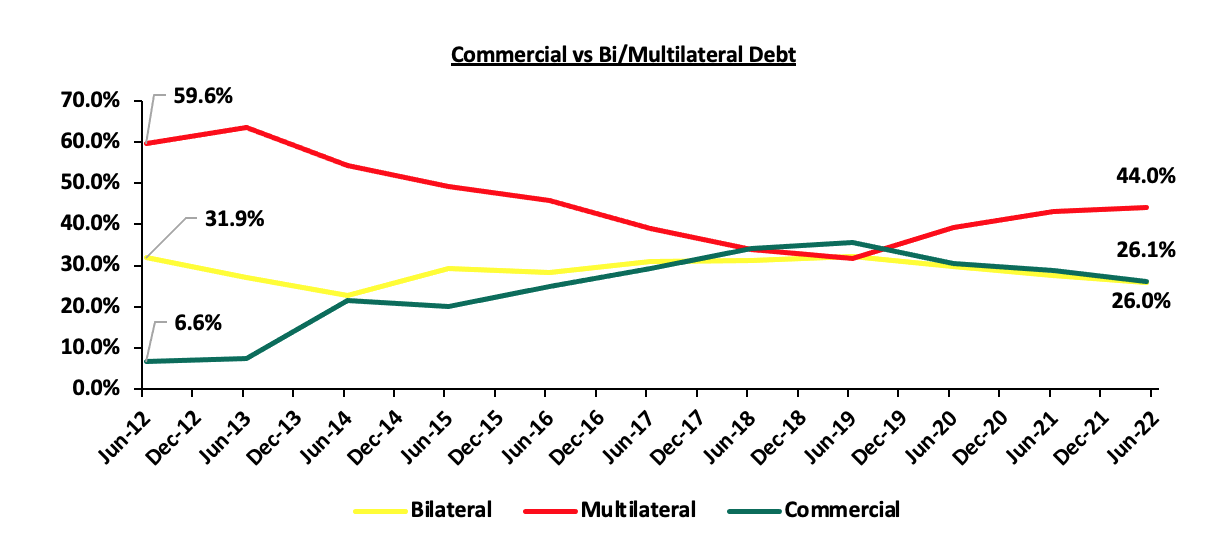
- Kenya’s External Debt Mix (Bilateral, Multilateral, and Commercial Banks)
Foreign debt comprises of multilateral loans, bilateral loans and commercial loans. Multilateral loans are debts issued by international institutions such as the World Bank and the IMF to member nations to promote social and economic development while bilateral loans are loan agreements between individual nations. Multilateral and bilateral loans are categorized as concessional loans due to the favorable terms offered in terms of either below-market interest rates, long grace periods or a combination of both. Commercial loans, on the other hand, are loans agreed between a country and an external commercial bank or an external financial debt instrument. Commercial loans typically have higher rates and shorter grace periods.
Kenya’s exposure to bilateral and multilateral loans has been declining in favour of a much more commercial funding structure comprising of Eurobonds and syndicated loan facilities offered by lenders who work together to avail funds to a single borrower. Concessional loans (Bilateral and Multilateral) have been increasing by a 10-year CAGR of 16.6% to Kshs 3.0 tn in May 2022 from Kshs 0.7 tn in June 2012 while commercial loans, which are deemed more expensive, have grown at a 10-year CAGR of 36.3% to Kshs 1.1 tn as at May 2022 from Kshs 50.5 as at June 2012.
It is key to note that:
- The portion of multilateral debt increased by 0.8% points to 44.0% in May 2022, from 43.2% in June 2021 due to loans worth received from the IMF and the World Bank during the period. Bilateral debt on the other hand decreased by 1.7% points to 26.0% in June 2020, from 27.7% in June 2021, and,
- Commercial debt as a percentage of external debt has reduced by 2.7% points to 26.1% of total external debt in May 2022 from 28.8% in June 2021, mainly attributable to Kenya’s government opting against borrowing commercially as they are expensive and have shorter repayment duration contrary to concessional loans. This is illustrated in the Chart below;
Source: National Treasury
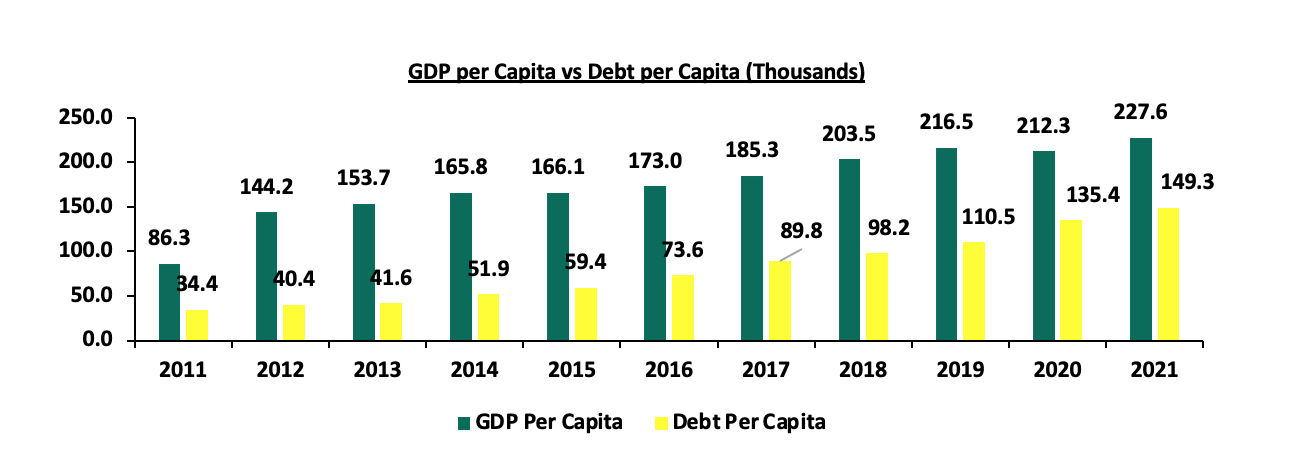
- GDP per Capita vs Debt per Capita
According to the World Bank, Kenya’s Public Debt per Capita has increased at a 10-year CAGR of 15.8% to Kshs 149,252.3 in 2021 from Kshs 34,400.0 in 2011. On the other hand, GDP per Capita has grown at a slower 10-year CAGR of 10.2% to Kshs 227,597.0 in 2021 from Kshs 86,300.0 in 2011, an indication that the debt being incurred is not translating into economic growth. The chart below compares Kenya’s GDP per capita to the debt per capita:
Source: World Bank and CBK
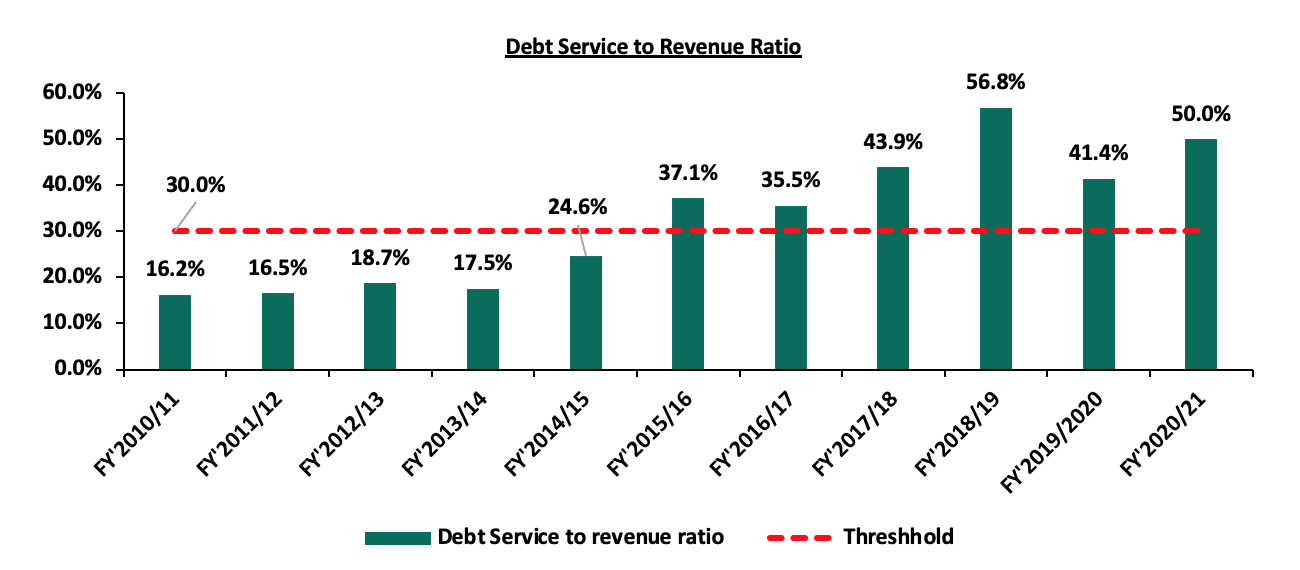
Section 2: Kenya’s Debt Servicing Cost
According to the National Treasury’s Annual Debt Management Report 2021, the debt service to revenue ratio was estimated at 50.0% for the FY’2020/2021, 20.0% points higher than IMF’s recommended threshold of 30.0% and 8.6% points higher than FY’2019/2020’s debt service to revenue ratio of 41.4%, attributable to increased debt service obligations during the year. The sustained level of debt service to revenue ratio above the recommended threshold is a worrying sign, elevating the refinancing risk following shocks arising from the pandemic and global supply disruptions accelerated by the ongoing Russian-Ukrainian conflict. Below is a chart showing the debt service to revenue ratio for the last ten fiscal years;
Source: National Treasury
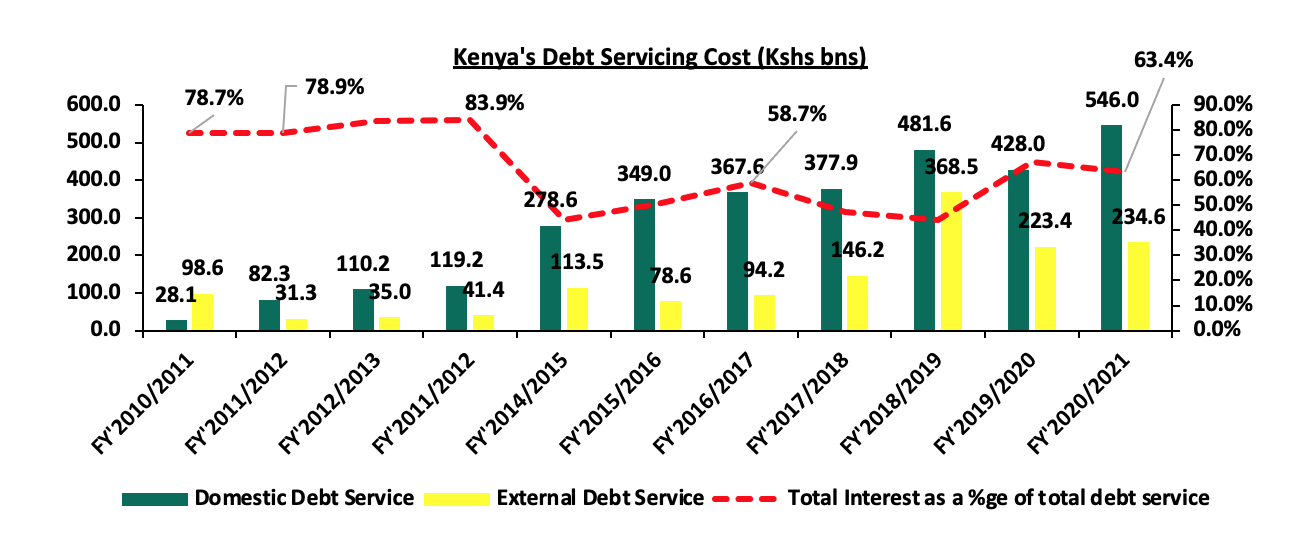
We note that Kenya’s debt servicing costs have continued to increase over time growing at a 10-year CAGR of 23.0% to Kshs 780.6 bn in FY’2020/2021, from Kshs 98.6 bn in FY’2010/2011. The graph below compares the domestic debt servicing cost to the external debt servicing cost over the last ten fiscal years:
Source: National Treasury
The key take-outs from the chart include:
- Total debt service for the FY’2020/2021 stood at Kshs 780.6 bn, a 19.8% points increase from Kshs 651.5 bn in FY’2019/2020. Domestic debt service remains the highest representing 69.9% of the total debt service while external debt service represented 30.1% in FY’2020/2021, and,
- Interest payments carry the bulk of Kenya’s debt servicing cost coming in at 63.4% in FY’2020/2021. Notably, domestic debt interest payments incur the highest cost, contributing an average of 53.8% of the total debt servicing costs over the period under review. For the FY’2020/2021, the domestic interest payments came in at Kshs 388.8 bn, equivalent to 49.8% of the total debt servicing costs.
Section 3: Economic Consequences of High Debt Levels
The ongoing global shocks continue to present economic challenges such as the rising global energy and commodity prices, which are expected to create new spending needs thus affecting any fiscal consolidation efforts. However, we note that a strong fiscal outlook is essential for a growing and thriving economy. Some of the consequences of high debt levels include;
- High Cost of Debt Servicing - Elevated cost of debt servicing due to debt obligations in foreign currencies despite a weakening shilling, resulting to increased taxation as the government tries to meet its debt obligations,
- Elevated Cost of New Borrowings – High debt levels are likely to lead to increased cost of additional borrowing as lenders will demand higher rates for new debts considering the heightened risk of debt distress which stifles the private sector and economic growth,
- Limited Fiscal Space –High debt levels in most cases lead to a Narrow fiscal space hence reduced resources for undertaking infrastructure and capital expenditure,
- Crowding Out of the Private Sector - Because of the increased domestic borrowing, the government crowds out the private sector which leads to a subdued private sector, subsequently impacting revenue collections, and,
- Reduction in Economic Activities - Fiscal consolidation and austerity measures undermine particular economic activities, development objectives and decrease the government’s ability to effectively respond to emergencies. The government usually borrow to tackle unexpected events and fund infrastructure projects.
Section 4: Conclusions and Recommendations
Given the high debt levels and the fiscal challenges the country continues to face, it is advisable that the government works on strategies to reduce the economic consequences of high debt levels and increased risk of debt distress. We however commend the government on the continuous efforts to boost revenue collection but we believe a lot needs to be done. Below are some actionable steps that the government can take to reduce the debt overhang;
- Enhance Fiscal Consolidation – High fiscal deficit attributable to higher expenditure as compared to revenue collections is the main driver of the high borrowing levels. The government can bridge the deficit gap by implementing robust fiscal consolidation through expenditure reduction by introducing austerity measures and reducing amounts extended to recurrent expenditure. The strategy would also enable the Government to refinance other essential sectors such as agriculture which would raise more revenues. Additionally, the government can also limit capital expenditure to projects with either high social impact or have a high Economic Rate of Return (ERR), and high economic benefits outweighing costs,
- Promote Capital Markets - The government should channel efforts towards strengthening the Capital Markets structure to ease the pooling of funds by investors to undertake development projects. Key to note, our capital markets remain dormant with banking markets having mobilized Kshs 4.7 tn in deposits compared to Collective Investment Schemes at only Kshs 0.1 tn, hence the need to increase support to the sector,
- Improving the Country’s Exports – The government should formulate export and manufacturing favourable policies to improve the current account while lowering imports to preserve our foreign exchange reserves. This would stabilize the exchange rate and stop our foreign denominated debt from increasing as the shilling depreciates,
- Diversification of Funding of Projects – The government should fully operationalize and remove bottlenecks to Private Public Partnerships (PPPs) and joint ventures to attract more private sector involvement in funding development projects such as infrastructure instead of borrowing,
- Enhancing Parliament’s Oversight Role – Parliament is an independent body mandated to oversee the operations of the executive. Therefore, it should ascertain that future debt uptake is well interrogated, is feasible and will bring economic benefit to the country. Legislators should ensure that fiscal deficits are sustainable at the budget approval stage to reduce the need for borrowing,
- Spur Economic Growth – it is critical that the government implement policies that will spur economic growth such as enhancing ease of doing business, promoting tourism, entrepreneurship and innovation so that there is more revenue to growth the economy and pay down debt, and,
- Addressing Financial Weaknesses of Parastatals - The government should revive economic performance of parastatals or privatize poorly performing ones to release capital, lower debt and also to prevent the widening of debt from losses and inefficiencies.
Disclaimer: The views expressed in this publication are those of the writers where particulars are not warranted. This publication, which is in compliance with Section 2 of the Capital Markets Authority Act Cap 485A, is meant for general information only and is not a warranty, representation, advice or solicitation of any nature. Readers are advised in all circumstances to seek the advice of a registered investment advisor.

- Talk to us
- Kenya
- P.O Box 20695 - 00200, Nairobi, Kenya
- Cell +254709101200
- Tel +254709101200
- WhatsApp +254741676635
- United States
- +254709101200
- DOWNLOAD OUR APP
-


- Kenya
- 8th Floor, Pinetree Plaza, Kaburu Drive, Ngong Road, Nairobi, Kenya
- USA
- Suite 1150, 1775 Eye Street NW, USA, Washington DC 20006, USA
- Investments
- High Yield
- Private Equity
- Real Estate
- Real Estate
- RiverRun Estates
- Cytonn Towers
- The Ridge
- Taraji Heights
- The Alma