Nairobi Metropolitan Area (NMA) Residential Report 2022, & Cytonn weekly #23/2022
By Cytonn Research, Jun 12, 2022
Executive Summary
Fixed Income
During the week, T-bills remained undersubscribed with the overall subscription rate coming in at 61.3%, down from 86.3% recorded the previous week partly attributable to the concurrent bond issue which recorded an oversubscription of 101.8%. The highest subscription rate was in the 91-day paper which declined to 81.1%, from 210.1% recorded the previous week. The subscription rate for the 182-day paper also declined to 40.0%, from 72.7%, while that of the 364-day paper increased to 74.6% from 50.3% recorded the previous week. The yields on the 364-day, 182-day and 91-day papers increased by 1.7 bps, 6.3 bps and 5.5 bps to 10.0% and 9.0% and 7.9%, respectively. In the primary bond market, the government released the auction results for the newly issued infrastructure bond, IFB1/2022/18, for the month of June highlighting that the bond recorded an oversubscription of 101.8%. The oversubscription was partly attributable to the relatively ample liquidity in the money market during the period of issue coupled with the attractive tax-free nature of the bond and the high coupon rate of 13.7%;
Also during the week, Stanbic Bank released its monthly Purchasing Manager’s Index (PMI) highlighting that the index for May 2022 declined for the second consecutive month to 48.2, from 49.5 recorded in April 2022 signaling a further deterioration in the business environment in the Kenyan private sector. Additionally, the World Bank released the Global economic prospects, June 2022 report, highlighting that the global economy is projected to grow by 2.9% in 2022, 1.2% points lower than the January 2022 projections of a 4.1% growth. The reduced growth projections are largely weighed down by the Russian-Ukraine crisis, resurgence and the emergence of new COVID-19 variants, reduced fiscal support as well as persistent supply bottlenecks;
Equities
During the week, the equities market recorded a mixed performance, with NASI gaining by 0.4%, while NSE 20 and NSE 25 declined by 1.4% and 0.7% respectively. This week’s performance took the indices’ YTD performance to losses of 22.3%, 19.0% and 12.4% for NASI, NSE 25 and NSE 20 respectively. The equities market performance was driven by gains recorded by stocks such as ABSA Bank and Bamburi of 9.5% and 5.3% respectively, while Safaricom and BAT both gained by 1.9%. The gains were however weighed down by losses recorded by large cap stocks such as Diamond Trust Bank (DTB-K), Equity Group, EABL and NCBA Group which declined by 9.1%, 5.2%, 4.8% and 4.7%, respectively;
During the week, the Central Bank of Kenya (CBK), released the Commercial Banks’ Credit Survey Report for the quarter ended March 2022, highlighting that banking sector’s loan book recorded an 11.2% y/y growth, with gross loans increasing to Kshs 3.4 tn in March 2022, from Kshs 3.0 tn in March 2021. On a q/q basis, the loan book increased by 4.1% from Kshs 3.2 tn in December 2021. Also during the week, Centum Investment Company PLC, announced that it had entered into a binding agreement to sell its 83.4% shareholding in Sidian Bank to Access Bank PLC, for a consideration of Kshs 4.3 bn, translating to a Price to Book Value (P/B) of 1.1x;
Real Estate
During the week, the Nairobi Metropolitan Services (NMS) began the second phase of revamping housing estates in select parts of Nairobi County. In the infrastructure sector, the African Development Bank (AfDB) announced plans to loan Kshs 17.5 bn towards the upgrade of the Nairobi-Nakuru Highway project totaling 233 Km, in July 2022. In addition, the National Government through the Kenya Rural Roads Authority (KeRRA) resumed the construction of the 54.0 Km Mto Mwagodi-Mbale-Wundanyi-Bura road project, that has stalled for more than six months due to financial constraints. For the listed Real Estate, ILAM Fahari I-REIT closed the week trading at an average price of Kshs 6.0 per share;
Focus of the Week
This week we update our research on the Nairobi Metropolitan Area (NMA) Residential sector by showcasing the sector’s performance. We shall review the price performance, rental yields and space uptake, based on the coverage of 35 areas;
Investment Updates:
- Weekly Rates:
- Cytonn Money Market Fund closed the week at a yield of 10.50%. To invest, dial *809#;
- Cytonn High Yield Fund closed the week at a yield of 14.10% p.a. To invest, email us at sales@cytonn.com and to withdraw the interest, dial *809#;
- Stellah Swakei, an Investment Analyst, was on Look Up TV for a discussion on the economic developments in Kenya with a key focus on expensive digital loans. Listen to Stellah here,
- We continue to offer Wealth Management Training every Wednesday and every third Saturday of the month, from 9:00 am to 11:00 am, through our Cytonn Foundation. The training aims to grow financial literacy among the general public. To register for any of our Wealth Management Trainings, click here;
- If interested in our Private Wealth Management Training for your employees or investment group, please get in touch with us through wmt@cytonn.com;
- Any CHYS and CPN investors still looking to convert are welcome to consider one of the five projects currently available for assignment, click here for the latest term sheet;
- Cytonn Insurance Agency acts as an intermediary for those looking to secure their assets and loved ones’ future through insurance namely; Motor, Medical, Life, Property, WIBA, Credit and Fire and Burglary insurance covers. For assistance, get in touch with us through insuranceagency@cytonn.com;
- Cytonnaire Savings and Credit Co-operative Society Limited (SACCO) provides a savings and investments avenue to help you in your financial planning journey. To enjoy competitive investment returns, kindly get in touch with us through clientservices@cytonn.com;
Real Estate Updates:
- For an exclusive tour of Cytonn’s real estate developments, visit: Sharp Investor's Tour, and for more information, email us at sales@cytonn.com;
- Phase 3 of The Alma is now ready for occupation. To rent please email properties@cytonn.com;
- We have 8 investment-ready projects, offering attractive development and buyer targeted returns; See further details here: Summary of Investment-ready Projects;
- For Third Party Real Estate Consultancy Services, email us at rdo@cytonn.com;
- For recent news about the group, see our news section here;
Hospitality Updates:
- We currently have promotions for Staycations. Visit cysuites.com/offers for details or email us at sales@cysuites.com;
Money Markets, T-Bills Primary Auction:
During the week, T-bills remained undersubscribed with the overall subscription rate coming in at 61.3%, down from 86.3% recorded the previous week partly attributable to the concurrent bond issue which recorded an oversubscription of 101.8%. The highest subscription rate was in the 91-day paper which decreased to 81.1%, from 210.1% recorded the previous week. The subscription rate for the 182-day paper also decreased to 40.0%, from 72.7%, while that of the 364-day paper increased to 74.6% from 50.3% recorded the previous week. The yields on the 364-day, 182-day and 91-day papers increased by 1.7 bps, 6.3 bps and 5.5 bps to 10.0%, 9.0% and 7.9%, respectively. The government accepted a total of Kshs 14.0 bn worth of bids out of Kshs 14.7 bn received, translating to an acceptance rate of 95.4%.
In the primary bond market, the government released the auction results for the newly issued infrastructure bond, IFB1/2022/18, for the month of June. The bond recorded an oversubscription of 101.8%, partly attributable to the relatively ample liquidity in the money market during the period of issue coupled with the attractive tax-free nature of the bond and the high coupon rate of 13.7%. The government sought to raise Kshs 75.0 bn for funding infrastructural projects, received bids worth Kshs 76.4 bn and accepted bids worth Kshs 73.8 bn, translating to a 96.6% acceptance rate. The bond had a coupon rate and a market weighted average rate of 13.7% and 13.8%, respectively.
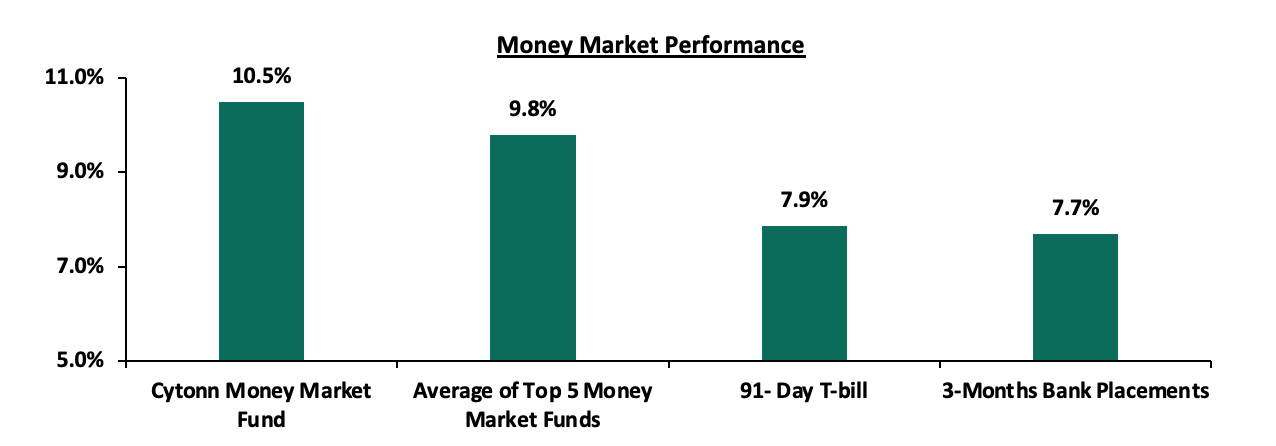
In the money markets, 3-month bank placements ended the week at 7.7% (based on what we have been offered by various banks), while the yield on the 91-day T-bill increased by 5.5 bps to 7.9%. The average yield of the Top 5 Money Market Funds and the yield on the Cytonn Money Market Fund remained relatively unchanged at 9.8% and 10.5%, respectively as recorded the previous week.
The table below shows the Money Market Fund Yields for Kenyan Fund Managers as published on 10th June 2022:
|
Money Market Fund Yield for Fund Managers as published on 10th June 2022 |
||
|
Rank |
Fund Manager |
Effective Annual Rate |
|
1 |
Cytonn Money Market Fund |
10.5% |
|
2 |
Zimele Money Market Fund |
9.9% |
|
3 |
Nabo Africa Money Market Fund |
9.8% |
|
4 |
Sanlam Money Market Fund |
9.4% |
|
5 |
Madison Money Market Fund |
9.4% |
|
6 |
Apollo Money Market Fund |
9.2% |
|
7 |
CIC Money Market Fund |
9.0% |
|
8 |
Dry Associates Money Market Fund |
8.9% |
|
9 |
Co-op Money Market Fund |
8.9% |
|
10 |
ICEA Lion Money Market Fund |
8.8% |
|
11 |
GenCap Hela Imara Money Market Fund |
8.7% |
|
12 |
Orient Kasha Money Market Fund |
8.6% |
|
13 |
NCBA Money Market Fund |
8.4% |
|
14 |
Old Mutual Money Market Fund |
8.0% |
|
15 |
AA Kenya Shillings Fund |
7.8% |
|
16 |
British-American Money Market Fund |
7.3% |
Source: Business Daily
Liquidity:
During the week, liquidity in the money markets remained stable, with the average interbank rate remaining relatively unchanged at 4.8%, as recorded the previous week. The average interbank volumes traded increased by 38.1% to Kshs 27.9 bn from Kshs 20.2 bn recorded the previous week.
Kenya Eurobonds:
During the week, the yields on Eurobonds were on an upward trajectory, partly attributable to investors attaching higher risk premium on the country due to perceived higher risks arising from increasing inflationary pressures and local currency depreciation. The yields on the 10-year Eurobond issued in 2014 and the 7-year Eurobond issued in 2019 both recorded the highest increase having increased by 2.6% points to 13.5% and 13.3%, from 10.9% and 10.7%, respectively recorded the previous week. The table below shows the summary of the performance of the Kenyan Eurobonds as of 9th June 2022;
|
Kenya Eurobond Performance |
||||||
|
|
2014 |
2018 |
2019 |
2021 |
||
|
Date |
10-year issue |
10-year issue |
30-year issue |
7-year issue |
12-year issue |
12-year issue |
|
3-Jan-22 |
4.4% |
8.1% |
8.1% |
5.6% |
6.7% |
6.6% |
|
31-May-22 |
10.4% |
10.1% |
10.7% |
10.6% |
10.3% |
9.8% |
|
3-Jun-22 |
10.9% |
10.3% |
11.0% |
10.7% |
10.5% |
9.9% |
|
6-Jun-22 |
10.9% |
10.3% |
10.9% |
10.7% |
10.5% |
9.9% |
|
7-Jun-22 |
11.2% |
10.6% |
11.0% |
11.7% |
10.6% |
10.3% |
|
8-Jun-22 |
12.5% |
11.4% |
11.5% |
12.5% |
11.1% |
10.7% |
|
9-Jun-22 |
13.5% |
12.2% |
12.0% |
13.3% |
12.0% |
11.1% |
|
Weekly Change |
2.6% |
1.9% |
1.0% |
2.6% |
1.5% |
1.2% |
|
MTD Change |
3.1% |
2.1% |
1.3% |
2.7% |
1.7% |
1.3% |
|
YTD Change |
9.1% |
4.1% |
3.9% |
7.7% |
5.3% |
4.5% |
Source: Central Bank of Kenya (CBK)
Kenya Shilling:
During the week, the Kenyan shilling depreciated by 0.2% against the US dollar to close the week at Kshs 117.0, from Kshs 116.8 recorded the previous week, partly attributable to increased dollar demand from the oil and energy sectors as well as the manufacturing sector. Key to note, this is the lowest the Kenyan shilling has ever depreciated against the dollar. On a year to date basis, the shilling has depreciated by 3.5% against the dollar, in comparison to the 3.6% depreciation recorded in 2021. We expect the shilling to remain under pressure in 2022 as a result of:
- Rising global crude oil prices on the back of supply constraints and geopolitical pressures at a time when demand is picking up with the easing of COVID-19 restrictions and as economies reopen. Key to note, risks abound the recovery following the emergence of the new COVID-19 variants,
- Increased demand from merchandise traders as they beef up their hard currency positions in anticipation for more trading partners reopening their economies globally,
- An ever-present current account deficit due to an imbalance between imports and exports, with Kenya’s current account deficit estimated to come in at 5.1% of GDP in the 12 months to April 2022 compared to the 4.8% for a similar period in 2021. The wider deficit reflects a higher import bill, particularly for oil, which more than offset increased receipts from agricultural and services exports, and remittances, and,
- The aggressively growing government debt, with Kenya’s public debt having increased at a 10-year CAGR of 18.3% to Kshs 8.4 tn in March 2022, from Kshs 1.6 tn in March 2012 thus putting pressure on forex reserves to service some of the public debt. It is worth noting that the average GDP growth over the same period has been 5.0%, an indicator that the increase in debt is not translating into GDP growth.
The shilling is however expected to be supported by:
- High Forex reserves currently at USD 8.2 bn (equivalent to 4.9-months of import cover), which is above the statutory requirement of maintaining at least 4.0-months of import cover, and the EAC region’s convergence criteria of 4.5-months of import cover. In addition, the reserves were boosted by the USD 750.0 mn World Bank loan facility received in March 2022 and are expected to be boosted further by the expected USD 244.0 mn from the International Monetary Fund (IMF), and,
- Improving diaspora remittances evidenced by an 18.6% y/y increase to USD 355.0 mn as of April 2022, from USD 299.3 mn recorded over the same period in 2021 which has continued to cushion the shilling against further depreciation. In the recently released April 2022 diaspora remittances figures, North America remained the largest source of remittances to Kenya accounting for 61.7% in the period, followed by Europe at 17.2% while the rest of the world accounted for 21.1% of the total.
Weekly Highlights:
- Stanbic Bank’s May 2022 Purchasing Manager’s Index (PMI)
During the week, Stanbic Bank released its monthly Purchasing Manager’s Index (PMI) highlighting that the index for May 2022 declined for the second consecutive month to 48.2, from 49.5 recorded in April 2022 signaling a further deterioration in the business environment in the Kenyan private sector. The decline was largely attributable to the prevailing inflationary pressures with the inflation rate for the month of May coming in at 7.1%, the highest rate since March 2020. Additionally, there was a rise in input costs, occasioned by the increasing fuel prices, supply constraints as well as weakening currency. Selling prices increased in tandem leading to a decline in new order volumes as consumers reduced their spending. Key to note, purchasing activity by businesses remained at the same levels as in April despite the continued rise in prices as businesses sought to restock goods amid concerns that supply would worsen or prices would rise. The chart below summarizes the evolution of the PMI over the last 24 months:
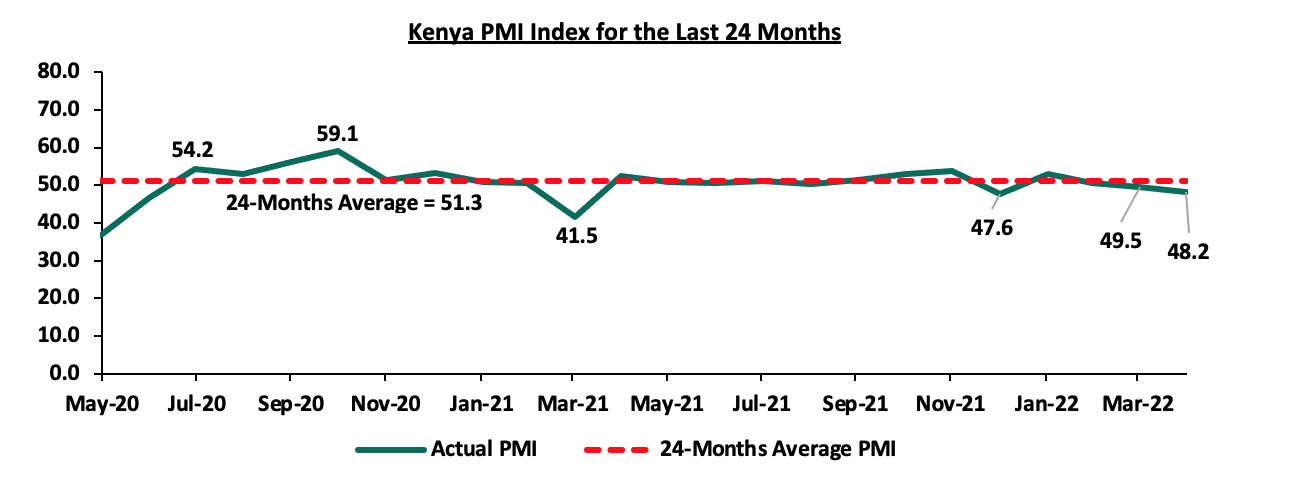
*** Key to note, a reading above 50.0 signals an improvement in business conditions, while readings below 50.0 indicate a deterioration.
Kenya’s general business environment has continued to deteriorate amid increased supply chain uncertainties, rising inflation as well as persistent geopolitical pressures that have worsened supply constraints, all of which have led to reduced consumer spending. Going forward, we maintain a cautious outlook owing to the continued rise in cost of fuel and production materials which has resulted to an increase in input costs. With fuel being a major input cost to most sectors, we expect the increasing global fuel prices to contribute to the deterioration of business conditions in the country. Further, the continued depreciation of the Kenyan shilling, is expected to weigh on the business environment given that imports continue to get more expensive raising the production costs even more. As such, the recovery of the private sector business environment in Kenya is largely pegged on how quickly the global economy stabilizes with a key concern on the rising fuel prices as well as the upcoming August general elections.
- World Bank June 2022 Global Economic Prospects
Recently, the World Bank released the Global Economic Prospects - June 2022 report, highlighting that the global economy is projected to grow by 2.9% in 2022, 1.2% points lower than the January 2022 projections of a 4.1% growth. The reduced growth projections are largely weighed down by the Russian-Ukraine crisis, resurgence and the emergence of new COVID-19 variants, reduced fiscal support as well as persistent supply bottlenecks. The compounded effect has seen inflation rates continue to rise world over on the back of rising food and fuel prices. Other key take-outs from the report include:
- Emerging Markets and Developing Economies (EMDEs) are expected to grow at a slower 3.4% in 2022, 1.2% points lower than the 4.6% projections at the beginning of the year and 3.2% points lower than the 6.6% growth recorded in 2021. The decline is mainly attributable to the negative spillovers from the Russian – Ukraine crisis which outweigh the short-term benefits from higher energy prices for some commodity exporters,
- Growth in the Sub-Saharan Africa is expected to come in at 3.7%, 0.4% points lower than the 4.1% growth estimate recorded in 2021. Key to note, growth in the Sub-Saharan region is expected to come in lower in comparison to other EMDEs save for the regions in close proximity to Russia and Ukraine such as the Euro Zone and Central Asia. This is mainly attributable to the narrowed fiscal space, increasing inflation rates and persistent supply constraints given that most countries in the Sub Saharan Africa are net importers,
- Kenya’s economy is expected to grow by 5.5% in 2022, 0.8% points higher than the 4.7% projected growth at the beginning of the year mainly because of the strong recovery witnessed in 2021 which is expected to carry on into the 2022 annual growth. The projected growth is however 2.0% points lower than the 7.5% growth rate recorded in 2021 with the outlook being clouded by the rising inflation rates, erratic weather conditions, emergence of new COVID-19 variants, global economic headwinds and the uncertainties surrounding the August 2022 general elections which are expected to disrupt the economic environment, and,
- Kenya’s current account deficit is expected to widen to 6.0% in 2022, from 5.1% in 2021 partly due to commodity price volatility caused by the Russia - Ukraine war which is expected to have an immediate and direct impact on the trade balance. While Imports are expected to pick up partly due to recovering domestic demand, the rising commodity prices are expected to have a negative effect on the import bill. On the other hand, growth in Kenya’s key exports are expected to slow down as the outlook for Kenya’s major export markets weaken.
Following the relaxation of almost all COVID-19-related measures in most countries, the global economy is estimated to have grown by 5.7% in 2021, up from a 3.3% contraction in 2020. However, following an initial recovery from a global recession, the global economy was set to experience its sharpest slowdown in economic growth in 2022. With the Russian-Ukraine crisis in the picture, the risks to the global economic outlook are firmly to the downside, with much uncertainty stemming from the persistent geopolitical pressures. Further disruptions in global supplies of essential commodities are expected to exacerbate the import bill, particularly for African countries that are primarily net importers.
Rates in the Fixed Income market have remained stable due to the relatively ample liquidity in the money market. The government is 0.6% ahead of its prorated borrowing target of Kshs 638.5 bn having borrowed Kshs 642.2 bn of the Kshs 664.0 bn borrowing target for the FY’2021/2022. We expect a gradual economic recovery as evidenced by the revenue collections of Kshs 1.5 tn during the first ten months of the current fiscal year, which was equivalent to 102.0% of the prorated revenue collection target. However, despite the projected high budget deficit of 8.1% and the affirmation of the `B+’ rating with negative outlook by Fitch Ratings, we believe that the support from the IMF and World Bank will mean that the interest rate environment will remain stable since the government is not desperate for cash. Owing to this, our view is that investors should be biased towards short-term fixed-income securities to reduce duration risk.
Markets Performance
During the week, the equities market recorded a mixed performance, with NASI gaining by 0.4%, while NSE 20 and NSE 25 declined by 1.4% and 0.7% respectively. This week’s performance took the indices’ YTD performance to losses of 22.3%, 19.0% and 12.4% for NASI, NSE 25 and NSE 20 respectively. The equities market performance was driven by gains recorded by stocks such as ABSA Bank and Bamburi of 9.5% and 5.3% respectively, while Safaricom and BAT Kenya both gained by 1.9%. The gains were however weighed down by losses recorded by large cap stocks such as Diamond Trust Bank (DTB-K), Equity Group, EABL and NCBA Group which declined by 9.1%, 5.2%, 4.8% and 4.7%, respectively.
During the week, equities turnover declined by 4.2% to USD 16.8 mn, from USD 17.6 mn recorded the previous week, taking the YTD turnover to USD 412.7 mn. Foreign investors remained net sellers, with a net selling position of USD 7.1 mn, from a net selling position of USD 5.4 mn recorded the previous week, taking the YTD net selling position to USD 76.0 mn.
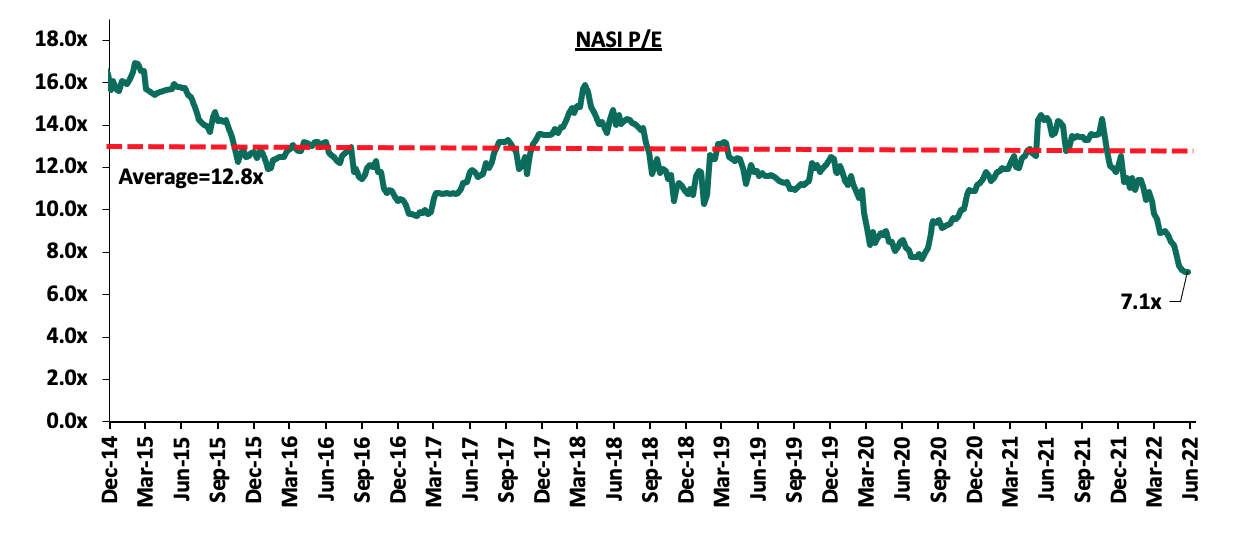
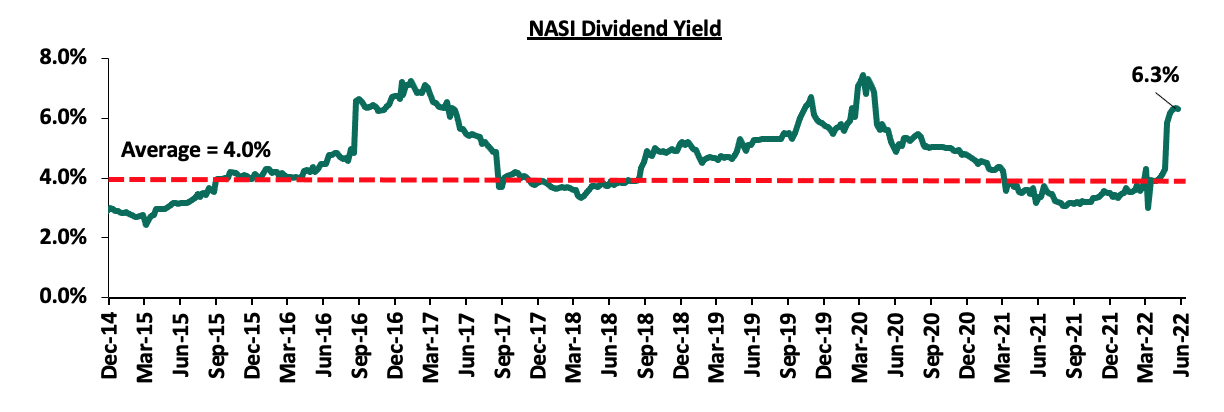
The market is currently trading at a price to earnings ratio (P/E) of 7.1x, 44.7% below the historical average of 12.8x, and a dividend yield of 6.3%, 2.3% points above the historical average of 4.0%. Key to note, NASI’s PEG ratio currently stands at 0.9x, an indication that the market is undervalued relative to its future growth. A PEG ratio greater than 1.0x indicates the market may be overvalued while a PEG ratio less than 1.0x indicates that the market is undervalued. The charts below indicate the historical P/E and dividend yields of the market:
Weekly Highlights;
- Central Bank of Kenya Credit Survey Report – Q1’2022
During the week, the Central Bank of Kenya (CBK), released the Commercial Banks’ Credit Survey Report for the quarter ended March 2022. The quarterly Credit Officer Survey is undertaken by the CBK to identify the potential drivers of credit risk in the banking sector. For the quarter ended 31st March 2022, 38 operating commercial banks and 1 mortgage finance company participated in the Commercial Banks Credit Survey. The report highlights that the banking sector’s loan book recorded an 11.2% y/y growth, with gross loans increasing to Kshs 3.4 tn in March 2022, from Kshs 3.0 tn in March 2021. On a q/q basis, the loan book increased by 4.1% from Kshs 3.2 tn in December 2021. Other key take-outs from the report include:
- The aggregate balance sheet recorded a 10.4% increase y/y to Kshs 6.1 tn in Q1’2022, from Kshs 5.5 tn in Q1’2021, attributable to an 11.2% increase in gross loans to Kshs 11.2% to Kshs 3.4 tn, from Kshs 3.0 tn in Q1’2021 coupled with an 8.1% growth in deposits to Kshs 4.5 tn in Q1’2022, from Kshs 4.1 tn in Q1’2021. Quarterly, the balance sheet grew by 1.6% to Kshs 6.1 tn in March 2022, from Kshs 6.0 tn in December 2021,
- Asset quality in the banking sector improved, with the Gross NPL ratio declining to 14.0% in Q1’2022, from 14.6% in Q1’2021. However q/q, the Gross NPL ratio deteriorated from 13.1% in Q4’2021. The deterioration in asset quality in Q1’2022 is attributable to the deterioration of business environment in Q1’2022 following continued inflationary pressures and currency depreciation risks as a result of the Russia - Ukraine conflict. Some of the key sectors that have been adversely affected include Personal and Household, Real Estate, Transport and Communication, Tourism, and Trade sectors,
- The capital adequacy remained sufficient with the ratio remaining unchanged at 18.9%, as was recorded in March 2021. During the quarter, the total capital increased by 1.1% and the total risk weighted assets increased by 4.4% bringing the capital adequacy ratio to 18.9%, 4.4% points above the minimum statutory limit of 14.5%,
- IFRS 9 implementation had an adverse effect on the banking sector’s capital adequacy as a result of increased provisioning due to the challenging business environment. Commercial banks have therefore injected additional capital to accommodate the expected increase in credit losses, and,
- Average liquidity in the banking sector declined to 55.0% in March 2022, from 56.3% in March 2021 and 56.2% in December 2021. This was 35.0% points above the minimum statutory ratio of 20.0%.
Despite the continued and renewed recovery efforts by the Kenyan Banking sector that has seen increased profits, mainly attributable to reduced provisioning levels, the sector is set to face increased pressure from the elevated credit risk in the country. This is mainly on the back of the increased inflationary pressures in the country, with the y/y inflation increasing to 7.1%, a 27-month high, coupled with the increased currency depreciation risks which have seen Kenya’s Purchasing Managers Index decline to 48.2 in May 2022, from 53.7 recorded at the end of December 2021, signaling a deterioration in business environment. Further, we expect the heated electioneering period in the build up to the August 2022 elections to sustain the elevated credit risk.
- Centum Investments sells its 83.4% shareholding in Sidian Bank to Access Bank PLC
During the week, Centum Investment Company PLC, announced that it had entered into a binding agreement to sell its 83.4% shareholding in Sidian Bank to Access Bank PLC, for a consideration of Kshs 4.3 bn subject to relevant approval from the Central bank of Kenya and the Competition Authority of Kenya. The price consideration from Access Bank translates to a Price to Book Value (P/B) of 1.1x, which is lower than the 8-year acquisitions average P/B of 1.3x, but higher than the current average P/B of the listed banking stocks of 0.9x. Access Bank will take over the 43 branches that Sidian Bank currently holds, adding to its current network of 28 branches through its subsidiary Access Bank Kenya with a view of merging the two entities. Below is a table showing the combined pro-forma financials for the banks upon approval of the transaction;
|
Combined Pro-forma Balance Sheet |
|||
|
Balance Sheet |
Access Bank Kenya |
Sidian Bank |
Combined Entity |
|
Net Loans (Kshs bn) |
3.4 |
23.3 |
26.7 |
|
Total assets (Kshs bn) |
14.0 |
43.2 |
57.2 |
|
Customer deposits (Kshs bn) |
9.2 |
26.7 |
35.9 |
|
Number of branches |
28 |
43 |
71 |
|
*Figures as of March 2022 |
|||
The acquisition adds to Access Bank’s foray into the Kenyan Banking sector and follows the acquisition of Transnational Bank, completed in February 2020. This highlights increased investor confidence and sentiments about the Kenyan Banking sector which has continued to be strong and resilient despite the challenges posed by the COVID-19 pandemic and global geopolitical tensions that both led to a deterioration of the business environment. Further, we expect sustained consolidation activity in the Kenyan Banking sector, as weaker banks are merged with the big banks to form a stronger banking system. The COVID-19 pandemic exposed the weak banks in the industry which might need to be acquired by larger banks in order to boost their capital adequacy and liquidity ratios to the required minimum statutory levels. We also expect to see Kenyan banks continue to diversify into other African regions as they look to reduce their reliance on the Kenyan Market.
Below is a summary of the deals in the last 8-years that have either happened, been announced or expected to be concluded:
|
Acquirer |
Bank Acquired |
Book Value at Acquisition (Kshs bn) |
Transaction Stake |
Transaction Value (Kshs bn) |
P/Bv Multiple |
Date |
|
Access Bank PLC |
Sidian Bank |
4.1 |
83.4% |
4.3 |
1.1x |
June-22* |
|
KCB Group |
Banque Populaire du Rwanda |
5.3 |
100.0% |
5.6 |
1.1x |
August-21 |
|
I&M Holdings PLC |
Orient Bank Limited Uganda |
3.3 |
90.0% |
3.6 |
1.1x |
April-21 |
|
KCB Group** |
ABC Tanzania |
Unknown |
100% |
0.8 |
0.4x |
Nov-20* |
|
Co-operative Bank |
Jamii Bora Bank |
3.4 |
90.0% |
1 |
0.3x |
Aug-20 |
|
Commercial International Bank |
Mayfair Bank Limited |
1 |
51.0% |
Undisclosed |
N/D |
May-20* |
|
Access Bank PLC (Nigeria) |
Transnational Bank PLC. |
1.9 |
100.0% |
1.4 |
0.7x |
Feb-20* |
|
Equity Group ** |
Banque Commerciale Du Congo |
8.9 |
66.5% |
10.3 |
1.2x |
Nov-19* |
|
KCB Group |
National Bank of Kenya |
7 |
100.0% |
6.6 |
0.9x |
Sep-19 |
|
CBA Group |
NIC Group |
33.5 |
53%:47% |
23 |
0.7x |
Sep-19 |
|
Oiko Credit |
Credit Bank |
3 |
22.8% |
1 |
1.5x |
Aug-19 |
|
CBA Group** |
Jamii Bora Bank |
3.4 |
100.0% |
1.4 |
0.4x |
Jan-19 |
|
AfricInvest Azure |
Prime Bank |
21.2 |
24.2% |
5.1 |
1.0x |
Jan-18 |
|
KCB Group |
Imperial Bank |
Unknown |
Undisclosed |
Undisclosed |
N/A |
Dec-18 |
|
SBM Bank Kenya |
Chase Bank Ltd |
Unknown |
75.0% |
Undisclosed |
N/A |
Aug-18 |
|
DTBK |
Habib Bank Kenya |
2.4 |
100.0% |
1.8 |
0.8x |
Mar-17 |
|
SBM Holdings |
Fidelity Commercial Bank |
1.8 |
100.0% |
2.8 |
1.6x |
Nov-16 |
|
M Bank |
Oriental Commercial Bank |
1.8 |
51.0% |
1.3 |
1.4x |
Jun-16 |
|
I&M Holdings |
Giro Commercial Bank |
3 |
100.0% |
5 |
1.7x |
Jun-16 |
|
Mwalimu SACCO |
Equatorial Commercial Bank |
1.2 |
75.0% |
2.6 |
2.3x |
Mar-15 |
|
Centum |
K-Rep Bank |
2.1 |
66.0% |
2.5 |
1.8x |
Jul-14 |
|
GT Bank |
Fina Bank Group |
3.9 |
70.0% |
8.6 |
3.2x |
Nov-13 |
|
Average |
|
|
76.7% |
|
1.3x |
|
|
* Announcement Date ** Deals that were dropped |
||||||
Cytonn coverage:
|
Company |
Price as at 03/06/2022 |
Price as at 10/06/2022 |
w/w change |
YTD Change |
Target Price* |
Dividend Yield |
Upside/ Downside** |
P/TBv Multiple |
Recommendation |
|
I&M Group*** |
17.0 |
17.0 |
0.0% |
(20.6%) |
25.4 |
8.8% |
58.1% |
0.5x |
Buy |
|
Kenya Reinsurance |
2.1 |
2.1 |
0.5% |
(7.4%) |
3.2 |
4.7% |
54.7% |
0.2x |
Buy |
|
Liberty Holdings |
5.5 |
5.2 |
(5.1%) |
(26.1%) |
7.8 |
0.0% |
49.4% |
0.4x |
Buy |
|
Jubilee Holdings |
266.0 |
265.0 |
(0.4%) |
(16.3%) |
379.4 |
5.3% |
48.5% |
0.5x |
Buy |
|
Co-op Bank*** |
11.0 |
10.9 |
(0.5%) |
(16.2%) |
14.6 |
9.2% |
43.0% |
0.8x |
Buy |
|
Diamond Trust Bank*** |
55.0 |
50.0 |
(9.1%) |
(16.0%) |
65.6 |
6.0% |
37.2% |
0.2x |
Buy |
|
KCB Group*** |
38.7 |
39.0 |
0.8% |
(14.4%) |
50.5 |
7.7% |
37.2% |
0.8x |
Buy |
|
Equity Group*** |
45.5 |
43.2 |
(5.2%) |
(18.2%) |
56.2 |
7.0% |
37.1% |
1.1x |
Buy |
|
Standard Chartered |
123.8 |
123.8 |
0.0% |
(4.8%) |
147.1 |
11.3% |
30.1% |
1.0x |
Buy |
|
Britam |
6.3 |
6.1 |
(3.5%) |
(19.8%) |
7.7 |
0.0% |
27.1% |
1.0x |
Buy |
|
ABSA Bank*** |
10.5 |
11.5 |
9.5% |
(2.1%) |
13.4 |
9.6% |
26.3% |
1.2x |
Buy |
|
NCBA |
26.5 |
25.2 |
(4.7%) |
(1.0%) |
28.2 |
11.9% |
23.8% |
0.6x |
Buy |
|
Sanlam |
13.9 |
13.0 |
(6.5%) |
12.6% |
15.9 |
0.0% |
22.3% |
1.4x |
Buy |
|
Stanbic Holdings |
104.0 |
100.8 |
(3.1%) |
15.8% |
107.2 |
8.9% |
15.3% |
0.9x |
Accumulate |
|
CIC Group |
2.0 |
2.0 |
1.5% |
(6.5%) |
2.1 |
0.0% |
3.4% |
0.7x |
Lighten |
|
HF Group |
3.1 |
3.0 |
(4.2%) |
(21.8%) |
2.5 |
0.0% |
(16.8%) |
0.2x |
Sell |
|
*Target Price as per Cytonn Analyst estimates **Upside/ (Downside) is adjusted for Dividend Yield ***For Disclosure, these are stocks in which Cytonn and/or its affiliates are invested in |
|||||||||
We are “Neutral” on the Equities markets in the short term. With the market currently trading at a discount to its future growth (PEG Ratio at 0.9x), we believe that investors should reposition towards value stocks with strong earnings growth and that are trading at discounts to their intrinsic value. We expect the discovery of new COVID-19 variants, the upcoming Kenyan general elections and the slow vaccine rollout to continue weighing down the economic outlook. On the upside, we believe that the relaxation of COVID-19 containment measures in the country will lead to improved investor sentiments.
- Residential Sector
During the week, the Nairobi Metropolitan Services (NMS) began the second phase of revamping housing estates in select parts of Nairobi County. This follows the completion of the first phase of the rehabilitation process in May 2022, which included 760 housing units in; Kariobangi South, Buruburu, Kariokor and Jamhuri estates. The second phase of the revamping project, funded by the Ward Development Fund (WDF), will cover 884 and 360 housing units in Uhuru, and, Outering estates, respectively. Upon the completion of the rehabilitation process, the project is expected to improve living standards of residents in the aforementioned estates, as well as boost the housing rents for the units.
The government of Kenya through its various development entities such as the NMS, continue to unveil construction and rehabilitation activities geared towards improving the living standards of citizens. In support of this, our Cytonn Weekly #08/2022 highlights that the Nairobi Metropolitan Services began the redevelopment of 10 various estates in Nairobi County, with an aim of constructing 60,000 affordable housing units, in February 2022. We therefore expect a similar trend to be witnessed in the residential sector, mainly driven by government’s efforts towards improving the phase of the sector, thus ensure the housing units are more habitable.
- Infrastructure Sector
During the week, the African Development Bank (AfDB) announced plans to loan Kshs 17.5 bn towards the upgrade of the Nairobi-Nakuru Highway project totaling 233 Km, in July 2022. This represents 9.4% of the Kshs 180.0 bn road project, which is a Public Private Partnership (PPP) project between the National Government through the Kenya National Highway Authority (KeNHA), and, a consortium made up of Vinci Highways SAS, Meridian Infrastructure Africa Fund, and, Vinci Concessions SAS. The remaining capital is to be provided by other ten financial institutions including the International Financial Corporation (IFC), and, the World Bank, among others. This will therefore make it the second road project in Kenya to be tolled under the PPP strategy, after the Nairobi Expressway project that was completed and launched for operations in May 2022.
Additionally, during the week, the national government through the Kenya Rural Roads Authority (KeRRA) resumed the construction of the 54.0 Km Mto Mwagodi-Mbale-Wundanyi-Bura road project, after having stalled for more than six months due to financial constraints. As per our Cytonn Weekly#44/2021, rehabilitation of the Kshs 2.2 bn road, which is one of the biggest road projects in the region, began in November 2021, and is expected to be completed by December 2024.
Upon the completion of the above two projects, they will;
- Boost Real Estate developments in the surrounding areas,
- Ease the transportation of goods and people,
- Boost the selling and renting prices for existing properties in the area,
- Promote trade activities in the regions, and,
- Promote tourism activities by enhancing accessibility to various tourism destination areas.
Based on the above, it is evident that the Kenyan infrastructure sector continues to be an attractive investment opportunity, having also witnessed rapid developments aimed at improving the economy’s performance. In line with this, there exist other various ongoing projects across the country, which include but not limited to; the Nairobi Commuter Rail project, the Nairobi Western Bypass, Athi River-Mlolongo-Mombasa exit, and, the Eastern Bypass project. We therefore expect a similar trend in the sector mainly driven by government’s aggressive efforts to initiate, implement, and, conclude the projects through various strategies such as;
- Floating of infrastructure bonds. Example, in February 2022, the Central Bank of Kenya (CBK) floated the IFB1/2022/19 infrastructure bond worth Kshs 75.0 bn, with an aim of raising funds for infrastructure developments,
- Initiation of project partnership strategies such as PPPs and Joint Ventures (JVs), and,
- Yearly budgetary allocations, with the sector having been allocated Kshs 212.5 bn in the FY’2022/2023 Budget Statement, which is a 6.4% representation of the Kshs 3.3 tn total budget. The graph below shows the budget allocation to the transport sector over last ten financial year
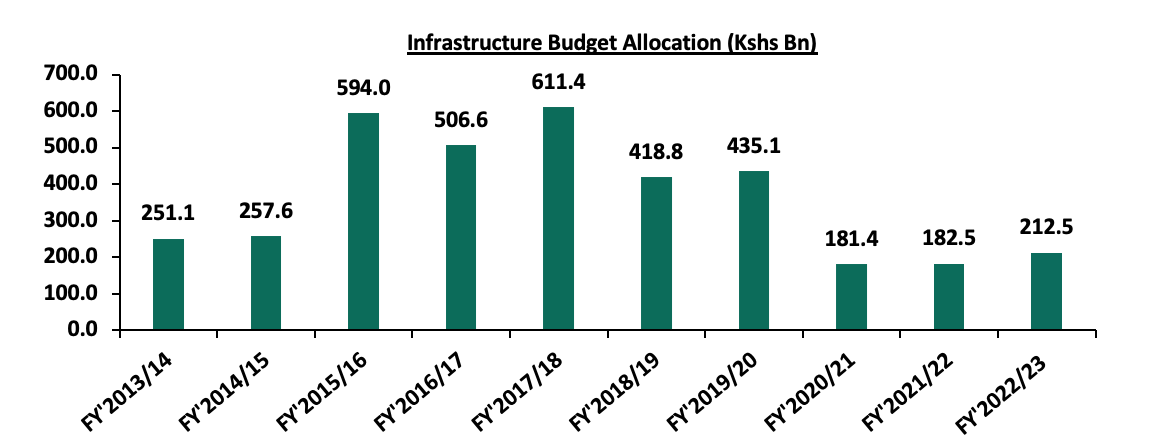
Source: National Treasury of Kenya
- Real Estate Investment Trusts (REITS)
In the Nairobi Stock Exchange, ILAM Fahari I-Reit closed the week trading at an average price of Kshs 6.02 per share. The performance represented a 0.7% Week-to-Date (WTD) increase, from Kshs 5.98 per share recorded last week. However, on a Year-to-Date (YTD) and Inception-to-Date (ITD) basis, the REIT’s performance continues to be weighed down having realized a 5.9% and 69.9% decline, respectively, from Kshs 6.4 and Kshs 20.0, respectively. The graph below shows Fahari I-REIT’s performance from November 2015 to 10th June 2022:
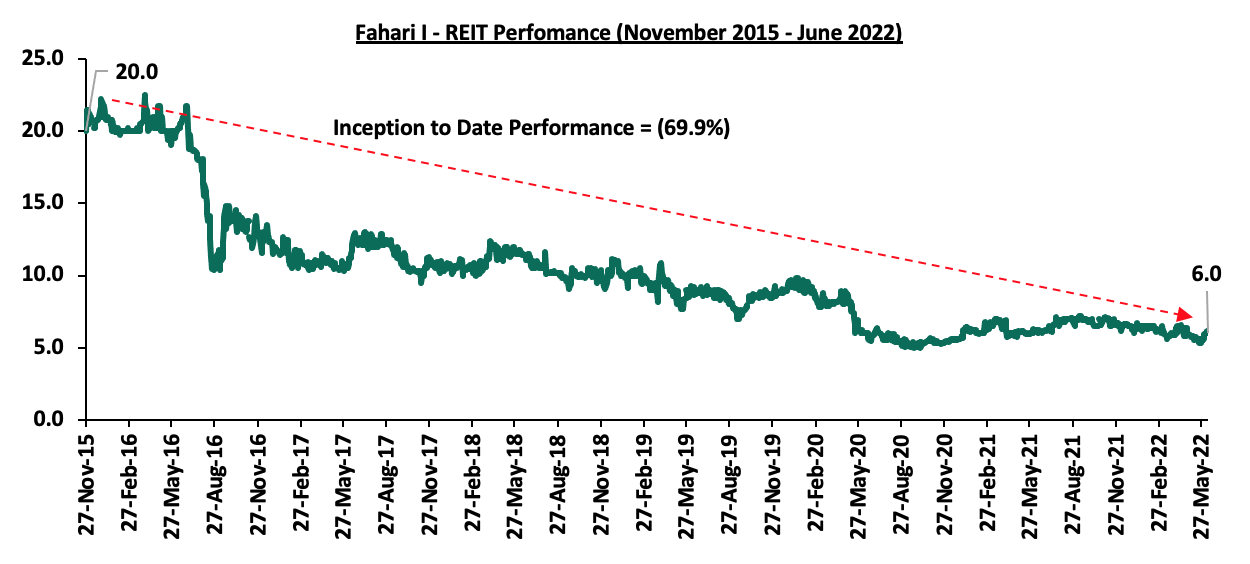
We expect Kenya’s property market to continue being shaped by; increased construction and rehabilitation activities in the housing sector, and, rapid infrastructure developments. However, setbacks such as financial constraints and, investor’s minimal appetite for the REIT instrument is expected to continue weighing down the overall investments in REITs.
Last year, we released our Nairobi Metropolitan Area (NMA) Residential Report 2021, themed “Market Performance in the Wake of a Recovering Economy” where we analyzed the performance of 32 residential nodes. This week we update our research on the Nairobi Metropolitan Area (NMA) residential sector by showcasing the sector’s performance in the region in terms of price appreciation, rental yields and market uptake, based on coverage of 35 areas located within the Nairobi Metropolis. We also discuss factors affecting residential supply and demand, the recent developments impacting the sector and conclude with a look at the investment opportunities as well as the sector’s overall outlook for the next financial year. As such, we shall discuss the following:
- Overview of the Residential Sector,
- Recent Developments,
- Residential Market Performance, and,
- Conclusion, Outlook and Investment Opportunity
Section I: Overview of the Residential Sector
In FY’2021/22, the residential sector recorded increased activities in construction, affordable housing and infrastructural development. Kenya's Real Estate and construction contribution to GDP came in at 15.9% in at 2021, a 0.4% points decline from 16.3% in 2020 according to the Kenya National Bureau of Statistics (KNBS). This was attributed to the recovery of the sector following a tough economic environment caused by the pandemic. However, the Real Estate sector GDP growth came in at 6.7% in 2021, a 2.6% points increase from 4.1% growth registered in 2021. This was attributed to resumption of economic activities that boosted Real Estate transactions. The residential sector recorded improved performance evidenced by total returns to investors registering an uptick. We expect the sector’s contribution to improve more for the rest of 2020 despite the upcoming general elections supported by;
- Government focus on infrastructural development having increased budgetary allocation to Kshs 212.5 bn for FY’2022/23 from Kshs 182.5 bn in FY’2021/22,
- Government and private sector aggressiveness in implementing housing initiative programs, with focus on affordable housing,
- The growing trend towards alternative financing for real estate development especially public-private partnerships (PPPs) delivering development projects, and,
- Increased budgetary allocation to the Kenya Mortgage Refinance Company (KMRC) to Kshs 4.6 bn in the FY’2022/23 Budget Statement from Kshs 3.5 bn in FY’2021/22. This is expected to boost mortgage financing to Primary Mortgage Lenders (PMLs) for onward lending to homebuyers.
We expect the following factors to shape the performance of the residential sector;
- Housing Deficit: There still exists a housing deficit of more than 2.0 mn units with the government’s initiative of delivering approximately 50,000 units every year still yet to be realized. With the current tough economic time, affordable housing continues to attract demand as people seek to own homes at a time when the country has seen increased unemployment and the subsequent drop in disposable incomes,
- Demographics: Kenya’s population and urbanization is growing at 2.3% and 4.0% respectively against the global average which is at 1.1% and 1.9% respectively according to World Bank. This is a key factor in driving the demand for Real Estate products and services, hence also cushion the current housing deficit which is at 2.0 mn units growing by 200,000 p.a. Kenya’s population and urbanization growth rate at 2.3% and 4.0% respectively against the global average which is at 1.1% and 1.9% respectively according to World Bank, is expected to drive the demand for Real Estate products and services, hence also cushion the current housing deficit which is at 2.0 mn units growing by 200,000 p.a, and,
- Access to Credit: The high mortgage interest rate at 11.3% and high transaction costs, has made it difficult for low and middle income earners to afford mortgages. However, the government increased the KMRC allocation to Kshs 4.6 bn for FY’2022/23, from Kshs 3.5 bn in FY’2021/2022 to enhance its capital and provide affordable loans, and we expect this to boost funding for Primary Mortgage Lenders (PMLs) for onward lending to homebuyers.
In terms of supply, the residential sector was largely constrained by insufficient access to affordable funding by developers, and bureaucracies and delays in approval processes. In 2022, new supply is also expected to slow down owing to:
- Insufficient Access to Credit: With the mortgage Non-Performing Loans (NPLs) to gross loans ratio being relatively high at 11.3%, the resultant impact is that most of the lenders will pull back or cease new lending to real estate backed loans due to the risk of default in payment, therefore we expect developers to seek alternative sources of financing such as Real Estate Investment Trusts and bonds,
- Infrastructure: Inadequate and poor infrastructure in different regions of the country limit development activities due to lack of accessibility hence supply limited as well. The insufficient drainage and sewerage systems in some areas also discourage developers due to the expected high development costs of projects, and,
- High Development Costs: Development costs remain high subject to high land and financing costs. According to Cytonn Land Report 2021, average land price per acre within Nairobi Suburbs is currently at Kshs 404.6 mn per acre, in comparison to the Satellite Town’s average of Kshs 15.7 mn per acre, thus makes it hard for developers to undertake projects without sufficient financial resources.
However, to improve profit margins and supply, developers have embraced joint venture deals and public-private partnerships (PPP) with institutions like foreign investment institutions seeking to enter the market.
Section II: Recent Developments
In FY’2021/22, the government announced the following regulations, policies and measures affecting the residential sector namely:
- National Property Rating Legislation Review: The government of Kenya announced plans to review property rates after every five years as contained in the proposed National Rating Bill, 2021, to ensure the government does not lose out on the current capital appreciations of public land in October 2021,
- The Public Private Partnerships (PPP) Bill 2021: President Uhuru Kenyatta signed the Public Private Partnerships (PPP) Bill 2021 into law in December 2021. The Act aims to address the shortcomings of the PPP Act 2013 by including a streamlined project processes with clear timelines, expanded procurement options and robust processes for privately initiated investment proposal,
- The Landlord and Tenant Bill of 2021; The Landlord and Tenant Bill of 2021 was tabled to the Senate for consideration having been passed by the National Assembly in April 2022. The Bill aims to consolidate the laws relating to renting of business and residential premises, regulating the relationship between the landlord and tenant in order to promote stability in the rental sector, and, establish tribunals to provide for the adjudication of disputes, and,
- FY’2022/23 Budget Statement: The State Department of Transport was allocated Kshs 1.4 bn in FY’2022/23 from Kshs 1.0 bn in FY’2021/22, representing a 37.4% increase. Infrastructure, was allocated Kshs 212.5 bn in the FY’2022/23 to support construction of roads and bridges as well as the rehabilitation and maintenance of roads, which is a 4.9% increase from Kshs 202.5 bn allocated in FY’2021/22.
On the affordable housing front, we continued to see both the government and private sector launching projects with low-cost housing being the main focus, and a few notable projects launched or ongoing during FY’2021/22 include:
- The Harambee Investment Cooperative Society (HICS), the investment vehicle of Harambee Sacco, announced that it is seeking a joint venture partnership with African Development Bank (AfDB), a regional multilateral development finance institution, to develop affordable housing units for 596 of its members. For more information, see Cytonn Weekly #28/2021
- The National Housing Corporation (NHC), a state owned firm, announced plans to build 2,000 affordable housing units in various parts of Kiambu County, in addition to also signing a land lease agreement with Konza City that will see the firm develop 5,000 units beginning November 2021. For more information, see Cytonn Weekly #32/2021,
- National Housing Corporation (NHC) began the demolition of 792 detached units in Changamwe Estate in Mombasa County, to pave way for Phase II upgrade of the Estate valued at Kshs 0.4 bn. For more information, see Cytonn Weekly #38/2021,
- The government through the Ministry of Transport, Infrastructure Housing, Urban Development and Public Works, launched the construction of the Stoni Athi River Waterfront City housing project in Machakos County. For more information, please see our Cytonn Monthly – November 2021,
- The Capital Markets Authority (CMA) approved the issuance of a Kshs 3.9 bn Medium Term Note (MTN) programme for Urban Housing Renewal Development Limited which will finance the construction of the ongoing Pangani Affordable Housing Project. For more information, please see our Cytonn Monthly – November 2021,
- The National Government through the Principal Secretary for Housing, Honorable Charles Hinga, announced plans to begin the construction of 5,360 affordable units in Machakos County, dubbed ‘Mavoko Affordable Housing Programme’. For more information, please see our Cytonn Weekly #50/2021,
- The Kenya Mortgage Refinance Company, a treasury backed lender, got approval from the Capital Markets Authority (CMA) to roll out a Kshs 10.5 bn medium-term bond programme. The firm aims at raising a total of Kshs 1.4 bn during the first tranche of issuance, which will be disbursed to participating primary mortgage lenders (PMLs), such as banks, microfinance institutions and Savings and Credit Cooperatives (SACCOs) at a 5.0% rate, for onward lending to homebuyers at single digit rates. For more information, see Cytonn Weekly #02/2022,
- The Capital Markets Authority (CMA) announced that the first tranche of the Kshs 10.5 bn Kenya Mortgage Refinance Company’s (KMRC) Medium Term Note (MTN) program recorded an oversubscription of 478.6%, attributable to the attractive returns offered by the bond of 12.5%. KMRC aimed to raise a total of Kshs 1.4 bn in the first tranche, received bids worth Kshs 8.1 bn and only accepted bids worth Kshs 1.4 bn. For more information, see Cytonn Weekly #08/2022,
- The Kakamega County Investment and Development Agency (KCIDA), in collaboration with Pinnie Agency Limited, a private developer, began the construction of 3,000 affordable housing units in 5 estates within Kakamega and Mumias towns. For more information, see Cytonn Weekly #11/2022, and,
- Unity Homes, a Kenyan-British housing developer announced plans to launch the construction of its third phase of housing units in Tatu City, Ruiru. The Kshs 4.3 bn project which is part of the developer’s commitment to support the government’s Big Four Affordable Housing initiative, will comprise of 1,200 apartments. For more information, see Cytonn Weekly #11/2022.
Section III: Residential Market Performance
In terms of performance, average total returns improved in FY’2021/22 to 5.8%, a 0.3% points increase from 5.5% recorded in FY’2020/21, and can be attributed to residential average y/y price appreciation, which came in at 0.9%, 0.3% points higher compared to a price appreciation of 0.6% recorded in FY’2020/21. Market uptake remained subdued coming in at 14.3% on average, 1.2% points lower than 15.1% recorded in FY’2020/21, indicating reduced demand for residential units attributed to constrained purchasing power. However, the average price per SQM came in at Kshs 118,652, 0.7% higher than FY’2020/21 average of Kshs 117,865, due to an uptick of house prices as sellers aimed to cash in on the improving business environment when the economy reopened.
|
Residential Performance Summary FY’2021/22 |
||||||||
|
Segment |
Typology |
Average Price Per SQM |
Average Rent Per SQM |
Average Occupancy |
Average Annual Uptake |
Average Rental Yield |
Average Y/Y Price Appreciation |
Average Total Returns |
|
High-End |
Detached |
191,754 |
691 |
92.0% |
12.6% |
4.0% |
1.5% |
5.5% |
|
Upper Mid-End |
Detached |
146,515 |
591 |
87.7% |
12.6% |
4.5% |
0.9% |
5.4% |
|
Lower Mid-End |
Detached |
73,037 |
329 |
87.7% |
15.0% |
5.0% |
0.8% |
5.8% |
|
Upper Mid-End |
Apartments |
125,794 |
683 |
83.8% |
16.2% |
5.3% |
0.3% |
5.6% |
|
Lower Mid-End |
Apartments |
93,772 |
510 |
85.5% |
15.0% |
5.4% |
0.3% |
5.7% |
|
Satellite Towns |
Apartments |
81,043 |
405 |
82.7% |
14.6% |
5.3% |
1.4% |
6.7% |
|
Residential Market Average |
118,652 |
535 |
86.6% |
14.3% |
4.9% |
0.9% |
5.8% |
|
Source: Cytonn Research
The average rental yields recorded a 0.1% points increase to 4.9% from 4.8% in FY’2020/21, due to increased rental rates as landlords aimed to cash in on improved property prices.
|
Residential Market Performance Summary: FY’2021/22-FY’2020/21 Comparison |
|||||||||
|
Segment |
Average of Rental Yield FY'2021/22 |
Average of Price Appreciation FY'2021/22 |
Total Returns FY'2021/22 |
Average of Rental Yield FY'2020/211 |
Average of Price Appreciation FY'2020/21 |
Average of Total Returns FY'2020/21 |
y/y change in Rental Yield (% Points) |
y/y change in Price Appreciation (% Points) |
y/y change in Total Returns (% Points) |
|
High End |
4.0% |
1.5% |
5.5% |
3.7% |
1.1% |
4.8% |
0.3% |
0.4% |
0.7% |
|
Upper Mid-End |
4.5% |
0.9% |
5.5% |
4.6% |
1.2% |
5.8% |
(0.1%) |
(0.3%) |
(0.3%) |
|
Lower Mid-End |
5.0% |
0.8% |
5.8% |
4.3% |
1.1% |
5.5% |
0.7% |
(0.3%) |
0.3% |
|
Detached Average |
4.5% |
1.1% |
5.6% |
4.2% |
1.1% |
5.4% |
0.4% |
0.3% |
0.8% |
|
Upper Mid-End |
5.3% |
0.3% |
5.6% |
5.3% |
0.3% |
5.6% |
0.0% |
0.0% |
0.0% |
|
Lower Mid-End |
5.4% |
0.3% |
5.8% |
5.3% |
0.9% |
6.2% |
0.1% |
(0.6%) |
(0.4%) |
|
Satellite Towns |
5.3% |
1.4% |
6.7% |
5.6% |
(0.9%) |
4.7% |
(0.3%) |
0.5% |
2.0% |
|
Apartments Average |
5.4% |
0.7% |
6.0% |
5.4% |
0.1% |
5.5% |
0.0% |
0.6% |
0.5% |
|
Residential Market Average |
4.9% |
0.9% |
5.8% |
4.8% |
0.6% |
5.5% |
0.1% |
0.3% |
0.3% |
Source: Cytonn Research
Sub-Market Analysis
In our submarket analysis, we classified the various suburbs in the Nairobi Metropolitan Area into three segments
- High End Segment – Consists of prime suburbs in Nairobi, such as Karen, Runda and Kitisuru. Most of these zones have been zones for low rise residential developments only and are characterized by palatial villas and bungalows on half acre parcels,
- Upper Middle Income Segment – Consists of suburbs such as Kilimani, Lavington, Kileleshwa, Loresho and Ridgeways among others. The population in these zones are middle class but with higher incomes than the average characterization of middle class. They are zones for both high rise and low density houses, and,
- Lower Middle Income Segment – Consists of suburbs in Nairobi habited by middle class such as Kikuyu, Ruaka, Dagoretti, Upper Kabete (Uthiru and parts of Mountain View), and Ngong Road (Race Course, Lenana, Corner), among others.
- Detached Units
The detached market registered improved performance in returns, coming in at 5.6% in FY’2021/22 thus representing a 0.2% points y/y increase from 5.4% recorded in FY’2020/21. The average rental yields came in at 4.5%, 0.3% points higher than 4.2% recorded in FY’2020/21 attributable to increased rental rates while house prices remained flat, coming in at 1.1% in FY’2021/22.
In the high-end segment, Runda was the only node that recorded an average y/y price correction of 1.6% attributed to the relatively low uptake which came in at 10.0%, 2.6% points lower than the high-end market average of 12.6%. Notably, all nodes in the high-end segment recorded increases in average rental yields in FY’2021/22 compared to FY’2020/21 aside from Karen, with the market’s average rental yield coming in at 3.7%, 0.1% point lower than 3.8% recorded in the last financial year indicating high demand for rental units.
The lower mid-end segment was the best performing segment with an average total return of 5.8% compared to the high-end and lower mid-end segments whose average total returns came in at 5.5% and 5.4%, respectively, attributed to the high rental yield of 5.0% and 0.8% y/y price appreciation. Ruiru was the best performing node in the segment with an average total return of 7.8% attributed to the relatively high average rental yield, which came in at 5.9%.
|
Area |
Average of Occupancy FY'2021/22 |
Average of Annual Uptake FY'2021/22 |
Average of Rental Yield FY'2021/22 |
Average of Price Appreciation FY'2021/22 |
Total Returns |
Average of Rental Yield FY'2020/21 |
Average of Price Appreciation FY'2020/21 |
Total Returns FY'2020/21 |
Change in Rental Yield (% Points) |
Change in Price Appreciation (% Points) |
Change in Total Returns (% Points) |
||||||||||||||||||
|
High-End |
|||||||||||||||||||||||||||||
|
Rosslyn |
88.4% |
14.5% |
4.7% |
2.8% |
7.5% |
4.4% |
1.1% |
5.5% |
0.4% |
1.9% |
2.3% |
||||||||||||||||||
|
Karen |
86.0% |
12.8% |
3.7% |
2.0% |
5.7% |
3.8% |
0.8% |
4.5% |
(0.1%) |
1.2% |
1.2% |
||||||||||||||||||
|
Kitisuru |
93.4% |
12.3% |
4.2% |
1.2% |
5.4% |
3.8% |
2.7% |
6.5% |
0.4% |
(1.5%) |
(1.2%) |
||||||||||||||||||
|
Lower Kabete |
98.8% |
13.4% |
3.6% |
1.2% |
4.8% |
2.8% |
2.5% |
5.2% |
0.8% |
(1.3%) |
(0.3%) |
||||||||||||||||||
|
Runda |
93.5% |
10.0% |
4.1% |
0.3% |
4.4% |
3.7% |
(1.6%) |
2.1% |
0.3% |
1.7% |
2.0% |
||||||||||||||||||
|
Average |
92.0% |
12.6% |
4.0% |
1.5% |
5.5% |
3.7% |
1.1% |
4.8% |
0.3% |
0.4% |
0.7% |
||||||||||||||||||
|
Upper Mid-End |
|||||||||||||||||||||||||||||
|
Redhill & Sigona |
88.9% |
14.4% |
4.7% |
1.7% |
6.4% |
5.2% |
1.3% |
6.5% |
(0.5%) |
0.4% |
(0.1%) |
||||||||||||||||||
|
Ridgeways |
82.2% |
12.8% |
5.0% |
1.1% |
6.1% |
5.2% |
1.2% |
6.3% |
(0.2%) |
(0.1%) |
(0.2%) |
||||||||||||||||||
|
Runda Mumwe |
89.1% |
12.4% |
5.1% |
0.6% |
5.7% |
4.3% |
2.0% |
6.3% |
0.8% |
(1.4%) |
(0.5%) |
||||||||||||||||||
|
South B/C |
89.5% |
12.8% |
4.2% |
1.1% |
5.3% |
4.8% |
1.2% |
6.0% |
(0.6%) |
(0.1%) |
(0.7%) |
||||||||||||||||||
|
Loresho |
80.5% |
13.2% |
4.9% |
0.3% |
5.2% |
4.8% |
1.5% |
6.3% |
0.1% |
(1.2%) |
(1.1%) |
||||||||||||||||||
|
Langata |
92.6% |
10.0% |
3.8% |
1.0% |
4.8% |
3.9% |
0.8% |
4.8% |
(0.1%) |
0.2% |
0.0% |
||||||||||||||||||
|
Lavington |
91.2% |
12.7% |
4.0% |
0.5% |
4.5% |
4.4% |
0.3% |
4.7% |
(0.4%) |
0.2% |
(0.2%) |
||||||||||||||||||
|
Average |
87.7% |
12.6% |
4.5% |
0.9% |
5.4% |
4.6% |
1.2% |
5.8% |
(0.1%) |
(0.3%) |
(0.4%) |
||||||||||||||||||
|
Lower Mid-End |
|||||||||||||||||||||||||||||
|
Ruiru |
85.4% |
18.6% |
5.9% |
1.9% |
7.8% |
5.0% |
1.6% |
6.6% |
0.9% |
0.3% |
1.2% |
||||||||||||||||||
|
Juja |
86.3% |
16.8% |
5.5% |
1.2% |
6.7% |
4.6% |
1.0% |
5.6% |
0.9% |
0.2% |
1.1% |
||||||||||||||||||
|
Kitengela |
85.3% |
12.3% |
4.9% |
1.4% |
6.3% |
4.7% |
0.4% |
5.1% |
0.2% |
1.0% |
1.2% |
||||||||||||||||||
|
Ngong |
89.2% |
12.3% |
6.5% |
(0.2%) |
6.3% |
5.0% |
(0.2%) |
4.9% |
1.5% |
(0.0%) |
1.4% |
||||||||||||||||||
|
Syokimau/Mlolongo |
86.6% |
18.2% |
4.5% |
1.5% |
6.0% |
4.4% |
2.1% |
6.5% |
0.1% |
(0.6%) |
(0.5%) |
||||||||||||||||||
|
Athi River |
86.6% |
13.1% |
4.3% |
1.6% |
5.9% |
3.8% |
0.7% |
4.4% |
0.5% |
0.9% |
1.5% |
||||||||||||||||||
|
Rongai |
95.4% |
16.4% |
4.0% |
1.1% |
5.1% |
2.9% |
2.2% |
5.1% |
1.1% |
(1.1%) |
0.0% |
||||||||||||||||||
|
Thika |
82.3% |
13.5% |
5.3% |
(0.5%) |
4.8% |
||||||||||||||||||||||||
|
Donholm & Komarock |
92.5% |
13.3% |
4.3% |
(1.0%) |
3.3% |
||||||||||||||||||||||||
|
Average |
87.7% |
15.0% |
5.0% |
0.8% |
5.8% |
3.8% |
0.7% |
4.4% |
0.7% |
(0.3%) |
0.3% |
||||||||||||||||||
|
Detached Units Average |
89.2% |
13.4% |
4.5% |
1.1% |
5.6% |
4.2% |
1.1% |
5.4% |
0.3% |
0.0% |
0.2% |
||||||||||||||||||
Source: Cytonn Research
- Apartments
Apartments recorded improved performance with average returns to investors coming in at 6.0% in FY’2021/22, a 0.5% points increase from 5.5% recorded in FY’2020/21. The average y/y price appreciation registered a 0.6% y/y increase to 0.7% in FY’2021/22, up from the price appreciation of 0.1% in FY’2020/21. However, the rental yields remained flat at 5.4% in FY’2021/22 similar last year.
The upper mid-end segment recorded an average price appreciation of 0.3% as all markets experienced price appreciations apart from Upperhill which recorded a price correction of 1.1%. This is attributable to reduced demand for residential premises in Upperhill as clientele preferred satellite town. Satellite Towns recorded the highest total returns at 6.7% driven by demand for renting units in satellite towns due to their affordability. Thindigua and Ruaka recorded the highest annual total returns in the segment at 7.5% and 7,4%, respectively supported by a relatively high price appreciation which came in at 2.2% for each of the nodes. This is due to continued demand in the area driven by the area’s proximity to upper markets such as Runda and proximity to social amenities.
Waiyaki way recorded the highest returns in the lower mid-end suburb segment at 7.3%, compared to the apartment’s market average of 6.0% as well as the highest price appreciation at 1.1% compared to the market’s average of 0.7%. The area’s performance is boosted by the improving infrastructure especially construction of the Nairobi Expressway that boosted property prices upon completion.
|
Apartments Performance 2020/21 |
|||||||||||
|
Area |
Average of Occupancy FY'2021/22 |
Average of Annual Uptake FY'2021/22 |
Average of Rental Yield FY'2021/22 |
Average of Price Appreciation FY'2021/22 |
Total Returns |
Average of Rental Yield FY'2020/21 |
Average of Price Appreciation FY'2020/21 |
Total Returns FY'2020/21 |
Change in Rental Yield (% Points) |
Change in Price Appreciation (% Points) |
Change in Total Returns (% Points) |
|
Upper Mid-End |
|||||||||||
|
Westlands |
83.8% |
24.9% |
5.9% |
0.1% |
6.0% |
4.9% |
2.0% |
6.9% |
1.0% |
(1.9%) |
(0.9%) |
|
Kileleshwa |
86.4% |
15.0% |
5.5% |
0.4% |
5.9% |
5.4% |
(0.6%) |
4.7% |
0.1% |
1.0% |
1.2% |
|
Kilimani |
83.4% |
15.0% |
5.5% |
0.4% |
5.9% |
5.9% |
(0.2%) |
5.7% |
(0.4%) |
0.6% |
0.2% |
|
Loresho |
87.8% |
10.4% |
4.7% |
1.2% |
5.9% |
4.9% |
(1.6%) |
3.3% |
(0.2%) |
2.6% |
2.6% |
|
Parklands |
82.8% |
13.7% |
4.8% |
1.0% |
5.8% |
5.6% |
2.0% |
7.6% |
(1.4%) |
(1.0%) |
(2.6%) |
|
Upperhill |
80.5% |
11.1% |
5.1% |
(1.1%) |
4.0% |
5.3% |
0.4% |
5.7% |
(0.2%) |
(1.5%) |
(0.4%) |
|
Average |
83.8% |
16.2% |
5.3% |
0.3% |
5.6% |
5.3% |
0.3% |
5.7% |
0.0% |
0.0% |
(0.1%) |
|
Lower Mid-End: Suburbs |
|||||||||||
|
Waiyaki Way |
84.1% |
18.3% |
6.2% |
1.1% |
7.3% |
5.6% |
2.5% |
8.1% |
0.6% |
1.4% |
(0.8%) |
|
South C |
82.3% |
18.2% |
6.1% |
0.4% |
6.5% |
5.9% |
1.2% |
7.1% |
0.2% |
(0.8%) |
(0.6%) |
|
Imara Daima |
87.3% |
12.9% |
5.2% |
1.2% |
6.4% |
5.2% |
(0.1%) |
5.0% |
0.0% |
0.3% |
1.4% |
|
Dagoretti |
88.1% |
14.4% |
5.9% |
0.1% |
5.9% |
6.3% |
1.1% |
7.4% |
(0.4%) |
(1.0%) |
(1.5%) |
|
Donholm & Komarock |
93.1% |
12.5% |
5.8% |
0.1% |
5.9% |
5.3% |
1.1% |
6.4% |
0.5% |
(1.0%) |
(0.5%) |
|
Race Course/Lenana |
81.9% |
19.9% |
5.9% |
(0.1%) |
5.8% |
5.8% |
(0.3%) |
5.6% |
0.1% |
0.2% |
0.2% |
|
Kahawa West |
88.8% |
10.7% |
5.2% |
0.6% |
5.7% |
5.0% |
1.7% |
6.7% |
0.2% |
(1.1%) |
(1.0%) |
|
South B |
82.4% |
14.9% |
4.2% |
0.2% |
4.4% |
4.0% |
2.3% |
6.3% |
0.2% |
(2.1%) |
(1.9%) |
|
Langata |
81.2% |
13.0% |
4.5% |
(0.6%) |
4.0% |
4.7% |
(1.3%) |
3.4% |
(0.2%) |
0.7% |
1.3% |
|
Average |
85.5% |
15.0% |
5.4% |
0.3% |
5.7% |
5.3% |
0.9% |
6.2% |
(0.5%) |
(0.6%) |
0.4% |
|
Lower Mid-End: Satellite Towns |
|||||||||||
|
Thindigua |
87.2% |
17.5% |
5.4% |
2.2% |
7.5% |
4.9% |
1.2% |
6.0% |
(1.0%) |
(0.8%) |
1.5% |
|
Ruaka |
81.0.% |
22.0% |
5.2% |
2.2% |
7.4% |
5.5% |
2.0% |
7.5% |
0.0% |
1.9% |
(0.1%) |
|
Kikuyu |
71.5% |
14.9% |
5.2% |
2.1% |
7.3% |
6.4% |
0.3% |
6.7% |
1.4% |
2.0% |
(0.6%) |
|
Ngong |
78.0% |
11.5% |
5.6% |
1.6% |
7.2% |
5.3% |
0.7% |
5.9% |
0.3% |
0.9% |
(1.3%) |
|
Ruiru |
84.3% |
17.3% |
5.6% |
1.4% |
7.0% |
6.1% |
(1.8%) |
4.3% |
1.5% |
(1.8%) |
3.3% |
|
Athi River |
83.3% |
13.7% |
5.5% |
1.2% |
6.7% |
5.7% |
(1.2%) |
4.5% |
(0.4%) |
(1.2%) |
2.5% |
|
Syokimau |
87.4% |
12.1% |
5.0% |
1.6% |
6.6% |
5.2% |
(2.2%) |
6.0% |
(0.5%) |
(1.4%) |
0.6% |
|
Rongai |
88.8% |
12.1% |
5.8% |
(0.1%) |
5.7% |
6.3% |
(3.9%) |
2.4% |
(0.5%) |
0.8% |
3.3% |
|
Kitengela |
82.7% |
10.1% |
4.9% |
0.1% |
5.0% |
5.1% |
(2.8%) |
5.5% |
(0.2%) |
(2.9%) |
(0.5%) |
|
Average |
82.7% |
14.6% |
5.3% |
1.4% |
6.7% |
5.6% |
(0.9%) |
4.7% |
(0.3%) |
2.3% |
2.0% |
|
Apartments Average |
84.0% |
15.3% |
5.4% |
0.7% |
6.0% |
5.4% |
0.1% |
5.5% |
0.0% |
0.6% |
0.5% |
Source: Cytonn Research
Section IV: Conclusion, Outlook and Investment Opportunity
We use demand, access to credit, infrastructure and performance, as the key metrics to gauge our sentiment for the sector going forward.
|
Residential Market Outlook |
|||
|
Measure |
FY’2021/22 Experience and Outlook Going Forward |
2021 Outlook |
2022 Outlook |
|
Demand |
|
Positive |
Positive |
|
Access to funding |
|
Neutral |
Negtive |
|
Infrastructure |
|
Positive |
Positive |
|
Performance |
|
Neutral |
Neutral |
Our overall outlook for the sector is NEUTRAL with a positive outlook on housing demand and infrastructure, neutral outlook on performance and negative outlook on access to funding. For apartments, the best opportunity is investment in areas such as Thindigua, Ruaka, Waiyaki Way, and Kikuyu driven by returns, appreciation as well as state of infrastructure and amenities; for detached units, the best investment opportunity is in areas such as Ruiru, Rosslyn, Juja and Redhill, driven by uptake and the current performance in terms of returns to investors. For more information, see the full report.
Disclaimer: The views expressed in this publication are those of the writers where particulars are not warranted. This publication, which is in compliance with Section 2 of the Capital Markets Authority Act Cap 485A, is meant for general information only and is not a warranty, representation, advice or solicitation of any nature. Readers are advised in all circumstances to seek the advice of a registered investment advisor.

- Talk to us
- Kenya
- P.O Box 20695 - 00200, Nairobi, Kenya
- Cell +254709101200
- Tel +254709101200
- WhatsApp +254741676635
- United States
- +254709101200
- DOWNLOAD OUR APP
-


- Kenya
- 8th Floor, Pinetree Plaza, Kaburu Drive, Ngong Road, Nairobi, Kenya
- USA
- Suite 1150, 1775 Eye Street NW, USA, Washington DC 20006, USA
- Investments
- High Yield
- Private Equity
- Real Estate
- Real Estate
- RiverRun Estates
- Cytonn Towers
- The Ridge
- Taraji Heights
- The Alma