Kenya’s Real Estate Investment Trusts (REITs) H1’2024 Report, & Cytonn Weekly #34/2024
By Research Team, Aug 25, 2024
Executive Summary
Fixed Income
During the week, T-bills were undersubscribed for the first time in five weeks, with the overall undersubscription rate coming in at 79.9%, a reversal from the oversubscription rate of 107.3% recorded the previous week. Investors’ preference for the shorter 91-day paper persisted, with the paper receiving bids worth Kshs 7.9 bn against the offered Kshs 4.0 bn, translating to an oversubscription rate of 197.8%, albeit lower than the oversubscription rate of 262.9% recorded the previous week. The subscription rate for the 182-day decreased to 57.6% from the 110.4% recorded last week, while the rate for the 364-day paper increased to 55.0% from the 41.8% recorded the previous week. The government accepted a total of Kshs 17.1 bn worth of bids out of Kshs 19.2 bn bids received, translating to an acceptance rate of 89.3%. The yields on the government papers were on a downward trajectory, with the yields on the 364-day, 182-day, and 91-day papers decreasing by 0.7 bps, 3.9 bps, and 1.5 bps to 16.86%, 16.67%, and 15.79% respectively from 16.87%, 16.71%, and 15.81% respectively recorded the previous week;
In the primary bond market, the government is looking to raise Kshs 15.0 bn through the reopened infrastructure bond IFB/2023/17 with a tenor to maturity of 15.7 years. The bond will be offered at a fixed coupon rate of 14.4% and a yield of 17.7%;
Also, during the week, S&P Global Ratings announced its revision of Kenya’s long-term sovereign credit rating, downgrading it to B-, and a stable outlook from a credit rating of B and a negative outlook, on the back of the government's decision to forgo proposed tax increases through the Finance Bill 2024 and rely on expenditure cuts, significantly impacting Kenya's fiscal trajectory and financing needs;
Additionally, we are projecting the y/y inflation rate for August 2024 to come in at the range of 4.4% - 4.7% mainly on the back of the Central Bank Rate cut and increased electricity prices;
Equities
During the week, the equities market was on an upward trajectory, with NSE 20 gaining the most by 3.4%, while NSE 25, NASI, and NSE 10 gained by 3.1%, 2.4 and 1.3% each respectively, taking the YTD performance to gains of 18.4%, 18.2%, 14.1% and 12.6% for NSE 25, NSE 10, NASI, and NSE 20 respectively. The equities market performance was driven by gains recorded by large-cap stocks such as Standard Chartered Bank, NCBA Bank, and KCB Group of 10.4%, 7.7%, and 7.0% respectively. The performance was however weighed down by losses recorded by large-cap stocks such as Cooperative Bank, EABL, and DTB-K of 6.4%, 5.1%, and 0.2% respectively;
During the week, I&M Group Holdings released their H1’2024 financial results, recording a 21.1% increase in Profit After Tax (PAT) to Kshs 6.1 bn, from Kshs 5.0 bn in H1’2023. The performance was mainly driven by a 35.2% increase in Net Interest Income to Kshs 16.5 bn, from Kshs 12.2 bn in H1’2023, but was weighed down by a 10.9% decrease in Non-Interest Income to Kshs 6.2 bn from Kshs 6.9 bn recorded over a similar period in 2023, taking the Total Operating Income to Kshs 22.7 bn, from Kshs 19.1 bn in H1’2023;
During the week, Standard Chartered Bank of Kenya released H1’2024 financial results, noting a 48.9% increase in Profit After Tax (PAT) to Kshs 10.3 bn, from Kshs 6.9 bn in H1’2023. The performance was mainly driven by a 24.9% increase in Total Operating Income to Kshs 26.1 bn, from Kshs 20.9 bn in H1’2023, attributable to the 36.1% increase in Net Non-Interest Income to Kshs 9.6 bn from Kshs 7.0 bn recorded in H1’2023;
Also during the week, NCBA Bank released their H1’2024 Financial results, recording a 5.0% in Profit After Tax (PAT) to Kshs 9.8 bn, from Kshs 9.3 bn recorded in H1’2023. The performance was mainly driven by a 7.9% increase in Net non-Interest Income to Kshs 14.9 bn in H1’2024, from Kshs 13.8 bn recorded in H1’2023, but was weighed down by a 4.4% decrease in Net Interest Income to Kshs 16.5 bn from Kshs 17.2 bn recorded in H1’2023;
In addition, during the week, KCB Group announced their H1’2024 financial results, recording an 86.4% increase in Profit After Tax (PAT) to Kshs 29.9 bn, from Kshs 16.1 bn in H1’2023. The performance was mainly driven by a 34.8% increase in net interest income to Kshs 61.3 bn in H1’2024, from Kshs 45.5 bn in H1’2023, coupled with a 20.8% increase in net non-interest income to Kshs 33.3 bn from Kshs 27.6 bn in H1’2023;
During the week, HF Group released their H1’2024 financial results, recording a 46.3% increase in Profit After Tax (PAT) to Kshs 0.3 bn, from Kshs 0.2 bn recorded in H1’2023. The performance was mainly driven by a 12.5% increase in Total Operating income to Kshs 2.0 bn in H1’2024, from Kshs 1.8 bn in H1’2023 which outpaced the 8.9% increase in Total Operating expenses to Kshs 1.8 bn, from Kshs 1.6 bn in H1’2023;
During the week, Liberty Kenya Holdings released their H1’2024 results, having fully implemented the new IFRS 17 reporting system. Liberty Kenya Holdings’ Profit After Tax (PAT) increased by 196.7% to Kshs 0.6 bn, from Kshs 0.2 bn recorded in H1’2023, mainly driven by an 851.9% increase in Net insurance income to Kshs 0.5 bn, from Kshs 0.1 bn in H1’2023, and further supported by a 39.2% increase in Net investment income to Kshs 1.0 bn, from Kshs 0.7 bn in H1’2023,
During the week, CIC Group released their H1’2024 results. CIC’s Profit After Tax (PAT) increased marginally by 0.6% to remain relatively flat at the Kshs 0.7 bn, recorded in H1’2023. The performance was mainly driven by a 35.7% increase in Net investment income to Kshs 1.8 bn in H1’2024, from Kshs 1.3 bn in H1’2023, and further supported by a 21.4% increase in Net income from insurance service to Kshs 1.0 bn, from Kshs 0.9 bn in H1’2023. However, the performance was weighed down by the 61.5% increase in net expenses from reinsurance contracts to Kshs 1.4 bn, from Kshs 0.9 bn in H1’2024;
Real Estate
During the week, Megna Homes, a Mombasa-based developer, launched the construction of its Kshs 4.0 bn modern gated community housing project in Kwa Sonko area, Kisauni, Mombasa County. The project, dubbed ‘Santana’ is set to sit on 12.0 acres of land and will comprise 816 modern units, including 336 three-bedroom units, 432 two-bedroom units, and 48 one-bedroom units with prices starting at Kshs 2.6 mn. Additionally, Shelter Afrique Development Bank (ShafDB), a leading Pan-African financing institution focused on housing, urban, and related infrastructure development, announced the signing of a Memorandum of Understanding (MOU) with CPF Group to partner in affordable housing projects in Kenya through the establishment of a joint Housing Solutions Fund, targeting improving both the supply and demand sides of affordable housing units;
During the week, state-backed mortgage lender, Kenya Mortgage Refinance Company (KMRC) released its H1’2024 financial results, which posted an 84.4% increase in Profit after Tax (PAT) to Kshs 669.0 mn in H1’2024 from Kshs 362.8 mn in H1’2023. Additionally, the balance sheet expanded, with total assets registering a 15.0% increase to Kshs 24.9 bn in H1’2024 from Kshs 24.7 bn in H1’2023, driven by a 14.7% increase in loans advanced, which came in at Kshs 8.7 bn from Kshs 7.6 bn in H1’2023;
In the retail sector, China Square, an international retail company, opened its latest store in Nyali, Mombasa County marking its 4th outlet in the country. The retail store which was officially opened to the public on 20th August, 2024 is situated at the Nyali Bazaar Mall along Links Road with an aim of providing affordable household products to residents;
On the Unquoted Securities Platform, Acorn D-REIT and I-REIT traded at Kshs 25.4 and Kshs 22.2 per unit, respectively, as per the last updated data on 23rd August 2024. The performance represented a 27.0% and 11.0% gain for the D-REIT and I-REIT, respectively, from the Kshs 20.0 inception price. Additionally, ILAM Fahari I-REIT traded at Kshs 11.0 per share as of 23rd August, 2024, representing a 45.0% loss from the Kshs 20.0 inception price;
Focus of the Week
Following the release of the H1’2024 results by all four authorized Real Estate Investment Trusts (REITs) in Kenya, the Cytonn Real Estate Research Team undertook an analysis of the financial performance of the REITs and identified the key factors that shaped the performance of the sector. The report will discuss the background and structure of REITs in Kenya, and assess the financial performance of the current REITs in the market during H1’2024 in terms of operational metrics, profitability metrics, leverage ratios, liquidity ratios, and valuation metrics.
Investment Updates:
- Weekly Rates:
- Cytonn Money Market Fund closed the week at a yield of 18.28% p.a., while Cytonn Money Market fund USD closed at 7.63%. To invest, dial *809# or download the Cytonn App from Google Play store here or from the Appstore here;
- We continue to offer Wealth Management Training every Tuesday, from 7:00 pm to 8:00 pm and Saturday from 10:00am to 11:00am. The training aims to grow financial literacy among the general public. To register for any of our Wealth Management Trainings, click here;
- If interested in our Private Wealth Management Training for your employees or investment group, please get in touch with us through wmt@cytonn.com;
- Cytonn Insurance Agency acts as an intermediary for those looking to secure their assets and loved ones’ future through insurance namely; Motor, Medical, Life, Property, WIBA, Credit and Fire and Burglary insurance covers. For assistance, get in touch with us through insuranceagency@cytonn.com;
- Cytonn Asset Managers Limited (CAML) continues to offer pension products to meet the needs of both individual clients who want to save for their retirement during their working years and Institutional clients that want to contribute on behalf of their employees to help them build their retirement pot. To more about our pension schemes, kindly get in touch with us through pensions@cytonn.com;
Real Estate Updates:
- For more information on Cytonn’s real estate developments, email us at sales@cytonn.com;
- Phase 3 of The Alma is now ready for occupation and the show house is open daily. To join the waiting list to rent, please email properties@cytonn.com;
- For Third Party Real Estate Consultancy Services, email us at rdo@cytonn.com;
- For recent news about the group, see our news section here;
Hospitality Updates:
- We currently have promotions for Staycations. Visit cysuites.com/offers for details or email us at sales@cysuites.com;
Money Markets, T-Bills Primary Auction:
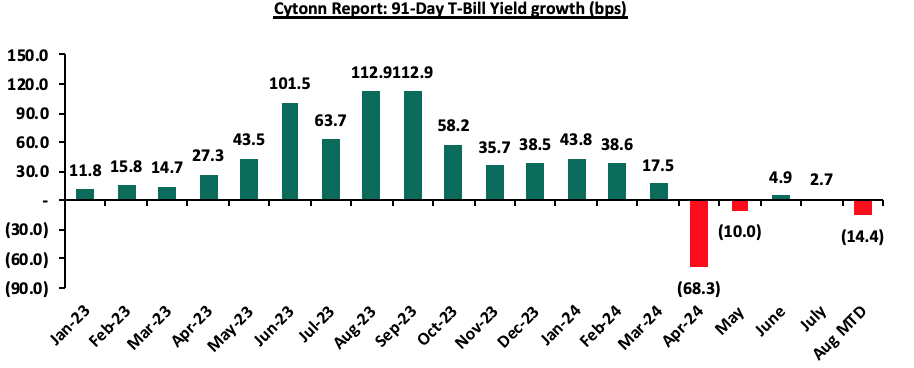
During the week, T-bills were undersubscribed for the first time in five weeks, with the overall undersubscription rate coming in at 79.9%, a reversal from the oversubscription rate of 107.3% recorded the previous week. Investors’ preference for the shorter 91-day paper persisted, with the paper receiving bids worth Kshs 7.9 bn against the offered Kshs 4.0 bn, translating to an oversubscription rate of 197.8%, albeit lower than the oversubscription rate of 262.9% recorded the previous week. The subscription rate for the 182-day decreased to 57.6% from the 110.4% recorded last week, while the rate for the 364-day paper increased to 55.0% from the 41.8% recorded the previous week. The government accepted a total of Kshs 17.1 bn worth of bids out of Kshs 19.2 bn bids received, translating to an acceptance rate of 89.3%. The yields on the government papers were on a downward trajectory, with the yields on the 364-day, 182-day, and 91-day papers decreasing by 0.7 bps, 3.9 bps, and 1.5 bps to 16.86%, 16.67%, and 15.79% respectively from 16.87%, 16.71% and 15.81% respectively recorded the previous week. The chart below shows the yield growth rate for the 91-day paper over the period:
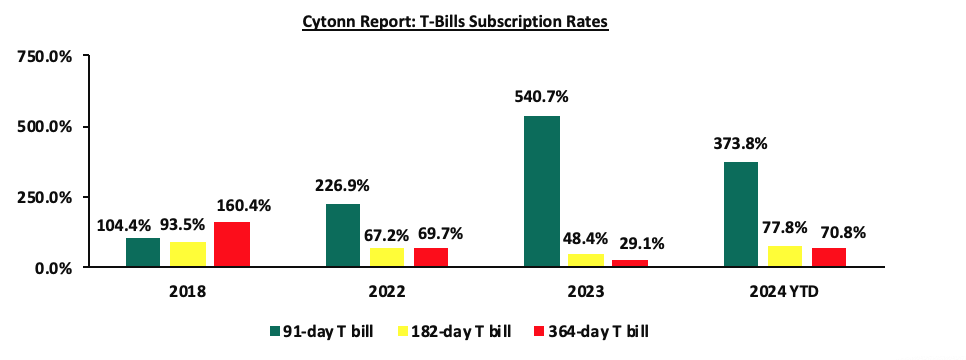
The chart below compares the overall average T-bill subscription rates obtained in 2018, 2022, 2023, and 2024 Year-to-date (YTD):
Also, In the primary bond market, the government is looking to raise Kshs 15.0 bn through the reopened infrastructure bond IFB/2023/17 with a tenor to maturity of 15.7 years. The bond will be offered at fixed coupon rates of 14.4% and a yield of 17.7%;
Money Market Performance:
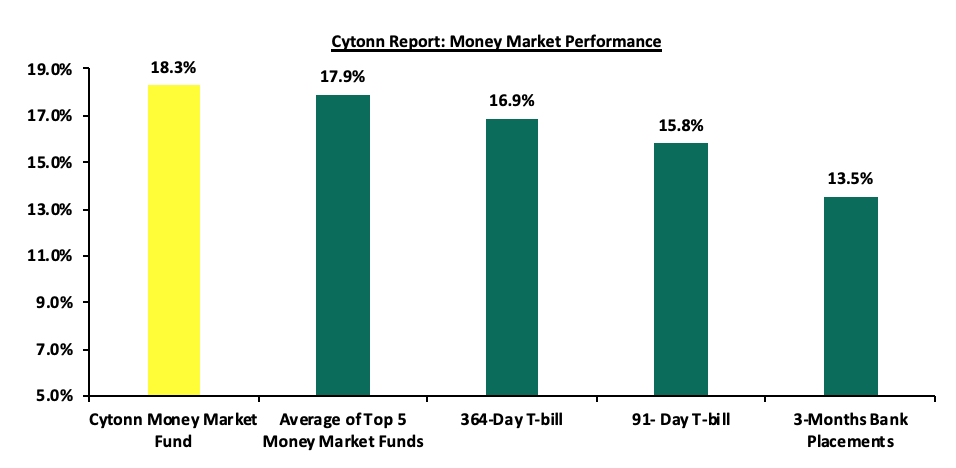
In the money markets, 3-month bank placements ended the week at 13.5% (based on what we have been offered by various banks), and the yields on the government papers were on a downward trajectory, with the yields on the 364-day and 91-day papers decreasing by 0.7 bps and 1.5 bps to remain relatively unchanged at 16.9% and 15.8% respectively, recorded the previous week. The yields on the Cytonn Money Market Fund increased marginally by 1.0 bps to close the week at 18.3% remaining relatively unchanged from last week, while the average yields on the Top 5 Money Market Funds increased by 1.8 bps to also remain relatively unchanged at the 17.9% recorded the previous week.
The table below shows the Money Market Fund Yields for Kenyan Fund Managers as published on 23rd August 2024:
|
Cytonn Report: Money Market Fund Yield for Fund Managers as published on 23rd August 2024 |
||
|
Rank |
Fund Manager |
Effective Annual Rate |
|
1 |
Cytonn Money Market Fund (Dial *809# or Download the Cytonn App) |
18.3% |
|
2 |
Lofty-Corban Money Market Fund |
18.2% |
|
3 |
Etica Money Market Fund |
18.1% |
|
4 |
Kuza Money Market fund |
17.4% |
|
5 |
Arvocap Money Market Fund |
17.3% |
|
6 |
GenAfrica Money Market Fund |
16.6% |
|
7 |
Nabo Africa Money Market Fund |
16.4% |
|
8 |
GenCap Hela Imara Money Market Fund |
16.2% |
|
9 |
Madison Money Market Fund |
16.2% |
|
10 |
Jubilee Money Market Fund |
16.1% |
|
11 |
Enwealth Money Market Fund |
16.0% |
|
12 |
KCB Money Market Fund |
15.8% |
|
13 |
Co-op Money Market Fund |
15.6% |
|
14 |
Absa Shilling Money Market Fund |
15.5% |
|
15 |
Sanlam Money Market Fund |
15.4% |
|
16 |
Mayfair Money Market Fund |
15.3% |
|
17 |
Mali Money Market Fund |
15.2% |
|
18 |
Apollo Money Market Fund |
15.1% |
|
19 |
AA Kenya Shillings Fund |
14.9% |
|
20 |
Orient Kasha Money Market Fund |
14.6% |
|
21 |
Dry Associates Money Market Fund |
13.9% |
|
22 |
ICEA Lion Money Market Fund |
13.8% |
|
23 |
Equity Money Market Fund |
13.8% |
|
24 |
CIC Money Market Fund |
13.7% |
|
25 |
Old Mutual Money Market Fund |
13.6% |
|
26 |
British-American Money Market Fund |
13.3% |
Source: Business Daily
Liquidity:
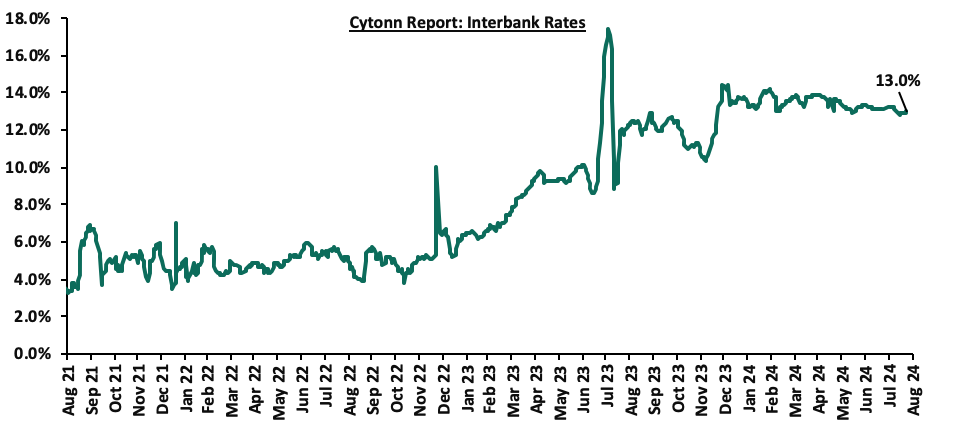
During the week, liquidity in the money markets tightened, with the average interbank rate increasing by 5.1 bps, to remain relatively unchanged from the 12.9% recorded the previous week, partly attributable to tax remittances that offset government payments. The average interbank volumes traded decreased significantly by 43.7% to Kshs 14.6 bn from Kshs 25.9 bn recorded the previous week. The chart below shows the interbank rates in the market over the years:
Kenya Eurobonds:
During the week, the yields on Eurobonds were on a downward trajectory, with the yields on the 10-year Eurobond issued in 2018 decreasing the most by 39.9 bps to 10.4% from 10.8% recorded the previous week, attributable to improved investor sentiment following the recent quiet after the anti-finance bill protests. The table below shows the summary of the performance of the Kenyan Eurobonds as of 23rd August 2024;
|
Cytonn Report: Kenya Eurobonds Performance |
||||||
|
|
2018 |
2019 |
2021 |
2024 |
||
|
Tenor |
10-year issue |
30-year issue |
7-year issue |
12-year issue |
13-year issue |
7-year issue |
|
Amount Issued (USD) |
1.0 bn |
1.0 bn |
0.9 bn |
1.2 bn |
1.0 bn |
1.5 bn |
|
Years to Maturity |
3.6 |
23.6 |
2.8 |
7.8 |
9.8 |
6.5 |
|
Yields at Issue |
7.3% |
8.3% |
7.0% |
7.9% |
6.2% |
10.4% |
|
1-Jan-24 |
9.8% |
10.2% |
10.1% |
9.9% |
9.5% |
|
|
1-Aug-24 |
10.7% |
11.1% |
10.6% |
11.0% |
10.9% |
11.1% |
|
15-Aug-24 |
10.8% |
11.1% |
10.6% |
10.9% |
10.8% |
11.1% |
|
16-Aug-24 |
10.6% |
10.9% |
10.3% |
10.8% |
10.6% |
10.8% |
|
19-Aug-24 |
10.6% |
10.9% |
10.3% |
10.7% |
10.6% |
10.8% |
|
20-Aug-24 |
10.4% |
10.9% |
10.1% |
10.6% |
10.5% |
10.7% |
|
21-Aug-24 |
10.4% |
10.9% |
10.1% |
10.6% |
10.5% |
10.7% |
|
22-Aug-24 |
10.4% |
10.9% |
10.2% |
10.6% |
10.6% |
10.7% |
|
Weekly Change |
(0.4%) |
(0.2%) |
(0.4%) |
(0.3%) |
(0.2%) |
(0.3%) |
|
MTD Change |
(0.3%) |
(0.2%) |
(0.4%) |
(0.4%) |
(0.4%) |
(0.3%) |
|
YTD Change |
0.6% |
0.7% |
0.1% |
0.7% |
1.1% |
- |
Source: Central Bank of Kenya (CBK) and National Treasury
Kenya Shilling:
During the week, the Kenya Shilling appreciated against the US Dollar by 0.1%, to remain relatively unchanged at the Kshs 129.1 recorded the previous week. On a year-to-date basis, the shilling has appreciated by 17.8% against the dollar, a contrast to the 26.8% depreciation recorded in 2023.
We expect the shilling to be supported by:
- Diaspora remittances standing at a cumulative USD 4,571.7 mn in the 12 months to July 2024, 12.2% higher than the USD 4,075.7 mn recorded over the same period in 2023, which has continued to cushion the shilling against further depreciation. In the July 2024 diaspora remittances figures, the North America remained the largest source of remittances to Kenya accounting for 54.9% in the period, and,
- The tourism inflow receipts which came in at USD 352.5 bn in 2023, a 31.5% increase from USD 268.1 bn inflow receipts recorded in 2022, and owing to tourist arrivals that improved by 27.2% in the 12 months to June 2024, from the arrivals recorded during a similar period in 2023.
The shilling is however expected to remain under pressure in 2024 as a result of:
- An ever-present current account deficit which came at 3.2% of GDP in Q1’2024 from 3.0% recorded in Q1’2023,
- The need for government debt servicing, continues to put pressure on forex reserves given that 67.9% of Kenya’s external debt is US Dollar-denominated as of March 2024, and,
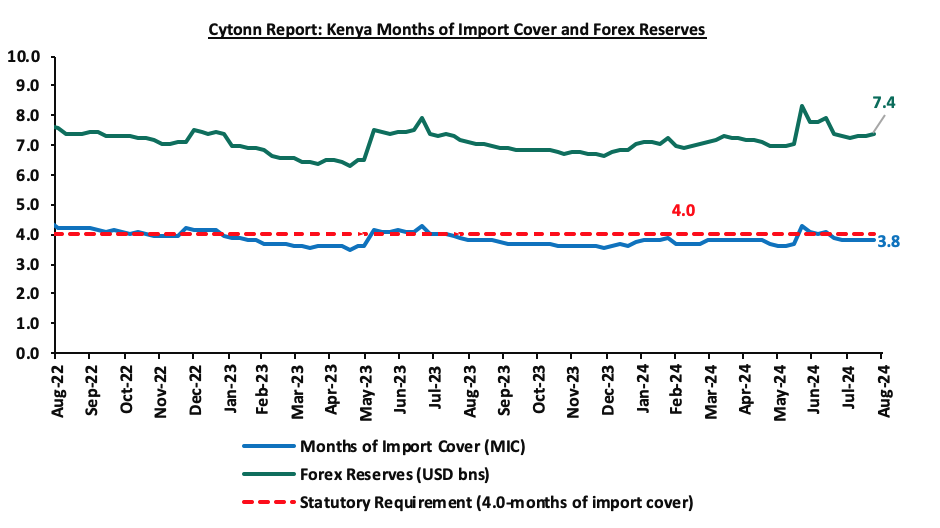
- Dwindling forex reserves currently at USD 7.4 bn (equivalent to 3.8-months of import cover), which is below the statutory requirement of maintaining at least 4.0-months of import cover, and also lower than the EAC region’s convergence criteria of 4.5-months of import cover.
Key to note, Kenya’s forex reserves increased marginally by 1.2% during the week to close the week at USD 7.4 bn from the USD 7.3 bn recorded the previous week, equivalent to 3.8 months of import cover from last week, and below the statutory requirement of maintaining at least 4.0-months of import cover. The chart below summarizes the evolution of Kenya's months of import cover over the years:
Weekly Highlights
- August Inflation Projection
We are projecting the y/y inflation rate for August 2024 to come in at the range of 4.4% - 4.7% mainly on the back of:
- The decrease in the Central Bank Rate (CBR) by 25.0 bps to 12.75% from 13.00% – Earlier this year, the monetary policy committee noted that there was need to tighten the monetary policy following the sustained depreciation of the Kenyan shilling as well as the heightened inflationary pressures which came in at 6.9% in the month of January, 0.3% points increase from the 6.6% in December and remaining within the upper bound of the inflation target range of 2.5% to 7.5%. In line with this, the committee increased the CBR by 50 bps to 13.00% from 12.50% in February. Additionally, the monetary policy committee decided to maintain the CBR at 13.00% in the April and June meetings to give the new rate time to take further effect in the economy. On 6th August 2024, the MPC lowered the CBR by 25.0 bps to 12.75% from 13.00%, noting that its previous measures have successfully reduced overall inflation to below the mid-point of the target range of 2.5% - 7.5%, stabilized the exchange rate, and anchored inflationary expectations. This reduction in the CBR is likely to increase the money supply and lower borrowing costs, which may cause a slight rise in inflation rates as the effects of the CBR gradually take hold in the broader economy, and,
- Increase in electricity prices – In August 2024, EPRA announced a Kshs 0.2 increase in per unit in electricity consumer prices to Kshs 3.5 from Kshs 3.3 in July 2024, on the back of an increase in the fuel energy costs and foreign exchange fluctuations. With electricity being one the major inputs of inflation, this increase is expected to increase production costs for businesses as well as increase electricity costs for households and thus tightening inflation.
We, however, expect that inflation will be supported by:
- Strengthening of the Kenya Shilling against the US Dollar – The Kenya Shilling has recorded a marginal 0.1% month-to-date gain to Kshs 129.1 as of 23rd August 2024 from the Kshs 129.2 recorded at the beginning of the month, and a 17.8% year-to-date gain from the Kshs 157.0 recorded at the beginning of the year. This is partly attributable to an ease in recent anti-finance bill protests which had previously rocked the country’s political stability. This appreciation in the exchange rate is expected to anchor inflationary pressures, and,
- Stable Fuel Prices in August – The maximum allowed price for Super Petrol, Diesel, and Kerosene remained unchanged from the prices announced for July. Consequently, Super Petrol, Diesel, and Kerosene continued to retail at Kshs 188.8, Kshs 171.6, and Kshs 161.8 per litre respectively from 15th August 2024 to 14th September 2024. According to the latest EPRA report, following the government's efforts to stabilize pump prices through the petroleum pump price stabilization mechanism which expended Kshs 9.9 bn in the FY’2023/24 to cushion the increases applied to the petroleum pump prices. This stability in fuel prices is likely to provide a stabilizing effect on consumer purchasing power as well as business operational costs, since fuel is a major input cost for businesses.
Going forward, we expect inflationary pressures to remain anchored in the short term, remaining in the CBK’s target range of 2.5%-7.5% aided by the stability in the exchange rate. However, risks remain, particularly from rising energy costs and the potential for increased demand-driven inflation due to accommodative monetary policy. The decision to lower the CBR to 12.75% during the latest MPC meeting will likely increase money supply, in turn tightening inflation. The CBK’s ability to balance growth and inflation through close monitoring of both inflation and exchange rate stability will be key to maintaining inflation within the target range.
- S&P Global Downgrades Kenya’s Credit Rating and Revises Outlook to Stable
On August 23rd 2024, S&P Global Ratings announced its revision of Kenya’s long-term sovereign credit rating, downgrading it to B-, and a stable outlook from a credit rating of B and a negative outlook, on the back of the government's decision to forgo proposed tax increases through the Finance Bill 2024 and rely on expenditure cuts, significantly impacting Kenya's fiscal trajectory and financing needs. The downgrade of Kenya's rating indicates a greatly reduced ability to implement fiscal consolidation measures causing debt to keep increasing in the medium term, with debt servicing to revenue costs still projected to exceed the IMF threshold of 30.0%. Additionally, the rating agency affirmed their credit rating of B on Kenya’s short-term sovereign credit rating.
In response to recent protests, the government withdrew the planned tax increases that were part of the 2024 Finance Bill. These tax measures were originally expected to generate Kshs 346.0 bn, or 1.9% of GDP. Given the current social climate, it is now unlikely that the government can implement these revenue-raising measures. Consequently, the government issued a supplementary budget to cut spending, forecasting the fiscal deficit to expand to 4.3% of GDP, which is 1.0% points higher than the initially projected 3.3% of GDP for FY’2024/25, which will be funded through increased domestic borrowing of 2.2% of GDP, up from 1.5% of GDP and foreign financing of 2.0% of GDP, from 1.8% of GDP. This expansion in the fiscal deficit will increase Kenya's net borrowing requirement and set government interest payments on a rising trajectory relative to revenue. Despite this fiscal slippage, Kenya is still expected to maintain reasonably strong access to concessional external financing, with the IMF likely to disburse funds under Kenya's seventh review, with a delay, around September 2024 originally delayed from June 2024 due to budget amendments.
The stable outlook reflects strong anticipated economic growth and sustained access to external financing, which are expected to offset the challenges posed by limited capacity to implement fiscal consolidation measures and high debt servicing costs. However, risks remain, if Kenya faces increasing external or domestic refinancing pressures, possibly due to a continued drop in foreign exchange reserves or domestic liquidity. Key to note, Kenya's fiscal outlook is closely tied to the government's appeal against a recent court ruling concerning the FY’2023/24 Finance Bill, which may impact revenue collection. On August 5, 2024, the Court of Appeal of Kenya declared certain tax measures in the bill unconstitutional, citing insufficient public consultation during the legislative process. However, on August 20, 2024, the Supreme Court of Kenya allowed the government to continue collecting revenue under the bill until the appeal is heard from September 10th - 11th, 2024.
This move positions Kenya alongside emerging economies like Angola, Nigeria, and Cameroon. The downgrade comes after Fitch Ratings announced its revision of Kenya’s credit score on 2nd August 2024, downgrading it to B- from a credit rating of B while also revising the outlook to stable, from a negative outlook affirmed on 16th February 2024. Additionally, this downgrade follows Moody’s downgrading Kenya’s IDR to Caa1 from a credit rating of B3 while maintaining a negative outlook on July 8th 2024.
To note, Kenya tapped into the international capital markets, having successfully issued a USD 1.5 bn Eurobond with a tenor of 6 years at a coupon rate of 9.75%. This issue follows issues by four other SSA countries earlier in the year. Ivory Coast tapped into the international capital markets on 24th January 2024, successfully issuing two bonds with respective maturities of 8.5 years and 12.5 years and coupon rates of 7.65% and 8.25% respectively, maturing on 30th January 2033 and 30th January 2037 respectively. In addition, Benin issued their debut dollar bond with a tenor of 14 years at a coupon rate of 8.375% on February 6th 2024. On June 6th 2024, Senegal followed suit by issuing a USD 750.0 mn Eurobond with a maturity of 7 years and a coupon rate of 7.75%. Also, on 23rd July 2024, Cameroon announced the issuance of a USD 550.0 mn Eurobond with a tenor of 7 years at a coupon rate of 9.5% and a yield of 10.75%.
Below is a table comparing Kenya, Ivory Coast, Senegal, Cameroon Benin’s S&P Global’s credit rating and a summary of the Eurobond issues:
|
Cytonn Report: S&P Global’s Rating's Long-Term Foreign-Currency Issuer Default Rating (IDR) |
||||||||
|
S&P Global’s Rating's Long-Term Foreign-Currency Issuer Default Rating (IDR) |
2024 Eurobond Issues |
|||||||
|
Country |
IDR Credit Rating |
IDR Credit Outlook |
Rating Date |
Value (USD mn) |
Tenor (Years) |
Coupon Rate |
Yield at issuance |
Issuance Date |
|
Ivory Coast |
BB- |
Positive |
May-2024 |
1,100.0 |
8.5 |
7.650% |
7.875% |
Jan-24 |
|
1,500.0 |
12.5 |
8.250% |
8.50% |
|||||
|
Benin |
BB- |
Stable |
Apr-2024 |
750.0 |
14.0 |
8.375% |
8.40% |
Feb-24 |
|
Kenya |
B- |
Stable |
Aug-2024 |
1,500.0 |
6.0 |
9.750% |
10.375% |
Feb-24 |
|
Senegal |
B+ |
Stable |
Jun-2023 |
750.0 |
7.0 |
7.75% |
7.75% |
Jun-24 |
|
Cameroon |
B- |
Stable |
Mar-24 |
550.0 |
7.0 |
9.5% |
10.75 |
Jul-24 |
Below is a summary of the credit rating on Kenya by various rating agencies;
|
Cytonn Report: Kenya’s Credit Ratings |
||||||
|
Rating Agency |
Previous Rating |
Previous Outlook |
Current Rating |
Current Outlook |
Meaning |
Date Released |
|
Moody's Rating |
B3 |
Negative |
Caa1 |
Negative |
Substantial credit risks |
8th July, 2024 |
|
Fitch Ratings |
B |
Negative |
B- |
Stable |
Highly Speculative |
2nd August 2024 |
|
S&P Global |
B |
Negative |
B- |
Stable |
Extremely high risk, very vulnerable to default |
23rd August 2024 |
Source: Moody’s Ratings, Fitch Ratings, S&P Global
Going forward, Kenya's government must navigate a fiscal strategy that prioritizes spending cuts over revenue generation from planned tax hikes. This approach, combined with the impact of political tensions, is expected to extend fiscal deficits, undermine debt affordability, and heighten liquidity risks. The government's ability to address significant borrowing requirements is further complicated by limited external financing options. Effective fiscal management and consistent policy direction will be essential for sustaining investor confidence and ensuring long-term economic growth.
Rates in the Fixed Income market have been on an upward trend given the continued high demand for cash by the government and the occasional liquidity tightness in the money market. The government is 130.2% ahead of its prorated net domestic borrowing target of Kshs 62.8 bn, having a net borrowing position of Kshs 144.6 bn. However, we expect a downward readjustment of the yield curve in the short and medium term, with the government looking to increase its external borrowing to maintain the fiscal surplus, hence alleviating pressure in the domestic market. As such, we expect the yield curve to normalize in the medium to long-term and hence investors are expected to shift towards the long-term papers to lock in the high returns.
Market Performance:
During the week, the equities market was on an upward trajectory, with NSE 20 gaining the most by 3.4%, while NSE 25, NASI, and NSE 10 gained by 3.1%, 2.4 and 1.3% each respectively, taking the YTD performance to gains of 18.4%, 18.2%, 14.1% and 12.6% for NSE 25, NSE 10, NASI, and NSE 20 respectively. The equities market performance was driven by gains recorded by large-cap stocks such as Standard Chartered Bank, NCBA Bank, and KCB Group of 10.4%, 7.7%, and 7.0% respectively. The performance was however weighed down by losses recorded by large-cap stocks such as Cooperative Bank, EABL, and DTB-K of 6.4%, 5.1%, and 0.2% respectively.
During the week, equities turnover increased by 52.9% to USD 9.3 mn from USD 6.1 mn recorded the previous week, taking the YTD total turnover to USD 425.8 mn. Foreign investors became net sellers for the first time in three weeks, with a net selling position of USD 0.2 mn, from a net buying position of USD 0.4 mn recorded the previous week, taking the YTD foreign net buying position to USD 4.2 mn.
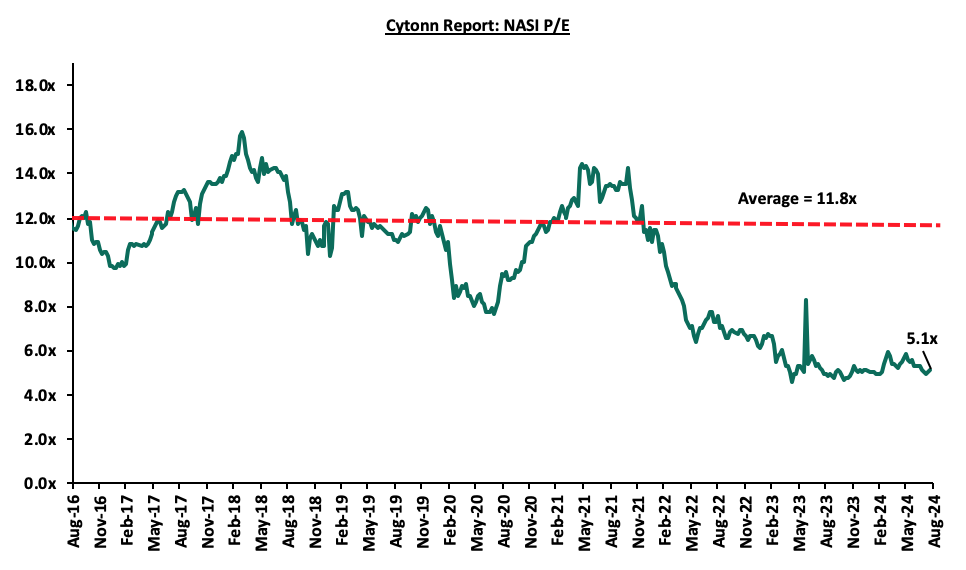
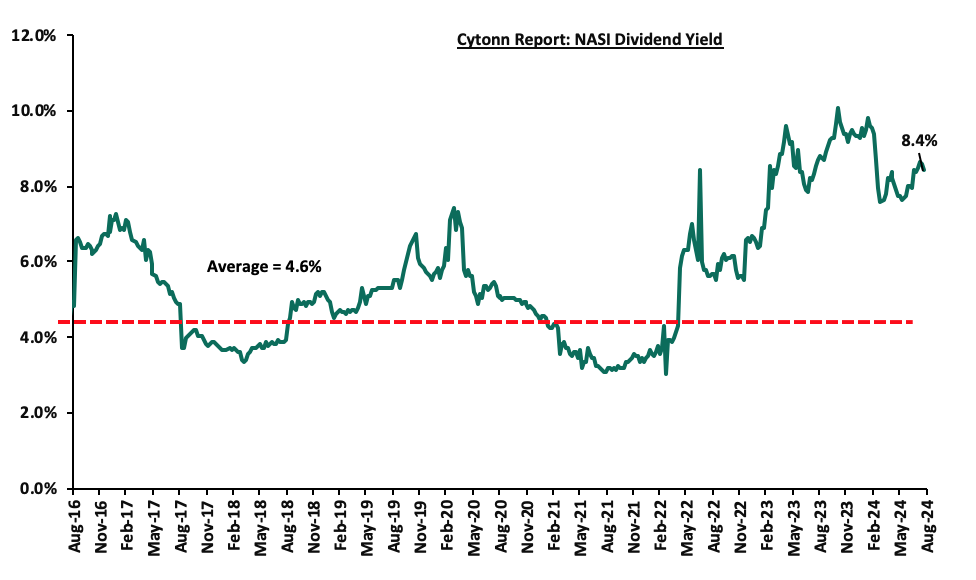
The market is currently trading at a price-to-earnings ratio (P/E) of 5.1x, 56.5% below the historical average of 11.8x. The dividend yield stands at 8.4%, 3.8% points above the historical average of 4.6%. Key to note, NASI’s PEG ratio currently stands at 0.6x, an indication that the market is undervalued relative to its future growth. A PEG ratio greater than 1.0x indicates the market is overvalued while a PEG ratio less than 1.0x indicates that the market is undervalued. The charts below indicate the historical P/E and dividend yields of the market;
Universe of Coverage:
|
Cytonn Report: Equities Universe of Coverage |
||||||||||
|
Company |
Price as at 16/08/2024 |
Price as at 23/08/2024 |
w/w change |
YTD Change |
Year Open 2024 |
Target Price* |
Dividend Yield |
Upside/ Downside** |
P/TBv Multiple |
Recommendation |
|
Jubilee Holdings |
164.0 |
153.0 |
(6.7%) |
(17.3%) |
260.7 |
260.7 |
9.3% |
79.7% |
0.2x |
Buy |
|
Equity Group*** |
40.0 |
40.5 |
1.3% |
18.4% |
60.2 |
60.2 |
9.9% |
58.5% |
0.8x |
Buy |
|
Diamond Trust Bank*** |
45.6 |
45.5 |
(0.2%) |
1.7% |
65.2 |
65.2 |
11.0% |
54.3% |
0.2x |
Buy |
|
KCB Group*** |
29.9 |
32.0 |
7.0% |
45.6% |
46.7 |
46.7 |
0.0% |
46.0% |
0.5x |
Buy |
|
NCBA*** |
39.0 |
42.0 |
7.7% |
8.1% |
55.2 |
55.2 |
11.3% |
42.7% |
0.8x |
Buy |
|
Co-op Bank*** |
12.8 |
13.2 |
2.7% |
15.9% |
17.2 |
17.2 |
11.4% |
42.2% |
0.6x |
Buy |
|
CIC Group |
2.2 |
2.1 |
(2.3%) |
(8.3%) |
2.8 |
2.8 |
6.2% |
39.5% |
0.7x |
Buy |
|
ABSA Bank*** |
14.1 |
14.2 |
1.1% |
22.9% |
17.3 |
17.3 |
10.9% |
32.7% |
1.1x |
Buy |
|
Britam |
5.6 |
5.7 |
1.8% |
11.7% |
7.5 |
7.5 |
0.0% |
30.7% |
0.8x |
Buy |
|
Stanbic Holdings |
116.8 |
123.3 |
5.6% |
16.3% |
145.3 |
145.3 |
12.5% |
30.3% |
0.8x |
Buy |
|
I&M Group*** |
20.6 |
27.8 |
35.0% |
59.3% |
25.5 |
25.5 |
9.2% |
0.9% |
0.6x |
Lighten |
|
Target Price as per Cytonn Analyst estimates **Upside/ (Downside) is adjusted for Dividend Yield ***For Disclosure, these are stocks in which Cytonn and/or its affiliates are invested in |
||||||||||
Weekly Highlights
Earnings Release
- KCB Group H1’2024 Financial Results
Below is a summary of KCB Group’s H1’2024 performance:
|
Balance Sheet Items |
H1'2023 |
H1'2024 |
y/y change |
|
Government Securities |
362.4 |
357.1 |
(1.5%) |
|
Net Loans and Advances |
1,032.2 |
1,032.6 |
0.0% |
|
Total Assets |
1,864.6 |
1,976.9 |
6.0% |
|
Customer Deposits |
1,471.2 |
1,490.6 |
1.3% |
|
Total Liabilities |
1,646.6 |
1,728.6 |
5.0% |
|
Shareholders’ Funds |
211.2 |
241.0 |
14.1% |
|
Key Ratios |
H1'2023 |
H1'2024 |
% point change |
|
Loan to Deposit ratio |
70.2% |
67.8% |
(2.4%) |
|
Government Securities to Deposits ratio |
24.6% |
24.0% |
(0.7%) |
|
Return on Average Equity |
19.1% |
22.7% |
3.6% |
|
Return on Average Assets |
2.4% |
2.7% |
0.2% |
|
Income Statement |
H1'2023 (Kshs bn) |
H1'2024 (Kshs bn) |
y/y change |
|
Net interest Income |
45.5 |
61.3 |
34.8% |
|
Net non-interest income |
27.6 |
33.3 |
20.8% |
|
Total Operating income |
73.1 |
94.6 |
29.5% |
|
Loan loss provision |
(10.2) |
(12.2) |
19.7% |
|
Total Operating expenses |
(50.6) |
(56.5) |
11.7% |
|
Profit before tax |
22.5 |
38.1 |
69.7% |
|
Profit after tax |
16.1 |
29.9 |
86.4% |
|
Core EPS |
5.0 |
9.3 |
86.4% |
|
Income Statement Ratios |
H1'2023 |
H1'2024 |
y/y change |
|
Yield from interest-earning assets |
9.6% |
11.3% |
1.7% |
|
Cost of funding |
3.3% |
4.6% |
1.3% |
|
Net Interest Spread |
6.3% |
6.7% |
0.4% |
|
Net Interest Margin |
6.6% |
7.1% |
0.5% |
|
Cost of Risk |
13.9% |
12.9% |
(1.1%) |
|
Net Interest Income as % of operating income |
62.3% |
64.8% |
2.5% |
|
Non-Funded Income as a % of operating income |
37.7% |
35.2% |
(2.5%) |
|
Cost to Income Ratio |
69.3% |
59.7% |
(9.5%) |
|
Cost to Income Ratio (without LLP) |
55.3% |
46.8% |
(8.5%) |
|
Capital Adequacy Ratios |
H1'2023 |
H1'2024 |
% points change |
|
Core Capital/Total Liabilities |
14.4% |
15.8% |
1.4% |
|
Minimum Statutory ratio |
8.0% |
8.0% |
0.0% |
|
Excess |
6.4% |
7.8% |
1.4% |
|
Core Capital/Total Risk Weighted Assets |
15.0% |
17.8% |
2.8% |
|
Minimum Statutory ratio |
10.5% |
10.5% |
0.0% |
|
Excess |
4.5% |
7.3% |
2.8% |
|
Total Capital/Total Risk Weighted Assets |
18.4% |
20.3% |
1.9% |
|
Minimum Statutory ratio |
14.5% |
14.5% |
0.0% |
|
Excess |
3.9% |
5.8% |
1.9% |
|
Liquidity Ratio |
52.1% |
47.0% |
(5.1%) |
|
Minimum Statutory ratio |
20.0% |
20.0% |
0.0% |
|
Excess |
32.1% |
27.0% |
(5.1%) |
Key Take-Outs:
- Increased earnings - Core earnings per share (EPS) grew by 86.4% to Kshs 29.9, from Kshs 16.1 in H1’2023, driven by the 29.5% increase in total operating income to Kshs 94.6 bn, from Kshs 73.1 bn in H1’2023.
- Deteriorated asset quality – The bank’s Asset Quality deteriorated, with Gross NPL ratio increasing to 18.1% in H1’2024, from 16.2% in H1’2023, attributable to a 16.5% increase in Gross non-performing loans to Kshs 212.1 bn, from Kshs 182.0 bn in H1’2023, compared to the 4.2% increase in gross loans to Kshs 1,172.3 bn, from Kshs 1,125.2 bn recorded in H1’2023,
- Expanded Balanced sheet - The balance sheet recorded an expansion as total assets grew by 6.0% to Kshs 1,976.9 bn, from Kshs 1,864.6 bn in H1’2024, driven by a 7.3% increase in placements to Kshs 357.1 bn, from 332.7 bn in H1’2023, coupled with a 28.3% increase in cash and cash balances to Kshs 82.6 bn, from Kshs 64.4 bn in H1’2023,
For a more detailed analysis, see the KCB Group Holdings H1’2024 Earnings Note.
- Standard Chartered Bank Kenya H1’2024 Financial Results
Below is a summary of Standard Chartered Bank Ltd H1’2024 performance:
|
Balance Sheet Items |
H1’2023 |
H1’2024 |
y/y change |
|
Net loans |
145.4 |
149.3 |
2.7% |
|
Government Securities |
70.7 |
71.6 |
1.3% |
|
Total Assets |
361.7 |
377.3 |
4.3% |
|
Customer Deposits |
283.7 |
276.4 |
(2.6%) |
|
Deposits per Branch |
7.9 |
8.6 |
9.6% |
|
Total Liabilities |
304.5 |
313.2 |
2.8% |
|
Shareholder's Funds |
57.1 |
64.1 |
12.2% |
|
Balance Sheet Ratios |
H1’2023 |
H1’2024 |
% points change |
|
Loan to deposit ratio |
51.3% |
54.0% |
2.7% |
|
Government securities to deposit ratio |
24.9% |
25.9% |
1.0% |
|
Return on Average Equity |
23.9% |
28.4% |
4.5% |
|
Return on Average Assets |
3.7% |
4.7% |
0.9% |
|
Income Statement |
H1’2023 |
H1’2024 |
y/y change |
|
Net Interest Income |
13.9 |
16.5 |
19.3% |
|
Net non-Interest Income |
7.0 |
9.6 |
36.1% |
|
Total Operating income |
20.9 |
26.1 |
24.9% |
|
Loan Loss provision |
2.0 |
1.6 |
(23.3%) |
|
Total Operating expenses |
11.2 |
11.6 |
3.1% |
|
Profit before tax |
9.6 |
14.5 |
50.4% |
|
Profit after tax |
6.9 |
10.3 |
48.9% |
|
Core EPS (Kshs) |
18.3 |
27.2 |
48.9% |
|
Dividend Per Share (Kshs) |
- |
8.0 |
|
|
Dividend Payout Ratio |
- |
29.4% |
|
|
Dividend Yield (Annualized) |
- |
3.8% |
|
|
Income Statement Ratios |
H1’2023 |
H1’2024 |
% points change |
|
Yield from interest-earning assets |
9.1% |
10.8% |
1.7% |
|
Cost of funding |
1.1% |
1.5% |
0.4% |
|
Net Interest Spread |
7.9% |
9.3% |
1.3% |
|
Net Interest Margin |
8.0% |
9.5% |
1.4% |
|
Cost of Risk |
9.7% |
6.0% |
(3.8%) |
|
Net Interest Income as % of operating income |
66.3% |
63.3% |
(3.0%) |
|
Non-Funded Income as a % of operating income |
33.7% |
36.7% |
3.0% |
|
Cost to Income Ratio |
53.8% |
44.4% |
(9.4%) |
|
Cost to Income Ratio without LLP |
44.1% |
38.4% |
(5.6%) |
|
Capital Adequacy Ratios |
H1’2023 |
H1’2024 |
% points change |
|
Core Capital/Total Liabilities |
17.0% |
19.7% |
2.7% |
|
Minimum Statutory ratio |
8.0% |
8.0% |
0.0% |
|
Excess |
9.0% |
11.7% |
2.7% |
|
Core Capital/Total Risk Weighted Assets |
16.9% |
18.8% |
1.9% |
|
Minimum Statutory ratio |
10.5% |
10.5% |
0.0% |
|
Excess |
6.4% |
8.3% |
1.9% |
|
Total Capital/Total Risk Weighted Assets |
17.3% |
18.9% |
1.6% |
|
Minimum Statutory ratio |
14.5% |
14.5% |
0.0% |
|
Excess |
2.8% |
4.4% |
1.6% |
|
Liquidity Ratio |
62.8% |
63.2% |
0.3% |
|
Minimum Statutory ratio |
20.0% |
20.0% |
0.0% |
|
Excess |
42.8% |
43.2% |
0.3% |
Key Take-Outs:
- Strong earnings growth - Core earnings per share (EPS) grew by 48.9% to Kshs 27.2, from Kshs 18.3 in H1’2023, driven by the 24.9% growth in total operating income to Kshs 26.1 bn, from Kshs 20.9 bn in H1’2023,
- Improved asset quality – The bank’s gross NPL ratio decreased to 8.4% in H1’2023 from 14.4% in H1’2023, attributable to 42.9% decrease in Gross non-performing loans to Kshs 13.6 bn, from Kshs 23.8 bn in H1’2023, compared to the 2.9% increase in gross loans to Kshs 160.9 bn, from Kshs 165.6 bn recorded in H1’2023,
- Improved Lending – The bank’s loan book increased by 2.7% to Kshs 149.3 bn, from Kshs 145.4 bn in H1’2023, compared to the 1.3% increase in government securities to Kshs 71.6 bn, from Kshs 70.7 bn in H1’2023, highlighting the bank’s strategy to increase lending through digital transformation, while at the same time managing its non-performing loan book, and,
- Declaration of dividends – The Board of Directors declared an interim dividend of Kshs 8.0 per share for H1’2024, compared to H1’2023 where the lender did not declare any dividends. This translates to a dividend payout ratio of 29.4% and an annualized dividend yield of 3.8% as of 23rd August 2024.
For a more detailed analysis, see the Standard Chartered Bank Kenya H1’2024 Earnings Note
- NCBA Bank H1’2024 Financial Results
Below is a summary of NCBA Group’s H1’2024 performance:
|
Balance Sheet |
H1'2023 (Kshs bn) |
H1'2024 (Kshs bn) |
y/y change |
|
Net Loans and Advances |
292.4 |
309.7 |
5.9% |
|
Kenya Government Securities |
202.3 |
182.6 |
(9.8%) |
|
Total Assets |
660.3 |
689.1 |
4.4% |
|
Customer Deposits |
516.6 |
528.9 |
2.4% |
|
Deposits Per Branch |
4.8 |
4.6 |
(5.6%) |
|
Total Liabilities |
572.0 |
587.7 |
2.7% |
|
Shareholders' Funds |
88.3 |
101.4 |
14.8% |
|
Key Ratios |
H1'2023 |
H1'2024 |
% point change |
|
Loan to Deposit ratio |
56.6% |
58.6% |
2.0% |
|
Government Securities to Deposits ratio |
39.2% |
34.5% |
(4.6%) |
|
Return on Average Equity |
18.2% |
23.1% |
4.9% |
|
Return on Average Assets |
2.4% |
3.2% |
0.8% |
|
Income Statement |
H1'2023 (Kshs bn) |
H1'2024 (Kshs bn) |
y/y change |
|
Net interest Income |
8.4 |
8.3 |
(1.2%) |
|
Net non-interest income |
7.2 |
7.7 |
7.4% |
|
Total Operating income |
15.5 |
16.0 |
2.8% |
|
Loan loss provision |
2.0 |
1.4 |
(30.9%) |
|
Total Operating expenses |
9.2 |
9.4 |
3.1% |
|
Profit before tax |
6.4 |
6.5 |
2.2% |
|
Profit after tax |
5.1 |
5.3 |
4.7% |
|
Core EPS |
3.1 |
3.2 |
4.7% |
|
Dividend Per Share |
1.75 |
2.25 |
28.6% |
|
Dividend Payout ratio |
30.8% |
37.8% |
7.0% |
|
Dividend Yield (Annualized) |
9.2% |
10.8% |
1.6% |
|
Income Statement Ratios |
H1'2023 |
H1'2024 |
y/y change |
|
Yield from interest-earning assets |
10.5% |
12.5% |
2.0% |
|
Cost of funding |
4.7% |
7.1% |
2.3% |
|
Net Interest Margin |
6.0% |
5.8% |
(0.2%) |
|
Net Interest Income as % of operating income |
55.5% |
52.5% |
(3.0%) |
|
Non-Funded Income as a % of operating income |
44.5% |
47.5% |
3.0% |
|
Cost to Income Ratio |
60.2% |
61.2% |
1.0% |
|
Cost to Income without LLP |
46.0% |
52.6% |
6.6% |
|
Capital Adequacy Ratios |
H1'2023 |
H1'2024 |
% points change |
|
Core Capital/Total Liabilities |
16.7% |
18.8% |
2.1% |
|
Minimum Statutory ratio |
8.0% |
8.0% |
|
|
Excess |
8.7% |
10.8% |
2.1% |
|
Core Capital/Total Risk Weighted Assets |
17.9% |
19.9% |
2.0% |
|
Minimum Statutory ratio |
10.5% |
10.5% |
|
|
Excess |
7.4% |
9.4% |
2.0% |
|
Total Capital/Total Risk Weighted Assets |
18.0% |
19.9% |
2.0% |
|
Minimum Statutory ratio |
14.5% |
14.5% |
|
|
Excess |
3.5% |
5.4% |
2.0% |
|
Liquidity Ratio |
54.7% |
53.6% |
(1.1%) |
|
Minimum Statutory ratio |
20.0% |
20.0% |
|
|
Excess |
33.1% |
31.6% |
(1.5%) |
Key Take-Outs:
- Increased earnings - Core earnings per share (EPS) grew by 5.0% to Kshs 6.0, from Kshs 5.7 in H1’2023, driven by the 1.1% growth in total operating income to Kshs 31.4 bn, from Kshs 31.0 bn in H1’2023.
- Improved asset quality – The bank’s gross NPL ratio decreased to 12.2% in H1’2024, from 13.4% in H1’2023, attributable to the 4.1% decrease in Gross non-performing loans to Kshs 40.9 bn, from Kshs 42.6 bn in H1’2023, compared to the 5.4% increase in gross loans to Kshs 334.1 bn, from Kshs 317.0 bn recorded in H1’2023,
- Reduced Provisioning - On the back of reduced credit risk occasioned by improving business environment, the bank decreased its provisions holdings meant to cover for anticipated losses in the future, with its general provisions decreasing by 14.1% to Kshs 13.5 bn, from Kshs 15.7 bn recorded in H1’2023. Further, loan loss provisions expense reduced by 38.3% to Kshs 2.7 bn, from Kshs 4.4 bn recorded in H1’2023.
- Increased dividends- Dividends per share increased by 28.6% to Kshs 2.25 in H1’2024, from Kshs 1.75 in H1’2023 translating to an annualized dividend yield of 10.8% and a dividend payout ratio of 37.8% in H1’2024 compared to a dividend yield of 9.2% and a dividend payout ratio of 30.8% in H1’2023.
For a more detailed analysis, see the NCBA Group H1’2024 Earnings Note
- I&M Group Holdings Kenya H1’2024 Financial Performance
Below is a summary of I&M Group H1’2024 performance:
|
Balance Sheet Items |
H1’2023 |
H1’2024 |
y/y change |
|
Government Securities |
110.6 |
90.1 |
(18.6%) |
|
Net Loans and Advances |
269.7 |
284.2 |
5.3% |
|
Total Assets |
503.5 |
564.4 |
12.1% |
|
Customer Deposits |
356.8 |
419.4 |
17.5% |
|
Total Liabilities |
419.4 |
471.6 |
12.5% |
|
Shareholders’ Funds |
78.2 |
86.4 |
10.5% |
|
Balance Sheet Ratios |
H1’2023 |
H1’2024 |
% points change |
|
Loan to Deposit Ratio |
75.6% |
67.8% |
(7.8%) |
|
Government Securities to Deposit Ratio |
31.0% |
21.5% |
(9.5%) |
|
Return on average equity |
15.0% |
16.3% |
1.3% |
|
Return on average assets |
2.5% |
2.7% |
0.2% |
|
Income Statement |
H1’2023 |
H1’2024 |
y/y change |
|
Net Interest Income |
12.2 |
16.5 |
35.2% |
|
Net non-Interest Income |
6.9 |
6.2 |
(10.9%) |
|
Total Operating income |
19.1 |
22.7 |
18.5% |
|
Loan Loss provision |
(3.2) |
(3.5) |
8.2% |
|
Total Operating expenses |
(12.5) |
(14.3) |
13.9% |
|
Profit before tax |
7.0 |
8.7 |
24.0% |
|
Profit after tax |
5.0 |
6.1 |
21.1% |
|
Core EPS |
3.0 |
3.7 |
21.1% |
|
Income Statement Ratios |
H1’2023 |
H1’2024 |
% points change |
|
Yield from interest-earning assets |
10.4% |
14.3% |
3.9% |
|
Cost of funding |
4.3% |
6.3% |
2.0% |
|
Net Interest Margin |
6.2% |
7.8% |
1.6% |
|
Net Interest Income as % of operating income |
63.9% |
72.8% |
9.0% |
|
Non-Funded Income as a % of operating income |
36.1% |
27.2% |
(9.0%) |
|
Cost to Income Ratio |
65.6% |
63.0% |
(2.6%) |
|
CIR without LLP |
48.8% |
47.7% |
(1.1%) |
|
Cost to Assets |
1.9% |
1.9% |
0.1% |
|
Capital Adequacy Ratios |
H1’2023 |
H1’2024 |
% points change |
|
Core Capital/Total Liabilities |
18.8% |
17.7% |
(1.1%) |
|
Minimum Statutory ratio |
8.0% |
8.0% |
0.0% |
|
Excess |
10.8% |
9.7% |
(1.1%) |
|
Core Capital/Total Risk Weighted Assets |
14.0% |
14.8% |
0.8% |
|
Minimum Statutory ratio |
10.5% |
10.5% |
0.0% |
|
Excess |
3.5% |
4.3% |
0.8% |
|
Total Capital/Total Risk Weighted Assets |
18.8% |
18.1% |
(0.7%) |
|
Minimum Statutory ratio |
14.5% |
14.5% |
0.0% |
|
Excess |
4.3% |
3.6% |
(0.7%) |
|
Liquidity Ratio |
46.7% |
50.8% |
4.1% |
|
Minimum Statutory ratio |
20.0% |
20.0% |
0.0% |
|
Excess |
26.7% |
30.8% |
4.1% |
Key Take-Outs:
- Strong earnings growth - Core earnings per share increased by 17.3% to Kshs 3.4 from Kshs 2.9 in H1’2023, mainly driven by 18.5% growth in total operating income to Kshs 22.7 bn in H1’2024 from Kshs 19.1 bn in H1’2023. The performance was however weighed down by the 13.9% increase in total operating expenses to Kshs 14.3 bn, from Kshs 12.5 bn in H1’2023.
- Increased Provisioning – The group’s provisioning increased by 2% to Kshs 3.5 bn from Kshs 3.2 bn in H1’2023. The increase in provisioning is despite the reduced credit risk as a result of improved economic environment as evidenced by the average H1’2024 Purchasing Managers Index (PMI) of 50.0, up from an average of 48.7 in H1’2023,
For a more detailed analysis, see the I&M Group Holdings H1’2024 Earnings Note.
- HF Group H1’2024 Financial Results
Below is a summary of HF Group H1’2024 performance:
|
Balance Sheet Items (Kshs bn) |
H1’2023 |
H1’2024 |
y/y change |
|
Net loans |
38.1 |
37.9 |
(0.4%) |
|
Government Securities |
9.8 |
12.2 |
24.4% |
|
Total Assets |
60.7 |
63.7 |
5.0% |
|
Customer Deposits |
40.7 |
45.0 |
10.7% |
|
Deposits Per Branch |
1.6 |
1.6 |
0.0% |
|
Total Liabilities |
51.9 |
54.4 |
5.0% |
|
Shareholder's Funds |
8.9 |
9.3 |
5.2% |
|
Balance Sheet Ratios |
H1’2023 |
H1’2024 |
% y/y change |
|
Loan to deposit ratio |
93.5% |
84.2% |
(9.3%) |
|
Government Securities to deposit ratio |
24.1% |
27.1% |
3.0% |
|
Return on Average Equity |
4.7% |
5.2% |
0.5% |
|
Return on Average Assets |
0.7% |
0.8% |
0.1% |
|
Income Statement (Kshs bn) |
H1’2023 |
H1’2024 |
y/y change |
|
Net Interest Income |
1.27 |
1.33 |
4.7% |
|
Net non-Interest Income |
0.5 |
0.7 |
30.7% |
|
Total Operating income |
1.8 |
2.0 |
12.5% |
|
Loan Loss provision |
(0.2) |
(0.2) |
5.3% |
|
Total Operating expenses |
(1.6) |
(1.8) |
8.9% |
|
Profit before tax |
0.2 |
0.3 |
41.7% |
|
Profit after tax |
0.2 |
0.3 |
46.3% |
|
Core EPS |
1.0 |
1.4 |
45.3% |
|
Income Statement Ratios |
H1’2023 |
H1’2024 |
y/y change |
|
Yield from interest-earning assets |
10.0% |
6.1% |
(3.8%) |
|
Cost of funding |
4.9% |
3.6% |
(1.3%) |
|
Net Interest Spread |
5.1% |
2.6% |
(2.5%) |
|
Net Interest Margin |
5.2% |
2.7% |
(2.5%) |
|
Cost of Risk |
8.7% |
8.2% |
(0.6%) |
|
Net Interest Income as % of operating income |
69.9% |
65.0% |
(4.9%) |
|
Non-Funded Income as a % of operating income |
30.1% |
35.0% |
4.9% |
|
Cost to Income Ratio (with LLP) |
89.0% |
86.2% |
(2.8%) |
|
Cost to Income Ratio (without LLP) |
80.3% |
78.0% |
(2.3%) |
|
Capital Adequacy Ratios |
H1’2023 |
H1’2024 |
% points change |
|
Core Capital/Total Liabilities |
6.7% |
4.5% |
(2.2%) |
|
Minimum Statutory ratio |
8.0% |
8.0% |
0.0% |
|
Excess |
(1.3%) |
(3.5%) |
(2.2%) |
|
Core Capital/Total Risk Weighted Assets |
7.2% |
5.2% |
(2.0%) |
|
Minimum Statutory ratio |
10.5% |
10.5% |
0.0% |
|
Excess |
(3.3%) |
(5.3%) |
(2.0%) |
|
Total Capital/Total Risk Weighted Assets |
11.0% |
8.8% |
(2.2%) |
|
Minimum Statutory ratio |
14.5% |
14.5% |
0.0% |
|
Excess |
(3.5%) |
(5.7%) |
(2.2%) |
|
Liquidity Ratio |
24.7% |
24.9% |
0.2% |
|
Minimum Statutory ratio |
20.0% |
20.0% |
0.0% |
|
Excess |
4.7% |
4.9% |
0.2% |
Key Take-Outs:
- Strong earnings growth - Core earnings per share increased by 45.3% to Kshs 1.4 from Kshs 1.0 in H1’2023, mainly driven by the 12.5% growth in total operating income to Kshs 2.0 bn, from Kshs 1.8 bn in H1’2023.
- Asset quality deterioration – The bank’s gross NPL ratio increased to 24.2% in H1’2024 from 23.1% in H1’2023, attributable to the faster growth of 6.3% in Gross non-performing loans to Kshs 11.2 bn in H1’2024 from Kshs 10.5 bn in H1’2023, which outpaced the 1.6% increase in gross loans to Kshs 46.4 bn, from Kshs 45.6 bn recorded in H1’2023,
- Sustained Efficiency – Cost to Income Ratio (CIR) decreased to 86.2% from 89.0% in H1’2023, owing to the 12.5% increase in total operating income, which outpaced the 8.9% increase in total operating expenses. Notably, CIR without LLP decreased by 2.3% points to 78.0% from 80.3% recorded in H1’2023.
For a more detailed analysis, see the HF Group H1’2024 Earnings Note
Asset Quality:
The table below shows the asset quality of listed banks that have released their H1’2024 results using several metrics:
|
Cytonn Report: Listed Banks Asset Quality |
||||||
|
|
H1'2024 NPL Ratio* |
H1'2023 NPL Ratio** |
% point change in NPL Ratio |
H1'2024 NPL Coverage* |
H1'2023 NPL Coverage** |
% point change in NPL Coverage |
|
Equity Group |
13.9% |
11.2% |
2.7% |
58.8% |
54.5% |
4.3% |
|
Co-operative Bank of Kenya |
16.7% |
14.6% |
2.1% |
59.5% |
60.7% |
(1.2%) |
|
KCB Group |
18.1% |
16.2% |
1.9% |
18.1% |
16.2% |
1.9% |
|
HF Group |
24.2% |
23.1% |
1.1% |
75.6% |
72.0% |
3.6% |
|
Stanbic Bank |
9.5% |
9.2% |
0.3% |
75.0% |
57.4% |
17.6% |
|
NCBA Bank |
12.2% |
13.4% |
(1.2%) |
59.8% |
57.8% |
2.0% |
|
I&M Group |
11.4% |
12.7% |
(1.3%) |
57.9% |
49.8% |
8.1% |
|
Standard Chartered |
9.9% |
14.4% |
(4.5%) |
83.7% |
86.8% |
(3.1%) |
|
Mkt Weighted Average* |
13.7% |
12.7% |
1.0% |
56.5% |
60.1% |
(3.6%) |
|
*Market cap weighted as at 16/08/2024 |
||||||
|
**Market cap weighted as at 21/09/2023 |
||||||
Key take-outs from the table include;
- Asset quality for the listed banks that have released declined during H1’2024, with market-weighted average NPL ratio increasing by 1.0% points to 13.7% from 12.7% in H1’2023, and,
- Market-weighted average NPL Coverage for the listed banks that have released results decreased by 4.1% points to 56.5% in H1’2024 from 60.1% recorded in H1’2023. The increase was attributable to Standard Chartered’s coverage ratio decreasing by 3.1% to 83.7% from 86.8% in H1’2023, coupled with Cooperative Bank’s NPL coverage ratio increasing by 1.2% points to 60.7% from 59.5% in H1’2023. The performance was however supported by Stanbic Bank’s NPL Coverage ratio increasing by 17.6% points to 75.0% from 57.4% in H1’2023.
Summary Performance
The table below shows the performance of listed banks that have released their H1’2024 results using several metrics:
|
Cytonn Report: Listed Banks Performance in H1’2024 |
|||||||||||||
|
Bank |
Core EPS Growth |
Interest Income Growth |
Interest Expense Growth |
Net Interest Income Growth |
Net Interest Margin |
Non-Funded Income Growth |
NFI to Total Operating Income |
Growth in Total Fees & Commissions |
Deposit Growth |
Growth in Government Securities |
Loan to Deposit Ratio |
Loan Growth |
Return on Average Equity |
|
KCB Group |
86.4% |
38.9% |
46.5% |
34.8% |
7.1% |
20.8% |
35.2% |
1.5% |
1.3% |
(1.5%) |
67.8% |
0.0% |
22.7% |
|
Standard Chartered |
48.9% |
25.4% |
78.0% |
19.3% |
8.6% |
36.1% |
36.7% |
(17.7%) |
66.5% |
(19.9%) |
54.0% |
2.7% |
25.5% |
|
HF Group |
45.3% |
23.8% |
44.4% |
4.7% |
5.3% |
30.7% |
35.0% |
17.7% |
10.7% |
24.4% |
84.2% |
(0.4%) |
5.2% |
|
I&M Group |
17.3% |
46.1% |
60.8% |
35.2% |
7.8% |
(10.9%) |
27.2% |
3.6% |
17.5% |
(18.6%) |
67.8% |
5.3% |
16.3% |
|
Equity Group |
12.5% |
21.5% |
30.1% |
17.2% |
7.7% |
17.2% |
44.0% |
15.5% |
10.6% |
(5.1%) |
60.9% |
(3.2%) |
23.7% |
|
Co-operative Bank of Kenya |
7.0% |
24.4% |
52.6% |
10.7% |
7.8% |
11.2% |
39.2% |
4.4% |
9.4% |
7.3% |
74.0% |
2.8% |
20.5% |
|
NCBA Bank |
5.0% |
25.4% |
64.5% |
(4.4%) |
(0.2%) |
7.9% |
47.5% |
6.4% |
2.4% |
(9.8%) |
58.6% |
5.9% |
23.1% |
|
Stanbic Holdings |
2.3% |
49.1% |
154.3% |
4.2% |
7.9% |
(15.1%) |
37.6% |
(6.3%) |
30.3% |
(21.0%) |
67.0% |
(2.4%) |
18.5% |
|
H1'24 Mkt Weighted Average* |
29.1% |
30.4% |
59.8% |
17.6% |
6.8% |
13.7% |
39.3% |
3.1% |
17.8% |
(8.0%) |
63.6% |
0.8% |
22.2% |
|
H1'23 Mkt Weighted Average** |
14.3% |
28.2% |
44.8% |
21.0% |
7.3% |
27.9% |
38.9% |
26.6% |
21.3% |
5.3% |
72.3% |
20.5% |
22.9% |
|
*Market cap weighted as at 16/08/2024 |
|||||||||||||
|
**Market cap weighted as at 21/09/2023 |
|||||||||||||
- CIC Insurance Group H1’2024 Financial Results
During the week, CIC Group released their H1’2024 results. CIC’s Profit After Tax (PAT) increased marginally by 0.6% to remain relatively flat at the Kshs 0.7 bn, recorded in H1’2023. The performance was mainly driven by a 35.7% increase in Net investment income to Kshs 1.8 bn in H1’2024, from Kshs 1.3 bn in H1’2023, and further supported by a 21.4% increase in Net income from insurance service to Kshs 1.0 bn, from Kshs 0.9 bn in H1’2023. However, the performance was weighed down by the 61.5% increase in net expenses from reinsurance contracts to Kshs 1.4 bn, from Kshs 0.9 bn in H1’2024
CIC Group H1’2024 Results:
|
Cytonn Report: CIC Group Income Statement |
|||
|
Item (All figures in Bns) |
H1’2023 |
H1’2024 |
y/y change |
|
Insurance Revenue |
12.9 |
12.8 |
(0.4%) |
|
Insurance service expenses |
(11.1) |
(10.4) |
(6.9%) |
|
Net expenses from reinsurance contracts held |
(0.9) |
(1.4) |
61.5% |
|
Net Insurance income |
0.9 |
1.0 |
21.4% |
|
Net Investment Income |
1.3 |
1.8 |
35.7% |
|
Net Financial result |
0.7 |
0.7 |
(1.3%) |
|
Other Operating Expenses |
(0.7) |
(0.7) |
6.8% |
|
Operating Profit |
1.4 |
1.6 |
11.3% |
|
Profit Before Tax |
1.2 |
1.3 |
7.2% |
|
Profit After Tax |
0.7 |
0.7 |
0.6% |
|
Core EPS in Kshs |
0.3 |
0.3 |
0.6% |
|
Cytonn Report: CIC Group Balance Sheet |
|||
|
Item (All figures in Bns) |
H1'2023 |
H1'2024 |
y/y change |
|
Investment assets |
3.8 |
7.8 |
108.4% |
|
Property & Equipments and Intangibles |
1.4 |
1.5 |
8.2% |
|
Total Assets |
50.6 |
57.8 |
14.2% |
|
Insurance Contract Liabilities |
24.6 |
39.6 |
60.8% |
|
Provisions & other payables |
3.4 |
3.8 |
12.7% |
|
Total liabilities |
41.8 |
48.6 |
16.3% |
|
Shareholder funds |
8.7 |
9.3 |
6.4% |
|
Minority Interest |
0.0 |
(0.1) |
(740.6%) |
|
Total Equity |
8.8 |
9.1 |
4.5% |
Key take outs from the results:
- Core Earnings Per Share increased slightly by 0.6% to Kshs 0.3 from Kshs 0.3 in H1’2023, mainly driven by a 35.7% increase in Net investment income to Kshs 1.8 bn in H1’2024, from Kshs 1.3 bn in H1’2023, coupled with a 21.4% increase in Net income from insurance service to Kshs 1.0 bn, from Kshs 0.9 bn in H1’2023,
- Net financial result decreased by 1.3% to Kshs 0.7 bn in H1’2024, from Kshs 0.7 bn in H1’2023. This was majorly attributable to the 79.8% increase in net finance expenses from insurance contracts to Kshs1.3 bn from Kshs 0.7 bn in H1’2023. This decline was however supported by the 51.4% increase in investment return to Kshs 1.8 bn from Kshs 1.2 bn in H1’2023,
- Insurance revenue decreased by 0.4% to Kshs 12.8 bn in H1’2024 from Kshs 12.9 bn in H1’2023, while insurance service expenses decreased by 6.9% to Kshs 10.4 bn from Kshs 11.1 bn in H1’2023, and the net expenses from reinsurance contracts held increased by 61.5% to Kshs 1.4 bn, from Kshs 0.9 bn in H1’2023. This translated to a Net insurance service result increase of 21.4% to Kshs 1.0 bn from Kshs 0.9 bn in H1’2023,
- The balance sheet recorded an expansion as total assets increased by 14.2% to Kshs 57.8 bn in H1’2024 from Kshs 50.6 bn in H1’2023 mainly driven by 108.4% increase in investment property assets to Kshs 7.8 bn from Kshs 3.8 bn in H1’2023, coupled with 21.9% increase in financial investment assets to Kshs 40.8 bn form Kshs 33.4 bn in H1’2023, and,
- Total liabilities increased by 16.3% to Kshs 48.6 bn from Kshs 41.8 bn in FY’2022, majorly on the back of the 60.8% increase in Insurance contract liabilities to Kshs 39.6 bn from Kshs 24.6 bn in H1’2023, coupled with the 12.7% increase in provisions and other payables to Kshs 3.8 bn from Kshs 3.4 bn in H1’2023.
Other highlights from the release include:
- Declaration of dividends – The Group’s board of directors did not declare a dividend for the first half of the FY’2024. The first and final dividend of Kshs 0.13 for the FY’2023, translating to a dividend yield of 5.8% and a dividend payout of 23.6%.
Key to note, this was the third time the company was releasing their results under the new IFRS 17 reporting system. The new standard demands that insurers measure insurance contracts using updated estimates and assumptions that reflect the timing of cashflows and any uncertainty relating to insurance contracts. Going forward, the Group earnings will be boosted by product innovation tailored to meet changing customer demands, especially within the individual life, medical, and asset management sectors. This diversification in products is anticipated to fuel further revenue growth, particularly in regional markets. Moreover, continued investment in digital solutions aimed at enhancing operational efficiency and customer experience, along with capitalizing on its established regional presence where subsidiaries have exhibited strong growth, will remain key drivers of the Group’s growth in the upcoming periods.
- Liberty Kenya Holdings Plc H1’2024 Financial Results.
During the week, Liberty Kenya Holdings released their H1’2024 results, having fully implemented the new IFRS 17 reporting system. Liberty Kenya Holdings’ Profit After Tax (PAT) increased by 196.7% to Kshs 0.6 bn, from Kshs 0.2 bn recorded in H1’2023, mainly driven by an 851.9% increase in Net insurance income to Kshs 0.5 bn, from Kshs 0.1 bn in H1’2023, and further supported by a 39.2% increase in Net investment income to Kshs 1.0 bn, from Kshs 0.7 bn in H1’2023.
Liberty Kenya Holdings Plc’s H1’2024 Results
|
Cytonn Report: Liberty Kenya Holdings Income Statement |
|||
|
Item (All figures in Bns) |
H1’2023 |
H1’2024 |
y/y change |
|
Net Insurance Service Revenue |
0.1 |
0.5 |
851.9% |
|
Net Investment Revenue |
0.7 |
1.0 |
39.2% |
|
Total Insurance and Investment Result |
0.8 |
1.5 |
94.3% |
|
Other Operating Result |
(0.4) |
(0.6) |
35.1% |
|
Profit Before Tax |
0.4 |
1.0 |
160.2% |
|
Profit after tax |
0.2 |
0.6 |
196.7% |
|
Core EPS |
0.4 |
1.2 |
196.7% |
|
Cytonn Report: Liberty Kenya Holdings Balance Sheet |
|||
|
Item (All figures in Bns) |
H1’2023 |
H1’2024 |
y/y change |
|
Financial Investments |
21.3 |
26.2 |
23.3% |
|
Reinsurance contract assets |
5.4 |
5.8 |
6.9% |
|
Total Assets |
43.0 |
46.0 |
6.9% |
|
Insurance contract Liabilities |
23.9 |
22.0 |
(7.8%) |
|
Total Liabilities |
33.9 |
36.2 |
6.6% |
|
Shareholder funds |
8.7 |
9.5 |
9.1% |
|
Minority Interest |
0.4 |
0.3 |
16.5% |
|
Total Equity |
9.1 |
9.8 |
8.1% |
Key take outs from the results:
- Core Earnings Per share increased by 196.7% to Kshs 1.2 from Kshs 0.4 in H1’2023, driven by the 851.9% increase in net insurance income to Kshs 0.5 bn from Kshs 0.1 bn in H1’2023, coupled with a 39.2% increase in net investment income to Kshs 1.0 bn from Kshs 0.7 bn in H1’2023,
- Net Investment Income increased by 39.2% to Kshs 1.0 bn in H1’2024, from Kshs 0.7 bn in H1’2023. This was majorly attributable to a significant 127.8% increase in investment income to Kshs. 2.1 bn from Kshs 0.9 bn in H1’2023, but was weighed down by the 484.8% increase in net insurance finance expenses to Kshs 1.1 bn from Kshs 0.2 bn in H1’2023,
- Net insurance revenue before reinsurance contracts held increased by 403.1% to Kshs 0.5 bn in H1’2024 from a loss of Kshs 0.6 bn in H1’2023, while net expense from reinsurance contracts held increased by 295.6% to Kshs 1.2 bn from Kshs 0.6 bn in H1’2023, this translated to a Net insurance service result increase of 851.9% to Kshs 0.5 bn from Kshs 0.1 bn in H1’2023,
- The balance sheet recorded an expansion as total assets increased by 6.9% to Kshs 46.0 bn in H1’2024 from Kshs 43.0 bn in H1’2023 mainly driven by 23.3% increase in financial investments to Kshs 26.2 bn from Kshs 21.3 bn in H1’2023, coupled with a 6.9% increase in reinsurance contract assets Kshs 5.8 bn from Kshs 5.4 bn in H1’2023,
- Total liabilities increased by 6.6% to Kshs 36.2 bn from Kshs 33.9 bn in H1’2023, majorly on the back of the 50.6% increase in financial liabilities under investment contracts to Kshs 10.3 bn from Kshs 6.8 bn in H1’2023, which outpaced the 7.8% decrease in insurance contract liabilities to Kshs 22.0 bn, from Kshs 23.9 bn in H1’2023,
Going forward, the factors that would drive the company’s growth would be:
- Diversified Products – In Kenya, the short-term insurance business saw an 11.0% increase in insurance revenue, with an improved claim ratio compared to the previous year. The introduction of a retail medical product in the last quarter is expected to address market gaps in that segment.
Valuation Summary:
- We are of the view that Liberty Kenya Holdings Plc is an “Accumulate” with a target price of Kshs 6.3 representing an upside of 5%, from the current price of 5.6 as of 23rd August 2024.
- Liberty Kenya Holdings Plc is currently trading at a P/TBV of 0.4x and a P/E of 0x vs an industry average of 0.5x and 5.2x respectively.
We are “Neutral” on the Equities markets in the short term due to the current tough operating environment and huge foreign investor outflows, and, “Bullish” in the long term due to current cheap valuations and expected global and local economic recovery. With the market currently being undervalued for its future growth (PEG Ratio at 0.8x), we believe that investors should reposition towards value stocks with strong earnings growth and that are trading at discounts to their intrinsic value. We expect the current high foreign investors’ sell-offs to continue weighing down the equities outlook in the short term
- Residential Sector
- The Launch of Santana project by Megna Homes
During the week, Megna Homes, a Mombasa-based developer, launched the construction of its Kshs 4.0 bn modern gated community housing project in Kwa Sonko area, Kisauni, Mombasa County. The project, dubbed ‘Santana’ is set to sit on 12.0 acres of land and will comprise 816 modern units, including 336 three-bedroom units, 432 two-bedroom units, and 48 one-bedroom units. The Santana housing project is expected to cater to wide housing needs and preferences, with prices starting from Kshs 2.6 mn. Additionally, the project will feature modern amenities such as an Olympic-sized swimming pool, multi-purpose community center, kids’ playground, football pitch, jogging tracks, green spaces, parking spaces and a police post.
To facilitate an uptake of the units, Megna Homes has offered flexible plans, including quarterly and monthly options, with an additional ‘Lipa Mdogo Mdogo scheme” that allows clients to pay small incremental payments towards full ownership. Furthermore, the developer has partnered with leading financial institutions including KCB, ABSA, and Gulf Bank who will offer affordable mortgage loans to prospective homeowners making the owning the units more accessible and achievable.
We expect this project by Megna Homes to position Kisauni as a more desirable residential area, potentially driving up property values, stimulating infrastructure development, and drive up demand for commercial and retail spaces in the surrounding area.
The project is set to contribute positively to Kisauni by improving residents’ standards of living, community living and enhancing security of residents in the area through a police station, offering more than 2,000 youth job opportunities thus reducing unemployment rates, as well as opening up the area for more investment opportunities.
- Partnership between Shelter Afrique Development Bank (ShafDB) and CPF Group
Shelter Afrique Development Bank (ShafDB), a leading Pan-African financing institution focused on housing, urban, and related infrastructure development, announced the signing of a Memorandum of Understanding (MOU) with CPF Group to partner in affordable housing projects in Kenya.
According to Shelter Afrique, this agreement will assist in boosting its primary goal of delivering decent and affordable housing units to Kenyan citizens through co-financing projects and also leveraging public-private partnerships. One of the key components of this partnership is the establishment of a joint Housing Solutions Fund for Kenyans, targeting improving both the supply and demand sides of affordable housing units. The fund will be jointly designed and managed by both firms providing the required strategy to raise capital and technical support to facilitate successful implementation.
We expect this partnership between ShafDB and CPF group to positively impact on affordable housing landscape in Kenya. By combining their resources and expertise, they can potentially reduce the housing deficit currently estimated to be standing at 80.0% annually with only 50,000 new houses being built each year, while the demand stands at approximately 250,000 units, leaving a shortfall of about 200,000 housing units annually. Additionally, through the construction projects, the firms will positively improve the social and economic positions of many Kenyan citizens.
- Kenya Mortgage Refinance Company (KMRC) financial performance H1’ 2024
During the week, state-backed mortgage lender, Kenya Mortgage Refinance Company (KMRC) released its H1’2024 financial results, which posted an 84.4% increase in Profit after Tax (PAT) to Kshs 669.0 mn in H1’2024 from Kshs 362.8 mn in H1’2023. Additionally, the balance sheet expanded, with total assets registering a 15.0% increase to Kshs 24.9 bn in H1’2024 from Kshs 24.7 bn in H1’2023, driven by a 14.7% increase in loans advanced, which came in at Kshs 8.7 bn from Kshs 7.6 bn in H1’2023. Below is a breakdown of KMRC’s financial performance in H1’2024;
|
Cytonn Report: Summary of KMRC Statement of Comprehensive Income |
|||
|
H1'2023 |
H1'2024 |
y/y Change |
|
|
REVENUE |
|||
|
Interest Income |
1,107,761,000 |
1,477,928,000 |
33.4% |
|
Interest expense |
(497,504,000) |
(521,749,000) |
4.9% |
|
Net interest income |
610,257,000 |
956,179,000 |
56.7% |
|
EXPENSES |
|||
|
Operating and administration expenses |
(114,297,000) |
(138,938,000) |
21.6% |
|
Depreciation and amortisation expenses |
(10,662,000) |
(16,655,000) |
56.2% |
|
Total Expenses |
(124,959,000) |
(155,593,000) |
24.5% |
|
Net profit before income tax |
485,298,000 |
800,586,000 |
65.0% |
|
Income tax expense |
(122,553,000) |
(131,575,000) |
7.4% |
|
PROFIT AFTER TAX |
362,745,000 |
669,011,000 |
84.4% |
|
Cytonn Report: Summary of KMRC Statement of Financial Position |
|||
|
|
H1'2023 |
H1'2024 |
y/y Change |
|
Assets |
|||
|
Loan and Advances |
7,643,120,000 |
8,763,118,000 |
14.7% |
|
Cash and Cash equivalents |
11,623,967,000 |
14,365,558,000 |
23.6% |
|
Other Assets |
5,731,522,000 |
5,625,526,000 |
(1.8%) |
|
Total Assets |
24,998,609,000 |
28,754,202,000 |
15.0% |
|
Liabilities |
|||
|
Borrowings |
21,442,164,000 |
22,941,904,000 |
7.0% |
|
Debt securities in issue |
- |
1,185,356,000 |
- |
|
Lease Liabilities |
33,053,000 |
24,204,000 |
(26.8%) |
|
Other Liabilities |
358,634,000 |
414,225,000 |
15.5% |
|
Total Liabilities |
21,833,851,000 |
24,565,689,000 |
12.5% |
|
Capital Resources |
|||
|
Share Capital |
1,808,375,000 |
1,808,375,000 |
0.0% |
|
Revenue reserves |
1,270,736,000 |
2,293,228,000 |
80.5% |
|
Other Revenues |
10,517,000 |
- |
- |
|
Statutory Reserve |
75,130,000 |
86,911,000 |
15.7% |
|
Total Capital |
3,164,758,000 |
4,188,514,000 |
32.3% |
|
Total Liabilities and Equity |
24,998,609,000 |
28,754,202,000 |
15.0% |
Income Statement:
- The profit after tax increased by 84.4% to Kshs 669.0 mn in H1’2024, from Kshs 362.7 mn in H1’2023 majorly attributable to a 33.4% increase in interest income to Kshs 1.4 bn in H1’2024 from Kshs 1.1bn mn recorded in H1’2023. This was driven by an increase in lending activities with loans and advances to their customers reaching Kshs 8.7 bn in H1’2024 compared to Kshs 7.6 bn in H1’2023,
- The total expenses increased by 24.5% to Kshs 155.5 mn in H1’2024 from Kshs 124.9 mn recorded in H1’2023 mainly attributable to a 56.2% increase in depreciation and amortization expenses to Kshs 16.6 mn in H1’2024 from Kshs 10.6 mn in H1’2023, coupled by a 21.6% surge in operating and administration expenses, and,
- The net interest income recorded a 56.7% increase to Kshs 956.1 mn in H1’2024 from Kshs 610.2 mn in H1’2023. This is attributable to a 33.4% increase in interest income to Kshs 1.4 bn in H1’2024 from Kshs 1.1 bn in H1’2023 as KMRC advanced its lending activities to Primary Mortgage Lenders (PMLs)
Balance Sheet:
- Total assets increased by 15.0% to Kshs 28.7 bn in H1’2024 from Kshs 24.9 bn in H1’2023 mainly attributable to a 23.6% increase in cash and cash equivalents to Kshs 14.4 bn in H1’2024 from Kshs 11.6 bn in H1’2023. Additionally, loan advances increased by 14.7% to Kshs 8.7 bn in H1’2024 from Kshs 7.6 bn in H1’2023,
- Total liabilities posted a 12.5% increase to Kshs 24.5 bn in H1’2024 from Kshs 21.8 bn in H1’2023 majorly on the back of an increase in borrowings by 7.0% to Kshs 22.9 bn in H1’2024 from Kshs 21.4 bn in H1’2023. Additionally, other liabilities recorded a 15.5% surge to Kshs 414.2 mn in H1’2024 from Kshs 358.6 mn in H1’2023, and,
- The company borrowings increased by 7.0% to Kshs 22.9 bn in H1’2024 from Kshs 21.4 bn in H1’2023 as the lender aimed to improve its capacity to support higher lending, initially at Kshs 8.0mn to Kshs 10.5 mn in a move that was effective February 2024 to boost mortgage uptake earlier in the year.
We anticipate KMRC to continue disbursing more mortgages in line with the government's goal of delivering approximately 200,000 mortgages through the company to boost homeownership in the country. Additionally, the company has demonstrated its ability to manage resources efficiently, as reflected in its financial statements, which builds confidence in its capacity to handle increased funding for stakeholders. We expect, the support to KMRC to continue growing as the company seeks partnerships with new primary mortgage lenders (PMLS) and as the company continues to initiate innovative financial products to further stimulate the mortgage market in Kenya.
- Retail Sector
During the week, China Square, an international retail company, opened its latest store in Nyali, Mombasa County marking its 4th outlet in the country. The retail store which was officially opened to the public on 20th August, 2024 is situated at the Nyali Bazaar Mall along Links Road. The company aims to continue providing affordable housing products to the residents around Mombasa County with items ranging from appliances, furniture, stationary, and home deco among many other items.
This launch marks a significant expansion for the retail store in the country in an attempt to capture the local retail market through affordable products. We expect the move by China square will offer employment opportunities, both directly within the store and indirectly through increased business for local suppliers or services. Additionally, the entry of a large retailer like China Square may drive up demand for retail spaces in the area as smaller businesses seek to establish nearby to tap into the increased foot traffic from the outlet. The chart below shows the main local and international retail supermarket chains.
|
Cytonn Report: Main Local and International Retail Supermarket Chains |
|||||||||||
|
# |
Name of retailer |
Category |
Branches as at FY’2018 |
Branches as at FY’2019 |
Branches as at FY’2020 |
Branches as at FY’2021 |
Branches as at FY’2022 |
Branches as at FY’2023 |
Branches opened in FY’2024 |
Closed Branches |
Current Branches |
|
1 |
Naivas |
Hybrid* |
46 |
61 |
69 |
79 |
91 |
100 |
5 |
0 |
105 |
|
2 |
Quick Mart |
Hybrid** |
10 |
29 |
37 |
48 |
55 |
59 |
1 |
0 |
60 |
|
3 |
Chandarana |
Local |
14 |
19 |
20 |
23 |
26 |
26 |
0 |
0 |
26 |
|
4 |
Carrefour |
International |
6 |
7 |
9 |
16 |
19 |
22 |
1 |
0 |
23 |
|
5 |
Cleanshelf |
Local |
9 |
10 |
11 |
12 |
12 |
13 |
0 |
0 |
13 |
|
6 |
Jaza Stores |
Local |
0 |
0 |
0 |
0 |
0 |
4 |
2 |
0 |
6 |
|
7 |
Tuskys |
Local |
53 |
64 |
64 |
6 |
6 |
5 |
0 |
59 |
5 |
|
8 |
China Square |
International |
0 |
0 |
0 |
0 |
0 |
2 |
2 |
0 |
4 |
|
9 |
Uchumi |
Local |
37 |
37 |
37 |
2 |
2 |
2 |
0 |
35 |
2 |
|
10 |
Panda Mart |
International |
0 |
0 |
0 |
0 |
0 |
0 |
1 |
0 |
1 |
|
11 |
Game Stores |
International |
2 |
2 |
3 |
3 |
0 |
0 |
0 |
3 |
0 |
|
12 |
Choppies |
International |
13 |
15 |
15 |
0 |
0 |
0 |
0 |
15 |
0 |
|
13 |
Shoprite |
International |
2 |
4 |
4 |
0 |
0 |
0 |
0 |
4 |
0 |
|
14 |
Nakumatt |
Local |
65 |
65 |
65 |
0 |
0 |
0 |
0 |
65 |
0 |
|
Total |
257 |
313 |
334 |
189 |
211 |
233 |
12 |
181 |
245 |
||
|
*51% owned by IBL Group (Mauritius), Proparco (France), and DEG (Germany), while 49% owned by Gakiwawa Family (Kenya) |
|
||||||||||
|
**More than 50% owned by Adenia Partners (Mauritius), while Less than 50% owned by Kinuthia Family (Kenya) |
|||||||||||
Source: Cytonn Research
- Real Estate Investments Trusts (REITs)
On the Unquoted Securities Platform, Acorn D-REIT and I-REIT traded at Kshs 25.4 and Kshs 22.2 per unit, respectively, as per the last updated data on 23rd August 2024. The performance represented a 27.0% and 11.0% gain for the D-REIT and I-REIT, respectively, from the Kshs 20.0 inception price. The volumes traded for the D-REIT and I-REIT came in at Kshs 12.3 mn and Kshs 31.6 mn shares, respectively, with a turnover of Kshs 311.5 mn and Kshs 702.7 mn, respectively, since inception in February 2021. Additionally, ILAM Fahari I-REIT traded at Kshs 11.0 per share as of 23rd August, 2024, representing a 45.0% loss from the Kshs 20.0 inception price. The volume traded to date came in at 138,600 for the I-REIT, with a turnover of Kshs 1.5 mn since inception in November 2015.
REITs offer various benefits, such as tax exemptions, diversified portfolios, and stable long-term profits. However, the ongoing decline in the performance of Kenyan REITs and the restructuring of their business portfolios are hindering significant previous investments. Additional general challenges include: i) insufficient understanding of the investment instrument among investors, ii) lengthy approval processes for REIT creation, iii) high minimum capital requirements of Kshs 100.0 mn for trustees, and iv) minimum investment amounts set at Kshs 5.0 mn for the Investment REITs, all of which continue to limit the performance of the Kenyan REITs market.
We expect the performance of Kenya’s real estate sector to be sustained by: i) increased investment from local and international investors, particularly in the retail, hospitality and residential sectors ii) Favorable demographics in the country, leading to higher demand for housing and Real Estate, and iii) ongoing residential developments under the Affordable Housing Agenda, aiming to reduce the housing deficit in the country iv) increased recognition of Nairobi as a shopping hub bolstering the retail sector, v) increased infrastructural development in the country opening up satellite towns for more investment opportunities, vi) a growing middle-class; creating demand for retail commodities, and vii) growth and expansion efforts by both local and international retailers. However, challenges such as rising construction costs, an oversupply in select Real Estate classes, strain on infrastructure development, and high capital demands in REITs sector will continue to impede the real estate sector’s optimal performance by restricting developments and investments.
Following the release of the H1’2024 results by all four authorized Real Estate Investment Trusts (REITs) in Kenya, the Cytonn Real Estate Research Team undertook an analysis of the financial performance of the REITs and identified the key factors that shaped the performance of the sector. For the earnings notes of the various REITs, click the links below:
- ILAM Fahari I-REIT H1’2024 Earnings Note
- LapTrust Imara I-REIT H1’2024 Earnings Note
- Acorn I-REIT and D-REIT H1’2024 Earnings Note
The in the report we will assess the financial performance of the current REITs in the market during H1’2024 in terms of operational metrics, profitability metrics, leverage ratios, liquidity ratios, and valuation metrics. In addition, we highlight the outlook regarding our expectations for the REITs sector going forward. This we will cover as follows;
- Overview of the REITs Sector in Kenya,
- Themes that shaped the Real Estate Sector in H1’2024,
- Summary Performance of the REITS in H1’2024, and,
- Conclusion and Outlook for the REITs sector.
Section I: Overview of the REITs Sector in Kenya
In H1’2024, Kenya’s Real Estate sector recorded notable growth in terms of activity compared to a similar period in 2023, attributable to continued investments flowing into the sector. Kenya's Real Estate sector continues to play a vital role in the nation's GDP, growing at a Compound Annual Growth Rate (CAGR) of 5.5% over the past five years. In Q1’2024, the sector expanded by 6.6 %, reaching Kshs 329.2 bn, up from Kshs 306.9 bn in the same period of 2023. This growth underscores the sector's increasing significance, with its contribution to the national GDP rising to 10.2% in Q1’2024 from 10.1% in the same period in 2023.
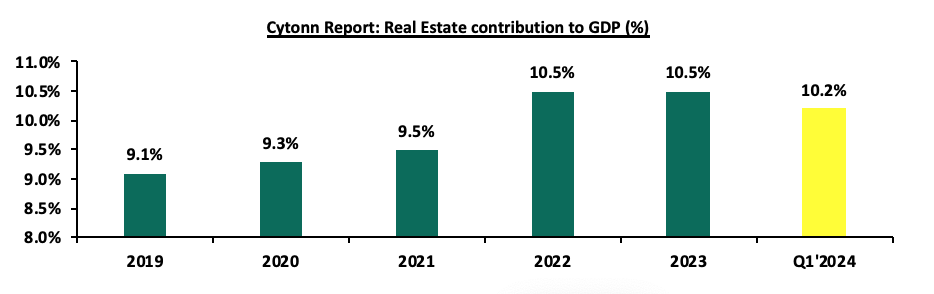
Several factors have driven this growth, including: i) the Kenyan government is actively working to increase affordable housing availability, ii) infrastructure development continues to support real estate growth by opening new areas for investment, iii) the Kenya Mortgage Refinance Company (KMRC) is making home loans more accessible, iv) the retail sector is expanding, driven by both local and international retailers Kenya's status as a regional business hub is boosting demand for commercial and residential real estate, v) high urbanization and population growth rates are sustaining housing demand vi) investor confidence in the hospitality sector is growing, with a positive outlook for hotel development, and, vii) the alternatives market, particularly in specialized real estate, is showing potential for growth in 2024.
Despite the aforementioned cushioning factors, several challenges hinder the optimal performance of the Real Estate sector. These challenges include Construction costs increased by 17.6% in H1’2024, primarily due to higher prices for key materials, which could hinder sector development. Oversupply of physical space exists in various sectors, leading to prolonged vacancy rates. The REITs market in Kenya faces challenges like large capital requirements, prolonged approval processes, and limited investor knowledge. Rising interest rates have made borrowing more expensive, reducing demand for mortgages and developer financing. Lenders are tightening their requirements, leading to constrained financing for developers and an increase in Non-Performing Loans (NPLs). Underdeveloped capital markets limit funding for real estate projects, with banks providing nearly 95.0% of funding for developers in Kenya. To address the funding gap, players in the Real Estate sector have increasingly turned to alternative financing methods like Real Estate Investment Trusts (REITs). In 2013, the Capital Markets Authority (CMA) introduced a detailed framework and regulations for REITs, enabling developers to secure capital through this investment avenue.
Kenya's Real Estate sector has been expanding due to ongoing construction activities driven by strong demand for real estate developments. The residential market is significantly under-supplied, with an 80.0% housing deficit; only 50,000 units are delivered annually against an estimated need for 200,000 units per year. Additionally, the formal retail market in Kenya is still in its nascent stages, with a penetration rate of approximately 30.0%, as reported by the Nielsen Report 2018. Despite the high demand, developers in Kenya encounter limited financing options, with local banks providing nearly 95.0% of construction financing, in stark contrast to the 40.0% typically seen in developed countries. The graph below illustrates the comparison of construction financing in Kenya versus developed economies;
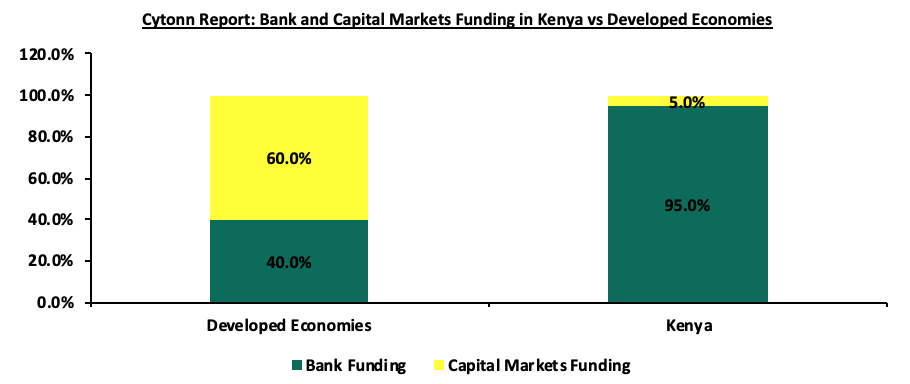
Source: World Bank, Capital Markets Authority (CMA)
To bridge the funding gap, developers are increasingly turning to alternative financing methods. In 2013, the Capital Markets Authority (CMA) introduced a regulatory framework for Real Estate Investment Trusts (REITs) in Kenya. REITs are collective investment vehicles that pool funds from investors, who then acquire rights or interests in a trust divided into units. Investors benefit from profits or income generated by the real estate assets held within the trust. To ensure transparency, accountability, and the protection of investors' interests, four essential entities play key roles in the REIT structure in Kenya:
- The Promoter: This entity is responsible for establishing the REIT scheme. The promoter acts as the initial issuer of REIT securities and handles submissions to regulatory authorities for approvals of trust deeds, prospectuses, or offering memorandums. Examples of REIT promoters in Kenya include Acorn Holdings Limited and LAP Trust.
- The REIT Manager: This is a licensed company in Kenya that provides real estate and fund management services for a REIT scheme on behalf of investors. There are currently 10 REIT Managers in Kenya, including Cytonn Asset Managers Limited, Acorn Investment Management, and Stanlib Kenya Limited.
- The Trustee: A corporation or company appointed under a trust deed and licensed by the CMA to hold real estate assets on behalf of investors. The trustee's primary role is to act in the best interests of investors by evaluating investment proposals from the REIT Manager and ensuring compliance with the Trust Deed. REIT trustees in Kenya include Kenya Commercial Bank (KCB) and Co-operative Bank.
- Project/Property Manager: The project manager oversees the planning and execution of construction projects within the REITs. Meanwhile, the property manager handles the management of completed real estate developments acquired by a REIT, with a focus on generating profit.
The relationship between key parties in a typical REIT structure is depicted in the figure below;
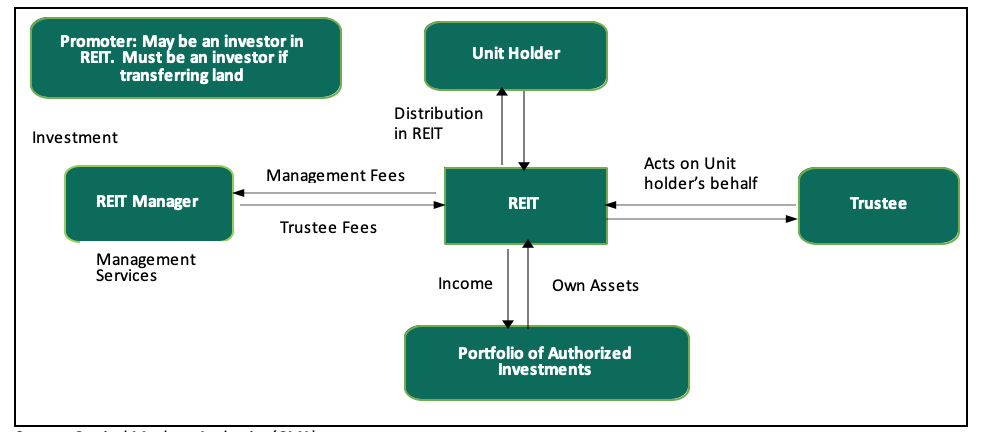
Source: Capital Markets Authority (CMA)
Since its introduction in 2013, the REIT market in Kenya has faced several hurdles that have hindered its growth. Key challenges include the hefty capital requirement of Kshs 100.0 mn for trustees, limiting this role largely to banks, and a protracted approval process for setting up REITs. Additionally, the high minimum investment threshold of Kshs 5.0 mn discourages potential investors, while a lack of sufficient investor education and awareness further impedes market expansion. As a result, the REIT market capitalization in Kenya remains significantly lower compared to other regions
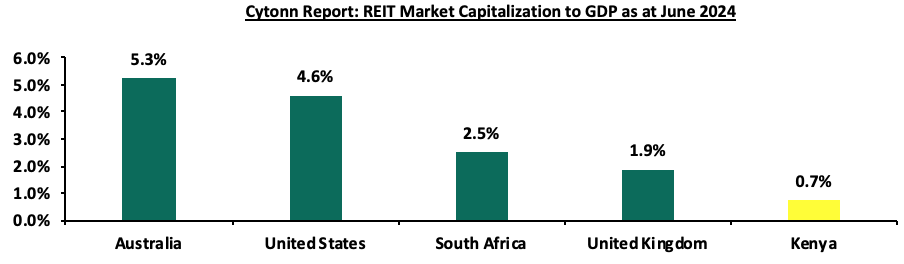
Source: European Public Real Estate Association (EPRA), World Bank
Kenya's REIT market faces additional challenges due to its relatively underdeveloped capital markets, especially when compared to countries like South Africa. Currently, there is only one listed REIT in Kenya, which is not actively trading. This reflects a sector that has largely remained stagnant since the introduction of REIT regulations in 2013. Consequently, most property developers in Kenya continue to rely on traditional funding sources, such as banks, unlike in more developed markets. Since the establishment of REIT regulations, four REITs have been approved in Kenya, all structured as closed-ended funds with a fixed number of shares. However, none of these REITs are actively trading on the Main Investment Market Segment of the Nairobi Securities Exchange (NSE). Following the recent delisting of ILAM Fahari I-REIT, LAPTrust Imara I-REIT is the only listed REIT in the country, quoted on the restricted market sub-segment of the NSE's Main Investment Market. It is important to note that Imara did not raise funds upon listing. The ILAM Fahari I-REIT, Acorn I-REIT and D-REIT are not listed but trade on the Unquoted Securities Platform (USP), an over-the-counter market segment of the NSE. The table below outlines all REITs authorized by the Capital Markets Authority (CMA) in Kenya
|
Cytonn Report: Authorized REITs in Kenya |
||||||
|
# |
Issuer |
Name |
Type of REIT |
Listing Date |
Market Segment |
Status |
|
1 |
ICEA Lion Asset Management (ILAM) |
Fahari |
I-REIT |
July 2024 |
Unquoted Securities Platform (USP) |
Trading |
|
2 |
Acorn Holdings Limited |
Acorn Student Accommodation (ASA) – Acorn ASA |
I-REIT |
February 2021 |
Unquoted Securities Platform (USP) |
Trading |
|
3 |
Acorn Holdings Limited |
Acorn Student Accommodation (ASA) – Acorn ASA |
D-REIT |
February 2021 |
Unquoted Securities Platform (USP) |
Trading |
|
4 |
Local Authorities Pension Trust (LAPTrust) |
Imara |
I-REIT |
March 2023 |
Restricted Market Sub-Segment of the Main Invesment Market |
Restricted |
Source: Nairobi Securities Exchange, CMA
Section II: Themes that Shaped the REIT Sector in H1’2024
In this section, we examine the key themes that have significantly shaped the REIT sector up to H1 2024. We explore how evolving regulations, strategic acquisitions, and capital-raising initiatives have influenced the REIT industry's trajectory. Additionally, we provide insights into the broader factors that have impacted the sector's performance and overall direction during this period.
- Regulations
REITs are formally established in accordance with regulations set forth for Real Estate Investment Trusts (REITs) and granted approval by the Capital Markets Authority (CMA) under the Capital Markets Real Estate Investment Trusts Collective Investment Schemes Regulations of 2013. Instead of taking the form of conventional companies, they are structured as trusts. The management of investment properties falls under the purview of a corporate REIT manager, licensed by the CMA. Units of listed REITs are traded on the Nairobi Securities Exchange (NSE), akin to shares of any other company listed on both the Main Market Segment and the Unquoted Security Platform (USP), providing investors with a liquid stake in Real Estate. Both individual and corporate investors have the opportunity to partake in a public offering on the NSE, as outlined in the Regulations of 2013.
Furthermore, the regulations stipulate that Kenyan REITs are mandated to distribute a minimum of 80.0% of distributable earnings to their unitholders. REITs automatically qualify for several tax exemptions such as the Income Tax Act (ITA), Value Added Tax (VAT), and Capital Gains Tax (CGT) under the authorization of the Kenya Revenue Authority (KRA). Some of the recent regulatory transformations in the REITs industry include;
- Exemption from Income Tax Act
Section 20 (1) (c) and (d) of the Income Tax Act (ITA) mandates that, upon registration with the Commissioner of the Kenya Revenue Authority (KRA), both REITs and the companies they invest in are exempt from the standard 30.0% Income Tax Rate (ITR). Furthermore, income distributed by REITs to their investors (unitholders) is not taxed. However, this exemption does not apply to the withholding tax on interest income and dividends received by non-exempt unitholders, as outlined in the first schedule of the ITA. The applicable withholding tax rates can be found in paragraph 5 of the third schedule of the Income Tax Act.
- Capital Gains Tax (CGT) exemptions
A capital gain arises when the value of a unit upon transfer exceeds its adjusted cost. The disparity between these values is liable to a tax rate of 15.0%. Consequently, any profits made by a promoter or investors of a REIT from transferring property into the REIT are now subject to Capital Gains Tax (CGT) at the revised rate of 15.0%, supplanting the previous rate of 5.0% effective from 1 January 2023. Additionally, individuals holding units in a REIT who opt to sell their ownership stake are also required to remit CGT. This stipulation emerged following an amendment to Section 34 (1) (j) of the Income Tax Act through the Finance Act 2022.
However, within the REIT industry, there are certain scenarios that qualify for exemptions from CGT:
- Transfers of property from life insurance companies to a REIT are exempt from CGT, as outlined in Section 19 (6B) of the Income Tax Act (ITA),
- Indirect transfer of property into a REIT when the promoter first transfers properties to a Special Purpose Vehicle (SPV). Subsequently, the shares of the investee company held by the SPV are transferred to the REIT. This is considered a restructuring, as the property transfer does not involve a third party. This exemption is based on Paragraph 13 of the Eighth Schedule to the ITA. However, CGT is applicable on gains made during the transfer of shares from the investee company to the REIT Trustee,
- Payments received by unit holders or shareholders in a REIT for unit redemption or share sale are exempt from CGT in accordance with section 20 (2) of the ITA, and,
- Gains realized by the REIT from the sale of properties, whether directly or through an SPV, are also exempt from CGT.
- Exemption from Value Added Tax (VAT)
The Finance Act 2021 reinstated a significant alteration concerning the exemption from Value Added Tax (VAT) for transactions involving the transfer of assets to REITs and asset-backed securities. This exemption had previously been rescinded by the Tax Laws Amendment Act No. 2 of 2020. In line with Paragraph 33 of Part II of the First Schedule to the VAT Act 2021, a direct transfer of property from the REIT promoter or investors is not subject to VAT. However, if the transfer of assets to the REIT occurs indirectly, through the initial transfer of assets to the investee company, VAT will apply. It is noteworthy that the transfer of shares from a REITs SPV to the REIT trustee will be exempt from VAT, regardless of whether the initial asset transfer involved VAT.
- Reintroduction of Stamp Duty from January 2023
In accordance with the Stamp Duty Act's Section 96A, transfers of stabilized properties from Development REITs (D-REITs) to Income REITs (I-REITs) were previously exempt from stamp duty. However, this exemption expired on December 31, 2022. Effective January 1, 2023, such transfers are now subject to stamp duty as per Section 96A subsection 4.
The intricate nature of REIT regulations, combined with the complexity of the REIT structure, can make it challenging for individuals to understand the tax implications of their investments. This lack of clarity can deter potential investors, fostering skepticism about the fairness and reliability of the REIT market.
Moreover, the limited public information available on REIT regulations exacerbates this issue. Investors who are unaware of the tax consequences of their decisions may avoid investing altogether or make uninformed choices, potentially impacting their financial returns.
To address these concerns, it is crucial for both the government and REIT stakeholders to prioritize the following: i) Enhanced Transparency: Increase public access to clear and concise information about REIT regulations and tax implications, ii) educational Initiatives: Launch educational campaigns and provide resources to inform investors about REITs and their associated tax considerations, iii) collaboration: Foster collaboration between regulatory authorities and industry stakeholders to raise awareness about the benefits and drawbacks of REIT investments, iv) Clear Documentation: Provide easily understandable documentation outlining the tax implications of various investment scenarios, and, v) Consultation Services: Establish accessible consultation services to allow investors to seek expert advice on tax-related aspects of REIT investments.
By implementing these measures, we can help create a more informed and confident investment environment for REITs in Kenya.
- Portfolio Holdings & Acquisitions
Acquisitions play a pivotal role in the dynamic landscape of the Kenyan REITs industry. These strategic moves signify the industry's evolution, adaptability, sustainability, and growth potential. As of December 2023, the industry has witnessed noteworthy acquisitions that are reshaping the sector. These acquisitions hold a promising outlook for the industry, contributing to its progress and value proposition. They exemplify how REITs are actively enhancing their portfolios, expanding their market presence, and optimizing their performance. Some of the notable acquisitions as at H1’2024 include;
- LAPTrust Imara I-REIT possesses a diversified portfolio of properties which include; i) Pension Towers, Metro Park, and CPF House which are commercial office buildings located in Nairobi CBD, ii) Retail centre Freedom Heights mall located in Lang’ata, iii) Nova Pioneer which is a purpose-built educational facility located in Eldoret, iv) Freedoms Height residential apartments and serviced plot located in Lang’ata, and, v) Man apartments located in Kilimani,
- ILAM Fahari I-REIT manages and operates several properties under their portfolio which include: i) a mixed used development (MUD) Greenspan Mall located in Donholm, Nairobi, ii) 67 Gitanga Place which is a prime office property located in Lavington, and, iii) Bay Holdings and Highway House which are industrial properties located in Industrial Area and Mombasa Road area respectively,
- Acorn Student Accommodation (ASA) I-REIT has five completed student housing properties with 3,003 beds under their management serving up to 128 universities and colleges. These properties include; Qwetu Jogoo Road, Qwetu Ruaraka, Qwetu WilsonView in Lang’ata, Qwetu Parklands, and Qwetu Aberdare Heights I along Thika Road next to United States International University Africa (USIU-A). On the other hand, Acorn D-REIT boasts of four properties which are currently operational and six other properties under development bringing to a total of ten properties with 10,060 beds under its portfolio. Operational properties include; Qwetu Hurlingham, Qwetu Abedare Heights II, Qwetu Karen, Qejani Karen whereas properties under development include; Qwetu Chiromo, Qejani Chiromo, Qejani JKUAT next to Jomo Kenyatta University of Agriculture and Technology, Qejani Hurlingham, Qwetu KU, and Qejani KU next to Kenyatta University,
- During H1’2024, Acorn Student Accommodation Development REIT (ASA D-REIT) announced it had sold its stabilized asset, Qwetu Aberdare Heights II, to the Acorn Student Accommodation Income REIT (ASA I-REIT) in a Kshs 1.5 bn deal. The acquisition of the 630-bed capacity hostel located adjacent to Qwetu Aberdare Heights I and United States International University (USIU) brings the total number of assets acquired by the I-REIT to four over the last three years, after successful acquisitions of Qwetu Hurlingham in June 2023, Qwetu WilsonView in February 2021, and Qwetu Aberdare Heights I in October 2022. Through the sale, ASA D-REIT will repay Kshs 600.0 mn of the Acorn Green Bond, pushing the repayment of the Kshs 5.7 bn bond to Kshs 3.0 bn ahead of its maturity in November 2024. The bond which was first floated in 2019, was issued in partnership with Private Equity Fund Helios and had attracted an 85.0% subscription rate, raising Kshs 4.3 bn of the targeted amount of Kshs 5.0 bn. The bond was priced at a rate of 12.3%, and was intended to be used to finance sustainable and climate-resilient student accommodation with a combined capacity of 40,000 beds. and,
- During the year, the Capital Markets Authority (CMA) granted a license to Mi Vida Homes Limited to operate as a REIT Manager in efforts to strengthen and develop the country’s capital markets. This brings the total number of REIT managers in Kenya to 11. As a REIT Manager, the company will offer Real Estate and fund management services for Real Estate investment trusts (REITs) on behalf of investors within a REIT scheme. We expect this milestone will open exciting new opportunities for investors and further develop our country’s Real Estate market, as the country’s REIT market remains underdeveloped and relies primarily on conventional funding alternatives.
In the future, we expect REITs to maintain a strategic acquisition strategy. This will involve actively seeking opportunities to expand their portfolios, diversify their holdings, and respond to evolving market demands. Additionally, REITs are likely to prioritize environmental sustainability, as exemplified by Acorn Holding's issuance of green bonds. Such acquisitions can also stimulate innovation within the industry, encouraging the development of new ideas, designs, and services that cater to the needs of both investors and tenants.
- Capital Raising
Raising capital is essential in the REITs industry, fueling growth, development, and innovation. Securing funds from diverse sources, whether through debt or equity, enables REITs to expand their portfolios, improve existing properties, and explore new investment opportunities. This practice benefits the REITs and significantly shapes the Real Estate landscape, providing attractive investment options to stakeholders. Some of the notable capital infusion in the REITs industry as of H1’2024 include;
- Acorn Holdings, a student hostel developer in Nairobi announced a bid to raise Kshs 2.8 bn in new capital for its development and income Real Estate Investment Trusts (REITS) by February 2025 to fund the development and acquisition of new properties. The firm targets Kshs 1.9 bn for the Acorn student accommodation I-REIT and Kshs 810.0 mn for the D-REIT, which is set to be raised through a combination of a rights issue that closed on 31st July and open market offer which continues until February 2025. Acorn offered an open market price of Kshs 24.54 for the D-REIT and Kshs 22.03 for the I-REIT with existing unit holders enjoying a discount of 0.6% during the rights issue offer period which has since expired. The recent offer by Acorn Holdings forms the third supplemental cash call made by the firm since inception of the REITs, following similar issuances in 2022 and 2023 making this strategy the primary capital raising instrument for the company. As at the end of June 2024, the ASA D-REIT holds 11 properties under different development stages, with a total valuation of Kshs 10.9 bn. These properties include two hostels in Karen under the company’s Qwetu and Qejani brands, which the firm expects to offload to the I-Reit by the end of Q1’2025. Similarly, the ASA I-REIT holds a portfolio of 7 hostels with a combined valuation of Kshs 10.3 bn as at June 2024 with the most recent acquisitions being the Qwetu Hurlingham in September 2023 and Qwetu Aberdare Heights II in January 2024.
- The Acorn D-REIT currently has an outstanding Kshs 1.86 bn green bond issued in October 2019, which financed eight hostel projects. The company had acquired Kshs 5.7 bn and has been making early repayments before the debt matures in November 2024. In February 2022, the D-REIT contracted a Kshs 6.7 bn loan from Absa Bank to fund 10 hostel projects, out of which Kshs 1.0 bn had been drawn down by June 2024 for ongoing projects at Juja, Kenyatta University and Hurlingham.
- The Linzi Sukuk bond was launched on July 31, 2024, marking Kenya's first Sharia-compliant bond aimed at funding affordable housing projects. President William Ruto announced that the KShs 3 bn (approximately Usd 20 mn) bond would finance the construction of 3,069 affordable housing units, significantly reducing the cost of home ownership for many Kenyans. The initiative allows potential homeowners to pay as little as KShs 7,000 per month over a 15-year period for homes valued at an average of KShs 1.4 mn. The Sukuk bond was structured to align with Islamic finance principles, which prohibit interest payments and instead provide investors with a share of profits from the underlying assets. The bond is expected to create thousands of jobs and stimulate economic growth by leveraging private funds for public housing. President Ruto emphasized the importance of using public land for these developments, arguing that it helps combat land speculation and ensures that housing benefits a broader segment of the population
- Delisting & Listing on the USP
ILAM Fahari I-REIT's delisting from the Main Investment Market Segment (MIMS) of the Nairobi Securities Exchange (NSE) was a strategic response to operational difficulties and the need for structural optimization. After receiving approval from the Capital Markets Authority (CMA), ILAM Fahari transitioned to a Restricted I-REIT, focusing on professional investors. This shift from the unrestricted segment to a restricted one highlights the REIT's challenges and its proactive restructuring approach. Operational issues prompted a reassessment, leading to resolutions at an Extraordinary General Meeting (EGM) in December 2023, where the decision to convert to a restricted REIT and delist received strong support from unitholders.
Implications of Delisting:
- Non-Professional Unitholders: Retail investors had to choose between accepting the redemption offer, which ended their unitholder status, or retaining units with post-conversion trading restrictions.
- Professional Unitholders: They remained largely unaffected, with the ability to trade units on the Unquoted Securities Platform (USP), though liquidity concerns persist.
- Tenants and Regulators: Minimal impact was observed, with the CMA continuing regulatory oversight as the REIT shifted to a Restricted I-REIT.
ILAM Fahari’s delisting and conversion were aligned with its goal to focus on professional investors, offering them specialized investment opportunities, enhancing flexibility, and unlocking growth potential. While this restructuring aids operational efficiency and capital raising, it limits retail investor participation, signaling a shift towards catering to high-net-worth individuals. Going forward, capital raising through equity, debt, and strategic partnerships, particularly in affordable housing and infrastructure, will be crucial in driving the expansion and sustainability of Kenya's REIT industry. Collaborative efforts, regulatory support, and investor education will be key to ensuring successful capital raising and a vibrant future for the sector.
During H1 2024, ICEA Lion Asset Managers (ILAM) Fahari I-REIT was admitted to the Unquoted Securities Platform (USP) of the Nairobi Securities Exchange (NSE), following their delisting from the main investment market in February 2024. ILAM Fahari joined Acorn I-REIT, Acorn D-REIT, and Linzi Sukuk in the USP, marking the first trading day in the segment. The delisting from the Main Investment Market Segment (MIMS) of the NSE will provide greater flexibility in managing the REIT's portfolio without affecting the unitholders’ ability to trade their units. The REIT’s shares (units) were available for trading on the platform at a fixed price of Kshs 11.0, representing the price at which a section of minority investors was bought out last year by ILAM, which is also the manager of the REIT.
Section III: Summary Performance of the REITs in H1’2024
The tables below highlight the performance of the Kenyan REITs sector, showing the performance using several National Association of Real Estate Investments Trusts (NAREIT) approved metrics, and the key take-outs;
|
Cytonn Report: Summary Performance Kenya REITs in H1’2024 |
|||||||||||||||
|
|
Laptrust Imara I-REIT |
ILAM Fahari I-REIT |
Acorn I-REIT |
Acorn D-REIT |
|
|
H1'2023 |
H1'2024 |
y/y change |
||||||
|
|
H1'2023 |
H1'2024 |
y/y Change |
H1'2023 |
H1'2024 |
y/y Change |
H1'2023 |
H1'2024 |
y/y Change |
H1'2023 |
H1'2024 |
y/y Change |
|||
|
Operating Metrics |
|||||||||||||||
|
Net Operating Income (NOI) |
99.6 |
162.4 |
63.0% |
86.0 |
53.8 |
59.8% |
128.0 |
309.9 |
142.1% |
334.2 |
260.2 |
(22.2%) |
647.9 |
786.3 |
21.4% |
|
Profitability Metrics |
|||||||||||||||
|
Funds from Operations |
99.6 |
162.4 |
63.0% |
86.0 |
53.8 |
59.8% |
149.8 |
359.0 |
139.6% |
334.2 |
260.2 |
(22.2%) |
669.7 |
835.3 |
24.7% |
|
Adjusted FFO |
99.6 |
162.4 |
63.0% |
84.4 |
55.1 |
53.2% |
149.8 |
359.0 |
139.6% |
334.2 |
260.2 |
(22.2%) |
668.1 |
836.6 |
25.2% |
|
Cash Available for Distribution (CAD) |
99.6 |
129.9 |
30.4% |
86.0 |
53.8 |
59.8% |
92.8 |
104.0 |
12.0% |
0.0 |
123.6 |
|
278.5 |
411.3 |
47.7% |
|
Cash Amounts Distributed (CAD) |
0.0 |
162.4 |
0.0% |
0.0 |
0.0 |
0.0% |
87.0 |
32.7 |
-62.4% |
0.0 |
181.4 |
|
87.0 |
376.5 |
332.8% |
|
Valuation Metrics |
|||||||||||||||
|
Net Asset Value (NAV) |
7,024.3 |
6,948.6 |
(1.1%) |
3,392.8 |
3,233.6 |
4.9% |
6,341.9 |
7,435.4 |
17.2% |
6,547.7 |
6749.5 |
3.1% |
23,306.6 |
24,367.1 |
4.5% |
Source: Cytonn Research
Key takeaways from the table include:
- The combined Net Operating Income (NOI) of Kenyan REITs saw a 21.4 % increase, reaching Kshs 786.3 mn in H1’2024, up from Kshs 647.9 mn in H1’2023. This growth was largely driven by a 142.1% rise in the net operating income of Acorn I-REIT, which increased to Kshs 309.9 mn from Kshs 128.0 mn in H1’2023. Additionally, Laptrust I-REIT reported a notable NOI growth of 63.0%, reaching to Kshs 162.4 mn from Kshs 99.6 in similar period in 2023, further contributing to the overall positive performance. Acorn D-REIT’s NOI saw the largest drop, falling by 22.2% to Kshs 250.2 mn from Kshs 334.2 mn in H1’2023
- Combined Funds from Operations (FFO) of Kenyan REITs increased by 24.7% in H1’2024, increasing to Kshs 835.3 mn from Kshs 669.7 mn in H1’2023. Similarly, Adjusted FFOs for Kenyan REITs increased by 25.2%, reaching Kshs 836.6 mn in H1’2024 from Kshs 668.1 mn in H1’2023. This increase was largely due to significant increases in NOIs except for Acorn D-REIT which recorded a decrease of 22.2% during the period,
- The REITs combined Cash amounts available for paying dividends to REIT investors which we measured using the Cash Available for Distribution (CAD) metric increased by 47.7% in H1’2024 to Kshs 411.3 mn from Kshs 278.5 mn in H1’2023. The performance was propelled by Laptrust Imara I-REIT’s distributable earnings which increased by 30.4% to come in at Kshs 129.9 mn from Kshs 99.6 mn during the same period last year. Additionally, Acorn D-REIT distributed earnings stood at 123.6 mn which was an improvement from the nil earnings recorded in H1’2023,
- Notably, the REIT managers of all four REITs recommended provisional dividends. For Laptrust Imara I-REIT, the REIT Manager suggested a first dividend distribution of Kshs 129.9 mn, amounting to Kshs 0.38 per unit, which was approved by the Trustee for the H1’2024, ILAM Fahari I-REIT’s manager proposed a first and final dividend of Kshs 0.3 per unit, making Kshs 53.83 mn available for distribution out of Kshs 181.0 mn. Acorn I-REIT increased its total distribution for the year to Kshs 104.0 mn, translating to Kshs 0.3 per unit, marking a 12.0 % rise from the Kshs 92.8 mn distributed in H1’2023. Acorn D-REIT recommended a distribution of Kshs 181.0 mn, equivalent to Kshs 0.7 per unit, which was an improvement from the nil distribution in H1’2023, and,
- The combined Net Asset Values (NAV) for Kenyan REITs increased by 4.5% to reach an all-time high of Kshs 24,367.1 mn in H1’2024, up from Kshs 23,306.6 mn in H1’2023. This growth was driven by a 17.2% increase in the NAV of Acorn I-REIT, reaching Kshs 7,435.4 mn from Kshs 6,341.9 mn in H1’2023, and a 3.1% rise in the NAV of Acorn D-REIT, which grew to Kshs 6,749.5 mn in H1’2024 from Kshs 6,547.7 mn in H1’2023, respectively.
The table below makes a comparison of the leverage and liquidity ratios of all four Kenyan REITs during H1’2024 and H1’2023;
|
Cytonn Report: Leverage & Liquidity Ratios of Kenyan REITs |
||||||||||||||||
|
|
Laptrust Imara I-REIT |
ILAM Fahari I-REIT |
Acorn I-REIT |
Acorn D-REIT |
H1’2023* |
H1’2024** |
y/y change |
|
||||||||
|
H1'2023 |
H1’2024 |
H1’2023 |
H1’2024 |
y/y Change |
H1’2023 |
H1’2024 |
y/y Change |
H1’2023 |
H1’2024 |
y/y Change |
|
|||||
|
Leverage Ratios |
||||||||||||||||
|
Debt to Equity Ratios |
0.0x |
0.0x |
0.0x |
0.0x |
0.0% |
0.0x |
0.0x |
0.0% |
0.6x |
0.3x |
(55.0%) |
0.2x |
0.1x |
(10.4%) |
|
|
|
Debt to Total Market Cap Ratio |
0.0% |
0.0x |
0.0% |
0.0% |
0.0% |
0.0% |
0.0% |
0.0% |
64.0% |
28.0% |
(56.2%) |
29.7% |
8.1% |
(21.7%) |
|
|
|
Debt to Gross Book Value Ratio |
0.0% |
0.0x |
0.0% |
0.0% |
0.0% |
0.0% |
0.0% |
0.0% |
35.1% |
14.6 % |
(58.4%) |
16.3% |
4.2% |
(12.1%) |
|
|
|
Debt to EBITDA Multiple |
0.0x |
0.0x |
0.0x |
0.0x |
0.0% |
0.0x |
0.0x |
0.0% |
11.8x |
7.0x |
(40.4%) |
5.5x |
2.0x |
(63.2%) |
|
|
|
Liquidity Ratios |
|
|||||||||||||||
|
Debt Service Coverage Ratio |
- |
|
- |
- |
- |
- |
- |
- |
8.1% |
14.2% |
6.1% |
2.5% |
4.1% |
1.6% |
|
|
|
Implied Capitalization Rate |
0.0% |
2.4% |
12.3% |
3.3% |
(72.8%) |
0.0% |
3.0% |
53.9% |
3.2% |
2.4% |
(26.5%) |
2.2% |
2.7% |
(0.4%) |
|
|
|
*Market cap weighted as at 30/06/2023 **Market cap weighted as at 30/06/2024 |
||||||||||||||||
Source: Cytonn Research
Key takeaways from the table include;
- Majority of the REITs remained ungeared during H1’2024, with their leverage ratios remaining at zero except Acorn D-REIT. Acorn D-REIT debt ratios decreased in H1’2024 on account of a 53.6% decline in its long-term borrowings to Kshs 1.8 bn from Kshs 3.9 bn in H1’2023,
- Notably, Acorn D-REIT’s Debt to EBITDA Multiple reduced by 40.4% to 7.0x in H1’2024, from 11.8x recorded in H1’2023. This was on the back of a faster decline in the REIT’s long-term borrowings which outpaced the EBITDA’s decline. Acorn D-REIT EBITDA in H1’2024 decreased by 22.2% to Kshs 260.1 mn from Kshs 334.2 mn in H1’2023, compared to a 53.6 % decrease in the REIT’s long-term debt, and,
- ILAM Fahari I-REIT traded at the highest implied capitalization rate of 3.3%, signifying a higher return on investment compared to other REITs. In contrast, Acorn D-REIT and Laptrust Imara I-REIT had the lowest implied capitalization rate of 2.4%. Despite this, we anticipate that Laptrust Imara I-REIT's performance will improve gradually, given that the REIT is still in its early years of operation.
The table below presents a summary of key valuation metrics of Kenyan REITs in H1’2024;
|
|
Cytonn Report: Valuation Metrics for Kenyan REITs |
|||||||||||||||
|
|
Laptrust Imara I-REIT |
|
ILAM Fahari I-REIT |
Acorn I-REIT |
Acorn D-REIT |
H1’2023 |
H1’2024 |
|
||||||||
|
|
H1'2023 |
H1’2024 |
y/y Change |
H1’2023 |
H1’2024 |
y/y Change |
H1’2023 |
H1’2024 |
y/y Change |
H1’2023 |
H1’2024 |
y/y Change |
y/y change |
|||
|
Price/ FFO per Share |
69.5x |
42.6x |
(38.6%) |
12.7x |
37.0x |
191.1% |
41.6x |
20.3x |
51.3% |
18.5x |
25.1x |
35.9% |
35.6X |
31.3X |
(12.2%) |
|
|
Dividend Yield
|
0.00% |
1.9% |
|
0.0% |
0.0% |
0.0% |
1.4% |
0.4% |
(0.9%) |
0.0% |
1.8% |
0.0% |
0.3% |
3.8% |
3.5% |
|
|
Dividend Coverage/ Payout Ratio |
100.0% |
80.0% |
(20%) |
0.0% |
0.0% |
0.0% |
93.7% |
10.6% |
(83.2%) |
0.0% |
69.7% |
0.0% |
48.4% |
40.1% |
(8.4%) |
|
|
Net Asset Value |
7,024.3 |
6,948.6 |
(1.1%) |
3,392.8 |
3233.6 |
(4.7%) |
6341.9 |
7,435.4 |
17.2% |
6,547.7 |
6,749.5 |
3.1% |
23,306.6 |
24,367.1 |
4.5% |
|
|
Net Asset Value per Share |
20.3 |
20.1 |
(1.1%) |
18.7 |
17.9 |
(4.7%) |
22.0 |
22.5 |
2.5% |
25.3 |
25.4 |
0.2% |
21.6 |
21.4 |
(0.6%) |
|
|
Annualized Dividend Yield |
0.0% |
3.8% |
0.0% |
0.0% |
0.0% |
0.0% |
2.7% |
0.9% |
(67.8%) |
0.0% |
3.6% |
0.0% |
0.7% |
2.1% |
1.4% |
|
Source: Cytonn Research
- Laptrust Imara I-REIT units are trading at a premium relative to its peers, with a Price to FFO per share multiple of Kshs 42.6, however this was a decrease of 38.6% from Kshs 69.5 price per FFO per share multiple,
- Laptrust Imara I-REIT’s and Acorn D-REIT boasted the highest annualized dividend yield in H1’2024 at 3.8% and 3.6% respectively, surpassing ILAM Fahari I-REIT 0.0% and Acorn I-REIT’s 0.9%. On the payout side, Imara’s dividend payout was 80.0%, adhering to Kenya's REIT regulations that mandate distributing at least 80.0% of net profits after tax as dividends. Conversely, Acorn I-REIT and D-REIT had lower payouts of 10.6% and 69.7%, respectively, falling short of the regulatory threshold, and,
- Acorn D-REIT recorded the highest NAV per share at Kshs 25.4, a 0.2% increase from H1’2023’s NAV per share of Kshs 25.3. This is on the back of a faster growth in the number of shares, which increased by 2.9% to Kshs 266.2 mn from Kshs 258.7 mn in H1’2023; compared to a 6.6% growth in the Net Asset Value (NAV) to Kshs 6.6 bn from Kshs 6.2 mn. ILAM Fahari had the lowest NAV per share at Kshs 17.9, a 4.7% decline from 18.7 recorded in H1’2023. This is attributable to a 4.0% decrease in total assets to Kshs 3.4 bn from Kshs 3.5 bn in H1’2023.The chart below shows the comparison of REITS yield performance versus other assets.
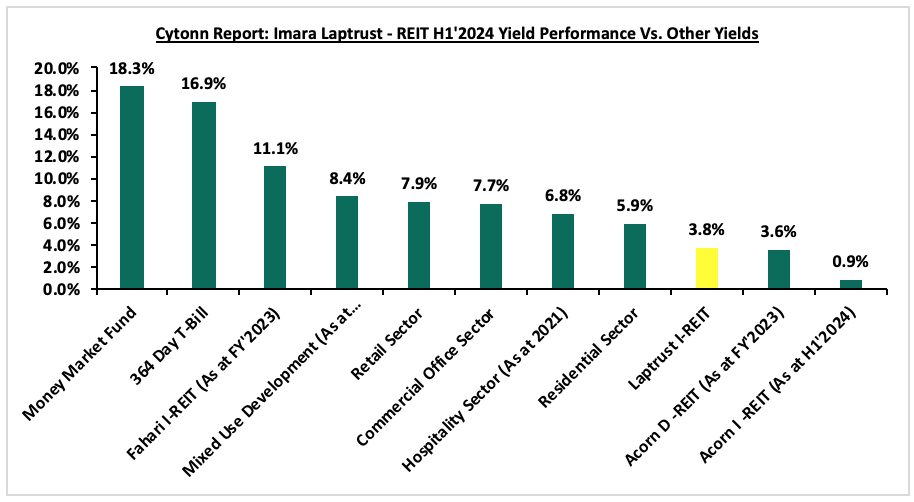
Section IV: Conclusion, Recommendations, and Outlook for the REITs Sector
Kenya's REITs market has seen moderate performance, shaped by various factors. Despite challenges, there are encouraging trends, such as growth in net operating incomes, indicating improved financial performance. Additionally, leverage ratios for most REITs have remained low, with many REITs being ungeared and relying on short-term debt for their operations to avoid overexposure to rising interest rates. This trend is expected to continue as REITs seek to maintain financial sustainability, as evidenced by Acorn Holdings' issuance of a green bond. Moreover, the recent regulatory proposal by the Capital Markets Authority (CMA) to reduce the minimum investment amounts for professional investors to Kshs 10,000 is anticipated to increase interest in the sector and attract a broader investor base.
Recommendations to Enhance the REITs Sector:
- Stakeholder Education: There is a need to educate all key stakeholders on the REIT structure. Implementing investor education and awareness campaigns is essential to inform potential investors about the benefits and risks associated with REIT investments. By improving investor knowledge and understanding, it is likely that more individuals will be encouraged to participate in the REIT market, thereby contributing to its growth and development,
- Expanding Legal Entities: In South Africa, the REITs' legal and operational framework allows different legal entities to establish REITs, unlike Kenya, where this is limited to trusts. In both Belgium and the United States, REIT formation permits flexibility in the choice of legal entities, contributing to the diversity and dynamism of the REIT market. Belgium allows various legal structures, including public limited companies, limited liability companies, and cooperative companies, tailored to different investor preferences and business models. Similarly, in the US, REITs can be structured as corporations, trusts, or associations, providing versatility in organizational structures. To enhance the Kenyan REIT market, it is prudent to introduce similar flexibility. By expanding the range of permissible structures beyond traditional trust-based models to include corporations, partnerships, and limited liability companies, Kenya can better accommodate diverse investor needs and facilitate easier entry into the REIT market. This diversification would promote a more robust and dynamic REIT sector, catering to different organizational preferences,
- Streamlined Approval Process: To improve the efficiency of Real Estate Investment Trusts (REITs) approval, it is recommended to consolidate the approval structure into a single agency, instead of the current two (CMA and KRA). Merging the approval process under one agency would eliminate the need to navigate through two separate entities for REITs approval. This consolidation would streamline the process, enhancing efficiency, reducing costs, and improving transparency and accountability,
- Introduce Hybrid REIT Vehicles: Currently, investors have to subscribe to both of the separate REIT classes, forcing them to pay duplicate costs, due to the nature of exclusivity of the two. A hybrid REIT would provide investors integrated returns, by combining the higher return from development while reducing risk exposure through the relatively stable income component of the I-REIT. In addition, an IPO with such a hybrid REIT vehicle would eliminate the duplicated costs of running two separate REITs, thereby improving subscriptions by investors. Introducing a hybrid REIT within a unified structure would thus enable investors to capitalize on the strengths of both investment types, potentially leading to more balanced risk-reward profiles,
- Flexibility in Listing: Acknowledging the apprehensions of companies regarding an immediate shift to public listing, we propose a gradual, phased strategy. Providing REITs with an initial period of private operation before mandating public listing would facilitate a smoother transition and align with the comfort levels of corporate entities. Belgium's stipulation of ensuring 30.0% of shares held by the public strikes a balance between public ownership and flexibility for REIT promoters. Kenya could adopt a similar approach to encourage broader investor participation while ensuring sufficient liquidity in the market. Moreover, Kenya could follow the example of the United States by offering flexibility in listing options for REITs. Granting REITs the autonomy to choose between going public or remaining private offers increased flexibility to accommodate diverse investor preferences and business models. By accommodating both publicly listed and privately held REITs, Kenya can promote inclusivity in the market and cater to the needs of a wide range of investors, thereby bolstering the vibrancy and liquidity of the REIT market. This approach creates a favorable environment for REITs to thrive while addressing concerns related to the transition to public listing,
- Lower Capital Requirement for Trustees: We propose a reduction in the minimum capital requirement, presently set at Kshs 100.0 mn, as this financial threshold practically currently limits trusteeship options solely to banking institutions. Currently, four banks are registered as REIT Trustees, including Kenya Commercial Bank (KCB), Co-operative Bank (Coop), Housing Finance Bank, and NCBA Bank Kenya. We suggest lowering the minimum to Kshs 10.0 mn to align with the minimum required for a Pension Fund Trustee. This adjustment would expand the pool of potential Trustees available to REIT Managers,
- Introduce Tokenization of REITs: Introducing the concept of tokenization for REITs presents an innovative solution and has the potential to amplify market participation. This would facilitate the ownership of REIT units in smaller denominations, even as low as Kshs 100.0 and,
- Diminishing Entry Barriers: Reconsideration of the steep Kshs 5.0 mn minimum for D-REITs is vital to eliminate entry barriers that inadvertently limit individual market entry. A revised minimum could promote a more inclusive investment landscape.
The outlook for Kenya's REITs sector remains cautiously optimistic. While challenges such as high construction costs and market saturation in certain areas persist, the continued government support through infrastructure development and affordable housing initiatives provides a positive backdrop. Investors are expected to remain focused on income-generating REITs, particularly those tied to resilient sectors like retail and commercial properties. The sector's growth will likely hinge on increased investor awareness and the broadening of investment options within the REITs market.
To read the full Cytonn Kenya’s REITs H1’2024 Report, click here.
Disclaimer: The views expressed in this publication are those of the writers where particulars are not warranted. This publication, which is in compliance with Section 2 of the Capital Markets Authority Act Cap 485A, is meant for general information only and is not a warranty, representation, advice, or solicitation of any nature. Readers are advised in all circumstances to seek the advice of a registered investment advisor.

- Talk to us
- Kenya
- P.O Box 20695 - 00200, Nairobi, Kenya
- Cell +254709101200
- Tel +254709101200
- WhatsApp +254741676635
- United States
- +254709101200
- DOWNLOAD OUR APP
-


- Kenya
- 8th Floor, Pinetree Plaza, Kaburu Drive, Ngong Road, Nairobi, Kenya
- USA
- Suite 1150, 1775 Eye Street NW, USA, Washington DC 20006, USA
- Investments
- High Yield
- Private Equity
- Real Estate
- Real Estate
- RiverRun Estates
- Cytonn Towers
- The Ridge
- Taraji Heights
- The Alma