Kenya’s Real Estate Investment Trusts (REITs) FY’ 2025 Report & Cytonn Weekly #14/2026
By research team, Apr 12, 2026
Executive Summary
Fixed Income
During the week, T-bills were oversubscribed for the first time in three weeks, with the overall subscription rate coming in at 102.3%, higher than the subscription rate of 70.8% recorded the previous week. Investors’ preference for the shorter 91-day paper persisted, with the paper receiving bids worth Kshs 8.0 bn against the offered Kshs 4.0 bn, translating to a subscription rate of 199.4%, significantly higher than the subscription rate of 30.1%, recorded the previous week. The subscription rate for the 182-day paper increased to 108.5% from 90.9% recorded the previous week, while that of the 364-day paper decreased to 57.2% from 67.1% recorded the previous week. The government accepted a total of Kshs 24.5 bn worth of bids out of Kshs 24.6 bn bids received, translating to an acceptance rate of 99.9%. The yields on the government papers recorded a mixed performance with the yields on the 364-day and 182-day papers decreasing by 0.8 bps and 0.1 bps to remain relatively unchanged from the 8.3% and 7.8% recorded the previous week respectively, while the yields on the 91-day paper remain unchanged from 7.4% recorded the previous week;
The Monetary Policy Committee met on April 8th, 2026, to review the outcome of its previous policy decisions and decided to maintain the CBR rate at 8.75% unchanged from February 2026. This was in line with our projection of MPC to maintain the CBR at 8.75%;
During the week, Stanbic Bank released its monthly Purchasing Manager’s Index (PMI), Kenya’s Purchasing Managers’ Index (PMI) stood at 47.7 in March 2026, falling below the 50.0 expansion threshold for the first time in seven months, and lower than 50.4 in February 2026 and the 55.0 peak recorded in November 2025, indicating that business activity deteriorated;
Equities
During the week, the equities markets were on an upward trajectory, with NSE 10, NSE 25, NASI, and NSE 20 gaining by 4.8%, 4.0%, 3.9% and 3.2% respectively, taking the YTD performance to gains of 14.3%, 12.2%, 10.5% and 9,9% for NSE 20, NSE 25, NASI and NSE 10 respectively. The equities market performance was mainly driven by gains recorded by large cap stocks such as Co-operative Bank, Equity, and Absa of 7.7%, 7.2% and 4.4% respectively. The banking sector index gained by 4.5% to 238.9 from 228.6 recorded the previous week. This is attributable to gains recorded by stocks such as Co-operative Bank, Equity, and Absa of 7.7%, 7.2% and 4.4% respectively;
During the week, Jubilee Holdings Limited released their FY’2025 results. Jubilee’s Profit After Tax (PAT) increased by 17.6% to Kshs 5.6 bn, from Kshs 4.7 bn recorded in FY’2024. The performance was mainly driven by a 16.5% increase in Insurance Services Revenues to Kshs 29.9 bn, from Kshs 25.7 bn in FY’2024, but was however weighed down by the 11.0% increase in Insurance Services Expenses to Kshs 26.9 bn in FY’2025, from Kshs 24.2 bn in FY’2024;
During the week, Zenith Bank completed the acquisition of 100% of Paramount Bank in a full takeover transaction aimed at expanding its footprint in East Africa’s mid-tier banking segment. The acquisition marks a significant consolidation move within Kenya’s banking sector as institutions continue to pursue scale, digital transformation, and balance sheet strength.
During the week, Centum Investment Company PLC announced the results of its share buyback programme of up to 10.0% of its issued and paid-up share capital, conducted through the Nairobi Securities Exchange (NSE) in accordance with the Companies Act, 2015. The programme, which commenced on 6 February 2023 and was later extended to 30 September 2024, was followed by a second phase that ran from 1 October 2024 to 31 March 2026 after receiving the necessary regulatory and shareholder approvals. The results were that the buyback was undersubscribed at 16.8%, with a total of 10,839,300 shares repurchased across both phases, largely under the first programme. Consequently, the company’s issued share capital declined, reducing the shares available for trading on the NSE from 655,592,414 to 644,753,114 ordinary shares.
Real Estate
During the week, the National Treasury announced plans to buy Jubilee Insurance Centre in Nairobi for Kshs 2.5 bn. The proposal has been approved by the National Assembly’s Budget and Appropriations Committee (BAC) as part of the FY’2025/26 Supplementary Budget I.;
During the week, W Hospitality Group released a 2025 Hotel Chain Development Pipelines in Africa report that indicated that the Hotel development in Nairobi has increased significantly, with international chains expanding their investment pipeline by 58.3% to reach 3,650 rooms currently under construction. This marks a strong rebound from last year, where only 2,306 rooms were in development, and reflects renewed investor interest in the city’s hospitality sector;
During the week, regional low-cost airline Jambojet announced plans to expand its network by launching flights to Entebbe and Dar es Salaam by March 2027, as part of a broader growth strategy. The airline, which currently operates an international route from Mombasa to Zanzibar, aims to rebuild and extend routes that were halted during Covid-19 disruptions;
During the week, Air France announced plans to introduce a larger aircraft on the Paris–Nairobi route from May. It will replace the Airbus A350 plane with a Boeing 777-200, raising seat capacity by about 12.0%. This change responds to growing demand on Paris-Nairobi route;
On the Unquoted Securities Platform, Acorn D-REIT and I-REIT traded at Kshs 27.4 and Kshs 23.2 per unit, respectively, as per the last updated data on 13th March 2026. Additionally, ILAM Fahari I-REIT traded at Kshs 11.0 per share as of 13th March 2026 representing a 45.0% loss from the Kshs 20.0 inception price;
Focus of the Week
Following the release of the FY’2025 results by three authorized Real Estate Investment Trusts (REITs) in Kenya, Cytonn Real Estate Research Team undertook an analysis of the financial performance of the REITs and identified the key factors that shaped the performance of the sector. The report will discuss the background and structure of REITs in Kenya, and assess the financial performance of the current REITs in the market during FY’2025 in terms of operational metrics, profitability metrics, leverage ratios, liquidity ratios and valuation metrics.
Investment Updates:
-
Weekly Rates: Cytonn Money Market Fund closed the week at a yield of 11.2% p.a. To invest, dial *809# or download the Cytonn App from Google Play store here or from the Appstore here;
-
We continue to offer Wealth Management Training every Tuesday, from 7:00 pm to 8:00 pm. The training aims to grow financial literacy among the general public. To register for any of our Wealth Management Trainings, click here;
-
If interested in our Private Wealth Management Training for your employees or investment group, please get in touch with us through wmt@cytonn.com;
-
Cytonn Insurance Agency acts as an intermediary for those looking to secure their assets and loved ones’ future through insurance namely; Motor, Medical, Life, Property, WIBA, Credit and Fire and Burglary insurance covers. For assistance, get in touch with us through insuranceagency@cytonn.com;
-
Cytonn Asset Managers Limited (CAML) continues to offer pension products to meet the needs of both individual clients who want to save for their retirement during their working years and Institutional clients that want to contribute on behalf of their employees to help them build their retirement pot. To more about our pension schemes, kindly get in touch with us through pensions@cytonn.com;
Hospitality Updates:
-
We currently have promotions for Staycations. Visit cysuites.com/offers for details or email us at sales@cysuites.com;
Money Markets, T-Bills Primary Auction:
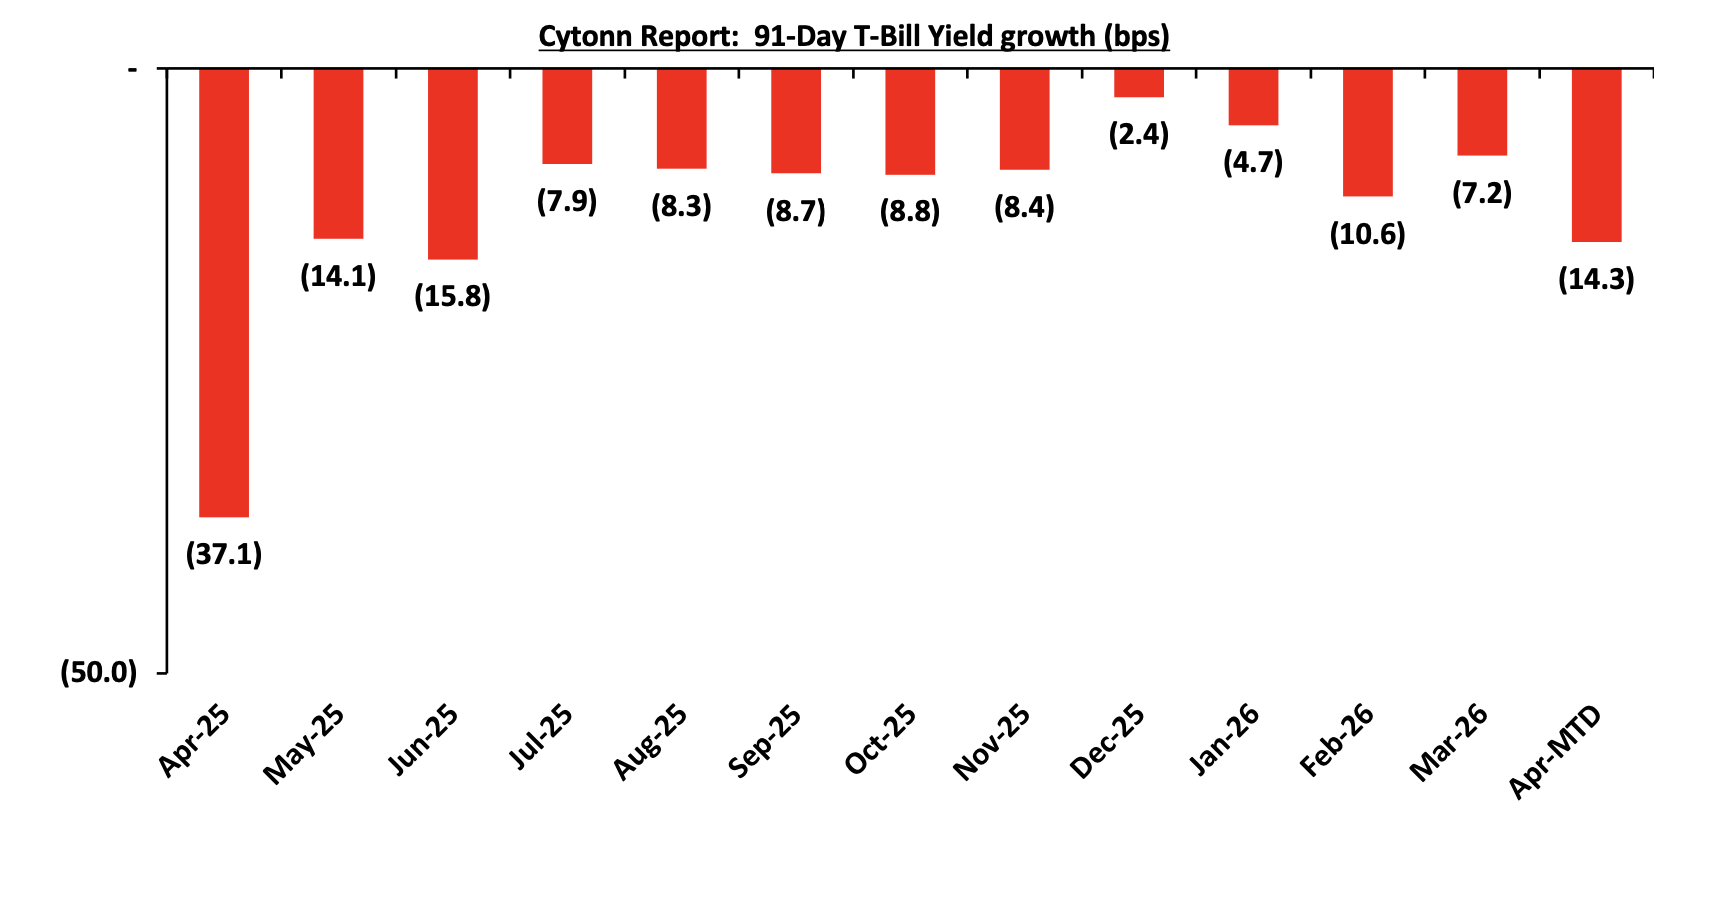
This week, T-bills were oversubscribed for the first time in three weeks, with the overall subscription rate coming in at 102.3%, higher than the subscription rate of 70.8% recorded the previous week. Investors’ preference for the shorter 91-day paper persisted, with the paper receiving bids worth Kshs 8.0 bn against the offered Kshs 4.0 bn, translating to a subscription rate of 199.4%, significantly higher than the subscription rate of 30.1%, recorded the previous week. The subscription rate for the 182-day paper increased to 108.5% from 90.9% recorded the previous week, while that of the 364-day paper decreased to 57.2% from 67.1% recorded the previous week. The government accepted a total of Kshs 24.5 bn worth of bids out of Kshs 24.6 bn bids received, translating to an acceptance rate of 99.9%. The yields on the government papers recorded a mixed performance with the yields on the 364-day and 182-day papers decreasing by 0.8 bps and 0.1 bps to remain relatively unchanged from the 8.3% and 7.8% recorded the previous week respectively, while the yields on the 91-day paper remain unchanged from 7.4% recorded the previous week. The chart below shows the yield growth rate for the 91-day paper from April 2025 to date:
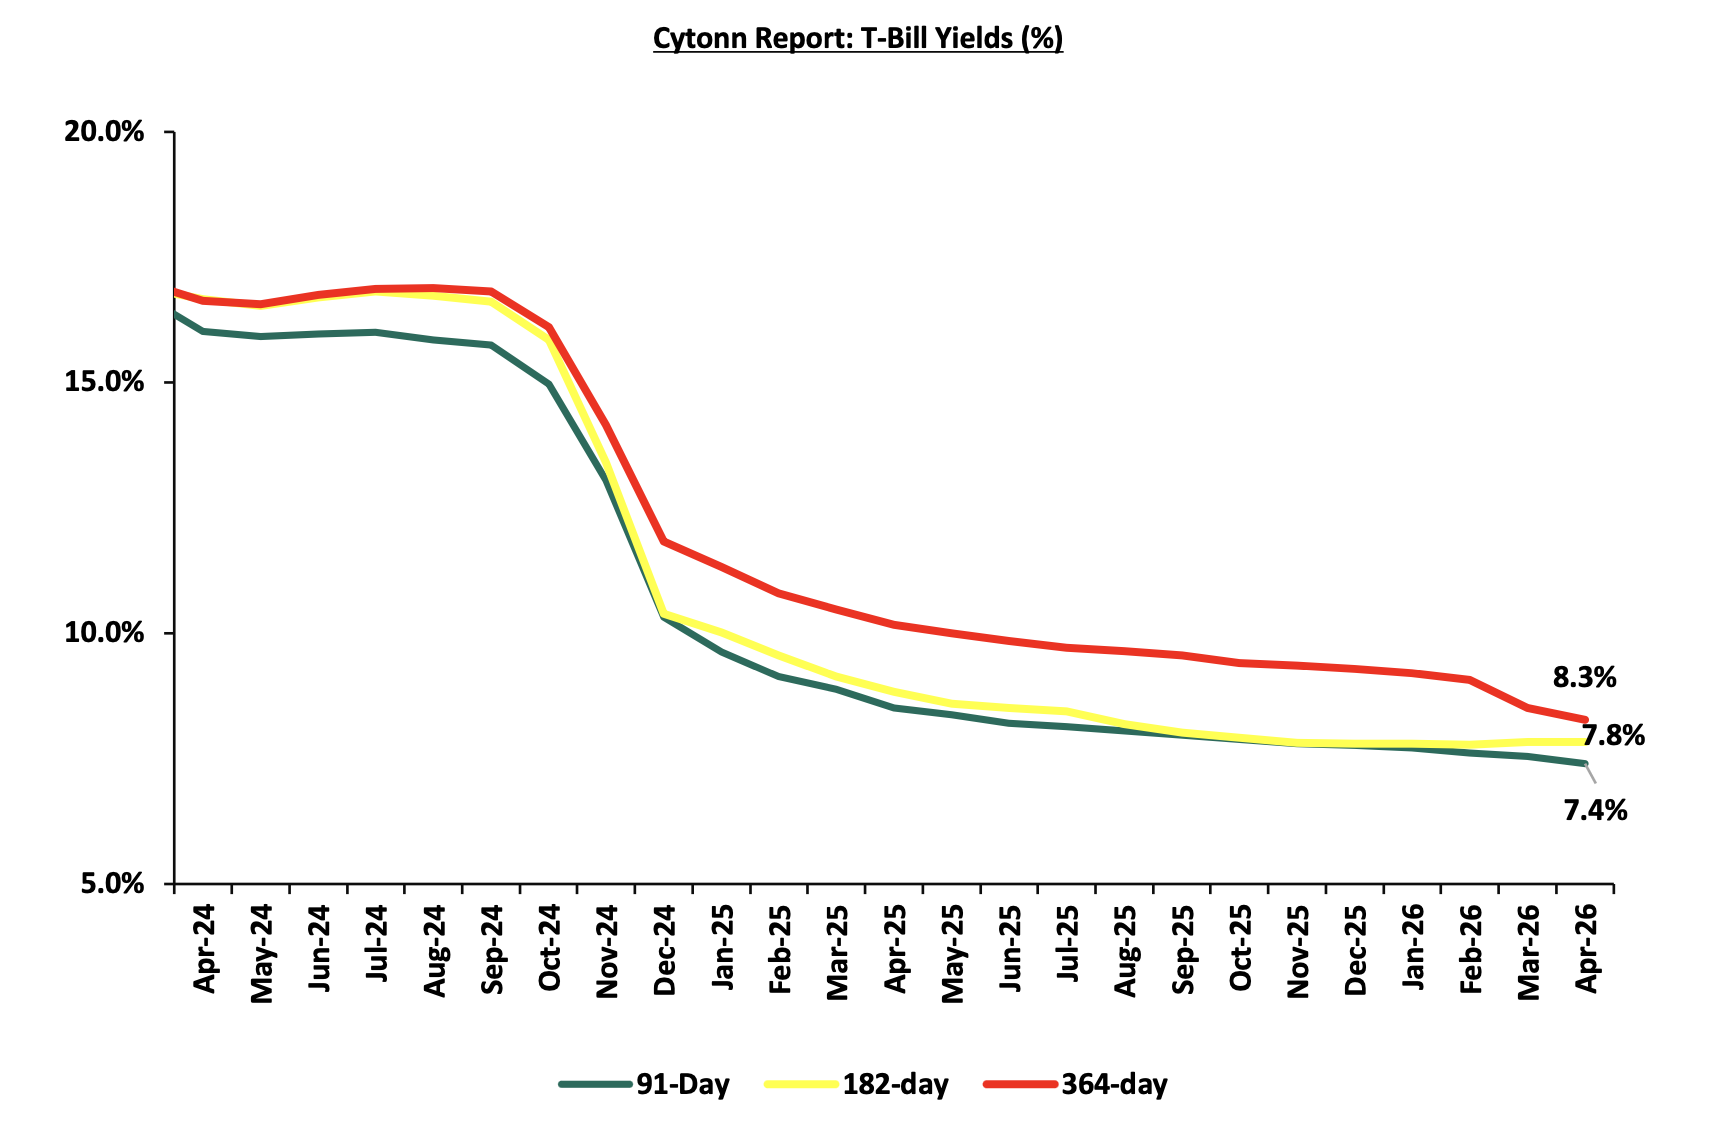
The chart below show the performance of the 91-day, 182-day and 364-day papers from April 2024 to April 2026:
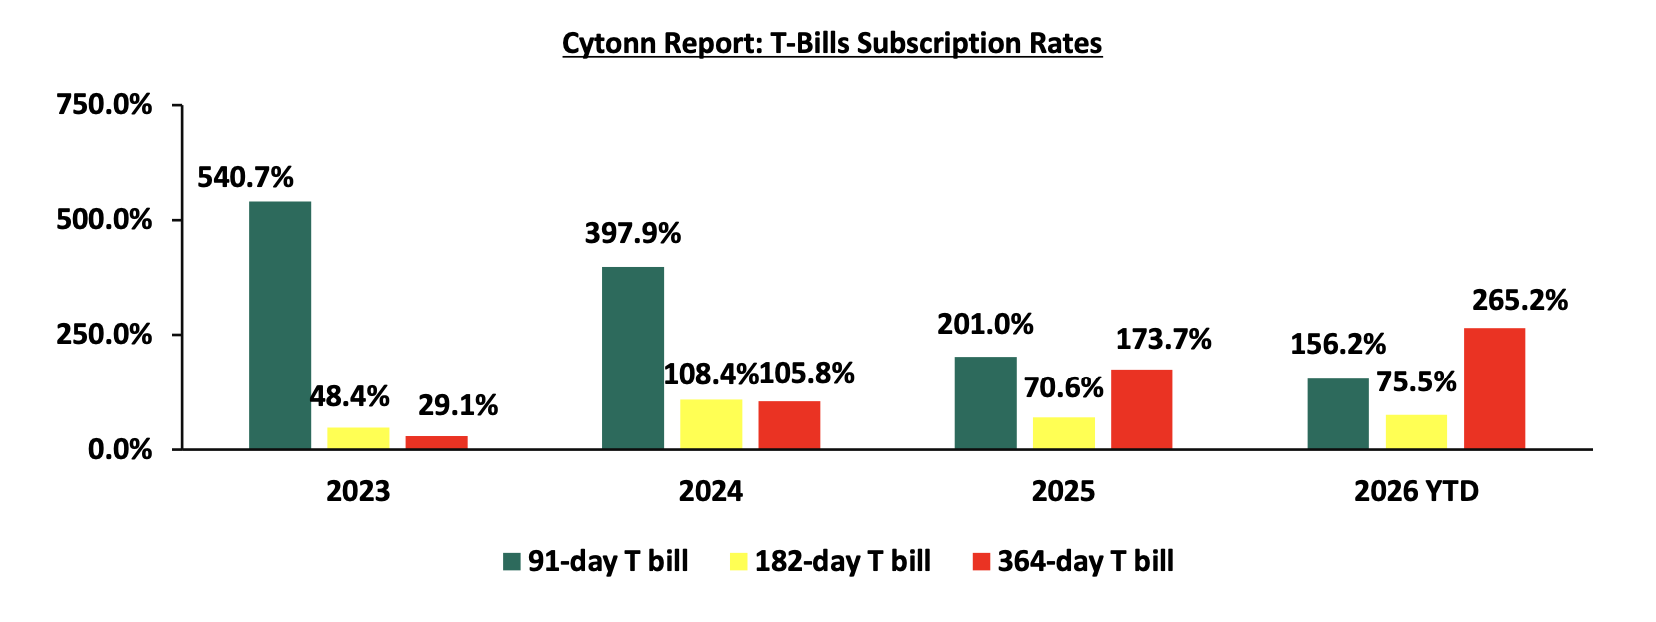
The chart below compares the overall average T-bill subscription rates obtained in 2023, 2024, 2025 and 2026 Year-to-date (YTD):
Money Market Performance:
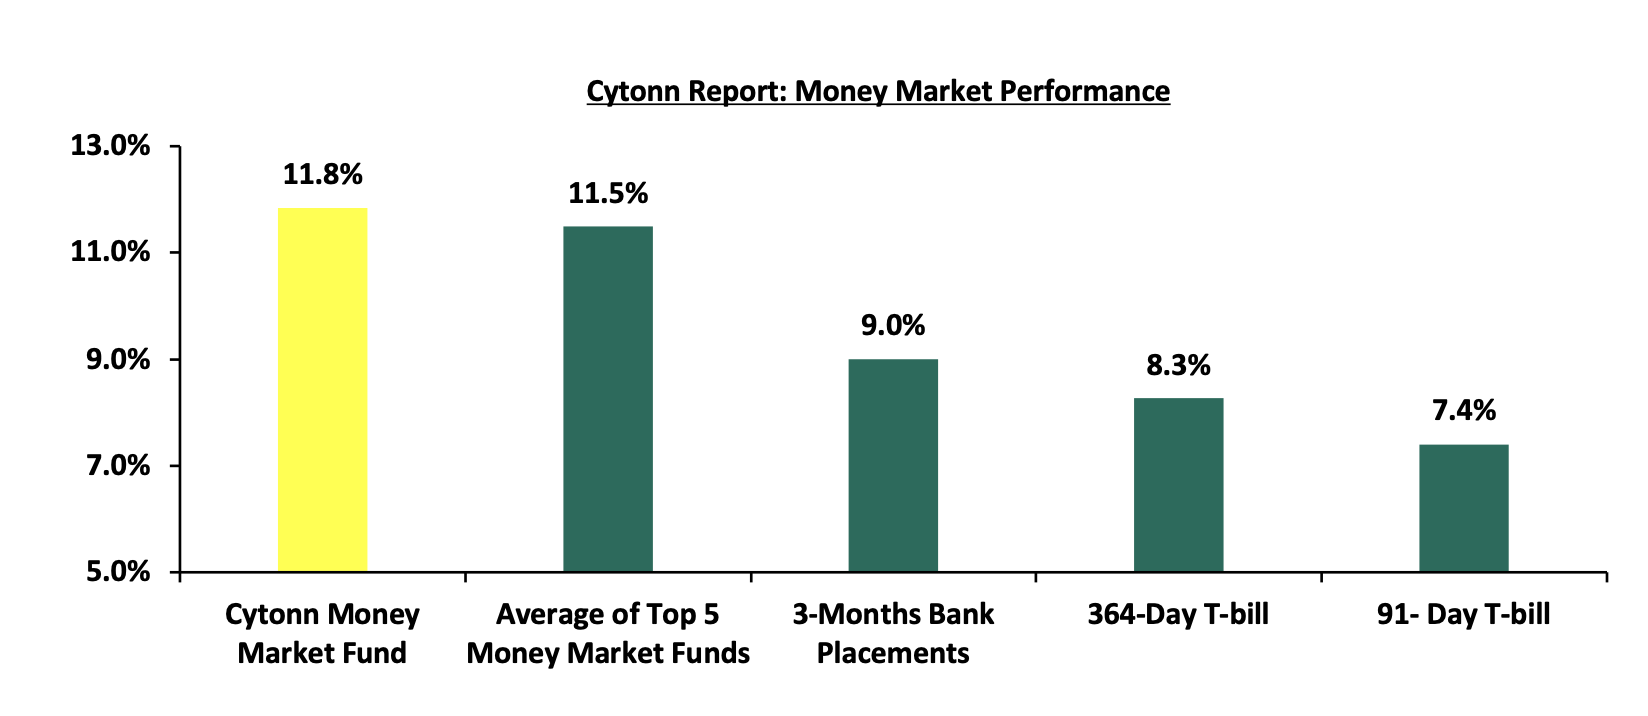
In the money markets, 3-month bank placements ended the week at 9.0% (based on rates offered by various banks). The yields on the government papers recorded a mixed performance with the yields on the 364-day decreasing by 0.8 bps to remain unchanged from 8.3% recorded the previous week, while the yields on the 91-day paper remain unchanged from 7.4% recorded the previous week. The yield on the Cytonn Money Market Fund increased by 9.0 bps to 11.2% from 11.1% recorded the previous week, while the average yields on the Top 5 Money Market Funds increased by 24.8 bps to 11.5% from 11.2% recorded the previous week.
The table below shows the Money Market Fund Yields for Kenyan Fund Managers as published on 10th April 2026:
|
Money Market Fund Yield for Fund Managers as published on 10th April 2026 |
||
|
Rank |
Fund Manager |
Effective Annual Rate |
|
1 |
Nabo Africa Money Market Fund |
12.9% |
|
2 |
Etica Money Market Fund |
11.8% |
|
3 |
Cytonn Money Market Fund (Dial *809# or download Cytonn App) |
11.2% |
|
4 |
Gulfcap Money Market Fund |
10.8% |
|
5 |
Jubilee Money Market Fund |
10.7% |
|
6 |
Enwealth Money Market Fund |
10.7% |
|
7 |
Arvocap Money Market Fund |
10.7% |
|
8 |
Lofty-Corban Money Market Fund |
10.6% |
|
9 |
Ndovu Money Market Fund |
10.5% |
|
10 |
Orient Kasha Money Market Fund |
10.4% |
|
11 |
Madison Money Market Fund |
10.3% |
|
12 |
Faulu Money Market Fund |
10.2% |
|
13 |
Kuza Money Market fund |
10.2% |
|
14 |
Old Mutual Money Market Fund |
10.1% |
|
15 |
British-American Money Market Fund |
9.5% |
|
16 |
GenAfrica Money Market Fund |
9.5% |
|
17 |
Dry Associates Money Market Fund |
9.4% |
|
18 |
SanlamAllianz Money Market Fund |
9.3% |
|
20 |
KCB Money Market Fund |
9.0% |
|
21 |
Genghis Money Market Fund |
8.8% |
|
22 |
Apollo Money Market Fund |
8.5% |
|
23 |
CIC Money Market Fund |
8.4% |
|
24 |
ICEA Lion Money Market Fund |
8.3% |
|
25 |
Co-op Money Market Fund |
8.2% |
|
26 |
CPF Money Market Fund |
8.2% |
|
27 |
Mali Money Market Fund |
8.0% |
|
28 |
Absa Shilling Money Market Fund |
7.3% |
|
29 |
Mayfair Money Market Fund |
6.9% |
|
30 |
Ziidi Money Market Fund |
6.0% |
|
31 |
AA Kenya Shillings Fund |
5.9% |
|
32 |
Stanbic Money Market Fund |
4.5% |
|
33 |
Equity Money Market Fund |
4.4% |
Source: Business Daily
Liquidity:
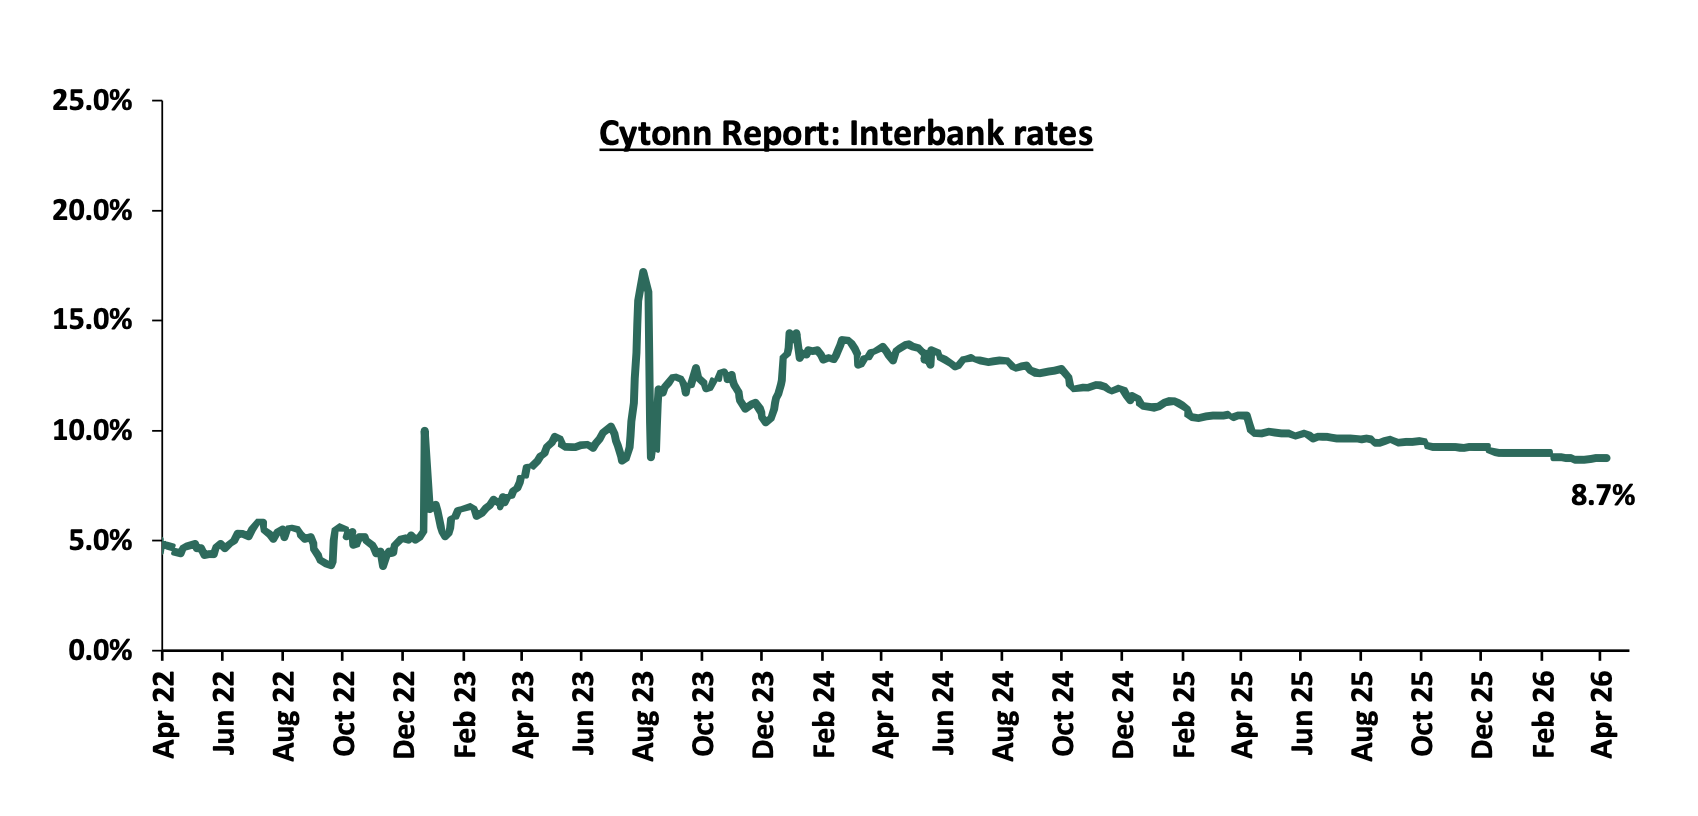
During the week, liquidity in the money markets tightened with the average interbank rate increasing by 0.9 bps to 8.8% from 8.7% in comparison to last week, partly attributable to tax remittances that offset government payments. The average interbank volumes traded decreased by 25.0% to Kshs 14.0 bn from Kshs 18.7 bn recorded the previous week. The chart below shows the interbank rates in the market over the years:
Kenya Eurobonds:
During the week, the yields on the Eurobonds were on a downward trajectory with the yield on the 13-year Eurobond issued in 2021, decreasing the most by 73.0 bps to 8.7% from 9.4% recorded the previous week. The table below shows the summary performance of the Kenyan Eurobonds as of 9th April 2026;
|
Cytonn Report: Kenya Eurobonds Performance |
||||||
|
|
2018 |
2019 |
2021 |
2024 |
||
|
Tenor |
10-year issue |
30-year issue |
12-year issue |
13-year issue |
7-year issue |
|
|
Amount Issued (USD) |
1.0 bn |
1.0 bn |
1.0 bn |
1.5 bn |
1.5 bn |
|
|
Years to Maturity |
2.5 |
22.5 |
8.8 |
5.5 |
10.5 |
|
|
Yields at Issue |
7.3% |
8.3% |
6.2% |
10.4% |
9.9% |
|
|
2-Jan-26 |
6.1% |
8.8% |
7.2% |
7.8% |
7.1% |
|
|
1-Apr-26 |
7.6% |
9.5% |
8.7% |
9.2% |
8.8% |
|
|
2-Apr-26 |
7.8% |
9.6% |
9.0% |
9.4% |
9.0% |
|
|
3-Apr-26 |
7.8% |
9.6% |
8.9% |
9.3% |
8.9% |
|
|
6-Apr-26 |
7.8% |
9.6% |
8.9% |
9.3% |
8.9% |
|
|
7-Apr-26 |
7.8% |
9.6% |
9.0% |
9.3% |
8.9% |
|
|
8-Apr-26 |
7.4% |
9.1% |
8.4% |
8.7% |
8.5% |
|
|
9-Apr-26 |
7.5% |
9.2% |
8.3% |
8.7% |
8.5% |
|
|
Weekly Change |
(0.3%) |
(0.5%) |
(0.7%) |
(0.7%) |
(0.5%) |
|
|
MTD Change |
(0.1%) |
(0.3%) |
(0.4%) |
(0.6%) |
(0.3%) |
|
|
YTD Change |
1.5% |
0.3% |
1.8% |
1.5% |
1.8% |
|
Source: Central Bank of Kenya (CBK) and National Treasury
Kenya Shilling:
During the week, the Kenya Shilling appreciated by 64.6 bps against the US Dollar, to Kshs 129.2 from the Kshs 130.0 recorded the previous week. On a year-to-date basis, the shilling has depreciated by 7.7 bps against the dollar, as compared to the 22.9 bps appreciation recorded in 2025.
We expect the shilling to be supported by:
-
Diaspora remittances standing at a cumulative USD 5,051.2 mn in the twelve months to February 2026, 1.9% higher than the USD 4,956.5 mn recorded over the same period in 2025. These have continued to cushion the shilling against further depreciation. In the February 2026 diaspora remittances figures, North America remained the largest source of remittances to Kenya accounting for 54.2% in the period, and,
-
Tourism inflows, which strengthened significantly. Tourism receipts reached Kshs 560.0 bn in 2025, up from Kshs 452.2 bn in 2024, representing a 23.9% increase, supported by improved international arrivals through the country’s major airports, and,
-
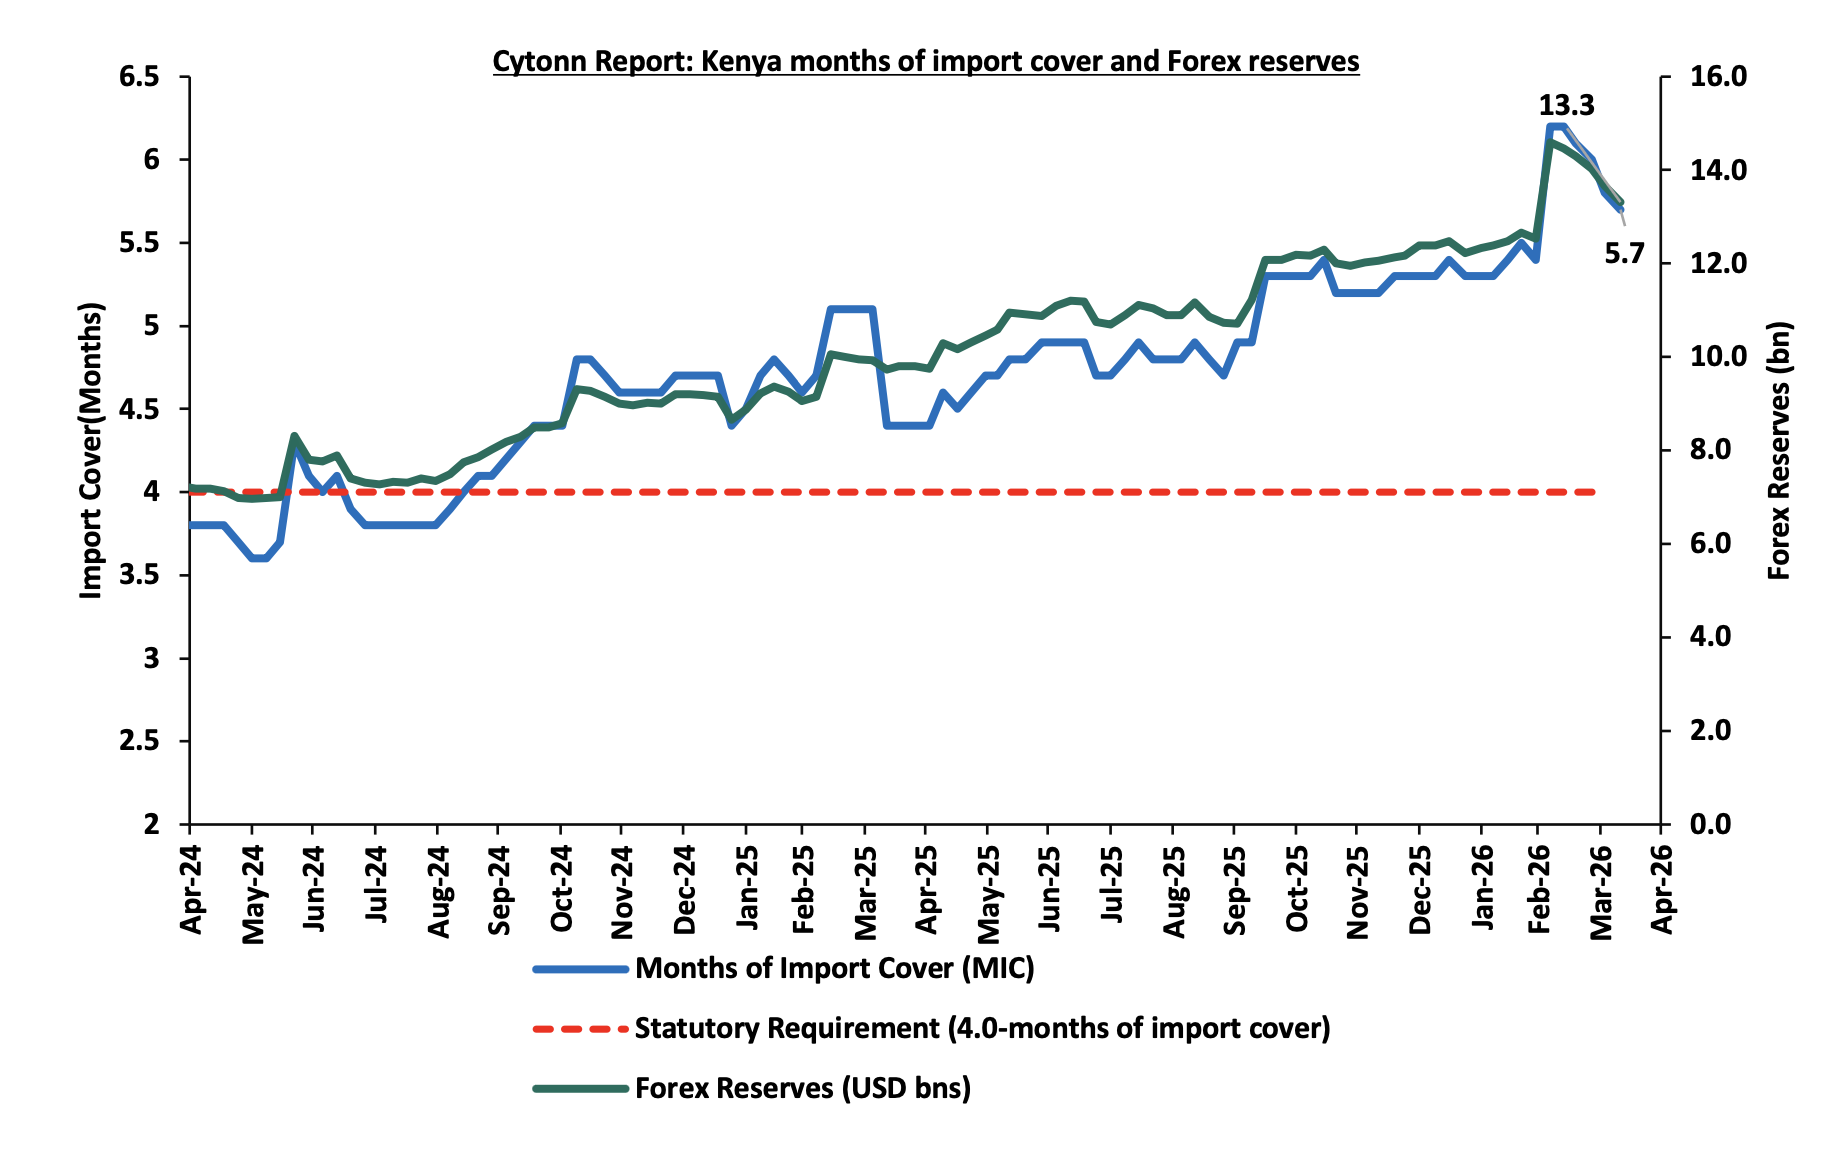
Improved forex reserves currently at USD 13.3 bn (equivalent to 5.7-months of import cover), which is above the statutory requirement of maintaining at least 4.0-months of import cover and above the EAC region’s convergence criteria of 4.5-months of import cover.
The shilling is however expected to remain under pressure in 2026 as a result of:
-
An ever-present current account deficit which came at 2.2% of GDP in the twelve months to October 2025, and,
-
The need for government debt servicing, continues to put pressure on forex reserves given that 52.0% of Kenya’s external debt is US Dollar-denominated as of September 2025.
-
Rising geopolitical tensions in the Middle East, which could exert pressure on the shilling through higher global oil prices and increased uncertainty in international markets. Given that Kenya is a net importer of petroleum products, any sustained increase in oil prices would widen the import bill, increase demand for US Dollars, and consequently put depreciation pressure on the shilling.
Kenya’s forex reserves decreased by 2.5% during the week to USD 13.3 bn from the USD 13.7 bn recorded the previous week, equivalent to 5.7 months of import cover, and above the statutory requirement of maintaining at least 4.0-months of import cover.
The chart below summarizes the evolution of Kenya's months of import cover over the years:
Weekly Highlights
-
April 2026 Monetary Policy Committee (MPC) Meeting Highlight
The Monetary Policy Committee met on April 8th, 2026, to review the outcome of its previous policy decisions and decided to maintain the CBR rate at 8.75%, to remain unchanged from February 2026 which was in line with our projection of MPC to maintain the CBR at 8.75%. Notably, inflation rates remain anchored and remained within the CBK preferred range of 2.5%-7.5% for the thirty second consecutive month, with an increase of 0.1% points to 4.4% in March 2026, from 4.3% in February 2026. Key to note, the MPC had cut the CBR rate to 8.75% in the previous meeting in February 2026 from 9.00% in December 2025. Below are some of the key highlights from the April meeting:
-
The overall inflation increased by 0.1% points to 4.4% in March 2026, from 4.3% in February 2026, remaining below the 5% mid-point of the preferred CBK range of 2.5%-7.5%. Core inflation decreased to 2.1% in February and March 2026, from 2.2% in January 2026 supported by lower prices of some processed food items, particularly sugar and maize flour. However, non-core inflation increased to 10.8% in March 2026, from 10.1% in February 2026, driven by higher prices of some vegetables, particularly tomatoes and irish potatoes. Overall inflation is expected to remain within the target range in the near term, supported by appropriate monetary policy actions, expected stability in food prices attributable to favorable weather conditions and continued exchange rate stability.
-
The performance of the Kenyan economy remained resilient in 2025, with real GDP growth estimated at 5.0%, as compared to 4.7% in 2024 supported by a rebound of the industrial sector, resilience of the service sectors and stable agriculture sector growth. Leading indicators of economic activity point to improved performance in the first quarter of 2026. The growth of the economy is projected at 5.3% compared to the previous projection of 5.5% mainly reflecting the emerging risks of the conflict in the Middle East on the performance of some key sectors of the This outlook is subject to risks, particularly a prolonged conflict in the Middle East and elevated trade policy uncertainties.
-
The current account deficit is estimated at 2.4% in the 12 months to February 2026 as compared to the 1.3% in the same period in 2025, due to a higher trade deficit and lower secondary income transfers as a share of GDP. Goods exports increased by 8.1%, driven by horticulture, tea, coffee, food and live animals, and machinery and transport equipment. Goods imports rose by 10.4%, reflecting increases in intermediate and capital goods imports. Services receipts decreased by 0.5%, due to lower receipts from travel services, while diaspora remittances increased by 1.9%. The current account deficit is projected at 3.0% of GDP in 2026 compared to the previous projection of 2.2%, reflecting the emerging risks of the Middle East, including higher international oil prices, lower receipts from services, slower growth in remittance inflows and reduced exports. Currently, the CBK foreign exchange reserves stand at USD 13,354 mn (5.7 months of import cover) and continue to provide adequate cover and a buffer against short-term domestic and external shocks.
-
The banking sector remains stable and resilient, with strong liquidity and capital adequacy ratios. The ratio of gross non-performing loans (NPLs) to gross loans stood at 15.6% in March 2026 compared to 15.4% in December 2025, and 17.6% in August 2025. Increases in NPLs were noted in the personal and household, trade, agriculture, and manufacturing sectors. Banks have continued to make adequate provisions for the NPLs.
-
The CEOs Survey and Market Perceptions Survey conducted in March 2026 revealed sustained optimism about business activity and economic growth prospects for the next 12 months. The optimism was attributed to the stable macroeconomic environment with low inflation and stable exchange rate, lower interest rates, expected favourable weather conditions which are expected to support agriculture, increased infrastructure spending, increased digital innovations, and improved private sector credit growth. Nevertheless, respondents expressed concerns about increased global uncertainties attributed to the conflict in the Middle East, high cost of doing business, and low consumer demand
-
Respondents to the March 2026 Agriculture Sector Survey expect stable food prices attributed to favourable weather conditions, and stability in exchange rate, to contribute to a stable inflation rate in the near term. A majority of respondents to the February Survey had expected inflation to decline or remain unchanged on account of lower food prices due to favourable weather conditions. These expectations changed in the March Survey with most respondents expecting some upward pressure on inflation due to higher international oil prices attributed to the conflict in the Middle East.
-
The conflict in the Middle East has disrupted global supply chains, leading to significantly higher energy prices and heightened risks to the global economic outlook. Prior to the conflict, global growth was projected to remain steady at 3.3 %in 2026, but is now expected to moderate due to effects of higher inflation and reduced demand arising from the higher energy prices and elevated uncertainties. Additionally, elevated trade policy uncertainty and the Russia-Ukraine conflict remain key risks to growth.
-
Global inflation is expected to increase in 2026 on account of higher energy prices and fertiliser costs attributed to the supply disruptions from the conflict. Inflation rates in the major economies have remained above target due to the stickiness in core inflation, and the recent increase in energy prices. Central banks in the major economies have kept their policy rates unchanged as they assess the impact of the conflict on their inflation and growth outlooks. International oil prices have risen sharply and remained volatile due to supply chain disruptions and elevated uncertainties attributed to the conflict. Food inflation has increased modestly, mainly driven by higher inflation rates for edible oils and cereals prices.
-
The MPC noted that the revised banking sector Risk-Based Credit Pricing Model (RBCPM), which was fully implemented by March 2026, will improve the transmission of monetary policy decisions to commercial banks’ lending interest rates, and enhance transparency in the pricing of loans by banks.
-
Growth in commercial banks’ lending to the private sector continued to improve and stood at 8.1% in March 2026 compared to 7.4% in February 2026 and (2.9%) in January 2025. Growth in credit to key sectors of the economy, particularly building and construction, trade, agriculture and consumer durables, remained strong, reflecting improved demand for credit in line with the declining lending interest rates. Average commercial banks’ lending rates stood at 14.7% in March 2026, down from 14.8% in February 2026 and 17.2% in November 2024.

-
The Committee noted the ongoing implementation of the FY’2025/26 Government Budget, and the planned fiscal consolidation strategy to reduce debt vulnerabilities over the medium term.
The MPC noted that maintaining the Central Bank Rate (CBR) at 8.75% remains appropriate to keep inflation expectations anchored within the target range of 2.5%-7.5% and support exchange rate stability. The Committee also observed that recent increases in international oil prices, largely driven by geopolitical tensions in the Middle East, could pose upside risks to inflation through potential second-round effects. Additionally, the MPC noted that prevailing global and domestic economic conditions warrant continued vigilance to safeguard macroeconomic stability. The Committee emphasized that it will closely monitor the impact of this policy stance, developments related to the Middle East conflict, and broader economic trends, and remains ready to take further action as necessary in line with its mandate. Going forward, we expect the MPC to adopt a more cautious approach to rate adjustments in the coming meetings in a bid to anchoring inflation, supporting exchange rate stability and private sector credit growth, while monitoing the effects of the Middle East conflict. The next MPC meeting is scheduled for June 2026.
-
Stanbic Bank’s March 2026 Purchasing Manager’s Index (PMI)
During the week, Stanbic Bank released its monthly Purchasing Manager’s Index (PMI). Kenya’s Purchasing Managers’ Index (PMI) stood at 47.7 in March 2026, falling below the 50.0 expansion threshold for the first time in seven months, and lower than 50.4 in February 2026 and the 55.0 peak recorded in November 2025, indicating that business activity deteriorated. The deterioration was mainly attributable to the decline in both output and new orders, with firms pointing to constrained customer spending, reduced cash circulations and tighter household budget highlighting that the decline was mainly demand-led. At the same time, the Middle Eastern war led to cautious spending among some firms as well as logistics constraints to customer delivery and higher prices for fuel and transport. Kenyan firms trimmed inventories in March to manage cash flow, avoid excess stock, and adjust to slowing demand, while employment growth weakened to its slowest pace since October 2025 due to a notable decline in outstanding business.
The chart shows Kenya's Purchasing Manager's Index for the last 24 Months. Readings above 50.0 signal an improvement in business conditions on the previous month, while readings below 50.0 show a deterioration:

Going forward, the business environment is expected to remain supportive in the short to medium term, supported by plans to expand operations through new branches, increased marketing and online presence, broader product and service offerings, and continued investment in capacity and human capital. However, rising input costs driven by higher operating expenses and tax pressures, combined with subdued consumer purchasing power, are expected to weigh on business profitability and overall growth. In addition, ongoing geopolitical tensions in the Middle East have contributed to volatility in global oil markets, pushing up crude oil and fuel prices. The resulting increase in petrol prices is likely to further elevate transport and production costs, adding inflationary pressure on businesses and households.
Rates in the Fixed Income market have been on a downward trend due to high liquidity in the money market which allowed the government to front load most of its borrowing. The government is 99.4% ahead of its prorated net domestic borrowing target of Kshs 634.8 bn, having a net borrowing position of Kshs 994.7 bn (inclusive of T-bills). However, we expect a stabilization of the yield curve in the short and medium term, with the government looking to increase its external borrowing to maintain the fiscal surplus, hence alleviating pressure in the domestic market. As such, we expect the yield curve to stabilize in the short to medium-term and hence investors are expected to shift towards the long-term papers to lock in the high returns
Market Performance:
During the week, the equities markets were on an upward trajectory, with NSE 10, NSE 25, NASI, and NSE 20 gaining by 4.8%, 4.0%, 3.9% and 3.2% respectively, taking the YTD performance to gains of 14.3%, 12.2%, 10.5% and 9,9% for NSE 20, NSE 25, NASI and NSE 10 respectively. The equities market performance was mainly driven by gains recorded by large cap stocks such as Co-operative Bank, Equity, and Absa of 7.7%, 7.2% and 4.4% respectively.
Also, during the week, the banking sector index gained by 4.5% to 238.9 from 228.6 recorded the previous week. This is attributable to gains recorded by stocks such as Co-operative Bank, Equity, and Absa of 7.7%, 7.2% and 4.4% respectively.
During the week, equities turnover increased by 1.4% to USD 21.3 mn from USD 21.0 mn recorded the previous week, taking the YTD total turnover to USD 475.4 mn. Foreign investors remained net sellers for the tenth consecutive week with a net selling position of USD 7.2 mn, from a net selling position of USD 5.8 mn recorded the previous week, taking the YTD foreign net selling position to USD 79.0 mn, compared to a net selling position of USD 92.9 mn recorded in 2025.
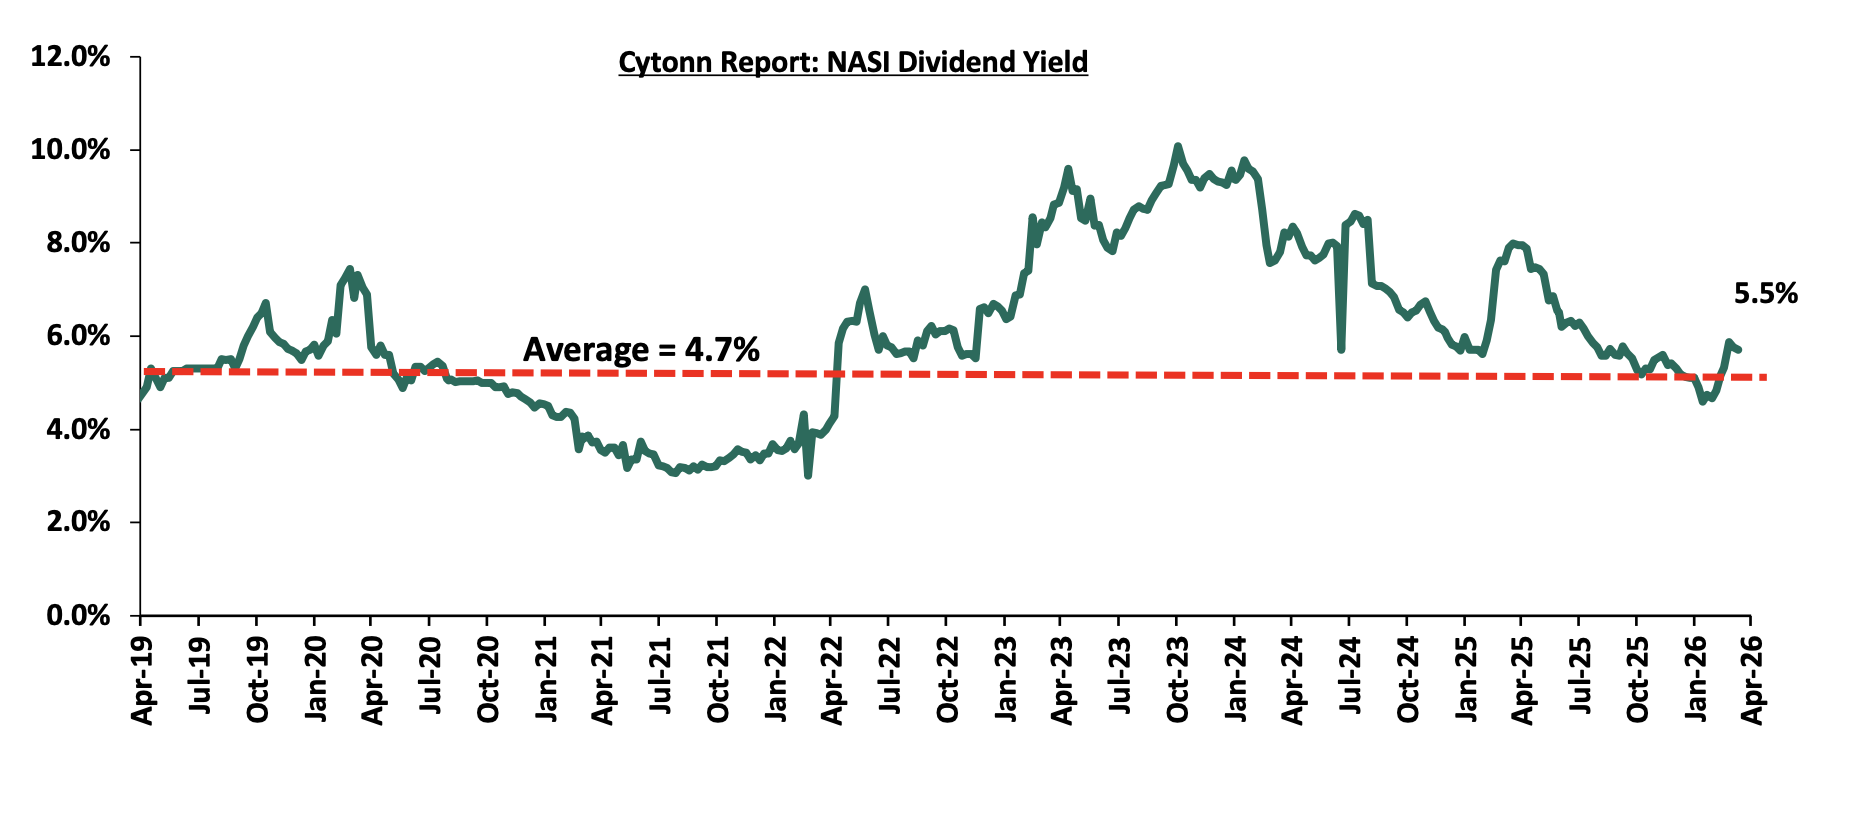
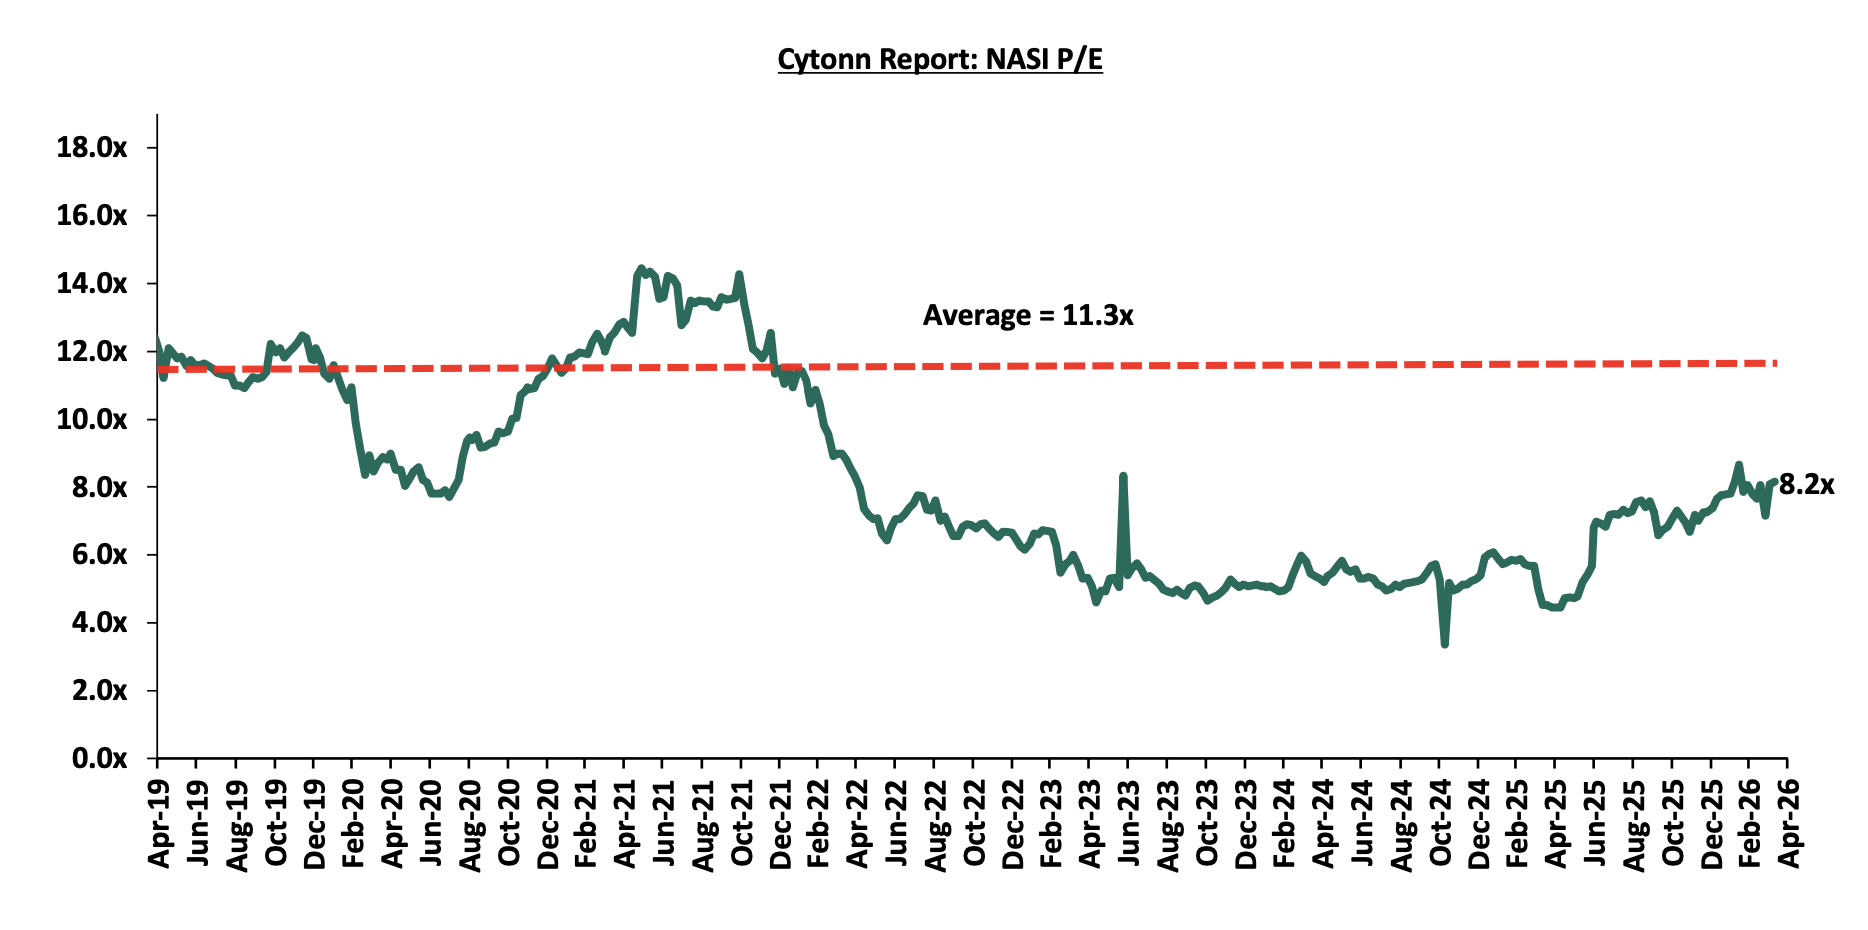
The market is currently trading at a price to earnings ratio (P/E) of 8.2x, 3.1% points below the historical average of 11.3x. The dividend yield stands at 5.5%, 0.8% points above the historical average of 4.7%. Key to note, NASI’s PEG ratio currently stands at 1.0x, suggesting that the market is fairly valued relative to its expected earnings growth. A PEG ratio greater than 1.0x indicates the market may be overvalued while a PEG ratio less than 1.0x indicates that the market is undervalued.
The charts below indicate the historical P/E and dividend yields of the market.
Universe of Coverage:
|
Cytonn Report: Equities Universe of Coverage |
||||||||||
|
Company |
Price as at 02/04/2026 |
Price as at 10/04/2026 |
w/w change |
YTD Change |
Year Open 2026 |
Target Price* |
Dividend Yield |
Upside/ Downside** |
P/TBv Multiple |
Recommendation |
|
Diamond Trust Bank |
145.5 |
150.8 |
3.6% |
31.4% |
114.8 |
173.4 |
6.0% |
21.0% |
0.4x |
Buy |
|
NCBA |
90.3 |
90.0 |
(0.3%) |
5.9% |
85.0 |
101.3 |
7.9% |
20.4% |
1.2x |
Buy |
|
CIC Group |
4.5 |
4.7 |
4.7% |
3.5% |
4.5 |
5.5 |
2.8% |
19.8% |
1.2x |
Accumulate |
|
KCB Group |
68.3 |
71.0 |
4.0% |
8.0% |
65.8 |
77.5 |
9.9% |
18.9% |
0.7x |
Accumulate |
|
Co-op Bank |
28.7 |
30.9 |
7.7% |
29.3% |
23.9 |
33.4 |
8.1% |
16.2% |
1.1x |
Accumulate |
|
I&M Group |
49.2 |
51.5 |
4.8% |
20.3% |
42.8 |
55.4 |
7.3% |
14.8% |
0.8x |
Accumulate |
|
Equity Group |
69.3 |
74.3 |
7.2% |
10.8% |
67.0 |
79.2 |
7.7% |
14.4% |
1.0x |
Accumulate |
|
ABSA Bank |
29.6 |
30.9 |
4.4% |
24.3% |
24.9 |
33.0 |
6.6% |
13.4% |
1.7x |
Accumulate |
|
Britam |
11.9 |
12.1 |
1.3% |
33.0% |
9.1 |
13.5 |
0.0% |
12.0% |
0.9x |
Accumulate |
|
Stanbic Holdings |
274.5 |
280.5 |
2.2% |
41.8% |
197.8 |
290.1 |
8.0% |
11.4% |
1.6x |
Accumulate |
|
Standard Chartered Bank |
335.0 |
343.8 |
2.6% |
14.7% |
299.8 |
351.8 |
9.0% |
11.3% |
2.1x |
Accumulate |
|
Jubilee Holdings |
371.0 |
390.0 |
5.1% |
20.9% |
322.5 |
407.5 |
3.8% |
8.3% |
0.5x |
Hold |
|
*Target Price as per Cytonn Analyst estimates **Upside/ (Downside) is adjusted for Dividend Yield *Dividend Yield is calculated using FY’2025 Dividends Dividend Yield is calculated using FY’2024 Dividends |
||||||||||
Weekly Highlights
-
Jubilee Holdings FY’2025 Financial Results
Jubilee Holdings Limited released their FY’2025 results. Jubilee’s Profit After Tax (PAT) increased by 17.6% to Kshs 5.6 bn, from Kshs 4.7 bn recorded in FY’2024. The performance was mainly driven by a 16.5% increase in Insurance Services Revenues to Kshs 29.9 bn, from Kshs 25.7 bn in FY’2024, but was however weighed down by the 11.0% increase in Insurance Services Expenses to Kshs 26.9 bn in FY’2025, from Kshs 24.2 bn in FY’2024;
|
Cytonn Report: Jubilee Holdings Ltd Income Statement |
||||||||
|
Item (All figures in Bns) |
FY'2024 |
FY'2025 |
y/y change |
|||||
|
Insurance Revenue |
25.7 |
29.9 |
16.5% |
|||||
|
Insurance service expenses |
(24.2) |
(26.9) |
11.0% |
|||||
|
Net expenses from reinsurance contracts held |
(0.8) |
(1.2) |
58.1% |
|||||
|
Net Insurance income |
0.7 |
1.8 |
163.8% |
|||||
|
Net investment result |
(4.1) |
(4.5) |
10.8% |
|||||
|
Net non-attributable income (expenses) |
1.5 |
0.8 |
(43.1%) |
|||||
|
Profit Before Tax |
6.2 |
7.2 |
15.4% |
|||||
|
Taxation |
(1.5) |
(1.6) |
8.7% |
|||||
|
Profit After Tax |
4.7 |
5.6 |
17.6% |
|||||
|
Core EPS in Kshs |
66.0 |
80.0 |
21.2% |
|||||
|
Dividend Per Share in Kshs |
13.5 |
15.0 |
11.1% |
|||||
|
Dividend Payout Ratio |
20.7% |
19.6% |
(1.1%) |
|||||
|
Dividend Yield |
6.8% |
3.8% |
(3.0%) |
|||||
|
Cytonn Report: Jubilee Holdings Ltd Balance Sheet |
||||||||
|
Item (All figures in Bns) |
FY'2024 |
FY'2025 |
y/y change |
|||||
|
Investment assets |
188.6 |
224.8 |
19.2% |
|||||
|
Insurance Assets |
4.0 |
5.5 |
38.7% |
|||||
|
Total Assets |
213.6 |
251.1 |
17.6% |
|||||
|
Insurance Contract Liabilities |
153.0 |
187.8 |
22.7% |
|||||
|
Provisions & other payables |
9.4 |
7.7 |
(18.0%) |
|||||
|
Total liabilities |
162.4 |
195.5 |
20.4% |
|||||
|
Shareholder funds |
49.1 |
53.8 |
9.5% |
|||||
|
Minority Interest |
2.1 |
1.8 |
(11.2%) |
|||||
|
Total Equity |
51.2 |
55.6 |
8.6% |
|||||
Key take outs from the results:
-
Core Earnings Per share increased by 21.2% to Kshs 80.0 from Kshs 66.0 in FY’2024, driven by the 16.5% increase in Insurance Services Revenues to Kshs 29.9 bn, from Kshs 25.7 bn in FY’2024, but was however weighed down by the 11.0% increase in Insurance Services Expenses to Kshs 26.9 bn in FY’2025, from Kshs 24.2 bn in FY’ 2024,
-
Net Investment result increased by 10.8% to Kshs 4.5 bn in FY’ 2025, from Kshs 4.1 bn in FY’ 2024, while net non-attributable expenses decreased by 43.1% to Kshs 0.8 bn, from Kshs 1.5 bn in FY’ 2025, resulting in a 15.4% increase in the Profit Before Tax to Kshs 7.2 bn in FY’ 2025, from Kshs 6.2 bn recorded in FY’ 2024,
-
Insurance services revenue increased by 16.5% to Kshs 29.9 bn in FY’2025 from Kshs 25.7 bn in FY’ 2024, while insurance expenses increased by 11.0% to Kshs 26.9 bn from Kshs 24.2 bn in FY’2024, and the net expenses from reinsurance contracts held increased significantly by 58.1% to Kshs 1.2 bn, from Kshs 0.8 bn in FY’2024. This translated to a Net investment result increase of 10.8% to Kshs 4.5 bn from Kshs 4.1 bn in FY’ 2024,
-
The balance sheet recorded an expansion as total assets increased by 17.6% to Kshs 251.1 bn in FY’2025 from Kshs 213.6 bn in FY’2024 mainly driven by 19.2% increase in investment assets to Kshs 224.8 bn from Kshs 188.6 bn in FY’2024, coupled with 38.7% increase in insurance assets to Kshs 5.5 bn from Kshs 4.0 bn in FY’ 2024, and,
-
Total liabilities increased by 20.4% to Kshs 195.5 bn from Kshs 162.4 bn in FY’2024, majorly on the back of Insurance contract liabilities 22.7% increase to Kshs 187.8 bn from Kshs 153.0 bn in FY’ 2024 despite the 18.0% decrease in other liabilities to Kshs 7.7 bn from Kshs 9.4 bn in FY’ 2024.
Other highlights from the release include:
-
Declaration of dividends – The Board of Directors recommended a final dividend of Kshs 13.0, which was a 13.0% increase from Kshs 11.5 per share recommended in FY’2024. With an interim dividend of Kshs 2.0, this brings the total dividend per share to Kshs 15.0 which also translates to a dividend yield of 3.8% and a payout ratio of 19.6%.
Going forward, the factors that would drive the company’s growth would be:
-
Strong regional footprint and diversification: Its presence in countries such as Kenya, Uganda and Tanzania allows Jubilee to tap into multiple economies. Moreover, diversification across life, health, and general insurance creates multiple revenue streams.
-
Strategic partnerships: Partnerships with global players like Allianz enhance expertise, capital strength, and global best practices.
Valuation Summary:
-
We are of the view that Jubilee Insurance is an “Hold” with a target price of Kshs 403.5 representing an upside of 7.3%, inclusive of a dividend yield of 3.8%, from the current price of Kshs 390.0 as of 10th April 2026.
-
Acquisition on 100% shareholding of Paramount Bank by Zenith Bank
During the week, the Central Bank of Kenya (CBK) announced the completion of the acquisition of 100.0% shareholding of Paramount Bank Limited (PBL) by Zenith Bank PLC, following approvals granted on March 9, 2026 under Section 13(4) of the Banking Act, and on March 16, 2026 by the Cabinet Secretary, The National Treasury and Economic Planning pursuant to Section 9 of the Banking Act. The deal was first announced in November 2025, however, the transaction values and details were not disclosed.
Paramount Bank has maintained stable performance over recent financial periods, supported by steady growth in customer deposits, improved loan book quality, and diversified income from retail and SME banking segments. The bank’s focus on relationship banking and niche corporate clients has enabled it to remain resilient in a highly competitive market dominated by larger tier-one lenders. For the financial year ended December 2025, Paramount’s total assets increased by 7.5% to Kshs 17.1 bn, from 15.9 bn in FY’2024, while the total liabilities grew by 3.8% to Kshs 13.5 bn from 13.0 bn in FY’2024. Profit after tax for FY’2025 recorded a 8.9% increase to Kshs 0.4 bn from Kshs 0.3 bn in FY’2025. Core capital stood at Kshs 3.3 bn, Kshs 6.7 bn below the required Kshs 10.0 bn by 2029, highlights the difficulty smaller banks face in meeting evolving regulatory thresholds through organic growth alone.
Zenith Bank, a growing regional financial services group with ambitions to scale across East Africa, views the acquisition as a strategic entry point into Kenya’s established banking ecosystem, enhancing its geographic diversification and positioning it to tap into Kenya’s relatively mature and dynamic banking sector as a gateway to the broader region. For the Kenyan banking sector, the entry into the Kenyan banking sector is expected to intensify competition, drive innovation, and accelerate consolidation, particularly among mid-tier banks, while supporting increased capital inflows and strengthening overall sector stability.
-
Centum Investments Share Buyback Results
During the week, Centum Investment Company PLC announced the results of its share buyback programme of up to 10.0% of its issued and paid-up share capital, conducted through the Nairobi Securities Exchange (NSE) in accordance with the Companies Act, 2015. The programme, which commenced on 6 February 2023 and was later extended to 30 September 2024, was followed by a second phase that ran from 1 October 2024 to 31 March 2026 after receiving the necessary regulatory and shareholder approvals. A share buyback happens when a company buys back its own shares from the market. This reduces the total number of shares in circulation, which increases the proportional ownership of existing shareholders. As a result, the remaining shares may gain value, and the move often signals that the company is confident about its future performance. The results were that the buyback was undersubscribed at 16.8%, with a total of 10,839,300 shares repurchased across both phases, largely under the first programme. Consequently, the company’s issued share capital declined, reducing the shares available for trading on the NSE from 655,592,414 to 644,753,114 ordinary shares.
Key highlights from the buyback programme include:
-
The programme targeted the acquisition of up to 65,559,241 mn shares, representing approximately 10.0% of the Company’s issued share capital (adjusted for treasury shares). The buyback was undersubscribed at 16.8%with a total of 10,839,300 mn shares repurchased across both phases, comprising 10,688,500 mn shares under the first programme and 150,800mn shares under the second.
-
The Company’s issued share capital reduced from 655,592,414 mn ordinary shares to 644,753,114 mn shares available for trading on the NSE following the completion of the buyback.
-
All repurchased shares will be held as treasury shares, in line with regulatory requirements, with the Company set to file all requisite statutory returns.
Shareholders of Centum Investment Company were hesitant to participate in the buyback largely because the stock price had surged to levels as much as 64.0% above the company’s offered buyback price. Since the market price exceeded the maximum buyback price of Kshs 9.51, investors stood to earn more by selling their shares in the open market rather than back to the company. Centum Investment Company launched its share buyback in September 2024 at a maximum offer price of Kshs 9.51, a premium to the 30-day average price of Kshs 8.64. However, the share price rose significantly above this level, reaching highs of Kshs 15.60 by March 2026. By the end of the programme on 31st March 2026, the stock averaged Kshs 13.65, making it more attractive for investors to sell in the open market rather than tender shares at the offer price. The buyback, funded with Kshs 600.8 mn, aimed to address undervaluation on the Nairobi Securities Exchange and enhance shareholder value. The undersubscription was due to the share price being rallied above the capped buyback price, hence investors having better returns in the open market. This reflects a rise in the share price of Centum that rendered the buyback price uncompetitve, hence constraining effective capital deployment and limiting it’s impact on capital structure optimization.
We maintain a “cautiously optimistic” short-term outlook supported primarily earnings-led attractive valuations, lower yields on short-term government papers and expected global and local economic recovery, and, “neutral” in the long term as persistent foreign investor outflows continue to constrain market liquidity and limit broad-based market re-rating. With the market currently trading slightly to its future growth (PEG Ratio at 1.0x), where performance will be driven by company-specific fundamentals rather than general market direction, we believe that investors should reposition towards value stocks exhibiting strong earnings growth, attractive dividend yields, solid balance sheets, sustainable competitive advantages and trading at compelling discounts to their intrinsic value. While foreign investor sell-offs are expected to continue exerting pressure in the near term, we believe this will create selective entry opportunities for long-term investors.
-
Commercial Office Sector
During the week, the National Treasury announced plans to buy Jubilee Insurance Centre in Nairobi for Kshs 2.5 bn. The proposal has been approved by the National Assembly’s Budget and Appropriations Committee (BAC) as part of the FY’2025/26 Supplementary Budget I.
The building is owned by Jubilee Holdings and is located in Nairobi’s Central Business District. Treasury officials indicated that the property provides sufficient space for government operations as it is adjacent to City Hall. The committee also noted that the government is already in discussions with Jubilee Holdings on the purchase hence the BAC blocked the Treasury from spending Kshs 400.0 mn to refurbish offices until the government concludes negotiations to acquire the property.
We expect that the planned purchase of Jubilee Insurance Centre by the government to signal a shift from leasing to ownership of prime office space, which could reduce demand for rental offices in areas like Nairobi’s CBD as preference moves towards ownership rather than leasing. At the same time, it introduces the government as a direct buyer in the commercial property market, potentially supporting demand for high-value office buildings while reshaping investor focus toward asset sales rather than long-term leases.
-
Hospitality Sector
-
Nairobi Hotel Pipeline up by 58.3% as Global Chains Lead
During the week, W Hospitality group released a 2025 Hotel Chain Development Pipelines in Africa report that indicated that the Hotel development in Nairobi has increased significantly, with international chains expanding their investment pipeline by 58.3% to reach 3,650 rooms currently under construction. This marks a strong rebound from last year, where only 2,306 rooms were in development, and reflects renewed investor interest in the city’s hospitality sector. The growth signals renewed confidence in Nairobi’s position as a regional business and conferencing hub supported by sustained demand from corporate travel, conferences, and international events, as well as improved transport and road infrastructure, reversing last year’s trend where developers had shifted focus to emerging tourism circuits outside the capital.
According to W Hospitality Group data shows that countrywide, the pipeline has expanded by 42.5% with 35 hotels accounting for a combined 6,190 rooms under development, up from 4,344 rooms last year. This means projects outside the capital have grown to 2,540 rooms, up from 2,038 rooms last year. Ethiopia and Kenya have the highest rooms under construction, followed by Tanzania and South Africa.
We expect that the expansion of Nairobi’s hotel development pipeline, with thousands of rooms under construction by global chains, to signal increased investment activity in the city’s hospitality real estate sector and strengthens its appeal as a regional business and tourism hub. This growth is likely to boost competition, expand supply, and support long-term investor confidence in hotel and mixed-use developments driven by sustained demand from corporate travel and international events.
-
Launch of Jambojet Entebbe, Dar es Salaam Flights
During the week, regional low-cost airline Jambojet announced plans to expand its network by launching flights to Entebbe and Dar es Salaam by March 2027, as part of a broader growth strategy. The airline, which currently operates an international route from Mombasa to Zanzibar, aims to rebuild and extend routes that were halted during Covid-19 disruptions. Its leadership says this marks the beginning of a wider regional push, with fleet expansion expected to increase aircraft numbers from 11 to 13 in the short term and eventually to 30 within five years. The strategy focuses not only on adding routes but also strengthening infrastructure to support long-term profitability.
To support this growth, Jambojet has already acquired a Bombardier DHC-8-400 aircraft, increasing total capacity to 11 planes and boosting operational capability and passenger volumes. The airline has expanded weekly flights to 224, adding more frequencies across destinations such as Eldoret, Kisumu, Malindi and Mombasa. With additional aircraft expected soon, the new routes to Entebbe and Dar es Salaam will intensify competition with regional carriers like Kenya Airways, Uganda Airlines, and Air Tanzania. The airline projects revenue growth to Kshs 17.2 bn and passenger numbers reaching 1.5 mn, building on recovery after previous declines caused by aircraft groundings and operational disruptions.
We expect that expansion is likely to increase tourist and business travel, driving higher demand for hotels, serviced apartments, and short-term rentals in these cities. This growth in passenger traffic could encourage new hospitality real estate developments and upgrades to existing properties as investors position themselves to capture rising occupancy and revenue opportunities.
-
Air France to Boost Paris – Nairobi Route with a Larger Plane
During the week, Air France announced plans to introduce a larger aircraft on the Paris–Nairobi route from May. It will replace the Airbus A350 plane with a Boeing 777-200, raising seat capacity by about 12.0%. This change responds to growing demand on Paris-Nairobi route. The airline currently operates 14 weekly flights, and demand is expected to grow during the summer peak season for air travel.
The larger aircraft will carry up to 350 passengers, compared to about 250 on the Boeing 787-9 previously used. The move may increase competition among airlines serving the route. Kenya Airways also operates direct flights between the two cities but at lower frequency. The route connects Nairobi to Air France’s hub at Paris Charles de Gaulle Airport, linking travellers to over 300 destinations through its network and partners.
We expect the deployment of a larger aircraft by Air France on the Paris–Nairobi route will increase passenger capacity, likely boosting international arrivals and raising demand for hotels and serviced accommodations in Nairobi. This growth can drive higher occupancy rates and encourage investment in new hospitality real estate developments near key business districts and transport hubs.
-
Real Estate Investments Trusts
-
REITs Weekly Performance
On the Unquoted Securities Platform Acorn D-REIT and I-REIT traded at Kshs 27.4 and Kshs 23.2per unit, respectively, as per the last updated data on 13th March 2026. The performance represented a 33.4% and 14.5% gain for the D-REIT and I-REIT, respectively, from the Kshs 20.0 inception price. The volumes traded for the D-REIT and I-REIT came in at 13.4 mn and 42.2 mn shares, respectively. Additionally, ILAM Fahari I-REIT traded at Kshs 11.0 per share as of 13th March 2026, representing a 45.0% loss from the Kshs 20.0 inception price. The volume traded to date came in at 1.2 mn shares for the I-REIT, REITs offer various benefits, such as tax exemptions, diversified portfolios, and stable long-term profits. However, the ongoing decline in the performance of Kenyan REITs and the restructuring of their business portfolios are hindering significant previous investments. Additional general challenges include:
-
Insufficient understanding of the investment instrument among investors leading to a slower uptake of REIT products,
-
Lengthy approval processes for REIT creation,
-
High minimum capital requirements of Kshs 100.0 mn for REIT trustees compared to Kshs 10.0 mn for pension funds Trustees, essentially limiting the licensed REIT Trustee to banks only
-
The rigidity of choice between either a D-REIT or and I-REIT forces managers to form two REITs, rather than having one Hybrid REIT that can allocate between development and income earning properties
-
Limiting the type of legal entity that can form a REIT to only a trust company, as opposed to allowing other entities such as partnerships, and companies,
-
We need to give time before REITS are required to list – they would be allowed to stay private for a few years before the requirement to list given that not all companies maybe comfortable with listing on day one, and,
-
Minimum subscription amounts or offer parcels set at Kshs 0.1 mn for D-REITs and Kshs 5.0 mn for restricted I-REITs. The significant capital requirements still make REITs relatively inaccessible to smaller retail investors compared to other investment vehicles like unit trusts or government bonds, all of which continue to limit the performance of Kenyan REITs.
We expect the performance of Kenya’s Real Estate sector to remain resilient, supported by several factors: i) Treasury plans on buying Jubilee’s Nairobi CBD office signaling a shift from leasing to ownership of prime office space , ii) Nairobi hotel pipeline up by 58.3% as global chains lead signaling increased investment activity in the city’s hospitality sector, iii) Launch of Jambojet Entebbe, Dar es Salaam flights enhancing tourist and business travel, iv) Air France boosting of Paris – Nairobi route with a larger plane hence boosting international arrivals and demand for hotels. However, challenges such as the weak investor appetite in listed REITs like ILAM Fahari I-REIT and high capital requirements will continue to constrain the sector’s optimal performance.
Following the release of the FY’2025 results by three authorized Real Estate Investment Trusts (REITs) in Kenya, the Cytonn Real Estate Research Team undertook an analysis of the financial performance of the REITs and identified the key factors that shaped the performance of the sector. For the earnings notes of the various REITs, click the links below:
-
ILAM Fahari I-REIT FY’2025 Earnings Note
As of this report's publication, Laptrust Imara I-REIT was omitted because it had not yet released its FY’2025 financial statements. In the report we will assess the financial performance of the current REITs in the market during FY’2025 in terms of operational metrics, profitability metrics, leverage ratios, liquidity ratios, and valuation metrics. In addition, we highlight the outlook regarding our expectations for the REITs sector going forward. This we will cover as follows;
-
Overview of the REITs Sector in Kenya,
-
Themes that shaped the Real Estate Sector in FY’2025,
-
Summary Performance of the REITS in FY’2025, and,
-
Conclusion and Outlook for the REITs sector.
Section I: Overview of the REITs Sector in Kenya
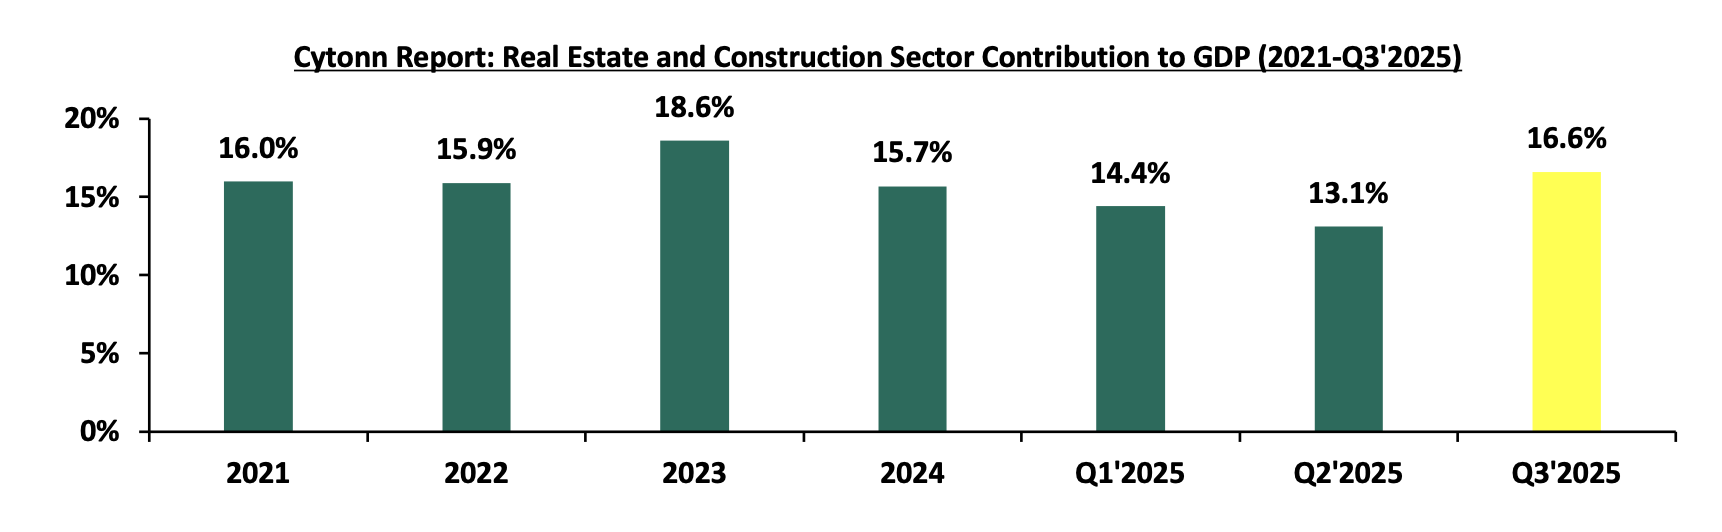
The general Real Estate sector has continued to witness considerable growth in activity in terms of property transactions and development activities. The KNBS latest report shows that the sector’s activity grew by 7.6% to Kshs 368.7 bn in Q3’2025, from Kshs 342.6 bn recorded during the same period in 2024. In addition, the sector contributed 8.6% to the country’s GDP, however, a 2.2% points decrease from 10.8% recorded in Q3’2024. Cumulatively, the Real Estate and construction sectors contributed 16.6% to GDP, 0.1% points increase from 16.5% in Q3’2024, attributable to increase in construction contribution to GDP by 1.0% points, to 6.7% in Q3’2025, from 5.7% recorded in Q3’2024. The graph below highlights the Real Estate and Construction sectors’ contribution to GDP from 2021 to Q3’2025
Source: Kenya National Bureau of Statistics (KNBS)
As the REITs continue to gain popularity in Kenya, we set to explore and review the REITs environment in 2025 building to the previous reports we did, which include: Kenya’s REITs FY’2024 Real Estate Investment Trusts (REITs) progress in Kenya ,Kenya’s REITs FY’2024 , Review of Real Estate Investments Trusts in Kenya 2024, Review of Real Estate Investments Trusts (REITs) in Kenya 2025, Review of Real Estate Investments Trusts (REITs) in Kenya 2026
Section I: Overview of the REITs Sector in Kenya
Real Estate Investment Trusts are crucial to the development given the limited funding available to the developers. Real Estate Investment Trusts (REITs) represent an innovative financing avenue for real estate development in Kenya. REITs provide a structured mechanism for pooling resources from multiple investors to finance or acquire income-generating real estate assets. The Capital Markets Authority (CMA) regulates REITs in Kenya, ensuring transparency and investor protection. Despite being relatively new in the Kenyan financial market, REITs have shown potential as a transformative tool for real estate financing.
In Kenya, REITs are classified into two main types:
-
Development REITs (D-REITs): These focus on financing the construction of new real estate projects. Developers utilize D-REITs to raise capital for large-scale projects, such as residential complexes, commercial buildings, or mixed-use developments. Investors in D-REITs anticipate returns from the eventual sale or lease of the completed properties. Example of this REIT include Acorn D-REIT.
-
Income REITs (I-REITs): These are designed for properties that generate consistent rental income. I-REITs appeal to investors seeking steady cash flow from established properties such as office buildings, shopping malls, or industrial parks. In Kenya examples of I-REITs include Acorn I-REIT and Stanbic Fahari I-REITs.
REITs in Kenya are governed by strict regulations aimed at safeguarding investors. They operate as collective investment schemes where a REIT manager oversees the fund's operations. Investors purchase units of the REIT, similar to shares in a company, granting them proportional ownership of the underlying real estate assets. These units are typically traded on the Nairobi Securities Exchange (NSE), providing liquidity and enabling investors to buy or sell their stakes easily.
REITs must allocate a significant portion of their income, often up to 90.0% to investors as dividends, making them attractive to those seeking regular income. Additionally, REITs benefit from tax incentives, such as exemptions on corporate tax, which enhance their appeal to both developers and investors.
In 2013, the Capital Markets Authority (CMA) introduced a detailed framework and regulations for REITs, enabling developers to secure capital through this investment avenue.
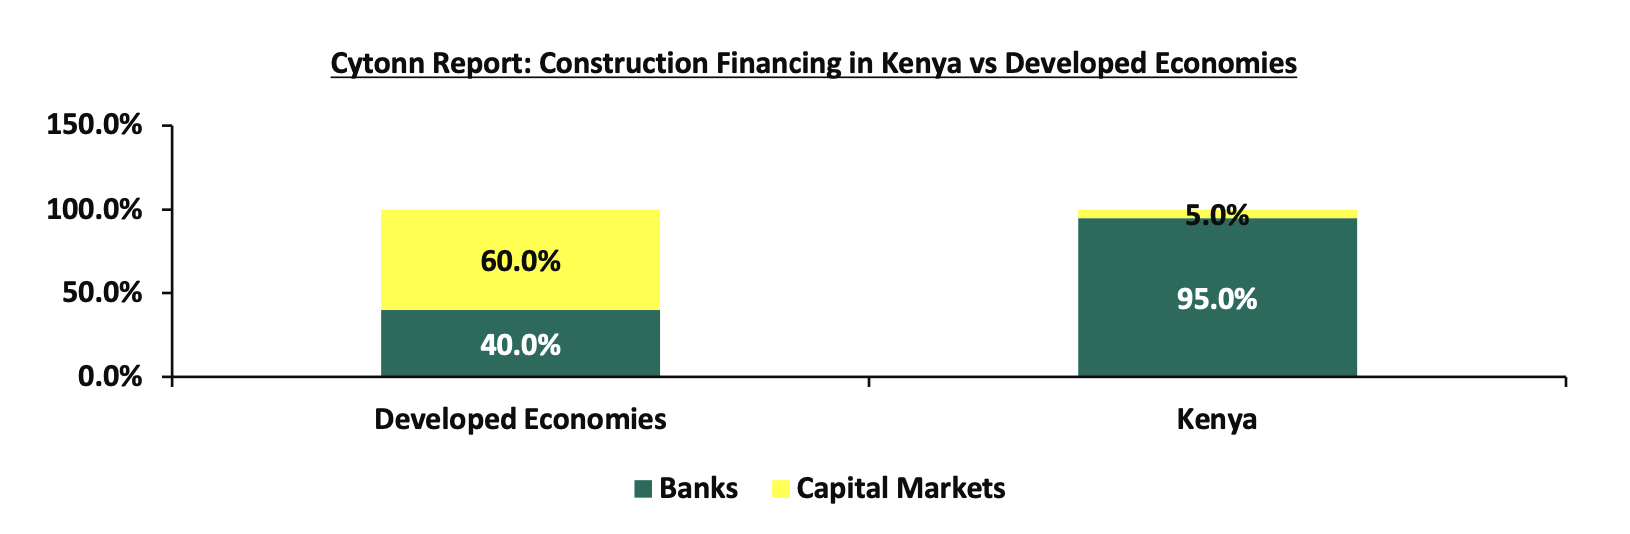
Kenya's Real Estate sector has been expanding due to ongoing construction activities driven by strong demand for real estate developments. The residential market is significantly under-supplied, with an 80.0% housing deficit; only 50,000 units are delivered annually against an estimated need for 250,000 units per year. Additionally, the formal retail market in Kenya is still in its nascent stages, with a penetration rate of approximately 30.0%, as reported by the World Bank. Despite the high demand, developers in Kenya encounter limited financing options, with local banks providing nearly 95.0% of construction financing, in stark contrast to the 40.0% typically seen in developed countries. The graph below illustrates the comparison of construction financing in Kenya versus developed economies;
Source: World Bank
To bridge the funding gap, developers are increasingly turning to alternative financing methods. In 2013, the Capital Markets Authority (CMA) introduced a regulatory framework for Real Estate Investment Trusts (REITs) in Kenya. REITs are collective investment vehicles that pool funds from investors, who then acquire rights or interests in a trust divided into units. Investors benefit from profits or income generated by the real estate assets held within the trust. To ensure transparency, accountability, and the protection of investors' interests, four essential entities play key roles in the REIT structure in Kenya. Click here to read more on the key entities and how the REIT structure operates
Since its introduction in 2013, the REIT market in Kenya has faced several hurdles that have hindered its growth. Key challenges include the hefty capital requirement of Kshs 100.0 mn for trustees, limiting this role largely to banks, and a protracted approval process for setting up REITs. Additionally, the high minimum investment threshold of Kshs 5.0 mn discourages potential investors, while a lack of sufficient investor education and awareness further impedes market expansion. As a result, the REIT market capitalization in Kenya remains significantly lower compared to other regions
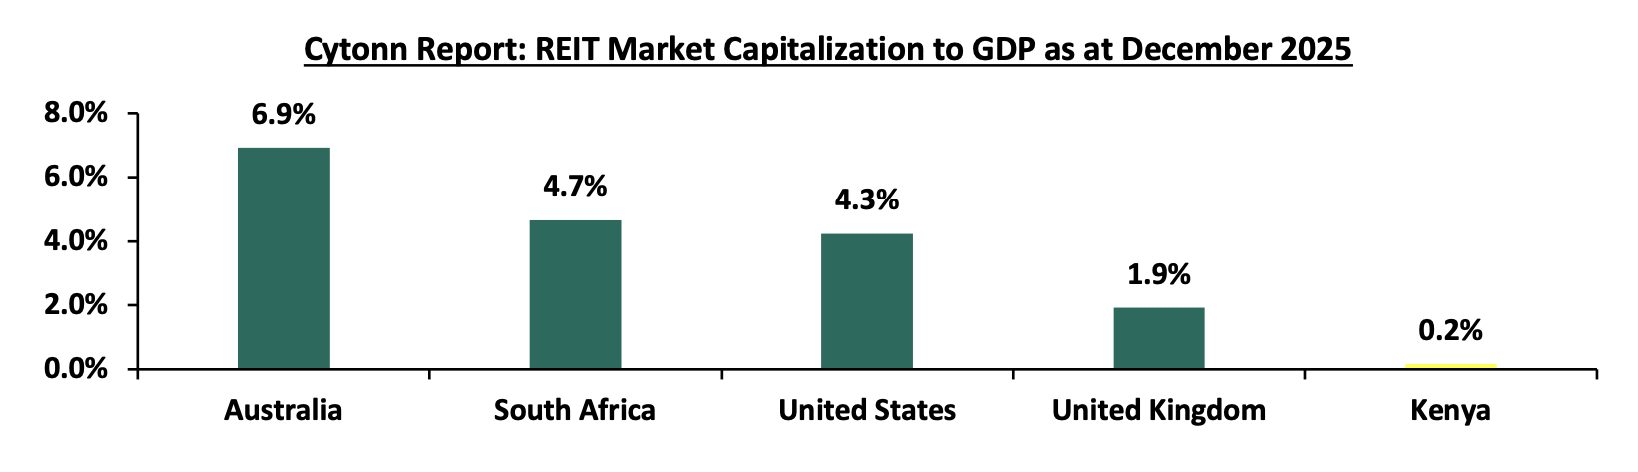
The underdeveloped capital markets in Kenya has continually failed to provide alternative means of financing Real Estate developments. Due to this, most property developers rely on conventional sources of funding such as banks, compared to other developed countries. As a result, Kenya’s REIT Market Capitalization to GDP has remained significantly low at 0.2%, compared to other countries such as South Africa with 4.7%, as shown below;
Source: European Public Real Estate Association (EPRA), World Bank, Cytonn Research
Most property developers in Kenya continue to rely on traditional funding sources, such as banks, unlike in more developed markets. Since the establishment of REIT regulations, five REITs have been approved in Kenya, with the recent listing of Africa Logistics Property Income REIT ALP-I REIT. None of the five REITs are actively trading on the Main Investment Market Segment of the Nairobi Securities Exchange (NSE). LAPTrust Imara I-REIT and ALP Industrial I-REIT are the only listed REITs in the country, quoted on the restricted market sub-segment of the NSE's Main Investment Market. The ILAM Fahari I-REIT, Acorn I-REIT and D-REIT are not listed but trade on the Unquoted Securities Platform (USP), an over-the-counter market segment of the NSE. The table below outlines all REITs authorized by the Capital Markets Authority (CMA) in Kenya
|
Cytonn Report: Authorized REITs in Kenya |
||||||
|
# |
Issuer |
Name |
Type of REIT |
Listing Date |
Market Segment |
Status |
|
1 |
ICEA Lion Asset Management (ILAM) |
Fahari |
I-REIT |
July 2024 |
Unquoted Securities Platform (USP) |
Trading |
|
2 |
Acorn Holdings Limited |
Acorn Student Accommodation (ASA) – Acorn ASA |
I-REIT |
February 2021 |
Unquoted Securities Platform (USP) |
Trading |
|
3 |
Acorn Holdings Limited |
Acorn Student Accommodation (ASA) – Acorn ASA |
D-REIT |
February 2021 |
Unquoted Securities Platform (USP) |
Trading |
|
4 |
Local Authorities Pension Trust (LAPTrust) |
Imara |
I-REIT |
March 2023 |
Restricted Market Sub-Segment of the Main Investment Market |
Restricted |
|
5 |
Africa Logistics properties (ALP) |
ALP REIT |
I-REIT |
March 2026 |
Restricted Market Sub-Segment of the Main Investment Market |
Restricted |
Source: Nairobi Securities Exchange, CMA
Section II: Themes that Shaped the REIT Sector in FY’2025
In our report on review of the REITs sector, we explored how evolving regulations, strategic acquisitions, and capital-raising initiatives have influenced the REIT industry's trajectory. Additionally, we provide insights into the broader factors that have impacted the sector's performance and overall direction during this period. For more information on themes that continue to shape the REIT sector, please visit our report Review of Real Estate Investments Trusts (REITs) in Kenya 2026
Section III: Summary Performance of the REITs in FY’2025
The tables below highlight the performance of the Kenyan REITs sector, showing the performance using several National Association of Real Estate Investments Trusts (NAREIT) approved metrics, and the key take-outs include;
|
Cytonn Report: Summary Performance Kenya REITs in FY’2025 |
|||||||||||||
|
|
ILAM Fahari I-REIT |
Acorn I-REIT |
Acorn D-REIT |
All REITs |
|||||||||
|
Metric |
FY'2024 |
FY'2025 |
y/y Change |
FY'2024 |
FY'2025 |
y/y Change |
FY'2024 |
FY'2025 |
y/y Change |
FY'2024 |
FY'2025 |
Y/Y change |
|
|
Operating Metrics |
|||||||||||||
|
Net Operating Income (NOI) |
113.6 |
145.8 |
28.3% |
662.6 |
611.8 |
(7.7%) |
1,152.7 |
1,719.2 |
49.1% |
1,928.9 |
2,476.8 |
28.4% |
|
|
Profitability Metrics |
|||||||||||||
|
Funds from Operations |
377.2 |
245.8 |
(34.8%) |
972.5 |
975.1 |
0.3% |
1,152.7 |
1,719.2 |
49.1% |
2,502.5 |
2,940.1 |
17.5% |
|
|
Adjusted FFO |
391.2 |
245.8 |
(37.2%) |
972.5 |
975.1 |
0.3% |
1,152.7 |
1,719.2 |
49.1% |
2,516.5 |
2,940.1 |
16.8% |
|
|
Cash Available for Distribution (CAD) |
113.6 |
145.8 |
28.3% |
234.6 |
306.9 |
30.8% |
839.9 |
854.2 |
1.7% |
1,188.1 |
1,306.9 |
10.0% |
|
|
Cash Amounts Distributed (CAD) |
54.3 |
117.6 |
116.7% |
125.6 |
208.5 |
66.0% |
293.2 |
0.0 |
(100.0%) |
473.1 |
326.2 |
(31.1%) |
|
|
Valuation Metrics |
|||||||||||||
|
Net Asset Value (NAV) |
3556.9 |
3748.4 |
5.4% |
8,122.1 |
9,194.9 |
13.2% |
7,339.7 |
8,479.3 |
15.5% |
19,018.7 |
21,422.6 |
12.6% |
|
source: Cytonn Research
Key takeaways from the table include:
-
The combined Net Operating Income (NOI) of Kenyan REITs saw a 28.4 % increase, reaching Kshs 2,476.8 mn in FY’2025, up from Kshs 1,928.9 mn in FY’2024. This growth was largely driven by a 49.1% rise in the net operating income of Acorn D-REIT, which increased to Kshs 1,719.2 mn from Kshs 1,152.7 mn in FY’2024. Additionally, ILAM Fahari I-REIT reported a notable NOI growth of 28.3%, reaching to Kshs 145.8 mn from Kshs 113.6 mn in similar period in 2024, further contributing to the overall positive performance. On the other hand, Acorn I-REIT NOI fell by 7.7% to Kshs 611.8 mn in FY’2025 from Kshs 662.6 mn in FY’2024 attributable to the decrease in operating income by 4.6% to Kshs 1.05 bn from Kshs 1.1 bn recorded in the previous year which outpaced the decrease in total operating expense by 0.1% to Kshs 438.3 mn from Kshs 438.6 mn recorded in FY’2024
-
Combined Funds from Operations (FFO) of Kenyan REITs increased by 17.5% in FY’2025, increasing to Kshs 2,940.1 mn from Kshs 2,502.5 mn in FY’2024. Similarly, Adjusted FFOs for Kenyan REITs increased by 16.8%, reaching Kshs 2,940.1 mn in FY’2025 from Kshs 2,516.5 mn in FY’2024. This increase was largely due to significant increases in NOIs except for ILAM Fahari I-REIT which recorded a decrease of 37.2% during the period,
-
The REITs combined Cash amounts available for paying dividends to REIT investors which we measured using the Cash Available for Distribution (CAD) metric increased by 10.0% in FY’2025 to Kshs 1,306.9 mn from Kshs 1,188.1 mn in FY’2024. The performance was propelled by Acorn I-REIT’s distributable earnings which increased by 30.8% to come in at Kshs 306.9 mn from Kshs 234.6 mn during the same period last year. Additionally, ILAM Fahari I-REIT distributed earnings stood at Kshs 145.8 mn which was an improvement from the Kshs 113.6 mn earnings recorded in FY’2024 which was a 28.3% improvement.
-
Notably, the REIT managers of the REITs recommended provisional dividends except for Acorn D-REIT. For Acorn I-REIT, the REIT Manager suggested a dividend distribution of Kshs 208.5 mn, amounting to Kshs 0.57 per unit, which was approved by the Trustee for the FY’2025, ILAM Fahari I-REIT recommended a distribution of Kshs 117.6 mn, equivalent to Kshs 0.65 per unit, which was an improvement from the 0.3 per unit distribution in FY’2024, and,
-
The combined Net Asset Values (NAV) for Kenyan REITs increased by 12.6% to reach Kshs 21,422.6 mn in FY’2025, from Kshs 19,018.7 mn in FY’2024. This increase was driven by an increase in all REITs in NAV by 5.4%, 13.2% and 15.5% for ILAM Fahari I-REIT, Acorn I-REIT and D-REIT respectively.
The table below makes a comparison of the leverage and liquidity ratios of all four Kenyan REITs during FY’2024 and FY’2025;
|
Cytonn Report: Summary Performance Kenya REITs in FY’2025 |
||||||||||||||||
|
|
ILAM Fahari I-REIT |
Acorn I-REIT |
Acorn D-REIT |
All REITs |
Y/Y change |
|||||||||||
|
Metric |
FY'2024 |
FY'2025 |
y/y Change |
FY'2024 |
FY'2025 |
y/y Change |
FY'2024 |
FY'2025 |
y/y Change |
FY'2024 |
FY'2025 |
|||||
|
Operating Metrics |
||||||||||||||||
|
Leverage Ratios |
||||||||||||||||
|
Debt to Equity Ratios |
0.0% |
0.0% |
0.0% |
0.0% |
0.2% |
0.2% |
59.2% |
41.7% |
(17.5%) |
17.1% |
17.8% |
0.8% |
||||
|
Debt to Total Market Cap Ratio |
0.0% |
0.0% |
0.0% |
0.0% |
0.2% |
0.2% |
66.2% |
45.1% |
(21.1%) |
19.1% |
19.3% |
0.2% |
||||
|
Debt to Gross Book Value Ratio |
0.0% |
0.0% |
0.0% |
0.0% |
0.1% |
0.1% |
28.3% |
19.6% |
(8.7%0 |
8.2% |
8.4% |
0.2% |
||||
|
Debt to EBITDA Multiple |
- |
- |
0.0% |
0.0 |
0.02 |
- |
3.73 |
2.06 |
(44.9%) |
107.7% |
87.9% |
(18.3%) |
||||
|
Liquidity Ratio |
||||||||||||||||
|
Debt Service Coverage Ratio |
0.0% |
0.0% |
0.0% |
0.0% |
0.0% |
0.0% |
26.5% |
48.6% |
22.1% |
7.6% |
20.8% |
13.1% |
||||
|
Implied Capitalization Rate |
7.4% |
10.2% |
2.8% |
6.8% |
12.2% |
5.4% |
9.0% |
23.0% |
14.0% |
7.7% |
15.1% |
7.4% |
||||
Source: Cytonn Research
Key takeaways from the table include;
-
ILAM Fahari I-REIT remained ungeared during FY’2025, with its leverage ratios remaining at zero. Acorn D-REIT debt ratios decreased in FY’2025 on account of a 18.6% decrease in borrowings to Kshs 3.5 bn in FY’2025, from Kshs 4.3 bn in FY’ 2024, For Acorn I-REIT’s the long-term borrowings came in at 14.5 mn for the first time since inception
-
Notably, Acorn D-REIT’s Debt to EBITDA Multiple decreased by 44.9% to 2.1x in FY’2025, from 3.7x recorded in FY’2024. This was on the back of a faster drop in the REIT’s long-term borrowings which outpaced the EBITDA’s increase. Acorn D-REIT EBITDA in FY’2025 increased by 47.7% to Kshs 1,719.2 mn from Kshs 1,163.8 mn in FY’2024, compared to a 18.6% decrease in the REIT’s long-term debt, Acorn I-REIT made a borrowing of Kshs 14.5mn while the EBITDA came in at 609.3 mn bringing the EBITDA multiple to 0.02x and,
-
Acorn D-REIT traded at the highest implied capitalization rate of 23.0%, signifying a higher return on investment compared to other REITs. In contrast, ILAM FahariI-REIT had the lowest implied capitalization rate of 10.2%.
The table below presents a summary of key valuation metrics of Kenyan REITs in FY’2025;
|
Cytonn Report: Summary Performance Kenya REITs in FY’2025 |
||||||||||||||||
|
ILAM Fahari I-REIT |
Acorn I-REIT |
Acorn D-REIT |
All REITs |
|||||||||||||
|
Metric |
FY'2024 |
FY'2025 |
y/y Change |
FY'2024 |
FY'2025 |
y/y Change |
FY'2024 |
FY'2025 |
y/y Change |
FY'2024 |
FY'2025 |
Y/Y change |
||||
|
Valuation Metrics |
||||||||||||||||
|
Price/FFO per share |
5.3 |
8.1 |
53.5% |
7.5 |
8.7 |
16.5% |
5.7 |
4.6 |
(19.9%) |
6.2 |
7.1 |
15.9% |
||||
|
Dividend Yield |
2.7% |
5.9% |
3.2% |
1.7% |
2.5% |
0.7% |
4.5% |
0.0% |
(4.5%) |
3.0% |
2.8% |
(0.2%) |
||||
|
Dividend Coverage/Payout Ratio |
47.8% |
80.7% |
32.9% |
19.0% |
34.1% |
15.1% |
25.4% |
0.0% |
(25.4%) |
30.7% |
38.3% |
7.5% |
||||
|
Net Asset Value |
3,556.9 |
3,748.4 |
5.4% |
8,122.1 |
9194.9 |
13.2% |
7,339.7 |
8,479.3 |
15.5% |
19,018.7 |
21,422.6 |
12.6% |
||||
|
Net Asset Value per share |
19.7 |
20.7 |
5.4% |
24.6 |
25.1 |
2.2% |
27.5 |
29.6 |
7.8% |
23.9 |
25.1 |
5.2% |
||||
|
Implied Capitalization Rate |
7.4% |
10.2% |
37.7% |
6.8% |
12.2% |
5.4% |
9.0% |
23.0% |
14.0% |
7.7% |
15.1% |
7.4% |
||||
|
Annualized Dividend Yield |
2.7% |
5.9% |
3.2% |
1.7% |
2.5% |
0.7% |
4.5% |
0.0% |
(4.5%) |
3.0% |
2.8% |
(0.2%) |
||||
Source: Cytonn Research
-
Acorn I-REIT units are trading at a premium relative to its peers, with a Price to FFO per share multiple of Kshs 8.7, and this was an increase of 16.5 % from Kshs 7.5 price per FFO per share multiple,
-
Fahari I-REIT’s boasted the highest annualized dividend yield in FY’2025 5.9%, surpassing Acorn I-REIT’s 2.5%. On the payout side, ILAM Fahari I-REIT and Acorn I-REIT had payouts of 80.7% and 34.1%, respectively. All REITs dividend payout did not adhere to Kenya's REIT regulations that mandate distributing at least 80.0% of net profits after tax as dividends except for Fahari I-REIT,
-
Acorn D-REIT recorded the highest NAV per share at Kshs 29.6, a 7.8% increase from FY’2024’s NAV per share of Kshs 27.5. This is on the back of an increase in the number of shares, which increased by 7.2% to 286.6 mn from Kshs 267.3 mn in FY’2024; and a 14.3% growth in the Net Asset Value (NAV) to Kshs 8.5 bn from Kshs 7.3 mn in FY’2024. Fahari I-REIT had the lowest NAV per share at Kshs 20.7, 5.4% increase from 19.7 recorded in FY’2024.
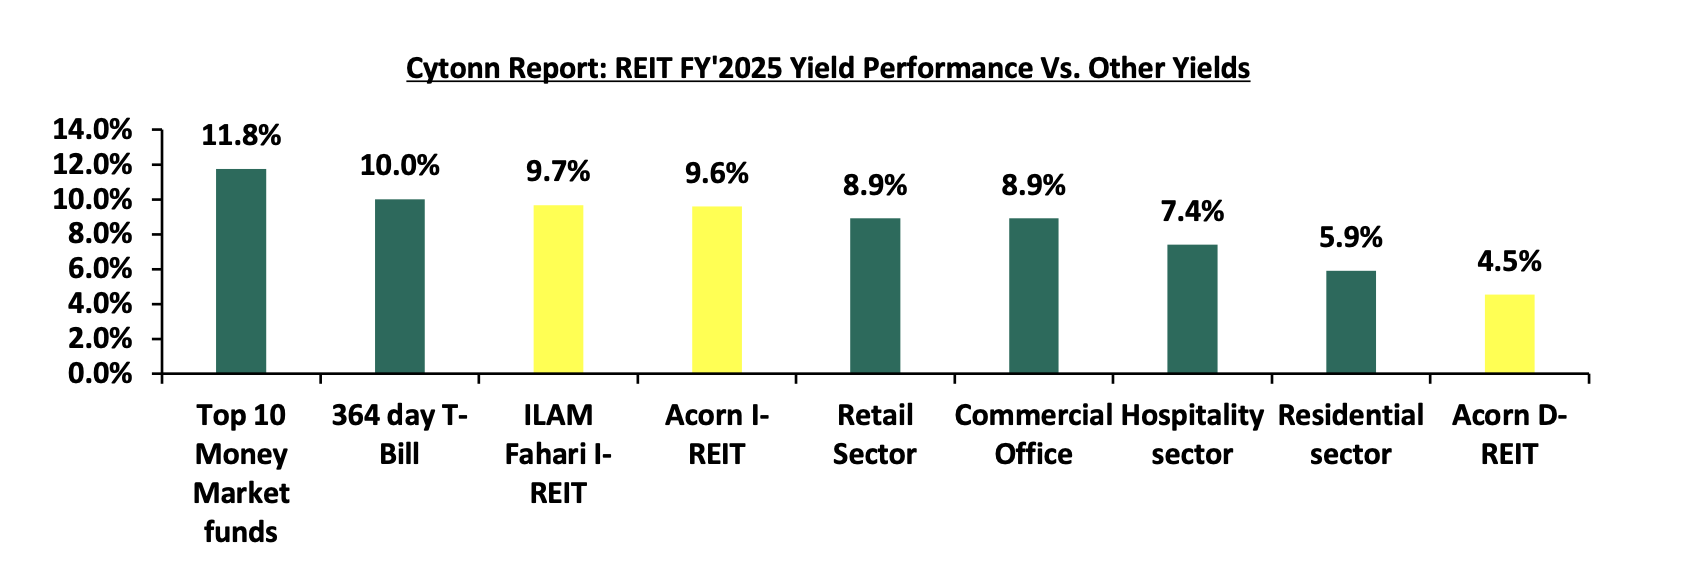
The REITs registered positive annualized rental returns of 9.7%, 9.6% and 4.5% for Fahari I-REIT, Acorn I-REIT and Acorn D-REIT respectfully. The three REITS under analysis yields came in at 7.9% on average showing relatively lower returns as compared to other assets. The chart below shows the comparison of REITs yield performance versus other assets.
Source: Cytonn Research
Section IV: Conclusion, Recommendations, and Outlook for the REITs Sector
Kenya's REITs market has seen moderate performance, shaped by various factors. Despite challenges, there are encouraging trends, such as growth in net operating incomes, indicating improved financial performance. Additionally, leverage ratios for most REITs have remained low, with many REITs being ungeared and relying on short-term debt for their operations to avoid overexposure to the high interest rates. This trend is expected to continue as REITs seek to maintain financial sustainability.
Recommendations to Enhance the REITs Sector:
-
Stakeholder education: There is an urgent need to enhance understanding of the REIT framework among all key stakeholders. Comprehensive investor education and awareness initiatives should be implemented to clearly communicate both the benefits and risks associated with REIT investments. Improved investor literacy will expand participation, deepen market confidence, and support the long-term growth and sustainability of the REIT sector.
-
Broadening permissible legal structures: In contrast to Kenya’s predominantly trust-based REIT framework, markets such as South Africa, Belgium, and the United States permit REITs to be established under various legal forms, including public limited companies, limited liability companies, cooperatives, and partnerships. This structural flexibility accommodates diverse business models and investor preferences. To enhance the competitiveness and accessibility of Kenya’s REIT market, it is recommended that allowable structures be expanded beyond trusts to include corporate and partnership models. Such diversification would reduce entry barriers and foster a more resilient and dynamic REIT ecosystem.
-
Streamlining the approval and regulatory process: The current REIT approval process involves oversight by both the Capital Markets Authority (CMA) and the Kenya Revenue Authority (KRA), creating procedural duplication and delays. Consolidating the approval function under a single regulatory framework would significantly improve efficiency. A unified approval process would reduce compliance costs, shorten timelines, and enhance transparency, thereby making REIT formation more attractive to issuers and fund managers.
-
Encourage hybrid REIT vehicles: Currently, investors are required to subscribe separately to income and development REITs, resulting in duplicated costs and administrative complexity. Introducing hybrid REIT vehicles that combine development-stage growth potential with stable income-generating assets would offer investors a more balanced risk-return profile. Such structures would simplify investment decisions, reduce costs, and enhance overall market attractiveness.
-
Flexibility in listing: Given the apprehensions of many companies regarding an immediate shift to public listing, a phased approach is recommended. Providing REITs with an initial period of private operation before mandating public listing could ensure a smoother transition and align with corporate comfort levels. For example, Belgium’s model, requiring 30% public shareholding, strikes a balance between public participation and promoter flexibility. Kenya could adopt a similar strategy, or even consider offering REITs the choice between public and private listings, which would foster inclusivity and better accommodate diverse investor preferences while bolstering market liquidity.
-
Lower capital requirement for trustees: Currently, the minimum capital requirement for REIT trustees is set at Kshs 100.0 mn, a threshold that effectively restricts trusteeship primarily to major banking institutions. With only a handful of banks registered as REIT trustees, such as Kenya Commercial Bank (KCB), Co-operative Bank, Housing Finance Bank, and NCBA Bank Kenya, it is recommended that this minimum be reduced to Kshs 10.0 mn. This adjustment, aligning with the minimum standards set for Pension Fund Trustees, would expand the pool of potential trustees and encourage more competitive, innovative service provision for REIT managers.
-
Introduce tokenization of REITs: Embracing the concept of tokenization presents an innovative avenue to broaden market participation. By digitizing REIT units into smaller denominations, potentially allowing investments as low as Kshs 100.0, it becomes possible to lower entry barriers, enhance liquidity, and attract a broader range of investors, including those with limited capital.
-
Diminishing Entry Barriers: Revisiting the current minimum investment requirement of Kshs 0.1 mn for D-REITs and Kshs 5.0 mn for the restricted I-REIT, is essential to eliminate barriers that restrict individual participation. Notably, given that D-REITs are riskier compared to I-REITS, it makes no sense having I-REITs with higher minimum investment requirements compared to D-REITs. Lowering this threshold to Kshs 50,000 for I-REITs would foster a more inclusive investment environment, allowing a wider array of investors to access and benefit from the REIT market, ultimately bolstering overall market vibrancy and liquidity.
The outlook for Kenya's REITs sector remains cautiously optimistic. While challenges such as high construction costs and market saturation in certain areas persist, the continued government support through infrastructure development and affordable housing initiatives provides a positive backdrop. Investors are expected to remain focused on income-generating REITs, particularly those tied to resilient sectors like retail and commercial properties. The sector's growth will likely hinge on increased investor awareness and the broadening of investment options within the REITs market.
In 2026, we expect REITS to gain popularity as developers such as Centum Real Estate looking forward to launch a dollar based Income REIT and we expect that the dollar based I-REIT will: i) increase foreign investments by boosting investors’ confidence against local currency uncertainties, ,ii) dollar-denominated REITs provide an alternative for investors seeking more liquid and globally recognized investment options, iii) the dollar based move is likely to set a precedent for other players in the market, encouraging the development of more innovative and investor-centric financial products, and, iv) the fund could force policy regulatory framework improvement to ensure transparency and investments protection.
In addition, we expect the sector will continue to lag behind in comparison to other African countries such as South Africa, attributable to several challenges facing the sector such as; i) lack of sufficient investor awareness regarding the potential of REITs as an investment tool, ii) lengthy approval procedures for establishing REITs have hindered their formation and deployment in the market, iii) high minimum capital requirement of Kshs 100.0 mn for REIT trustees compared to Kshs 10.0 mn for pension funds Trustees, essentially limiting the licensed REIT Trustee to banks only,, and, iv) steep minimum subscription amounts or offer parcels set at Kshs 0.1 mn for D-REITs and Kshs 5.0 mn for restricted I-REITs.
However, we also expect the trend of strategic acquisitions to persist, with REITs actively seeking opportunities to broaden and diversify their portfolios, cater to evolving market demands and also set standards in promoting environmental sustainability such as execution of green bonds by Acorn holding. While there are supportive factors for the growth of REITs in Kenya, such as urbanization and government infrastructure projects, challenges like high interest rates and regulatory constraints may tamper performance. Stakeholders in the REIT sector are advised to monitor these dynamics closely and engage in strategic planning to navigate the evolving market landscape effectively.
Moving forward, we also expect the trend of strategic acquisitions to persist, with REITs actively seeking opportunities to broaden and diversify their portfolios, cater to evolving market demands and also set standards in promoting environmental sustainability such as execution of green bonds by Acorn holding.
Disclaimer: The views expressed in this publication are those of the writers where particulars are not warranted. This publication, which is in compliance with Section 2 of the Capital Markets Authority Act Cap 485A, is meant for general information only and is not a warranty, representation, advice or solicitation of any nature. Readers are advised in all circumstances to seek the advice of a registered investment advisor

- Talk to us
- Kenya
- P.O Box 20695 - 00200, Nairobi, Kenya
- Cell +254709101200
- Tel +254709101200
- WhatsApp +254741676635
- United States
- +254709101200
- DOWNLOAD OUR APP
-


- Kenya
- 8th Floor, Pinetree Plaza, Kaburu Drive, Ngong Road, Nairobi, Kenya
- USA
- Suite 1150, 1775 Eye Street NW, USA, Washington DC 20006, USA
- Investments
- High Yield
- Private Equity
- Real Estate
- Real Estate
- RiverRun Estates
- Cytonn Towers
- The Ridge
- Taraji Heights
- The Alma