Review of Real Estate Investments Trusts (REITs) in Kenya, & Cytonn Weekly #06/2025
By Research Team, Feb 9, 2025
Executive Summary
Fixed Income
During the week, T-bills were oversubscribed, with the overall subscription rate coming in at 296.6%, a reversal from the subscription rate of 56.1% recorded the previous week. Investors’ preference for the shorter 91-day paper persisted, with the paper receiving bids worth Kshs 10.0 bn against the offered Kshs 4.0 bn, translating to an oversubscription rate of 250.0% significantly higher than the undersubscription rate of 61.6% recorded the previous week. The subscription rates for the 182-day and 364-day papers increased to 240.0% and 371.9% respectively, from the 28.6% and 81.3% recorded the previous week. The government accepted a total of Kshs 59.7bn worth of bids out of Kshs 71.2 bn bids received, translating to an acceptance rate of 83.9%.The yields on the government papers were on a downward trajectory with the yields on the 364-day paper decreasing the most by 55.5 bps to 10.8% from 11.3% recorded the previous week, while the yields on the 182-day and 91-day papers decreased by 50.9 bps and 40.6 bps respectively to 9.5% and 9.1% from 10.0% and 9.5% respectively recorded the previous week;
During the week, the government announced its first-ever domestic treasury bond buyback aiming to buyback Kshs 50.0 bn of Kshs 185.1 bn for the FXD1/2020/005, FXD1/2022/003 and IFB1/2016/009 with tenors to maturity of 0.4 years, 0.3 years and 0.4 years respectively, and fixed coupon rates of 11.7%, 11.8% and 12.5% respectively. The total outstanding amounts for the FXD1/2020/005, FXD1/2022/003 and IFB1/2016/009 are Kshs 104.5 bn, Kshs 60.6 bn and Kshs 19.9 bn each respectively. The period of the buy-back opened on 7th February 2025 and will close on 17th February 2025 with a settlement date of 19th February 2025. Our expectation is that the bond buyback will be undersubscribed, given the remaining short-term tenors to maturity of the bonds, as most investors may prefer to wait till maturity rather than sell at a potential discount. Additionally, if the government’s buyback price is not attractive then investors may prefer not sell leading to an undersubscription;
Also, during the week, the Monetary Policy Committee met on February 5th, 2024, to review the outcome of its previous policy decisions against a backdrop of improved global outlook for growth, lower but sticky inflation in advanced economies as well as the persistent geopolitical tensions. The MPC decided to lower the CBR rate by 50.0 bps to 10.75%, from 11.25% which was in line with our expectation for the MPC to lower the CBR rate to within a range of 10.25%-10.75%. Our expectation to cut the rate was mainly on the back of the need to support the economy by adopting an accommodative policy that will ease financing activities, rate cuts by some major economies, as well the continued stability of the Shilling against major currencies. The MPC additionally reduced the Cash Reserve Ratio (CRR) by 100.0 bps to 3.25% from 4.25% to increase liquidity and complement lowering of the CBR;
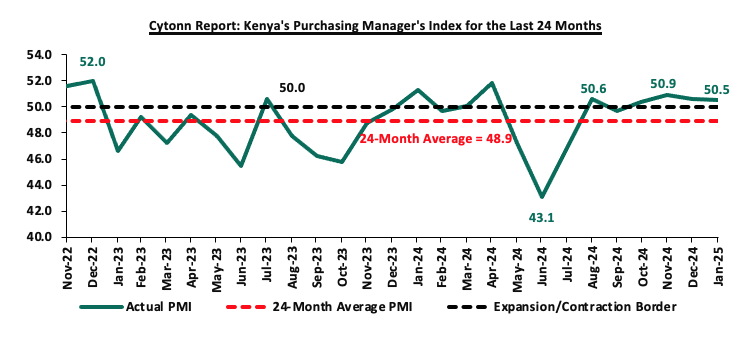
Additionally, during the week, Stanbic Bank released its monthly Purchasing Manager's Index (PMI) highlighting that the index for the month of January 2025 dropped slightly, coming in at 50.5, down from 50.6 in December 2024, signaling another marginal improvement in business conditions, though at a slower pace. This marked the fourth month that index fell above the 50.0 neutral mark. Increased output, new orders and easing of inflationary pressures supported the marginal improvement while employment losses posed challenges;
Equities
During the week, the equities market was on an upward trajectory, with NSE 10 and NSE 25 gaining the most by 2.1% each, while NSE 20 and NASI gained by 1.5% and 1.0% respectively, taking the YTD performance to gains of 6.6%, 3.4%, 1.5% and 1.0% for NSE 20, NASI, NSE 25 and NSE 10, respectively. The equities market performance was driven by gains recorded by large-cap stocks such as KCB, Safaricom and Stanbic of 5.4%, 4.4%, and 3.2% respectively. The gains were however, weighed down by losses recorded by large-cap stocks such as Cooperative Bank, Bamburi and NCBA of 3.0%, 2.5%, and 0.6% respectively;
During the week, Kenya Electricity Generating Company (KenGen), released its H1'2025 financial results for the period ended 31st December 2024, recording a Profit After Tax (PAT) of Kshs 5.3 bn, a 79.0% increase from the Kshs 3.0 bn recorded in H1’2024, majorly attributable to the 13.7% decrease in operating expenses to Kshs 17.7 bn from Kshs 20.5 bn recorded in H1’2024, which was driven by cost optimization strategies and cutting edge-efficiency enhancements across the power plants;
Real Estate
During the week, Knight Frank, an international Real Estate consultancy and management firm, released the Kenya Market Update H2’2024 Report highlighting the performance of key Real Estate sectors in the country,
During the week, a US-based infrastructure investment firm Everstrong Capital initiated efforts to secure local pension funds amounting to Kshs 452.2bn for financing the construction of the 440.0 kilometer Nairobi-Mombasa Expressway. This move comes as Everstrong Capital, in partnership with CPF Capital & Advisory, seeks to channel billions of shillings from pension funds to support the ambitious infrastructure project,
During the week, President Willian Ruto launched the upgrade of 205-Kilometer road connecting Isiolo, Kulamawe and Modogashe areas in Garba Tula during his visit to North Eastern Kenya. The upgrade is estimated to cost Kshs 21.6 bn according to Kenya National Highway Authority (KENHA). This upgrade is part of the governments border plan to connect Isiolo town and Mandera to boost access and trade with Somalia and Ethiopia. This road will connect Meru, Garissa, Isiolo, Wajir and Mandera counties and it will be a major boost to trade, economic growth and integration between the counties.
During the week, Majid Al Futtaim, the operator of Carrefour in Kenya, launched a new store at Masai Mall in Rongai, marking its 28th store in the country. The new store aims to improve convenience and accessibility for customers around Rongai area and has so far created direct jobs contributing to its current workforce of over 2,800 employees that the company has in Kenya,
On the Unquoted Securities Platform, Acorn D-REIT and I-REIT traded at Kshs 25.4 and Kshs 22.2 per unit, respectively, as per the last updated data on 31st January 2025. The performance represented a 27.0% and 11.0% gain for the D-REIT and I-REIT, respectively, from the Kshs 20.0 inception price. Additionally, ILAM Fahari I-REIT traded at Kshs 11.0 per share as of 31st January 2025, representing a 45.0% loss from the Kshs 20.0 inception price;
Focus of the Week
Real Estate Investment Trusts are crucial to the development given the limited funding available to the developers. Real Estate Investment Trusts (REITs) represent an innovative financing avenue for real estate development in Kenya. REITs provide a structured mechanism for pooling resources from multiple investors to finance or acquire income-generating real estate assets. The Capital Markets Authority (CMA) regulates REITs in Kenya, ensuring transparency and investor protection. Despite being relatively new in the Kenyan financial market, REITs have shown potential as a transformative tool for real estate financing;
Investment Updates:
- Weekly Rates: Cytonn Money Market Fund closed the week at a yield of 16.3% p.a. To invest, dial *809# or download the Cytonn App from Google Play store here or from the Appstore here;
- We continue to offer Wealth Management Training every Tuesday, from 7:00pm to 8:00 pm. The training aims to grow financial literacy among the general public. To register for any of our Wealth Management Trainings, click here;
- If interested in our Private Wealth Management Training for your employees or investment group, please get in touch with us through wmt@cytonn.com;
- Cytonn Insurance Agency acts as an intermediary for those looking to secure their assets and loved ones’ future through insurance namely; Motor, Medical, Life, Property, WIBA, Credit and Fire and Burglary insurance covers. For assistance, get in touch with us through insuranceagency@cytonn.com;
- Cytonn Asset Managers Limited (CAML) continues to offer pension products to meet the needs of both individual clients who want to save for their retirement during their working years and Institutional clients that want to contribute on behalf of their employees to help them build their retirement pot. To more about our pension schemes, kindly get in touch with us through pensions@cytonn.com;
Hospitality Updates:
- We currently have promotions for Staycations. Visit cysuites.com/offers for details or email us at sales@cysuites.com;
Money Markets, T-Bills Primary Auction:
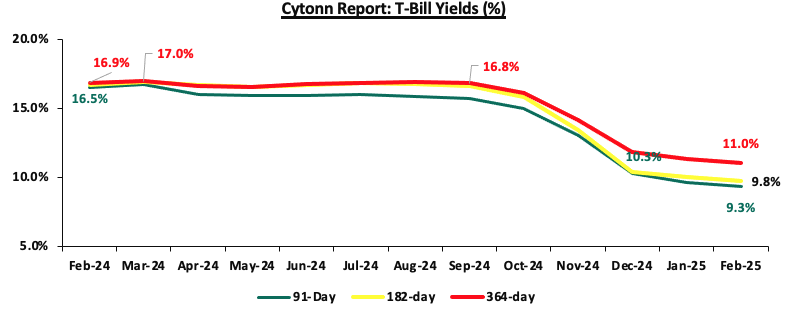
During the week, T-bills were oversubscribed, with the overall subscription rate coming in at 296.6%, a reversal from the subscription rate of 56.1% recorded the previous week. Investors’ preference for the shorter 91-day paper persisted, with the paper receiving bids worth Kshs 10.0 bn against the offered Kshs 4.0 bn, translating to an oversubscription rate of 250.0%, significantly higher than the undersubscription rate of 61.6%, recorded the previous week. The subscription rates for the 182-day and 364-day papers increased to 240.0% and 371.9% respectively, from the 28.6% and 81.3% recorded the previous week. The government accepted a total of Kshs 59.7bn worth of bids out of Kshs 71.2 bn bids received, translating to an acceptance rate of 83.9%.The yields on the government papers were on a downward trajectory with the yields on the 364-day paper decreasing the most by 55.5 bps to 10.8% from 11.3% recorded the previous week while the yields on the 182-day and 91-day papers decreased by 50.9 bps and 40.6 bps respectively to 9.5% and 9.1% from 10.0% and 9.5% respectively recorded the previous week.
The charts below show the yield performance of the 91-day, 182-day and 364-day papers from January 2024 to February 2025:
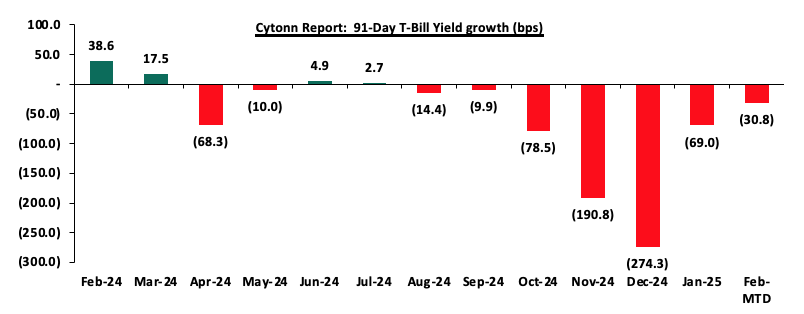
The chart below shows the yield growth for the 91-day T-bills:
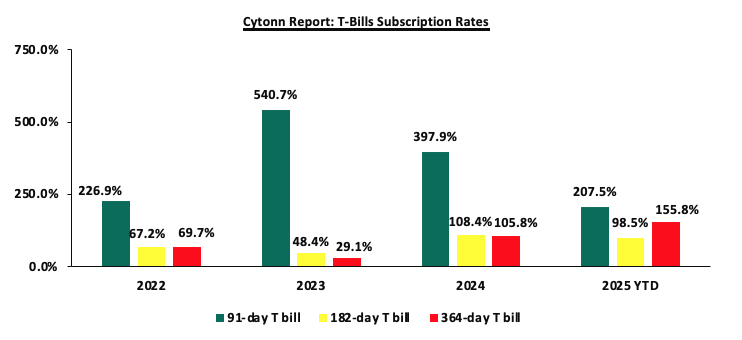
The chart below compares the overall average T-bill subscription rates obtained in 2022,2023, 2024 and 2025 Year-to-date (YTD):
During the week, the government announced its first-ever domestic treasury bond buyback aiming to buyback Kshs 50.0 bn of Kshs 185.1 bn of the FXD1/2020/005, FXD1/2022/003 and IFB1/2016/009 with tenors to maturity of 0.4 years, 0.3 years and 0.4 years respectively, and fixed coupon rates of 11.7%, 11.8% and 12.5% respectively. The total outstanding amounts of the FXD1/2020/005, FXD1/2022/003 and IFB1/2016/009 are Kshs 104.5 bn, Kshs 60.6 bn and Kshs 19.9 bn each respectively. The period of the buy-back opened on 7th February 2025 and will close on 17th February 2025 with a settlement date of 19th February 2025. Our expectation is that the bond buyback will be undersubscribed, given the remaining short-term tenors to maturity of the bonds, as most investors may prefer to wait till maturity rather than sell at a potential discount. Additionally, if the government’s buyback price is not attractive then investors may prefer not sell leading to an undersubscription;
Money Market Performance:
In the money markets, 3-month bank placements ended the week at 11.5% (based on what we have been offered by various banks), and the yields on the government papers were on a downward trajectory with the yields on the 364-day and 91-day papers decreasing by 55.5 bps and 40.6 bps to 10.8% and 9.1% from 11.3% and 9.5% recorded the previous week. The yield on the Cytonn Money Market Fund decreased by 10.0 bps to close the week at 16.3% from 16.4% recorded the previous week, while the average yields on the Top 5 Money Market Funds decreased by 6.6 bps to close the week at 15.7%, from 15.8% recorded the previous week.

The table below shows the Money Market Fund Yields for Kenyan Fund Managers as published on 7th February 2025:
|
Cytonn Report: Money Market Fund Yield for Fund Managers as published on 7th February 2025 |
||
|
Rank |
Fund Manager |
Effective Annual Rate |
|
1 |
Cytonn Money Market Fund (Dial *809# or download the Cytonn app) |
16.3% |
|
2 |
Gulfcap Money Market Fund |
16.3% |
|
3 |
Ndovu Money Market Fund |
15.5% |
|
4 |
Etica Money Market Fund |
15.3% |
|
5 |
Mali Money Market Fund |
15.2% |
|
6 |
Lofty-Corban Money Market Fund |
15.2% |
|
7 |
Kuza Money Market fund |
15.0% |
|
8 |
Arvocap Money Market Fund |
14.4% |
|
9 |
Orient Kasha Money Market Fund |
13.9% |
|
10 |
Dry Associates Money Market Fund |
13.7% |
|
11 |
Genghis Money Market Fund |
13.6% |
|
12 |
GenAfrica Money Market Fund |
13.6% |
|
13 |
Sanlam Money Market Fund |
13.2% |
|
14 |
Madison Money Market Fund |
13.2% |
|
15 |
British-American Money Market Fund |
12.9% |
|
16 |
Enwealth Money Market Fund |
12.6% |
|
17 |
Old Mutual Money Market Fund |
12.5% |
|
18 |
Jubilee Money Market Fund |
12.4% |
|
19 |
CIC Money Market Fund |
12.2% |
|
20 |
ICEA Lion Money Market Fund |
12.1% |
|
21 |
Nabo Africa Money Market Fund |
11.9% |
|
22 |
Co-op Money Market Fund |
11.9% |
|
23 |
Absa Shilling Money Market Fund |
11.9% |
|
24 |
KCB Money Market Fund |
11.6% |
|
25 |
Apollo Money Market Fund |
11.2% |
|
26 |
Faulu Money Market Fund |
11.2% |
|
27 |
AA Kenya Shillings Fund |
10.6% |
|
28 |
Mayfair Money Market Fund |
9.5% |
|
29 |
Stanbic Money Market Fund |
9.3% |
|
30 |
Equity Money Market Fund |
6.9% |
Source: Business Daily
Liquidity:
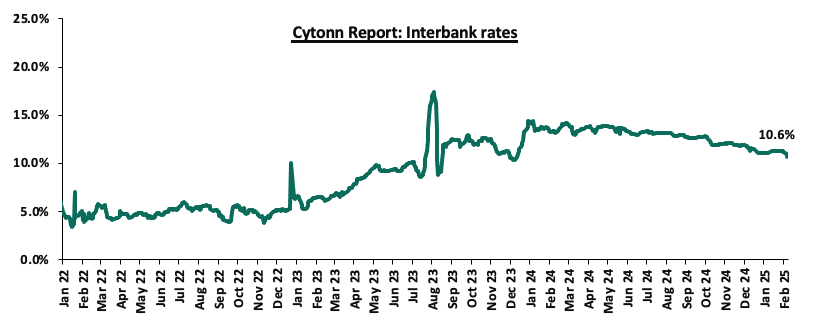
During the week, liquidity in the money markets eased, with the average interbank rate decreasing by 32.6 bps, to 10.9% from 11.2% recorded the previous week, partly attributable to tax remittances that were offset by government payments. The average interbank volumes traded decreased by 35.8% to Kshs 14.3 bn from Kshs 22.3 bn recorded the previous week. The chart below shows the interbank rates in the market over the years:
Kenya Eurobonds:
During the week, the yields on Kenya’s Eurobonds were on a downward trajectory, with the yield on the 10-year Eurobond issued in 2018 decreasing the most by 33.1 bps to 8.6% from 8.9% recorded the previous week. The table below shows the summary performance of the Kenyan Eurobonds as of 6th February 2025;
|
Cytonn Report: Kenya Eurobonds Performance |
||||||
|
|
2018 |
2019 |
2021 |
2024 |
||
|
Tenor |
10-year issue |
30-year issue |
7-year issue |
12-year issue |
13-year issue |
7-year issue |
|
Amount Issued (USD) |
1.0 bn |
1.0 bn |
0.9 bn |
1.2 bn |
1.0 bn |
1.5 bn |
|
Years to Maturity |
3.1 |
23.1 |
2.3 |
7.3 |
9.4 |
6.0 |
|
Yields at Issue |
7.3% |
8.3% |
7.0% |
7.9% |
6.2% |
10.4% |
|
02-Jan-25 |
9.1% |
10.3% |
8.5% |
10.1% |
10.1% |
10.1% |
|
30-Jan-25 |
8.9% |
10.2% |
8.4% |
9.9% |
9.9% |
10.0% |
|
31-Jan-25 |
8.9% |
10.2% |
8.4% |
9.9% |
10.0% |
10.0% |
|
03-Feb-25 |
9.1% |
10.3% |
8.5% |
10.1% |
10.1% |
10.1% |
|
04-Feb-25 |
8.9% |
10.2% |
8.4% |
9.9% |
10.0% |
10.0% |
|
05-Feb-25 |
8.5% |
10.1% |
8.2% |
9.6% |
9.7% |
9.7% |
|
06-Feb-25 |
8.6% |
10.1% |
8.2% |
9.7% |
9.7% |
9.7% |
|
Weekly Change |
(0.3%) |
(0.1%) |
(0.2%) |
(0.2%) |
(0.2%) |
(0.2%) |
|
MTD Change |
(0.5%) |
(0.2%) |
(0.3%) |
(0.4%) |
(0.4%) |
(0.3%) |
|
YTD Change |
(0.5%) |
(0.2%) |
(0.3%) |
(0.4%) |
(0.4%) |
(0.3%) |
Source: Central Bank of Kenya (CBK) and National Treasury
Kenya Shilling:
During the week, the Kenya Shilling appreciated against the US Dollar by 1.4 bps, to close the week at Kshs 129.2 relatively unchanged from the previous week. On a year-to-date basis, the shilling has appreciated by 7.3 bps against the dollar, compared to the 17.4% appreciation recorded in 2024.
We expect the shilling to be supported by:
- Diaspora remittances standing at a cumulative USD 4,945.0 mn in 2024, 18.0% higher than the USD 4,190.0 mn recorded in 2023. The United States remained the largest source of remittances to Kenya accounting for 51.0% in the period, and,
- The tourism inflow receipts which came in at USD 352. bn in 2023, a 31.5% increase from USD 268.1 bn inflow receipts recorded in 2022, and owing to tourist arrivals that improved by 14.6% in 2024, compared to 2023.
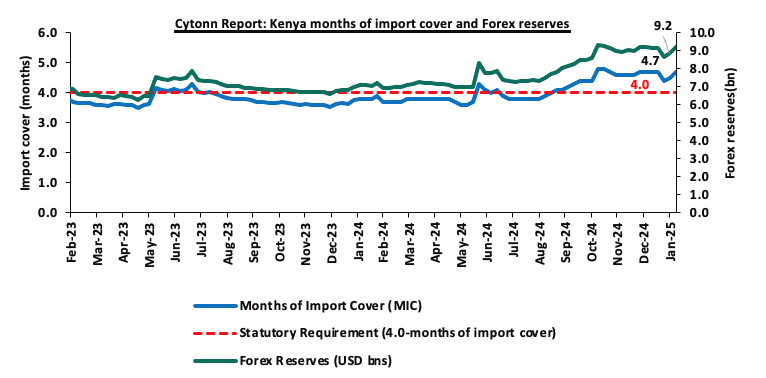
- Improved forex reserves currently at USD 9.2 bn (equivalent to 4.7-months of import cover), which is above the statutory requirement of maintaining at least 4.0-months of import cover and above the EAC region’s convergence criteria of 4.5-months of import cover.
The shilling is however expected to remain under pressure in 2025 as a result of:
- An ever-present current account deficit which came at 4.0% of GDP in Q3’2024 which remained relatively unchanged from Q3’2023 and,
- The need for government debt servicing, continues to put pressure on forex reserves given that 67.2% of Kenya’s external debt is US Dollar-denominated as of June 2024.
Key to note, Kenya’s forex reserves increased by 3.9% during the week, to USD 9.2 bn from the USD 8.9 bn recorded in the previous week, equivalent to 4.7 months of import cover compared to 4.5 months of import cover recorded last week and above the statutory requirement of maintaining at least 4.0-months of import cover. The chart below summarizes the evolution of Kenya's months of import cover over the years:
The chart below summarizes the evolution of Kenya's months of import cover over the years:
Weekly Highlights
- Monetary Policy Committee (MPC) February Meeting
The monetary policy committee met on February 5th, 2024, to review the outcome of its previous policy decisions against a backdrop of improved global outlook for growth, lower but sticky inflation in advanced economies as well as the persistent geopolitical tensions. The MPC decided to lower the CBR rate by 50.0 bps to 10.75%, from 11.25% which was in line with our expectation for the MPC to lower the CBR rate to within a range of 10.25%-10.75%. Our expectation to cut the rate was mainly on the back of the need to support the economy by adopting an accommodative policy that will ease financing activities, rate cuts by some major economies, as well the continued stability of the Shilling against major currencies. Additionally, the MPC lowered the Cash Reserve Ratio (CRR) by 100.0 bps to 3.25% from 4.25% to support lowering of lending rates through increasing liquidity and to complement lowering the CBR. Key to note, the MPC had cut the CBR rate to 11.25% in the previous meeting in December from 12.00%. Below are some of the key highlights from the February meeting:
- The overall inflation increased marginally by 0.3% points to 3.3% in January 2025, from 3.0% in December 2024, positioning it below the mid-point of the preferred CBK range of 2.5%-7.5%. Core inflation decreased to 2.0% in January 2025, from 2.2% in December 2024, reflecting subdued demand pressures in the economy. This decline was largely attributed to lower prices of processed food items, particularly sugar, maize, and wheat products. Conversely, non-core inflation increased to 7.1% in January 2025, from 5.2% in December 2024, driven by higher prices of food crops, especially vegetables, due to seasonal factors. Lower energy and utilities costs, including reduced electricity and fuel prices, continued to help moderate non-core inflation. Overall inflation is expected to stay below the mid-point of the target range in the near term, supported by low and stable core inflation, an anticipated reduction in energy prices, and a stable exchange rate.
- In January 2025, the Kenya National Bureau of Statistics (KNBS) and the Central Bank of Kenya (CBK) jointly introduced core and non-core inflation measures for Kenya. Core inflation excludes items with highly volatile or transient prices from the overall Consumer Price Index (CPI), offering a clearer view of underlying inflation trends. Alongside overall inflation, CBK will now monitor core and non-core inflation measures, aligning with global best practices of inflation-targeting central banks. This initiative also adheres to the East African Community (EAC) guidelines for harmonized CPI computation. The core CPI basket includes 275 items, representing 81.1% of the total CPI weight, making it a more accurate tool for tracking inflation trends, closely aligned with overall inflation.
- The recently released Quarterly Gross Domestic Product Report, for Q3’2024 showed a slowdown in the performance of the Kenyan economy, with real GDP growing by 4.0%, although slower than the growth of 6.0% recorded a similar period in 2023. This was attributable to deceleration in growth in most sectors of the economy, particularly agriculture and forestry, real estate, financial and insurance, information and communication, and transport and storage. The economy is expected to continue to strengthen in 2025 with real GDP growth projected at 5.4%, from the 4.6% growth projected for 2024 supported by resilient services sector, expected recovery in growth of credit to the private sector, sustained performance in agriculture, and enhanced exports. However, this positive outlook is tempered by potential risks, including geopolitical tensions.
- Goods exported increased by 15.4% in the 12 months to December 2024, compared to 2023, reflecting a rise in exports of agricultural commodities and re-exports. Goods imported rose by 9.9% reflecting increases in intermediate and capital goods imports. The current account deficit in 2024 is estimated at 3.7% of GDP, down from 4.0% in 2023, driven by stronger goods exports, robust diaspora remittance inflows, and reduced oil imports. In 2024, diaspora remittances rose by 18.0% totalling to USD 4,945.0 from USD 4,190.0 in 2023 and tourist arrivals in 2024 increased by 14.6%. The current account deficit was fully financed by capital and financial inflows, leading to an overall balance of payments surplus of USD 1,466.0 mn. This surplus, combined with IMF disbursements, resulted in a USD 2,749.0 mn build-up in gross reserves. For 2025, the current account deficit is projected at 3.8% of GDP and is expected to be fully financed by capital and financial inflows, yielding a balance of payments surplus of USD 591.0 mn and an increase in gross reserves of USD 1,451.0 mn.
- The CBK foreign exchange reserves, which currently stand at USD 9, 219.0 representing 4.7 months of import cover, continue to provide adequate cover and a buffer against any short-term shocks in the foreign exchange market,
- The banking sector remains stable and resilient, with strong liquidity and capital adequacy ratios. The ratio of gross non-performing loans (NPLs) to gross loans decreased to 16.4% in December 2024 compared to 16.5% in October 2024. Decreases in NPLs were noted in the manufacturing, trade, building and construction, real estate and energy and water sectors. Banks have continued to make adequate provisions for the NPLs,
- The CEOs Survey and Market Perceptions Survey conducted ahead of the MPC meeting revealed an improved optimism about business activity and economic growth prospects for the next 12 months. The optimism was attributed to the stable macroeconomic environment reflected in the low inflation rate and stability in the exchange rate, expectations of a decline in interest rates, favorable weather conditions supporting agriculture, resilience of the services sector, and improved global growth prospects. Nevertheless, respondents expressed concerns about high cost of doing business and subdued consumer demand,
- The Survey of the Agriculture Sector for January 2025 revealed an expectation for moderate upward pressure on overall headline inflation in the next three months, on account of higher vegetables and cereals prices attributed to seasonal factors. Nevertheless, respondents expressed that stability in pump prices and exchange rate are expected to moderate inflation,
- Global growth is expected to continue to recover and is projected at 3.3% in 2025 from an estimate of 3.2% in 2024, attributable to strong growth in the United States, strong growth in some large emerging market economies such as India, and improved growth prospects in the United Kingdom. The main risk to the global growth outlook relates to an elevated uncertainty on trade policy amid rising tariffs on imports and further escalation of geopolitical tensions particularly the conflict in the Middle East and the Russia-Ukraine war
- Global headline inflation has eased; however, the rate of decline has slowed in major economies due to persistent core inflation. Central banks in these economies have continued to reduce interest rates, though at varying speeds based on their inflation and growth projections. While international oil prices have moderated, the risk of volatility remains high, fuelled by rising import tariffs and ongoing geopolitical tensions. Meanwhile, food inflation has risen, primarily due to higher edible oil prices.
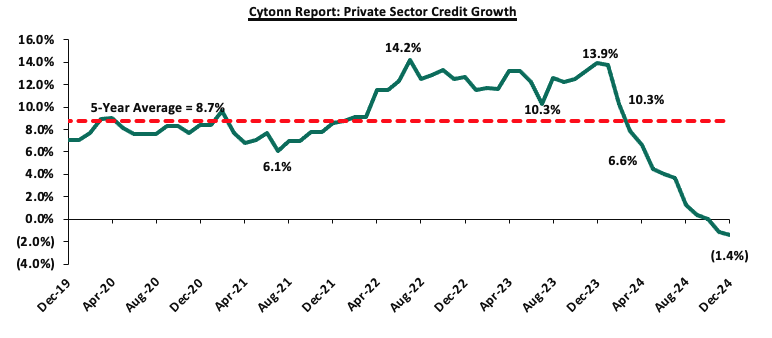
- Growth in private sector credit contracted by 1.4% in December 2024 compared to the previous year, mainly attributed to exchange rate valuation effects on foreign currency-denominated loans due to the appreciation of the Shilling and reduced demand attributable to high lending interest rates. In December, local currency loans grew by 2.1%, while foreign currency loans, which make up around 26.0% of total loans, decreased by 11.4%. The chart below shows the movement of the private sector credit growth over the last five years:
- The Committee acknowledged the ongoing implementation of the FY’2024/25 Supplementary Budget I. These measures are anticipated to further support fiscal consolidation, reducing the fiscal deficit to 4.3% of GDP in FY’2024/25, from 5.3% of GDP in FY’2023/24. The fiscal consolidation in the medium-term should reduce debt vulnerabilities while moving the present-value-of-debt to GDP ratio towards the target anchor of 55.0%.
The MPC noted that overall inflation is expected to remain below the midpoint of the 2.5%-7.5% target range in the near term, supported by stable core inflation, low energy prices, and exchange rate stability. Additionally, central banks in major economies have continued to lower interest rates at varying paces. The Committee also noted that economic growth slowed in 2024, creating room for further easing of monetary policy to support economic activity while maintaining exchange rate stability. The MPC stated that the CRR reduction would release additional liquidity to banks, which is expected to reduce the cost of funds, lower lending rates, and boost private sector credit growth. The Committee observed that despite significant reductions in the CBR since the August 2024 meeting, lending rates have only marginally declined. It emphasized that banks must take further action to reduce lending rates to stimulate private sector credit growth and support economic activity. To ensure compliance with the Risk-Based Credit Pricing Model (RBCPM), the CBK decided to initiate on-site inspections of banks to verify their alignment with the RBCPM in reducing interest rates. Recent amendments to the Banking Act empower the CBK to penalize any bank that fails to pass on the reduced cost of funds to borrowers. The MPC noted that it will continue to monitor the effects of these policy measures, as well as global and domestic economic developments, and will remain ready to take additional action if necessary. The next MPC meeting is scheduled for April 2025.
- Stanbic Bank’s January 2025 Purchasing Manager’s Index (PMI)
During the week, Stanbic Bank Kenya PMI released its January 2025 PMI report showing a marginal improvement in business conditions, coming in at 50.5, albeit down from 50.6 in December 2024, signaling another marginal improvement in business conditions. This marked the fourth month that index fell above the 50.0 neutral mark. Increased output, new orders and easing of inflationary pressures supported the marginal improvement while employment losses posed challenges. On a year-to-year basis, the index recorded a 1.4% increase from the 49.8 recorded in January 2024. The modest improvement of the general business environment is mainly attributable to inflation remaining relatively low in January coming in at 3.3%, remaining within the Central Bank of Kenya (CBK) target range of 2.5% to 7.5% for the nineteenth consecutive month. However, this was a slight increase of 0.3% points from 3.0% in December 2024 attributable to increase in fuel prices with prices for Super Petrol, Diesel and Kerosene increasing by Kshs 0.3, Kshs 2.0 and Kshs 3.0 respectively to retail at Kshs 176.6, Kshs 167.1 and Kshs 151.4 per litre respectively.
The average input charges increased, attributable to the higher taxes on imported materials amid the continued appreciation of the Shilling against the dollar. Meanwhile, output prices rose, just marginally. The sector data showed an increase in output, for the fourth consecutive month attributable to the higher sales resulting from increased marketing and easing inflationary pressures. However, economic hardships and decline in customer demand tightened the output. With increasing sales, purchasing activity at Kenyan firms increased in January, reflecting stronger consumer spending, helping businesses to raise their inventories. However, employment numbers fell for the first time in five months in January, with most firms maintaining their staffing levels.
Private sector prices increased marginally in January for the third consecutive month. The higher purchasing costs led to price increases. Notably, overall sentiment towards future activity of the Kenyan business environment remained positive. The outlook reflected anticipated investment in marketing and new products and services. Key to note, a PMI reading of above 50.0 indicates an improvement in the business conditions, while readings below 50.0 indicate a deterioration. The chart below summarizes the evolution of PMI over the last 24 months
Going forward, we anticipate that the business environment will improve in the short to medium term as a result of the improving economic environment driven by lower interest rates following the easing monetary policy with the CBR decreasing by 50.0 bps to 10.75% from 11.25% in February 2025, the stability of the Kenyan Shilling against the USD and the low inflation rates currently at 3.3% and stable fuel prices. However, we expect businesses to be weighed down by the high cost of living coupled with the high taxation, which are set to increase input costs. Overall the private sector is expected to continue with the recovery albeit with potential headwinds in the coming months.
Rates in the Fixed Income market have been on a downward trend due to high liquidity in the money market which allowed the government to front load most of its borrowing. The government is 128.4% ahead of its prorated net domestic borrowing target of Kshs 251.3 bn, and 40.5% ahead of the total FY’2024/25 net domestic borrowing target of Kshs 408.4 bn, having a net borrowing position of Kshs 573.9 bn. However, we expect a continued downward readjustment of the yield curve in the short and medium term, with the government looking to increase its external borrowing to maintain the fiscal surplus, hence alleviating pressure in the domestic market. As such, we expect the yield curve to normalize in the short to medium-term and hence investors are expected to shift towards the long-term papers to lock in the high returns.
Market Performance
During the week, the equities market was on an upward trajectory, with NSE 10 and NSE 25 gaining the most by 2.1% each, while NSE 20 and NASI gained by 1.5% and 1.0% respectively, taking the YTD performance to gains of 6.6%, 3.4%, 1.5% and 1.0% for NSE 20, NASI, NSE 25 and NSE 10, respectively. The equities market performance was driven by gains recorded by large-cap stocks such as KCB, Safaricom and Stanbic of 5.4%, 4.4%, and 3.2% respectively. The gains were however, weighed down by losses recorded by large-cap stocks such as Cooperative Bank, Bamburi and NCBA of 3.0%, 2.5%, and 0.6% respectively.
During the week, equities turnover increased by 21.6% to USD 21.1 mn, from USD 17.3 mn recorded the previous week, taking the YTD total turnover to USD 95.1 mn. Foreign investors became net sellers for the third consecutive week, with a net selling position of USD 7.4 mn, from a net selling position of USD 3.1 mn recorded the previous week, taking the YTD foreign net selling position to USD 15.5 mn.
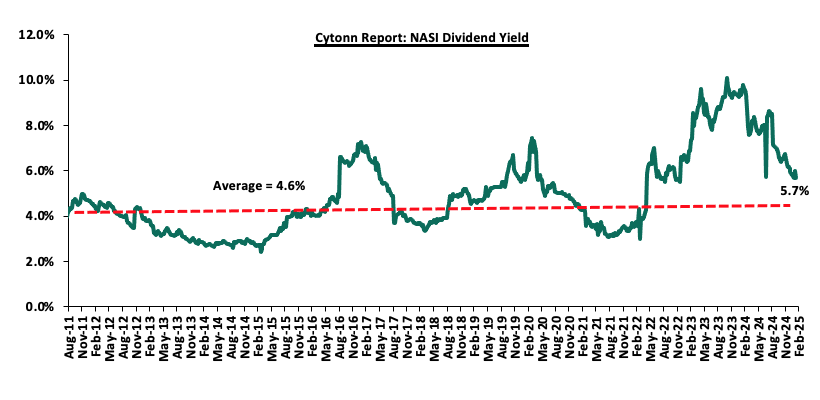
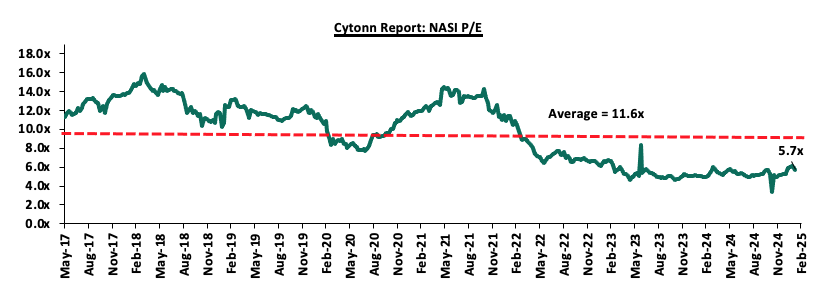
The market is currently trading at a price-to-earnings ratio (P/E) of 5.7x, 50.6% below the historical average of 11.6x. The dividend yield stands at 5.7%, 1.1% points above the historical average of 4.6%. Key to note, NASI’s PEG ratio currently stands at 0.7x, an indication that the market is undervalued relative to its future growth. A PEG ratio greater than 1.0x indicates the market is overvalued while a PEG ratio less than 1.0x indicates that the market is undervalued. The charts below indicate the historical P/E and dividend yields of the market;
Universe of Coverage:
|
Cytonn Report: Equities Universe of Coverage |
||||||||||
|
Company |
Price as at 31/01/2025 |
Price as at 07/02/2025 |
w/w change |
YTD Change |
Year Open 2025 |
Target Price* |
Dividend Yield*** |
Upside/ Downside** |
P/TBv Multiple |
Recommendation |
|
Jubilee Holdings |
200.0 |
200.0 |
0.0% |
14.4% |
174.8 |
260.7 |
7.2% |
37.5% |
0.3x |
Buy |
|
Equity Group |
47.2 |
48.0 |
1.7% |
0.0% |
48.0 |
60.2 |
8.5% |
36.0% |
0.9x |
Buy |
|
Co-op Bank |
16.6 |
16.1 |
(3.0%) |
(8.0%) |
17.5 |
18.8 |
9.1% |
22.7% |
0.8x |
Buy |
|
NCBA |
48.5 |
48.2 |
(0.6%) |
(5.5%) |
51.0 |
53.2 |
9.8% |
19.5% |
0.9x |
Accumulate |
|
KCB Group |
42.8 |
45.1 |
5.4% |
6.3% |
42.4 |
50.3 |
0.0% |
17.7% |
0.7x |
Accumulate |
|
Stanbic Holdings |
139.0 |
143.5 |
3.2% |
2.7% |
139.8 |
145.3 |
11.0% |
15.6% |
0.9x |
Accumulate |
|
ABSA Bank |
18.0 |
18.3 |
1.7% |
(3.2%) |
18.9 |
19.1 |
8.6% |
15.0% |
1.4x |
Accumulate |
|
Standard Chartered Bank |
278.5 |
279.5 |
0.4% |
(2.0%) |
285.3 |
291.2 |
10.4% |
15.0% |
1.9x |
Accumulate |
|
Diamond Trust Bank |
70.0 |
69.8 |
(0.4%) |
4.5% |
66.8 |
71.1 |
7.1% |
8.7% |
0.3x |
Hold |
|
CIC Group |
2.7 |
2.8 |
2.2% |
29.9% |
2.1 |
2.8 |
4.8% |
7.7% |
0.9x |
Hold |
|
I&M Group |
33.7 |
35.5 |
5.3% |
(1.4%) |
36.0 |
32.3 |
7.6% |
3.4% |
0.7x |
Lighten |
|
Britam |
7.3 |
7.0 |
(3.6%) |
20.3% |
5.8 |
7.5 |
0.0% |
3.3% |
1.0x |
Lighten |
|
*Target Price as per Cytonn Analyst estimates **Upside/ (Downside) is adjusted for Dividend Yield ***Dividend Yield is calculated using FY’2023 Dividends |
||||||||||
Weekly Highlights:
- Kenya Electricity Generating Company (KenGen) H1’2025 Financial Performance
During the week, Kenya Electricity Generating Company (KenGen), released its H1'2025 financial results for the period ended 31st December 2024, recording a Profit After Tax (PAT) of Kshs 5.3 bn, a 79.0% increase from the Kshs 3.0 bn recorded in H1’2024, majorly attributable to the 13.7% decrease in operating expenses to Kshs 17.7 bn from Kshs 20.5 bn recorded in H1’2024, which was driven by cost optimization strategies and cutting edge-efficiency enhancements across the power plants. However, net revenue decreased by 5.6% to Kshs 23.4 bn in H1’2025, from Kshs 24.7 bn in H1’2024 mainly driven by the 3.6% decrease in topline revenue to Kshs 27.5 bn from Kshs 28.5 bn in H1’2024. Notably, finance costs reduced by 23.8% to Kshs 1.1 bn, from Kshs 1.5 bn in H1’2024, showcasing improved capital efficiency and optimized debt management. The tables below show the breakdown of KenGen’s financial performance;
|
Cytonn Report: Kenya Electricity Generating Company (KenGen) H1'2025 Performance |
|||
|
Income Statement |
H1'2024 Kshs (bn) |
H1'2025 Kshs (bn) |
% Change |
|
Revenue |
28.5 |
27.5 |
(3.6%) |
|
Fuel & Water Costs |
(3.8) |
(4.1) |
9.1% |
|
Revenue Net Reimbursable Expenses |
24.7 |
23.4 |
(5.6%) |
|
Other Income |
0.3 |
0.6 |
86.7% |
|
Gains/(Losses) on Net Forex & Fair Valuation of Financial assets |
(0.1) |
0.4 |
242.6% |
|
Expenses |
(20.5) |
(17.7) |
(13.7%) |
|
Operating Profit |
4.4 |
6.6 |
49.4% |
|
Finance Income |
1.9 |
2.4 |
30.5% |
|
Finance Cost |
(1.5) |
(1.1) |
(23.8%) |
|
Profit/(Loss) Before Tax |
4.8 |
8.0 |
64.7% |
|
Income Tax |
(1.9) |
(2.7) |
42.1% |
|
Profit/(Loss) After Tax |
3.0 |
5.3 |
79.0% |
|
Earnings Per Share (EPS) |
0.5 |
0.8 |
77.8% |
Source: Kenya Electricity Generating Company (KenGen) H1’2025 Financial Report,
|
Cytonn Report: Kenya Electricity Generating Company (KenGen) H1'2025 Performance |
|||
|
Balance Sheet |
H1'2024 Kshs (bn) |
H1'2025 Kshs (bn) |
% Change |
|
Non-Current Assets |
481.6 |
440.6 |
(8.5%) |
|
Current Assets |
51.9 |
54.2 |
4.4% |
|
Total Assets |
533.5 |
494.8 |
(7.2%) |
|
Non-Current Liabilities |
234.9 |
194.4 |
(17.2%) |
|
Current Liabilities |
23.4 |
21.3 |
(9.2%) |
|
Total Liabilities |
258.3 |
215.7 |
(16.5%) |
|
Total Equity |
275.2 |
279.1 |
1.4% |
Source: Kenya Electricity Generating Company (KenGen) H1’2025 Financial Report
Key take outs from the financial performance include;
- Net revenue decreased by 5.6% to Kshs 23.4 bn in H1’2025, from Kshs 24.7 bn recorded in H1’2024, mainly driven by the 3.6% decrease in gross revenue to Kshs 27.5 bn from Kshs 28.5 bn in H1’2024. The decline was further weighed down by a 9.1% increase in fuel and water costs to Kshs 4.1 bn from Kshs 3.8 bn in H1’2024.
- Income tax expense increased by 42.1% to Kshs 2.7 bn from Kshs 1.9 bn in H1’2024, attributed to the increased profits,
- Operating profit increased by 49.4% to Kshs 6.6 bn in H1’2025 from Kshs 4.4 bn in H1’2024, largely driven by the 13.7% decline in expenses to Kshs 17.7 bn in H1’2024, from Kshs 20.5 bn in H1’2024 accompanied by an increase in other income by 86.7% to Kshs 0.6 bn in H1’2025 from Kshs 0.3 bn in H1’2024 and a 242.6% increase in gains by financial assets at a fair value to Kshs 0.4 bn in H1’2025, a reversal of the loss of Kshs 0.1 bn recorded in H1’2024. The significant 242.6% increase in the gains on net forex and fair valuation of financial assets was largely driven by the 17.4% appreciation of the Kenyan Shilling against the US Dollar during the period under review,
- The balance sheet recorded a contraction as total assets declined by 7.2% to Kshs 494.8 bn in H1’2025 from Kshs 533.5 bn in H1’2024, attributable to the 8.5% decrease in the non-current assets to Kshs 440.6 bn from Kshs 481.6 bn in H1’2024. The performance was however supported by the 4.4% increase in the current assets to Kshs 54.2 from Kshs 51.9 bn in H1’2024,
- The current liabilities decreased by 9.2% to Kshs 21.3 bn in H1’2025, from Kshs 23.4 bn recorded in H1’2024,
- Earnings per share increased by 77.8% to Kshs 0.8 in H1’2025, from Kshs 0.5 in H1’2024, mainly due to the 79.0% increase in the company’s profit after tax to Kshs 5.3 bn in H1’2025 from Kshs 3.0 bn in H1’2024, and,
- The board of directors have not recommended an interim dividend for the period, consistent with H1’2024, where no interim dividend was declared.
Going forward, we expect the company’s earnings to be supported by robust profitability, improved efficiency and growth in strategic investments. Notably, the company has continued to implement strategies to increase production and revenue such as the G2G 2034 Strategy which aims at driving Kenya’s energy transition towards sustainable and affordable power generation. The company plans to add 194.4MW of capacity through geothermal, hydro and solar power projects, along with 200MW of battery energy storage, to ensure a competitive and sustainable energy supply for the country. The company is set to sell an additional 1.8 mn Certified Emission Reductions (CERs). These projects will further diversify the company’s energy portfolio and increase its installed capacity in turn reducing the company’s carbon footprint, reinforcing its commitment to sustainability, innovation, environmental responsibility, and responsible growth.
We are “Bullish” on the Equities markets in the short term due to current cheap valuations, lower yields on short-term government papers and expected global and local economic recovery, and, “Neutral” in the long term due to the adverse operating environment and huge foreign investor outflows.
With the market currently trading at a discount to its future growth (PEG Ratio at 0.7x), we believe that investors should reposition towards value stocks with strong earnings growth and that are trading at discounts to their intrinsic value. We expect the current high foreign investors sell-offs to continue weighing down the economic outlook in the short term.
- Industry Report
- Kenya Market Update H2’2024 Report by Knight Frank
During the week, Knight Frank, an international Real Estate consultancy and management firm, released the Kenya Market Update H2’2024 Report highlighting the performance of key Real Estate sectors in the country. The following were the key take outs from the report:
- In the residential sector, the average selling prices for prime housing units increased by 8.3% points in H2’2024, the performance was higher than the 2.5% surge recorded in H2’2023. The increased appreciation is largely attributable to the increase in demand of reasonably prime properties from high net-worth individuals and the expatriate market, and a calm business environment in the period under review save for June which experienced anti-government demonstrations. Additionally, during the period under review, the average monthly rents increased by 6.6% compared to 5.9% increase in the same period last year. The performance can be attributed to the periodic rental reviews, and the increase in demand for quality and prime housing. There is a growing consumer awareness among buyers, leading them to demand value for their money, which is compelling developers to present high-quality properties in the market to meet consumer needs and expectations,
- The average monthly asking rents for prime commercial office spaces remained relatively unchanged at USD 1.2 per SQFT in H2’2024 since H1’2023. Commercial office space occupancy however, slightly decreased by 4.5% to 72.7% in H2’2024 from 77.2% recorded in H1’2024. The performance was attributable to a challenging economic environment during the period reducing the take up of the prime office spaces. Additionally, release of the new spaces such as Purple towers along Mombasa road, Highway Heights in Kilimani, Matrix One, the Mandrake and Museaum Hill Towers in Westlands adding a total of 522,284 Sq.ft. This additional space caused a downward pressure on occupancy levels. There is however, limited supply of grade A offices, and, increased uptake of existing A-grade properties. Additionally, the growth of grade A office continued driven by growing demand from international investors, governments, diplomatic missions, and multinational corporations attracted by Kenya’s appeal as a top investment destination in Africa. Furthermore, many organizations are showing preference for physical offices to the working-from-home model. This has facilitated continued expansion of the flexible workspaces market in Nairobi,
- In the retail sector, monthly rents for prime retail space range from over Kshs 600 per per SQFT to Kshs 700 per SQFT in Nairobi. Rent increases are attributed to higher demand for strategically located shops in higher income prime retail developments, with prime malls continuing to register occupancy rates exceeding 90.0% in H2’2024, coupled with reduced disposable incomes and the surge in e-commerce, is prompting retailers to recalibrate their customer outreach strategies, and,
- The industrial sector continues to grow, driven by the expansion of Export Processing Zones (EPZs), Special Economic Zones (SEZs), and increasing demand for data centers. During the period under review, Nairobi Gate Industrial Park SEZ began its USD 7.0 mn fifth phase adding 130,000 sqm of modular warehouses to boost light manufacturers. Tatu City, Tilisi, and Vipingo SEZs have seen major moves by firms like Centum, Vecare, Hewatele, Kim-Fay etc who broke ground in the period under review. The Industrial sector however remained subdued by high production costs especially electricity costs. These high costs deter investors who may be interested in investing in Kenyan Industrial market
The findings of this report are in line with our H1’2024 Markets Review Report which highlighted a rise in occupancy rates by 0.4% points to 80.7% in 2024 from 80.3% in 2023 within the commercial office sector in the region. We maintain our view that the Real Estate sector's performance will mainly be driven by several factors: i) growing foreign investment in the retail segment, ii) strong housing demand driven by favourable demographics, iii) government investments in infrastructure development, iv) the Affordable Housing Program (AHP) initiatives, v) a rise in international arrivals boosting the hospitality sector, vi) aggressive expansion by local and international retailers, and, vii) a growing trend towards coworking office spaces. However, the sector's growth may face challenges such as: i) an oversupply of space in some Real Estate classes, ii) rising construction and production costs, iii) prolonged building approval processes, and, iv) stricter lending measures imposed on developers due to increased credit risks
- Infrastructure sector
- Construction of the 440.0 kilometer Nairobi-Mombasa Expressway
During the week, a US-based infrastructure investment firm Everstrong Capital initiated efforts to secure local pension funds amounting to Kshs 452.2bn for financing the construction of the 440.0 kilometer Nairobi-Mombasa Expressway. This move comes as Everstrong Capital, in partnership with CPF Capital & Advisory, seeks to channel billions of shillings from pension funds to support the ambitious infrastructure project.
CPF Capital & Advisory, a subsidiary of CPF Financial Services, will provide transaction advisory and placement services for the Usahihi Expressway Project. This project aims to decongest the current highway, enhancing travel efficiency between Nairobi and Mombasa. Given that pension funds in Kenya hold substantial assets—amounting to Kshs 2.0 tn as of June 2024—Everstrong's initiative represents a significant shift in financing mechanisms for large-scale infrastructure.
Previously, the Kenyan government had suspended the Nairobi-Mombasa Expressway project in 2018 due to concerns about debt accumulation. However, renewed interest in private sector involvement is reshaping its financing approach. Everstrong Capital had earlier signed a Kshs 465.1bn agreement with the Kenya National Highways Authority (KeNHA) to oversee the project. Apart from the expressway, Kenya is also targeting dual-carriage expansion of the Nairobi-Nakuru-Mau Summit highway under a Public-Private Partnership (PPP). The government had initially sought foreign contractors for the project but later terminated the deal due to concerns over revenue projections and financial sustainability.
The renewed financing strategy—leveraging pension funds—indicates a shift toward domestic capital mobilization for infrastructure projects. If successful, this model could reduce reliance on external debt, encourage private-sector participation, and enhance long-term investment returns for pensioners. Ultimately, improved road networks will boost trade, facilitate regional integration, and drive real estate development along major transport corridors.
We expect that the expressway improve accessibility and this will typically drive up property values in adjacent areas as commercial and residential developments become more attractive. Investors are already forecasting a surge in demand for properties along the new route. Commercial properties, including office parks, retail canters, and logistics hubs, are expected to benefit from increased business activity, while residential developments may see a rise in demand due to enhanced commuter convenience. This dual boost can create a positive feedback loop—higher property valuations, improved tenant demand, and increased investor confidence—which collectively contribute to a more vibrant and diversified real estate market.
- Launching of Isiolo-Kulamawe-Modogashe Road upgrade
During the week, President Willian Ruto launched the upgrade of 205-Kilometer road connecting Isiolo, Kulamawe and Modogashe areas in Garba Tula during his visit to North Eastern Kenya. The upgrade is estimated to cost Kshs 21.6 bn according to Kenya National Highway Authority (KENHA). This upgrade is part of the governments border plan to connect Isiolo town and Mandera to boost access and trade with Somalia and Ethiopia. This road will connect Meru, Garissa, Isiolo, Wajir and Mandera counties and it will be a major boost to trade, economic growth and integration between the counties. Additionally, the president launched the Horn of Africa gateway development project in Garbatula Isiolo.
We expect this road development will boost trade and economic activities between the five counties improving the livelihood of the locals in these areas. Also, this road will open up areas where accessibility has been an issue and more interactions will be witnessed. Properties along the road will see a surge in prices boosted by the infrastructure.
- Retail Sector
During the week, Majid Al Futtaim, the operator of Carrefour in Kenya, launched a new store at Masai Mall in Rongai, marking its 28th store in the country. The new store aims to improve convenience and accessibility for customers around Rongai area and has so far created direct jobs contributing to its current workforce of over 2,800 employees the company has in Kenya. The following table outlines the current store counts of major local and international supermarket chains operating in Kenya and international supermarket chains operating in Kenya;
|
Cytonn Report: Main Local and International Retail Supermarket Chains |
||||||||||||
|
# |
Name of retailer |
Category |
Branches as at FY’2018 |
Branches as at FY’2019 |
Branches as at FY’2020 |
Branches as at FY’2021 |
Branches as at FY’2022 |
Branches as at FY’2023 |
Branches as at FY’2024 |
Branches opened in FY’2025 |
Closed Branches |
Current Branches |
|
1 |
Naivas |
Hybrid* |
46 |
61 |
69 |
79 |
91 |
99 |
105 |
0 |
0 |
105 |
|
2 |
Quick Mart |
Hybrid** |
10 |
29 |
37 |
48 |
55 |
59 |
60 |
0 |
0 |
60 |
|
3 |
Chandarana |
Local |
14 |
19 |
20 |
23 |
26 |
26 |
29 |
0 |
0 |
29 |
|
4 |
Carrefour |
International |
6 |
7 |
9 |
16 |
19 |
22 |
26 |
2 |
0 |
28 |
|
5 |
Cleanshelf |
Local |
9 |
10 |
11 |
12 |
12 |
15 |
15 |
0 |
0 |
15 |
|
6 |
Jaza Stores |
Local |
0 |
0 |
0 |
0 |
0 |
4 |
13 |
0 |
0 |
13 |
|
7 |
China Square |
International |
0 |
0 |
0 |
0 |
0 |
2 |
5 |
2 |
0 |
7 |
|
8 |
Tuskys |
Local |
53 |
64 |
64 |
6 |
6 |
5 |
5 |
0 |
59 |
5 |
|
9 |
Uchumi |
Local |
37 |
37 |
37 |
2 |
2 |
2 |
2 |
0 |
35 |
2 |
|
10 |
Panda Mart |
International |
0 |
0 |
0 |
0 |
0 |
0 |
1 |
0 |
0 |
1 |
|
11 |
Game Stores |
International |
2 |
2 |
3 |
3 |
0 |
0 |
0 |
0 |
3 |
0 |
|
12 |
Choppies |
International |
13 |
15 |
15 |
0 |
0 |
0 |
0 |
0 |
15 |
0 |
|
13 |
Shoprite |
International |
2 |
4 |
4 |
0 |
0 |
0 |
0 |
0 |
4 |
0 |
|
14 |
Nakumatt |
Local |
65 |
65 |
65 |
0 |
0 |
0 |
0 |
0 |
65 |
0 |
|
Total |
257 |
313 |
334 |
189 |
211 |
234 |
261 |
4 |
181 |
265 |
||
|
*51% of Naivas Supermarket owned by IBL Group (Mauritius), Proparco (France), and DEG (Germany), while 49% owned by Gakiwawa Family (Kenya) |
||||||||||||
|
**More than 50% of Quickmart Supermarket owned by Adenia Partners (Mauritius), while Less than 50% owned by Kinuthia Family (Kenya) |
||||||||||||
Source: Cytonn research
Going forward into 2025, we expect to witness more retailers rolling out their expansion activities for the year, driven by increased investments from both local and international investors, the availability of retail space, a growing consumer base, and evolving consumer preferences in the country.
- Real Estate Investments Trusts (REITs)
On the Unquoted Securities Platform, Acorn D-REIT and I-REIT traded at Kshs 25.4 and Kshs 22.2 per unit, respectively, as per the last updated data on 31st January 2025. The performance represented a 27.0% and 11.0% gain for the D-REIT and I-REIT, respectively, from the Kshs 20.0 inception price. The volumes traded for the D-REIT and I-REIT came in at Kshs 12.8 mn and Kshs 34.8 mn shares, respectively, with a turnover of Kshs 323.5 mn and Kshs 722.8 mn, respectively, since inception in February 2021. Additionally, ILAM Fahari I-REIT traded at Kshs 11.0 per share as of 31st January 2025, representing a 45.0% loss from the Kshs 20.0 inception price. The volume traded to date came in at 138,600 shares for the I-REIT, with a turnover of Kshs 1.5 mn since inception in November 2015.
REITs offer various benefits, such as tax exemptions, diversified portfolios, and stable long-term profits. However, the ongoing decline in the performance of Kenyan REITs and the restructuring of their business portfolios are hindering significant previous investments. Additional general challenges include:
- Insufficient understanding of the investment instrument among investors leading to a slower uptake of REIT products,
- Lengthy approval processes for REIT creation,
- High minimum capital requirements of Kshs 100.0 mn for REIT trustees compared to Kshs 10.0 mn for pension funds Trustees, essentially limiting the licensed REIT Trustee to banks only
- The rigidity of choice between either a D-REIT or and I-REIT forces managers to form two REITs, rather than having one Hybrid REIT that can allocate between development and income earning properties
- Limiting the type of legal entity that can form a REIT to only a trust company, as opposed to allowing other entities such as partnerships, and companies,
- We need to give time before REITS are required to list – they would be allowed to stay private for a few years before the requirement to list given that not all companies maybe comfortable with listing on day one, and,
- Minimum subscription amounts or offer parcels set at Kshs 0.1 mn for D-REITs and Kshs 5.0 mn for restricted I-REITs. The significant capital requirements still make REITs relatively inaccessible to smaller retail investors compared to other investment vehicles like unit trusts or government bonds, all of which continue to limit the performance of Kenyan REITs.
We expect Kenya’s Real Estate sector to remain on a growth trend, supported by: i) demand for housing sustained by positive demographics, such as urbanization and population growth rates of 3.8% p.a and 2.0% p.a, respectively, against the global average of 1.7% p.a and 0.9% p.a, respectively, as at 2023,, ii) activities by the government under the Affordable Housing Program (AHP) iii) heightened activities by private players in the residential sector iv) increased investment by local and international investors in the retail sector. However, challenges such as rising construction costs, strain on infrastructure development (including drainage systems), high capital requirements for REITs, and existing oversupply in select Real Estate sectors will continue to hinder the sector’s optimal performance by limiting developments and investments.
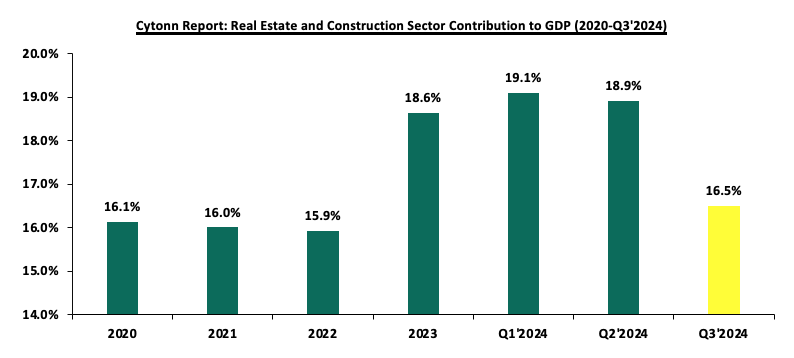
In 2024, the general Real Estate sector continued to witness considerable growth in activity in terms of property transactions and development activities. Consequently, the sector’s activity contribution to Gross Domestic Product (GDP) grew by 5.5 % to Kshs 283.8 bn in Q3’2024, from Kshs 268.9 bn recorded during the same period in 2023. In addition, the sector contributed 10.8% to the country’s GDP, 0.3% points increase from 10.5% recorded in Q3’2023. Cumulatively, the Real Estate and construction sectors contributed 16.5% to GDP, 0.2% points lower than 16.7% in Q3’2023, contributable to decline in construction contribution to GDP by 0.4% points, to 5.7% in Q3’2024, from 6.1% recorded in Q3’2023. The decline in Construction sector was attributable to the high cost of building materials that led to a 2.0% contraction in the construction sector in Q3’2024, compared to a 4.0% growth in Q3’2023. The graph below highlights the Real Estate and Construction sectors’ contribution to GDP from 2020 to Q3’2024;
Source: Kenya National Bureau of Statistics (KNBS)
Some of the key factors that continued to positively shape the performance of the Real Estate sector include; i) The government's ongoing focus on the Affordable Housing Program has been a major driver of growth,ii) Continuous improvements in infrastructure, such as new roads, bridges, and utilities, have opened up previously inaccessible areas for real estate development, iii) Kenya Mortgage Refinance Company (KMRC) has continued to drive the availability and affordability of home loans to Kenyans by providing single-digit fixed rate, and long-term finance to Primary Mortgage Lenders (PMLs) such as banks and SACCOs, iv) the retail landscape has seen a surge in growth, with both domestic and international retailers like Naivas, QuickMart, China Square, and Carrefour aggressively expanding their market presence, v) Kenya continues to enjoy recognition as a regional business hub, vi) high urbanization and population growth rates of 3.8% p.a and 2.0% p.a, respectively, against the global average of 1.7% p.a and 0.9% p.a, respectively, as at 2023, there is a sustained demand for more housing units in the country, vii) increase in investor confidence has greatly influenced hospitality sector and this is evident through mergers, acquisitions and expansions of hotels, viii) increased popularity of purpose-built properties to host Student housing, medical centers, Diplomatic residentials, data centers which offer potential for growth to the Real Estate sector through alternative markets.
Despite the above cushioning factors, there were various challenges that impeded the optimum performance of the Real Estate sector such as; i) rising Construction costs increased by 17.6% in 2024 to an average of Kshs 83,731 per SQM from an average of Kshs 71,200 per SQM recorded in 2023, ii) existing oversupply of physical space in select sectors, iii)The REITs market in Kenya continues to be subdued owing to various challenges such as the large capital requirements of Kshs 100.0 mn for trustees compared to Kshs. 10 mn for pension funds Trustees which limits the role to banks, prolonged approval process for REITs, only a few legal entities capable of incorporating REITs, high minimum subscription amounts or offer parcels set at Kshs 0.1 mn for D-REITs and 5.0 mn for restricted I-REITs and lack of adequate knowledge of the financial asset class by investors, iv) constrained financing to developers as lenders continues to tighten their lending requirements and demand more collateral from developers as a result of the high credit risk in the real estate sector.
As the REITs continue to gain popularity in Kenya, we set to explore and review the REITs environment in 2024 building to the previous reports we did on the same field. These reports include: Real Estate Investment Trusts (REITs) progress in Kenya and Kenya’s REITs H1’2024.
This week’s report will focus on the below named sections as we dig deeper to understand REITs in Kenya
- Overview of the REITs Sector in Kenya
- Key Drivers and Market Trends in 2024
- Challenges and Opportunities in the REITs Sector
- Conclusion and Outlook for the REITs Sector in 2025
Section I: Overview of the REITs Sector in Kenya
Real Estate Investment Trusts are crucial to the development given the limited funding available to the developers. Real Estate Investment Trusts (REITs) represent an innovative financing avenue for real estate development in Kenya. REITs provide a structured mechanism for pooling resources from multiple investors to finance or acquire income-generating real estate assets. The Capital Markets Authority (CMA) regulates REITs in Kenya, ensuring transparency and investor protection. Despite being relatively new in the Kenyan financial market, REITs have shown potential as a transformative tool for real estate financing.
In Kenya, REITs are classified into two main types:
- Development REITs (D-REITs): These focus on financing the construction of new real estate projects. Developers utilize D-REITs to raise capital for large-scale projects, such as residential complexes, commercial buildings, or mixed-use developments. Investors in D-REITs anticipate returns from the eventual sale or lease of the completed properties. Example of this REIT include Acorn D-REIT.
- Income REITs (I-REITs): These are designed for properties that generate consistent rental income. I-REITs appeal to investors seeking steady cash flow from established properties such as office buildings, shopping malls, or industrial parks. In Kenya examples of I-REITs include Acorn I-REIT and Stanbic Fahari I-REITs.
REITs in Kenya are governed by strict regulations aimed at safeguarding investors. They operate as collective investment schemes where a REIT manager oversees the fund's operations. Investors purchase units of the REIT, similar to shares in a company, granting them proportional ownership of the underlying real estate assets. These units are typically traded on the Nairobi Securities Exchange (NSE), providing liquidity and enabling investors to buy or sell their stakes easily.
REITs must allocate a significant portion of their income, often up to 90.0%to investors as dividends, making them attractive to those seeking regular income. Additionally, REITs benefit from tax incentives, such as exemptions on corporate tax, which enhance their appeal to both developers and investors.
In 2013, the Capital Markets Authority (CMA) introduced a detailed framework and regulations for REITs, enabling developers to secure capital through this investment avenue.
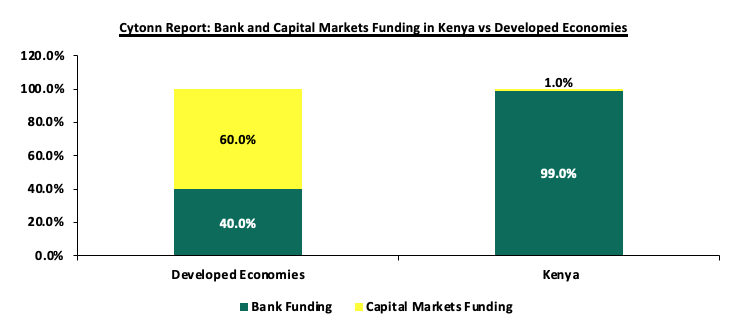
Kenya's Real Estate sector has been expanding due to ongoing construction activities driven by strong demand for real estate developments. The residential market is significantly under-supplied, with an 80.0% housing deficit; only 50,000 units are delivered annually against an estimated need for 200,000 units per year. Additionally, the formal retail market in Kenya is still in its nascent stages, with a penetration rate of approximately 30.0%, as reported by the world bank. Despite the high demand, developers in Kenya encounter limited financing options, with local banks providing nearly 99.0% of construction financing, in stark contrast to the 40.0% typically seen in developed countries. The graph below illustrates the comparison of construction financing in Kenya versus developed economies;
Source: World Bank
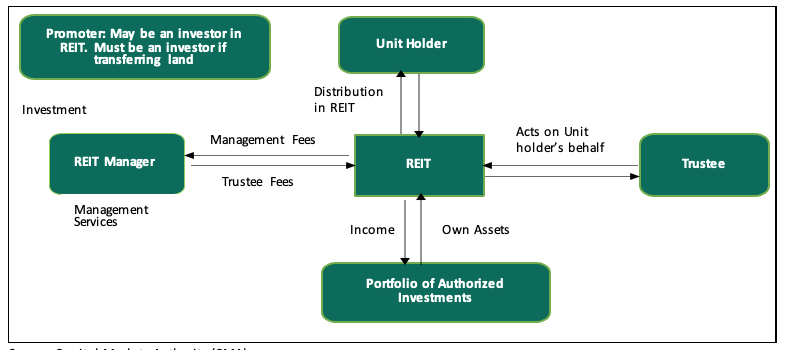
To bridge the funding gap, developers are increasingly turning to alternative financing methods. In 2013, the Capital Markets Authority (CMA) introduced a regulatory framework for Real Estate Investment Trusts (REITs) in Kenya. REITs are collective investment vehicles that pool funds from investors, who then acquire rights or interests in a trust divided into units. Investors benefit from profits or income generated by the real estate assets held within the trust. To ensure transparency, accountability, and the protection of investors' interests, four essential entities play key roles in the REIT structure in Kenya:
- The Promoter: This entity is responsible for establishing the REIT scheme. The promoter acts as the initial issuer of REIT securities and handles submissions to regulatory authorities for approvals of trust deeds, prospectuses, or offering memorandums. Examples of REIT promoters in Kenya include Acorn Holdings Limited and LAP Trust.
- The REIT Manager: This is a licensed company in Kenya that provides real estate and fund management services for a REIT scheme on behalf of investors. There are currently 10 REIT Managers in Kenya, including Cytonn Asset Managers Limited, Acorn Investment Management, and Stanlib Kenya Limited.
- The Trustee: A corporation or company appointed under a trust deed and licensed by the CMA to hold real estate assets on behalf of investors. The trustee's primary role is to act in the best interests of investors by evaluating investment proposals from the REIT Manager and ensuring compliance with the Trust Deed. REIT trustees in Kenya include Kenya Commercial Bank (KCB) and Co-operative Bank.
- Project/Property Manager: The project manager oversees the planning and execution of construction projects within the REITs. Meanwhile, the property manager handles the management of completed real estate developments acquired by a REIT, with a focus on generating profit.
The relationship between key parties in a typical REIT structure is depicted in the figure below;
Since its introduction in 2013, the REIT market in Kenya has faced several hurdles that have hindered its growth. Key challenges include the hefty capital requirement of Kshs 100.0 mn for trustees, limiting this role largely to banks, and a protracted approval process for setting up REITs. Additionally, the high minimum investment threshold of Kshs 5.0 mn discourages potential investors, while a lack of sufficient investor education and awareness further impedes market expansion. As a result, the REIT market capitalization in Kenya remains significantly lower compared to other regions
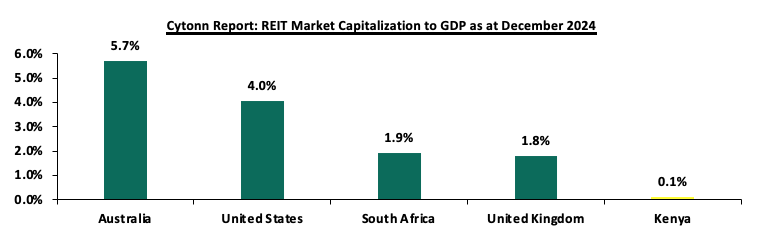
The underdeveloped capital markets in Kenya has continually failed to provide alternative means of financing Real Estate developments. Due to this, most property developers rely on conventional sources of funding such as banks, compared to other developed countries. As a result, Kenya’s REIT Market Capitalization to GDP has remained significantly low at 0.1%, compared to other countries such as South Africa with 1.9%, as shown below;
Source: European Public Real Estate Association (EPRA), World Bank, Cytonn Research
Most property developers in Kenya continue to rely on traditional funding sources, such as banks, unlike in more developed markets. Since the establishment of REIT regulations, four REITs have been approved in Kenya, all structured as closed-ended funds with a fixed number of shares. However, none of these REITs are actively trading on the Main Investment Market Segment of the Nairobi Securities Exchange (NSE). Following the recent delisting of ILAM Fahari I-REIT, LAPTrust Imara I-REIT is the only listed REIT in the country, quoted on the restricted market sub-segment of the NSE's Main Investment Market. It is important to note that Imara did not raise funds upon listing. The ILAM Fahari I-REIT, Acorn I-REIT and D-REIT are not listed but trade on the Unquoted Securities Platform (USP), an over-the-counter market segment of the NSE. The table below outlines all REITs authorized by the Capital Markets Authority (CMA) in Kenya
|
Cytonn Report: Authorized REITs in Kenya |
||||||
|
# |
Issuer |
Name |
Type of REIT |
Listing Date |
Market Segment |
Status |
|
1 |
ICEA Lion Asset Management (ILAM) |
Fahari |
I-REIT |
July 2024 |
Unquoted Securities Platform (USP) |
Trading |
|
2 |
Acorn Holdings Limited |
Acorn Student Accommodation (ASA) – Acorn ASA |
I-REIT |
February 2021 |
Unquoted Securities Platform (USP) |
Trading |
|
3 |
Acorn Holdings Limited |
Acorn Student Accommodation (ASA) – Acorn ASA |
D-REIT |
February 2021 |
Unquoted Securities Platform (USP) |
Trading |
|
4 |
Local Authorities Pension Trust (LAPTrust) |
Imara |
I-REIT |
March 2023 |
Restricted Market Sub-Segment of the Main Invesment Market |
Restricted |
Source: Nairobi Securities Exchange, CMA
Section II: Themes that Shaped the REIT Sector in 2024
In this section, we examine the key themes that have significantly shaped the REIT sector in 2024. We explore how evolving regulations, strategic acquisitions, and capital-raising initiatives have influenced the REIT industry's trajectory. Additionally, we provide insights into the broader factors that have impacted the sector's performance and overall direction during this period.
- Regulations
REITs are formally established in accordance with regulations set forth for Real Estate Investment Trusts (REITs) and granted approval by the Capital Markets Authority (CMA) under the Capital Markets Real Estate Investment Trusts Collective Investment Schemes Regulations of 2013. Instead of taking the form of conventional companies, they are structured as trusts. The management of investment properties falls under the purview of a corporate REIT manager, licensed by the CMA. Units of listed REITs are traded on the Nairobi Securities Exchange (NSE), akin to shares of any other company listed on both the Main Market Segment and the Unquoted Security Platform (USP), providing investors with a liquid stake in Real Estate. Both individual and corporate investors have the opportunity to partake in a public offering on the NSE, as outlined in the Regulations of 2013.
Furthermore, the regulations stipulate that Kenyan REITs are mandated to distribute a minimum of 80.0% of distributable earnings to their unitholders. REITs automatically qualify for several tax exemptions such as the Income Tax Act (ITA), Value Added Tax (VAT), and Capital Gains Tax (CGT) under the authorization of the Kenya Revenue Authority (KRA). Some of the recent regulatory transformations in the REITs industry include;
- Exemption from Income Tax Act
Section 20 (1) (c) and (d) of the Income Tax Act (ITA) mandates that, upon registration with the Commissioner of the Kenya Revenue Authority (KRA), both REITs and the companies they invest in are exempt from the standard 30.0% Income Tax Rate (ITR). Furthermore, income distributed by REITs to their investors (unitholders) is not taxed. However, this exemption does not apply to the withholding tax on interest income and dividends received by non-exempt unitholders, as outlined in the first schedule of the ITA. The applicable withholding tax rates can be found in paragraph 5 of the third schedule of the Income Tax Act.
- Capital Gains Tax (CGT) exemptions
A capital gain arises when the value of a unit upon transfer exceeds its adjusted cost. The disparity between these values is liable to a tax rate of 15.0%. Consequently, any profits made by a promoter or investors of a REIT from transferring property into the REIT are now subject to Capital Gains Tax (CGT) at the revised rate of 15.0%, supplanting the previous rate of 5.0% effective from 1 January 2023. Additionally, individuals holding units in a REIT who opt to sell their ownership stake are also required to remit CGT. This stipulation emerged following an amendment to Section 34 (1) (j) of the Income Tax Act through the Finance Act 2022.
However, within the REIT industry, there are certain scenarios that qualify for exemptions from CGT:
- Transfers of property from life insurance companies to a REIT are exempt from CGT, as outlined in Section 19 (6B) of the Income Tax Act (ITA),
- Indirect transfer of property into a REIT when the promoter first transfers properties to a Special Purpose Vehicle (SPV). Subsequently, the shares of the investee company held by the SPV are transferred to the REIT. This is considered a restructuring, as the property transfer does not involve a third party. This exemption is based on Paragraph 13 of the Eighth Schedule to the ITA. However, CGT is applicable on gains made during the transfer of shares from the investee company to the REIT Trustee,
- Payments received by unit holders or shareholders in a REIT for unit redemption or share sale are exempt from CGT in accordance with section 20 (2) of the ITA, and,
- Gains realized by the REIT from the sale of properties, whether directly or through an SPV, are also exempt from CGT.
- Exemption from Value Added Tax (VAT)
The Finance Act 2021 reinstated a significant alteration concerning the exemption from Value Added Tax (VAT) for transactions involving the transfer of assets to REITs and asset-backed securities. This exemption had previously been rescinded by the Tax Laws Amendment Act No. 2 of 2020. In line with Paragraph 33 of Part II of the First Schedule to the VAT Act 2021, a direct transfer of property from the REIT promoter or investors is not subject to VAT. However, if the transfer of assets to the REIT occurs indirectly, through the initial transfer of assets to the investee company, VAT will apply. It is noteworthy that the transfer of shares from a REITs SPV to the REIT trustee will be exempt from VAT, regardless of whether the initial asset transfer involved VAT.
- Reintroduction of Stamp Duty from January 2023
In accordance with the Stamp Duty Act's Section 96A, transfers of stabilized properties from Development REITs (D-REITs) to Income REITs (I-REITs) were previously exempt from stamp duty. However, this exemption expired on December 31, 2022. Effective January 1, 2023, such transfers are now subject to stamp duty as per Section 96A subsection 4.
The intricate nature of REIT regulations, combined with the complexity of the REIT structure, can make it challenging for individuals to understand the tax implications of their investments. This lack of clarity can deter potential investors, fostering skepticism about the fairness and reliability of the REIT market.
Moreover, the limited public information available on REIT regulations exacerbates this issue. Investors who are unaware of the tax consequences of their decisions may avoid investing altogether or make uninformed choices, potentially impacting their financial returns.
To address these concerns, it is crucial for both the government and REIT stakeholders to prioritize the following: i) Enhanced Transparency: Increase public access to clear and concise information about REIT regulations and tax implications, ii) educational Initiatives: Launch educational campaigns and provide resources to inform investors about REITs and their associated tax considerations, iii) collaboration: Foster collaboration between regulatory authorities and industry stakeholders to raise awareness about the benefits and drawbacks of REIT investments, iv) Clear Documentation: Provide easily understandable documentation outlining the tax implications of various investment scenarios, and, v) Consultation Services: Establish accessible consultation services to allow investors to seek expert advice on tax-related aspects of REIT investments.
By implementing these measures, we can help create a more informed and confident investment environment for REITs in Kenya.
- Portfolio Holdings & Acquisitions
Acquisitions play a pivotal role in the dynamic landscape of the Kenyan REITs industry. These strategic moves signify the industry's evolution, adaptability, sustainability, and growth potential. As of January 2024, the industry has witnessed noteworthy acquisitions that are reshaping the sector. These acquisitions hold a promising outlook for the industry, contributing to its progress and value proposition. They exemplify how REITs are actively enhancing their portfolios, expanding their market presence, and optimizing their performance. Some of the notable acquisitions in 2024 include;
- LAPTrust Imara I-REIT possesses a diversified portfolio of properties which include; i) Pension Towers, Metro Park, and CPF House which are commercial office buildings located in Nairobi CBD, ii) Retail centre Freedom Heights mall located in Lang’ata, iii) Nova Pioneer which is a purpose-built educational facility located in Eldoret, iv) Freedoms Height residential apartments and serviced plot located in Lang’ata, and, v) Man apartments located in Kilimani,
- ILAM Fahari I-REIT manages and operates several properties under their portfolio which include: i) a mixed used development (MUD) Greenspan Mall located in Donholm, Nairobi, ii) 67 Gitanga Place which is a prime office property located in Lavington, and, iii) Bay Holdings and Highway House which are industrial properties located in Industrial Area and Mombasa Road area respectively,
- Acorn Student Accommodation (ASA) I-REIT has five completed student housing properties with 3,003 beds under their management serving up to 128 universities and colleges. These properties include; Qwetu Jogoo Road, Qwetu Ruaraka, Qwetu WilsonView in Lang’ata, Qwetu Parklands, and Qwetu Aberdare Heights I along Thika Road next to United States International University Africa (USIU-A). On the other hand, Acorn D-REIT boasts of four properties which are currently operational and six other properties under development bringing to a total of ten properties with 10,060 beds under its portfolio. Operational properties include; Qwetu Hurlingham, Qwetu Abedare Heights II, Qwetu Karen, Qejani Karen whereas properties under development include; Qwetu Chiromo, Qejani Chiromo, Qejani JKUAT next to Jomo Kenyatta University of Agriculture and Technology, Qejani Hurlingham, Qwetu KU, and Qejani KU next to Kenyatta University,
- In 2024, Acorn Student Accommodation Development REIT (ASA D-REIT) announcedit had sold its stabilized asset, Qwetu Aberdare Heights II, to the Acorn Student Accommodation Income REIT (ASA I-REIT) in a Kshs 1.5 bn deal. The acquisition of the 630-bed capacity hostel located adjacent to Qwetu Aberdare Heights I and United States International University (USIU) brings the total number of assets acquired by the I-REIT to four over the last three years, after successful acquisitions of Qwetu Hurlingham in June 2023, Qwetu WilsonView in February 2021, and Qwetu Aberdare Heights I in October 2022. Through the sale, ASA D-REIT will repay Kshs 600.0 mn of the Acorn Green Bond, pushing the repayment of the Kshs 5.7 bn bond to Kshs 3.0 bn ahead of its maturity in November 2024. The bond which was first floated in 2019, was issued in partnership with Private Equity Fund Helios and had attracted an 85.0% subscription rate, raising Kshs 4.3 bn of the targeted amount of Kshs 5.0 bn. The bond was priced at a rate of 12.3%, and was intended to be used to finance sustainable and climate-resilient student accommodation with a combined capacity of 40,000 beds. Later in the year, the student accommodation developer Acorn Holdings announced that it has fully redeemed its Kshs 5.7 bn green bond before its scheduled maturity on November 8, 2024. The firm announced that it had paid the balance of Kshs 2.7 bn from the paper, alongside the accrued interest, on its five-year medium-term note issued in November 2019, and
- During the year, the Capital Markets Authority (CMA) granted a license to Mi Vida Homes Limited to operate as a REIT Manager in efforts to strengthen and develop the country’s capital markets. This brings the total number of REIT managers in Kenya to 11. As a REIT Manager, the company will offer Real Estate and fund management services for Real Estate investment trusts (REITs) on behalf of investors within a REIT scheme. We expect this milestone will open exciting new opportunities for investors and further develop our country’s Real Estate market, as the country’s REIT market remains underdeveloped and relies primarily on conventional funding alternatives.
- Future Construkt Investment Managers Ltd, a subsidiary of Construkt Africa LLC was granted a REIT Manager license by the Capital Markets Authority-Kenya. It is expected that this significant milestone will position the company to attract institutional capital, aligning with its strategic goal of developing large-scale, green affordable housing projects and subsequently managing its institutional-grade commercial property portfolios. In line with its vision, Construkt Africa had recently launched Teja Spaces, a premier co-working office at Delta Riverside Office Park, offering flexible workspaces and premium amenities marking the first of many planned projects as the company continues its regional expansion,
- Centum Investment Company announced a plan to introduce Kenya's first dollar-denominated Income Real Estate Investment Trust (I-REIT) at its Two Rivers development in Nairobi. This strategic move aims to attract international investors seeking exposure to Kenya's real estate market while mitigating currency risk. The proposed I-REIT will focus on income-generating properties within the Two Rivers precinct, including office spaces, retail outlets, and residential units. By denominating the fund in U.S. dollars, Centum seeks to provide a hedge against the volatility of the Kenyan shilling, offering more stable returns for foreign investors.
In the future, we expect REITs to maintain a strategic acquisition strategy. This will involve actively seeking opportunities to expand their portfolios, diversify their holdings, and respond to evolving market demands. Additionally, REITs are likely to prioritize environmental sustainability, as exemplified by Acorn Holding's issuance of green bonds. Such acquisitions can also stimulate innovation within the industry, encouraging the development of new ideas, designs, and services that cater to the needs of both investors and tenants.
- Capital Raising
Raising capital is essential in the REITs industry, fueling growth, development, and innovation. Securing funds from diverse sources, whether through debt or equity, enables REITs to expand their portfolios, improve existing properties, and explore new investment opportunities. This practice benefits the REITs and significantly shapes the Real Estate landscape, providing attractive investment options to stakeholders. Some of the notable capital infusion in the REITs industry as of 2024 include;
- Acorn Holdings, a student hostel developer in Nairobi announced a bid to raise Kshs 2.8 bn in new capital for its development and income Real Estate Investment Trusts (REITS) by February 2025 to fund the development and acquisition of new properties. The firm targets Kshs 1.9 bn for the Acorn student accommodation I-REIT and Kshs 810.0 mn for the D-REIT, which is set to be raised through a combination of a rights issue that closed on 31st July and open market offer which continues until February 2025. Acorn offered an open market price of Kshs 24.54 for the D-REIT and Kshs 22.03 for the I-REIT with existing unit holders enjoying a discount of 0.6% during the rights issue offer period which has since expired. The recent offer by Acorn Holdings forms the third supplemental cash call made by the firm since inception of the REITs, following similar issuances in 2022 and 2023 making this strategy the primary capital raising instrument for the company. As at the end of June 2024, the ASA D-REIT holds 11 properties under different development stages, with a total valuation of Kshs 10.9 bn. These properties include two hostels in Karen under the company’s Qwetu and Qejani brands, which the firm expects to offload to the I-Reit by the end of Q1’2025. Similarly, the ASA I-REIT holds a portfolio of 7 hostels with a combined valuation of Kshs 10.3 bn as at June 2024 with the most recent acquisitions being the Qwetu Hurlingham in September 2023 and Qwetu Aberdare Heights II in January 2024.
- The Acorn D-REIT currently has an outstanding Kshs 1.86 bn green bond issued in October 2019, which financed eight hostel projects. The company had acquired Kshs 5.7 bn and has been making early repayments before the debt matures in November 2024. In February 2022, the D-REIT contracted a Kshs 6.7 bn loan from Absa Bank to fund 10 hostel projects, out of which Kshs 1.0 bn had been drawn down by June 2024 for ongoing projects at Juja, Kenyatta University and Hurlingham.
- The Linzi Sukuk bond was launched on July 31, 2024, marking Kenya's first Sharia-compliant bond aimed at funding affordable housing projects. President William Ruto announced that the KShs 3 bn (approximately USD 20 mn) bond would finance the construction of 3,069 affordable housing units, significantly reducing the cost of home ownership for many Kenyans. The initiative allows potential homeowners to pay as little as KShs 7,000 per month over a 15-year period for homes valued at an average of KShs 1.4 mn. The Sukuk bond was structured to align with Islamic finance principles, which prohibit interest payments and instead provide investors with a share of profits from the underlying assets. The bond is expected to create thousands of jobs and stimulate economic growth by leveraging private funds for public housing. President Ruto emphasized the importance of using public land for these developments, arguing that it helps combat land speculation and ensures that housing benefits a broader segment of the population
- Delisting & Listing on the USP
ILAM Fahari I-REIT's delisting from the Main Investment Market Segment (MIMS) of the Nairobi Securities Exchange (NSE) was a strategic response to operational difficulties and the need for structural optimization. After receiving approval from the Capital Markets Authority (CMA), ILAM Fahari transitioned to a Restricted I-REIT, focusing on professional investors. This shift from the unrestricted segment to a restricted one highlights the REIT's challenges and its proactive restructuring approach. Operational issues prompted a reassessment, leading to resolutions at an Extraordinary General Meeting (EGM) in December 2023, where the decision to convert to a restricted REIT and delist received strong support from unitholders.
Implications of Delisting:
- Non-Professional Unitholders: Retail investors had to choose between accepting the redemption offer, which ended their unitholder status, or retaining units with post-conversion trading restrictions.
- Professional Unitholders: They remained largely unaffected, with the ability to trade units on the Unquoted Securities Platform (USP), though liquidity concerns persist.
- Tenants and Regulators: Minimal impact was observed, with the CMA continuing regulatory oversight as the REIT shifted to a Restricted I-REIT.
ILAM Fahari’s delisting and conversion were aligned with its goal to focus on professional investors, offering them specialized investment opportunities, enhancing flexibility, and unlocking growth potential. While this restructuring aids operational efficiency and capital raising, it limits retail investor participation, signaling a shift towards catering to high-net-worth individuals. Going forward, capital raising through equity, debt, and strategic partnerships, particularly in affordable housing and infrastructure, will be crucial in driving the expansion and sustainability of Kenya's REIT industry. Collaborative efforts, regulatory support, and investor education will be key to ensuring successful capital raising and a vibrant future for the sector.
During 2024, ICEA Lion Asset Managers (ILAM) Fahari I-REIT was admitted to the Unquoted Securities Platform (USP) of the Nairobi Securities Exchange (NSE), following their delisting from the main investment market in February 2024. ILAM Fahari joined Acorn I-REIT, Acorn D-REIT, and Linzi Sukuk in the USP, marking the first trading day in the segment. The delisting from the Main Investment Market Segment (MIMS) of the NSE will provide greater flexibility in managing the REIT's portfolio without affecting the unitholders’ ability to trade their units. The REIT’s shares (units) were available for trading on the platform at a fixed price of Kshs 11.0, representing the price at which a section of minority investors was bought out last year by ILAM, which is also the manager of the REIT.
Section III: Challenges and Opportunities in the REITs Sector
Kenya’s REIT market is evolving, and while it offers promising investment prospects, several challenges continue to shape its growth trajectory. At the same time, these challenges create opportunities for strategic improvements and market expansion of the sector;
- Regulatory and compliance hurdles
One of the major challenges confronting the REIT market in Kenya is the evolving regulatory framework. Although the Capital Markets Authority (CMA) has introduced guidelines to enhance transparency and protect investors, frequent changes and complex compliance requirements often create uncertainty for REIT managers and potential issuers. The intricate registration process and continuous updates in regulatory policies can discourage market participants, limiting the number of listings. However, this challenge also provides an opportunity for the industry to collaborate more closely with regulators, streamlining processes and establishing more predictable compliance standards that could, in turn, bolster investor confidence and market stability. The REITS association of Kenya can help to advocate for clear, stable and supportive frameworks and streamlining of compliance processes to reduce uncertainties for REIT managers and issuers. Some of the regulatory and compliance challenges include:
- Limiting the type of legal entity that can form a REIT to only a trust company, as opposed to allowing other entities such as partnerships, and companies,
- We need to give time before REITS are required to list – they would be allowed to stay private for a few years before the requirement to list given that not all companies maybe comfortable with listing on day one, and,
- Minimum subscription amounts or offer parcels set at Kshs 0.1 mn for D-REITs and Kshs 5.0 mn for restricted I-REITs. The significant capital requirements still make REITs relatively inaccessible to smaller retail investors compared to other investment vehicles like unit trusts or government bonds, all of which continue to limit the performance of Kenyan REITs.
- Lengthy approval processes for REIT creation, and,
- The rigidity of choice between either a D-REIT or and I-REIT forces managers to form two REITs, rather than having one Hybrid REIT that can allocate between development and income earning properties
- High minimum capital requirements of Kshs 100.0 mn for REIT trustees compared to Kshs 10.0 mn for pension funds Trustees, essentially limiting the licensed REIT Trustee to banks only.
- Market liquidity constraints
Liquidity remains a significant challenge for Kenyan REITs. The relatively small number of REIT listings on the Nairobi Securities Exchange (NSE) has resulted in lower trading volumes, which makes it difficult for investors to enter or exit positions quickly. Limited secondary market activity has often led to wider bid-ask spreads, reducing overall market efficiency. On the upside, this situation encourages market stakeholders to work on initiatives aimed at increasing awareness and participation. Efforts to attract more diverse investors and promote secondary market trading can improve liquidity, making the REIT market more vibrant and accessible.
- Investor awareness and confidence
A critical challenge in the Kenyan REIT landscape is the insufficient understanding of the investment instrument among investors leading to a slower uptake of REIT products. The low level of investor awareness about these investment vehicles. Many local investors are still more comfortable with traditional bank deposits and direct property investments. Historical performance issues in some segments of the real estate market, coupled with a lack of comprehensive educational initiatives, have contributed to cautious investor sentiment. This challenge, however, presents a considerable opportunity. By launching targeted investor education programs, hosting seminars, and enhancing market transparency through better reporting and digital platforms, REIT managers can gradually shift public perception. Building a robust narrative around stable, income-generating real estate investments can lead to increased participation and sustained growth in the market.
- Economic volatility and market uncertainties
Macroeconomic factors such as currency fluctuations, inflationary pressures, and interest rate adjustments pose risks for the REIT market. Economic volatility directly impacts property valuations and rental incomes, making it more challenging to forecast returns accurately. These uncertainties may lead to conservative lending practices and cautious investment behaviors. Nonetheless, the inherent volatility also creates opportunities for REITs to diversify their portfolios. By investing in a mix of asset classes—such as commercial, industrial, and residential properties—REITs can mitigate risks and build more resilient revenue streams. Additionally, partnerships with government agencies and financial institutions to secure favorable financing terms can further stabilize the market during turbulent economic periods.
- Operational and management challenges
Managing a diverse portfolio of real estate assets across different regions requires advanced operational systems and strategic expertise. Inefficient property management, underutilization of assets, and the lack of technological integration can hinder the overall performance of REITs. This challenge, however, also opens the door for innovation. The adoption of modern property management software, digital leasing platforms, and data-driven decision-making tools can significantly enhance operational efficiency. By embracing technology, REITs can reduce costs, improve tenant satisfaction, and increase overall yields, thereby creating a more attractive proposition for investors.
- Opportunities for growth and expansion
Despite the challenges, the opportunities in the Kenyan REIT market are significant. Rapid urbanization in major cities such as Nairobi, Mombasa, and Kisumu are driving demand for quality commercial and residential spaces. Government initiatives to improve infrastructure and attract foreign investment further enhance the market potential. With supportive policy reforms and a growing emphasis on financial inclusion, REITs are well positioned to tap into new asset classes and diversify their investment portfolios. By capitalizing on these trends, REITs can not only improve their performance but also play a crucial role in shaping Kenya’s broader real estate landscape. The two upcoming Cities: Eldoret and Nakuru will see an increase in demand for Real Estate infrastructures in retail, hospitality, office, residential, and industrial spaces.
Addressing these challenges will go a long way ensuring the sector thrives and the funding constraint improves. The REITS association of Kenya can intervene and advocate for the rights and welfare of the REITs managers and issuers
Section IV: Conclusion, Recommendations, and Outlook for the REITs Sector
Kenya's REITs market has seen moderate performance, shaped by various factors. Despite challenges, there are encouraging trends, such as growth in net operating incomes, indicating improved financial performance. Additionally, leverage ratios for most REITs have remained low, with many REITs being ungeared and relying on short-term debt for their operations to avoid overexposure to rising interest rates. This trend is expected to continue as REITs seek to maintain financial sustainability, as evidenced by Acorn Holdings' issuance of a green bond. Moreover, the recent regulatory proposal by the Capital Markets Authority (CMA) to reduce the minimum investment amounts for professional investors to Kshs 10,000 is anticipated to increase interest in the sector and attract a broader investor base.
Recommendations to Enhance the REITs Sector:
- Stakeholder education: There is a pressing need to educate all key stakeholders on the REIT structure. Implementing comprehensive investor education and awareness campaigns is essential to inform potential investors about both the benefits and inherent risks of REIT investments. By enhancing investor knowledge and understanding, a larger pool of individuals can be encouraged to participate in the REIT market, ultimately driving its growth and fostering sustainable development.
- Expanding legal entities: In South Africa, the REIT framework allows for a variety of legal entities to form REITs, unlike in Kenya where the structure is predominantly limited to trusts. In countries like Belgium and the United States, REITs can be established using diverse legal structures such as public limited companies, limited liability companies, cooperatives, or trusts. This flexibility accommodates different investor preferences and business models. To strengthen the Kenyan REIT market, it is advisable to broaden the range of permissible structures beyond traditional trust models to include corporations, partnerships, and limited liability companies. Such diversification would better cater to various investor needs and lower the barriers to market entry, ultimately promoting a more robust and dynamic REIT sector.
- Streamlined approval process: To enhance the efficiency of REIT approvals, consolidating the current dual-agency process—managed by the Capital Markets Authority (CMA) and the Kenya Revenue Authority (KRA)—into a single regulatory body is recommended. By centralizing the approval process, REIT managers and potential issuers would no longer need to navigate two separate regulatory frameworks. This consolidation is expected to streamline the process, reduce associated costs, and improve overall transparency and accountability.
- Introduce hybrid REIT vehicles: At present, investors are often required to subscribe to separate REIT classes, which leads to duplicate costs and complicates the investment process. Introducing a hybrid REIT structure would integrate the high returns associated with development-focused assets with the stable income streams characteristic of income-oriented REITs. Such a unified vehicle would simplify the investment process by eliminating redundant costs and offering investors a balanced risk-reward profile, thereby enhancing overall market appeal.
- Flexibility in listing: Given the apprehensions of many companies regarding an immediate shift to public listing, a phased approach is recommended. Providing REITs with an initial period of private operation before mandating public listing could ensure a smoother transition and align with corporate comfort levels. For example, Belgium’s model—requiring 30% public shareholding—strikes a balance between public participation and promoter flexibility. Kenya could adopt a similar strategy, or even consider offering REITs the choice between public and private listings, which would foster inclusivity and better accommodate diverse investor preferences while bolstering market liquidity.
- Lower capital requirement for trustees: Currently, the minimum capital requirement for REIT trustees is set at Kshs 100.0 mn, a threshold that effectively restricts trusteeship primarily to major banking institutions. With only a handful of banks registered as REIT trustees—such as Kenya Commercial Bank (KCB), Co-operative Bank, Housing Finance Bank, and NCBA Bank Kenya—it is recommended that this minimum be reduced to Kshs 10.0 mn. This adjustment, aligning with the minimum standards set for Pension Fund Trustees, would expand the pool of potential trustees and encourage more competitive, innovative service provision for REIT managers.
- Introduce tokenization of REITs: Embracing the concept of tokenization presents an innovative avenue to broaden market participation. By digitizing REIT units into smaller denominations—potentially allowing investments as low as Kshs 100.0—it becomes possible to lower entry barriers, enhance liquidity, and attract a broader range of investors, including those with limited capital.
- Diminishing Entry Barriers: Revisiting the current minimum investment requirement of Kshs 0.1 mn for D-REITs and Kshs 5.0 mn for the restricted I-REIT, is essential to eliminate barriers that restrict individual participation. Notably, given that D-REITs are riskier compared to I-REITS, it makes no sense having I-REITs with higher minimum investment requirements compared to D-REITs. Lowering this threshold to Kshs 50,000 for I-REITs would foster a more inclusive investment environment, allowing a wider array of investors to access and benefit from the REIT market, ultimately bolstering overall market vibrancy and liquidity.
The outlook for Kenya's REITs sector remains cautiously optimistic. While challenges such as high construction costs and market saturation in certain areas persist, the continued government support through infrastructure development and affordable housing initiatives provides a positive backdrop. Investors are expected to remain focused on income-generating REITs, particularly those tied to resilient sectors like retail and commercial properties. The sector's growth will likely hinge on increased investor awareness and the broadening of investment options within the REITs market.
In 2025, we expect REITS to gain popularity as developers such as Future construkt being licenced as REIT managers by the Capital Market Authority. Centum Real Estate are looking forward to launch a dollar based Income REIT and we expect that the dollar based I-REIT will: i) increase foreign investments by boosting investors’ confidence against local currency uncertainties, ,ii) dollar-denominated REITs provide an alternative for investors seeking more liquid and globally recognized investment options, iii) the dollar based move is likely to set a precedent for other players in the market, encouraging the development of more innovative and investor-centric financial products, and, iv) the fund could force policy regulatory framework improvement to ensure transparency and investments protection.
In addition, we expect the sector will continue to lag behind in comparison to other African countries such as South Africa, attributable to several challenges facing the sector such as; i) lack of sufficient investor awareness regarding the potential of REITs as an investment tool, ii) lengthy approval procedures for establishing REITs have hindered their formation and deployment in the market, iii) high minimum capital requirement of Kshs 100.0 mn for REIT trustees compared to Kshs 10.0 mn for pension funds Trustees, essentially limiting the licensed REIT Trustee to banks only,, and, iv) steep minimum subscription amounts or offer parcels set at Kshs 0.1 mn for D-REITs and Kshs 5.0 mn for restricted I-REITs.
However, we also expect the trend of strategic acquisitions to persist, with REITs actively seeking opportunities to broaden and diversify their portfolios, cater to evolving market demands and also set standards in promoting environmental sustainability such as execution of green bonds by Acorn holding. While there are supportive factors for the growth of REITs in Kenya, such as urbanization and government infrastructure projects, challenges like high interest rates and regulatory constraints may tamper performance. Stakeholders in the REIT sector are advised to monitor these dynamics closely and engage in strategic planning to navigate the evolving market landscape effectively.
Moving forward, we also expect the trend of strategic acquisitions to persist, with REITs actively seeking opportunities to broaden and diversify their portfolios, cater to evolving market demands and also set standards in promoting environmental sustainability such as execution of green bonds by Acorn holding.
Disclaimer: The views expressed in this publication are those of the writers where particulars are not warranted. This publication, which is in compliance with Section 2 of the Capital Markets Authority Act Cap 485A, is meant for general information only and is not a warranty, representation, advice, or solicitation of any nature. Readers are advised in all circumstances to seek the advice of a registered investment advisor.

- Talk to us
- Kenya
- P.O Box 20695 - 00200, Nairobi, Kenya
- Cell +254709101200
- Tel +254709101200
- WhatsApp +254741676635
- United States
- +254709101200
- DOWNLOAD OUR APP
-


- Kenya
- 8th Floor, Pinetree Plaza, Kaburu Drive, Ngong Road, Nairobi, Kenya
- USA
- Suite 1150, 1775 Eye Street NW, USA, Washington DC 20006, USA
- Investments
- High Yield
- Private Equity
- Real Estate
- Real Estate
- RiverRun Estates
- Cytonn Towers
- The Ridge
- Taraji Heights
- The Alma