Mobile Payments, & Cytonn Weekly #05/2021
By Research Team, Feb 7, 2021
Executive Summary
Fixed Income
During the week, T-bills remained undersubscribed but the overall subscription rate increased to 70.0%, from 66.2% recorded the previous week. This is attributable to the concurrent primary bond offer and the continued tightening of liquidity in the money markets. The highest subscription rate was in the 364-day paper which increased to 142.1%, from 134.2% recorded the previous week. The subscription for the 182-day paper also increased to 20.9%, from 19.7% recorded the previous week, while the 91-day paper declined marginally to 12.6%, from 12.7% recorded the previous week.
In the primary bond auction, the Central Bank of Kenya re-opened two bonds, FXD1/2013/15 and FXD1/2012/20, with effective tenors of 7.1 years and 11.8 years, and coupons of 11.3% and 12.0%, respectively. The issue recorded an overall subscription rate of 83.7%, mainly attributable to the short bidding period and tightened liquidity in the market. Additionally, during the week, Stanbic Bank released the Monthly Purchasing Managers’ Index (PMI) for January 2021 which came in at 53.2, an increase from the 51.4 recorded in December 2020;
Equities
During the week, the equities market recorded mixed performance, with NASI and NSE 25 gaining by 1.0% and 1.3% respectively, while NSE 20 declined by 0.8%, taking their YTD performance to gains of 3.3% and 2.0% for NASI and NSE 25 respectively, and a loss of 0.3% for NSE 20. The equities market performance was driven by gains recorded by large-cap stocks such as EABL, BAT, KCB Group and Equity Group of 10.4%, 3.6%, 3.3% and 2.1%, respectively. The gains were however weighed down by losses recorded by banking stocks such as Diamond Trust Bank (DTB-K), Co-operative Bank and Standard Chartered Bank which declined by 9.9%, 3.2% and 1.1%, respectively. During the week, the Central Bank of Kenya (CBK), released the Commercial Banks’ Credit Survey Report for the quarter ended December 2020, highlighting that the banking sector’s loan book recorded a 7.1% y/y growth compared to 8.8% the prior year, with gross loans increasing to Kshs 3.0 tn in December 2020, from Kshs 2.8 tn recorded in December 2019;
Real Estate
During the week, Hass Consult released the Q4’2020 House Price Index, highlighting that residential house prices stagnated in Q4’2020, attributable to an overall drop in the property prices due to lower demand in the wake of a tough economic environment due to the COVID-19 pandemic. The firm also released their Q4’2020 Land Price Index, highlighting that land prices in Nairobi’s satellite towns registered sluggish growth in Q4’2020 while land prices in Nairobi’s suburbs remained stagnant during the same period under review. In the residential sector, Shelter Afrique, a Pan-African housing lender and real estate developer, partnered with NCBA Bank to provide mortgage financing to 200 homebuyers in Nairobi, Mombasa, Kisumu, Kiambu and Machakos counties. In the retail sector, French retailer Carrefour opened a new outlet at Nextgen Mall along Mombasa Road, in an expansion drive that saw it take up 1,800 SQFT of space previously occupied by Souk Bazar supermarket;
Focus of the Week
With the emergence of COVID-19, social distancing and minimizing physical touch has been at the forefront of everyone’s mind, necessitating cashless systems to mitigate the risk of spreading the virus. According to the Central Bank of Kenya (CBK), since March 2020, the country has witnessed a rapid increase in mobile and digital payments with the monthly volume of Person-to-person transactions increasing by 87.0% to hit Kshs 684.5 bn. Therefore, in today’s weekly, we seek to look at the mobile payment space;
- Weekly Rates:
- Cytonn Money Market Fund closed the week at a yield of 10.85%. To invest, just dial *809#;
- Cytonn High Yield Fund closed the week at a yield of 13.40% p.a. To invest, email us at sales@cytonn.com and to withdraw the interest you just dial *809#;
- For an exclusive tour of Cytonn’s real estate developments, visit: Sharp Investor's Tour and for more information, email us at sales@cytonn.com;
- We continue to offer Wealth Management Training daily, from 9:00 am to 11:00 am, through our Cytonn Foundation. The training aims to grow financial literacy among the general public. To register for any of our Wealth Management Training, click here;
- If interested in our Private Wealth Management Training for your employees or investment group, please get in touch with us through wmt@cytonn.com;
- We have 10 investment-ready projects, offering attractive development and buyer targeted returns. See further details here: Summary of Investment-ready Projects;
- For recent news about the company, see our news section here.
Money Markets, T-Bills & T-Bonds Primary Auction:
During the week, T-bills remained undersubscribed but the overall subscription rate increased to 70.0%, from 66.2% recorded the previous week. This is attributable to the concurrent primary bond offer and the continued tightening of liquidity in the money markets. The investors continued their preference on the 364-day paper which had the highest subscription rate increasing to 142.1%, from 134.2% recorded the previous week. This is mainly attributable to investor preference on medium term papers (1-2 years) as they now believe that the pandemic has been contained but are still worried about possible effects of the current rising political temperatures preceding the elections in August 2022. The subscription for the 182-day paper also increased to 20.9%, from 19.7% recorded the previous week, while the 91-day paper declined marginally to 12.6%, from 12.7% recorded the previous week. The yields on 364-day and 182-day papers rose by 9.3 bps and 1.6 bps, to 8.7% and 7.6%, respectively, while the 91-day paper declined by 2.4 bps to 6.9%. The government received bids worth Kshs 16.8 bn, accepting only Kshs 14.9 bn, translating to an acceptance rate of 88.6%.
In the primary bond auction, the Central Bank of Kenya re-opened two bonds, FXD1/2013/15 and FXD1/2012/20, with effective tenors of 7.1 years and 11.8 years, and coupons of 11.3% and 12.0%, respectively. The issue recorded an overall subscription rate of 83.7%, mainly attributable to the short bidding period and tightened liquidity in the market. The government received bids worth Kshs 41.9 bn, lower than the Kshs 50.0 bn offered and accepted only Kshs 32.1 bn, translating to an acceptance rate of 76.7%. The weighted average rate of accepted bids was 11.9% and 12.7%, for the FXD1/2013/15 and FXD1/2012/20, respectively.
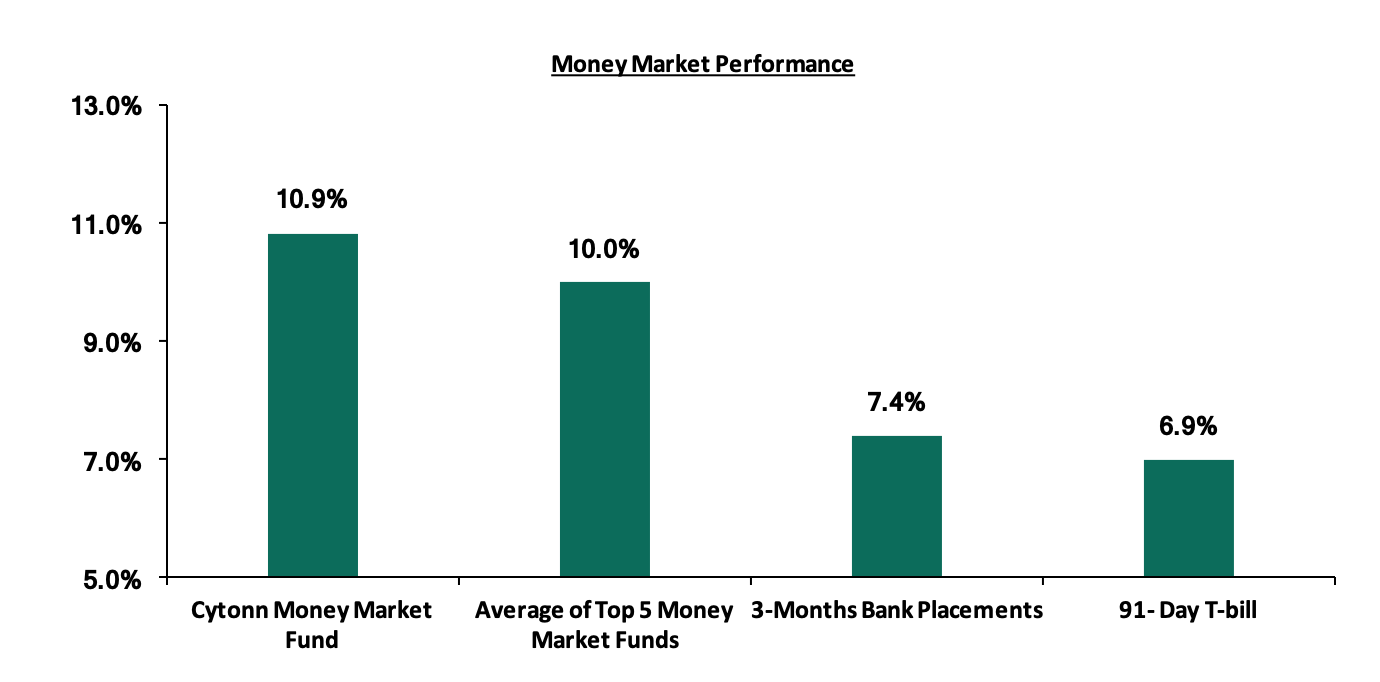
In the money markets, 3-month bank placements ended the week at 7.4% (based on what we have been offered by various banks), while the yield on the 91-day T-bill declined by 2.4 bps to 6.9%. The average yield of the Top 5 Money Market Funds remained unchanged at 10.0% from last week. The yield on the Cytonn Money Market increased marginally by 10.0 bps to 10.9%, from the 10.8%, recorded the previous week.
Liquidity:
During the week, liquidity in the money market tightened, with the average interbank rate increasing marginally to 5.5% from the 5.4% recorded the previous week, as the government payments were offset by tax remittances. The average interbank volumes increased by 24.7% to Kshs 12.2 bn, from Kshs 9.7 bn recorded the previous week. According to the Central Bank of Kenya’s weekly bulletin released on 05th February 2021, commercial banks’ excess reserves came in at Kshs 13.0 bn in relation to the 4.25% Cash Reserve Ratio.
Eurobonds performance:
During the week, the yields on all Eurobonds recorded a decline, pointing to improved investor sentiments. According to Reuters, the yields on the 10-year Eurobond issued in June 2014 declined by 0.1% points to 3.5%, from 3.6% recorded the previous week. The yields on the 10-year and 30-year Eurobonds issued in 2018 declined by 0.3% points and 0.2% points to 5.0% and 7.0%, respectively. On the other hand, the yields on the 2019 dual-tranche Eurobonds declined, with the 7-year Eurobond and 12-year Eurobond declining by 0.4% points and 0.3% points, respectively. The 7-year Eurobond declined by 0.4% points to 4.4%, from 4.8% recorded last week, while the 12-year Eurobond declined by 0.3% points to 5.8%, from the 6.1% recorded last week.
|
Kenya Eurobond Performance |
|||||
|
|
2014 |
2018 |
2019 |
||
|
Date |
10-year issue |
10-year issue |
30-year issue |
7-year issue |
12-year issue |
|
31-Dec-2020 |
3.9% |
5.2% |
7.0% |
4.9% |
5.9% |
|
29-Jan-2021 |
3.6% |
5.3% |
7.2% |
4.8% |
6.1% |
|
01-Feb-2021 |
3.6% |
5.2% |
7.1% |
4.7% |
6.0% |
|
02-Feb-2021 |
3.5% |
5.1% |
7.1% |
4.6% |
5.9% |
|
03-Feb-2021 |
3.5% |
5.0% |
7.0% |
4.4% |
5.8% |
|
04-Feb-2021 |
3.5% |
5.0% |
7.0% |
4.5% |
5.8% |
|
05-Feb-2021 |
3.5% |
5.0% |
7.0% |
4.4% |
5.8% |
|
Weekly Change |
(0.1%) |
(0.3%) |
(0.2%) |
(0.4%) |
(0.3%) |
|
YTD Change |
(0.4%) |
(0.2%) |
0.0% |
(0.5%) |
(0.1%) |
Source: Reuters
Kenya Shilling:
During the week, the Kenyan shilling appreciated by 0.3% against the US dollar to Kshs 109.8, from Kshs 110.1 recorded the previous week. This was mainly attributable to increased dollar inflows from exports in the agricultural sector including tea, coffee and horticultural produce. On an YTD basis, the shilling has depreciated by 0.6% against the dollar, in comparison to the 7.7% depreciation recorded in 2020. We expect continued pressure on the Kenyan shilling due to:
- Demand from merchandise traders as they beef up their hard currency positions,
- A slowdown in foreign dollar currency inflows due to reduced dollar inflows from sectors such as tourism and horticulture, and,
- Continued uncertainty globally making people to prefer holding dollars and other hard currencies.
However, in the short term, the shilling is expected to be supported by:
- The Forex reserves which are currently at USD 7.6 bn (equivalent to 4.7-months of import cover), which is above the statutory requirement of maintaining at least 4.0-months of import cover, and the EAC region’s convergence criteria of 4.5-months of import cover,
- The improving current account position which narrowed to 4.8% of GDP in the 12 months to December 2020 compared to 5.8% of GDP during a similar period in 2019, and,
- Improving diaspora remittances evidenced by a 19.7% y/y increase to USD 299.6 mn in December 2020, from USD 250.3 mn recorded over the same period in 2019, has cushioned the shilling against further depreciation.
Weekly Highlights:
During the week, Stanbic Bank released the Monthly Purchasing Managers’ Index (PMI) for January 2021, which came in at 53.2, an increase from the 51.4 recorded in December 2020. The reading was the highest in three months and a seventh consecutive month of growth since the COVID-19 outbreak, pointing to a solid improvement in the private sector. The reopening of businesses and improved cash flow in the economy aided in driving higher customer spending, resulting in the quickest growth in output and new orders since October 2020. A number of businesses hired additional staff members as rising levels of new work orders led to an increased backlog in January. Inflationary pressure accelerated, mainly due to the reversal of the VAT rate to 16.0% that led many suppliers to increase their prices. Raw material shortages and rising demand for inputs also contributed to an increase in purchase costs, which rose at the quickest rate since September 2018, as firms passed on higher costs to the consumers. The overall delivery times shortened in January, due to expansions in supplier capacity and stronger competition among vendors. A solid increase in inventories, albeit the softest recorded in seven months, was supported by the rising purchasing activity. Despite an improvement in some of the leading economic indicators, we still maintain a cautious outlook in the short term owing to the increase in COVID-19 infections, the speed in distribution and inoculation of the vaccines in some of trading partners will affect the amount of imports being produced.
Rates in the fixed income market have remained relatively stable due to the discipline by the Central Bank as they reject expensive bids. The government is 1.2% ahead of its prorated borrowing target of Kshs 330.4 bn having borrowed Kshs 334.2 bn. In our view, due to the current subdued economic performance brought about by the effects of the COVID-19 pandemic, the government will record a shortfall in revenue collection with the target having been set at Kshs 1.9 tn for FY’2020/2021, thus leading to a larger budget deficit than the projected 7.5% of GDP, ultimately creating uncertainty in the interest rate environment as additional borrowing from the domestic market may be required to plug the deficit. Owing to this uncertain environment, our view is that investors should be biased towards short-term to medium-term fixed income securities to reduce duration risk.
Market Performance:
During the week, the equities market recorded mixed performance, with NASI and NSE 25 gaining by 1.0% and 1.3% respectively, while NSE 20 declined by 0.8%, taking their YTD performance to gains of 3.3% and 2.0% for NASI and NSE 25 respectively, and a loss of 0.3% for NSE 20. The equities market performance was driven by gains recorded by large-cap stocks such as EABL, BAT, KCB Group and Equity Group of 10.4%, 3.6%, 3.3% and 2.1%, respectively. The gains were however weighed down by losses recorded by banking stocks such as Diamond Trust Bank (DTB-K), Co-operative Bank and Standard Chartered Bank which declined by 9.9%, 3.2% and 1.1%, respectively.
Equities turnover rose by 24.4% during the week to USD 28.5 mn, from USD 22.9 mn recorded the previous week, taking the YTD turnover to USD 109.0 mn. Foreign investors turned net sellers, with a net selling position of USD 4.5 mn, from a net buying position of USD 0.7 mn recorded the previous week, taking the YTD net buying position to USD 1.2 mn.
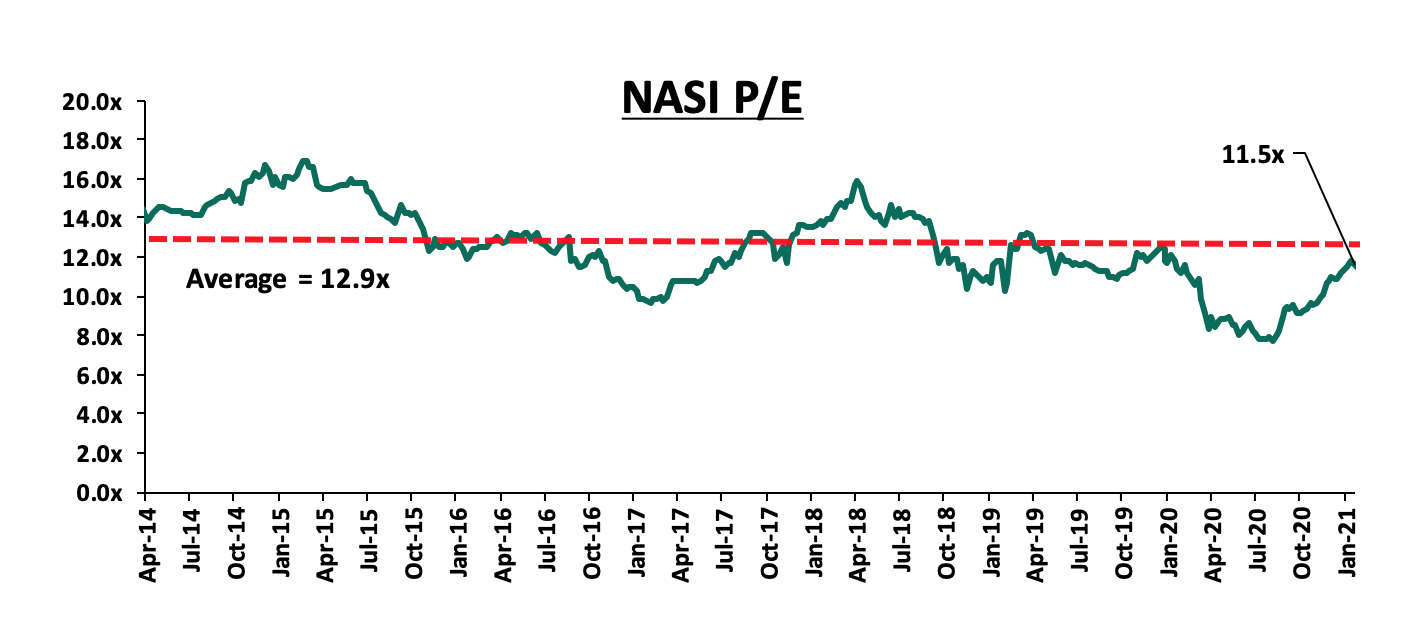
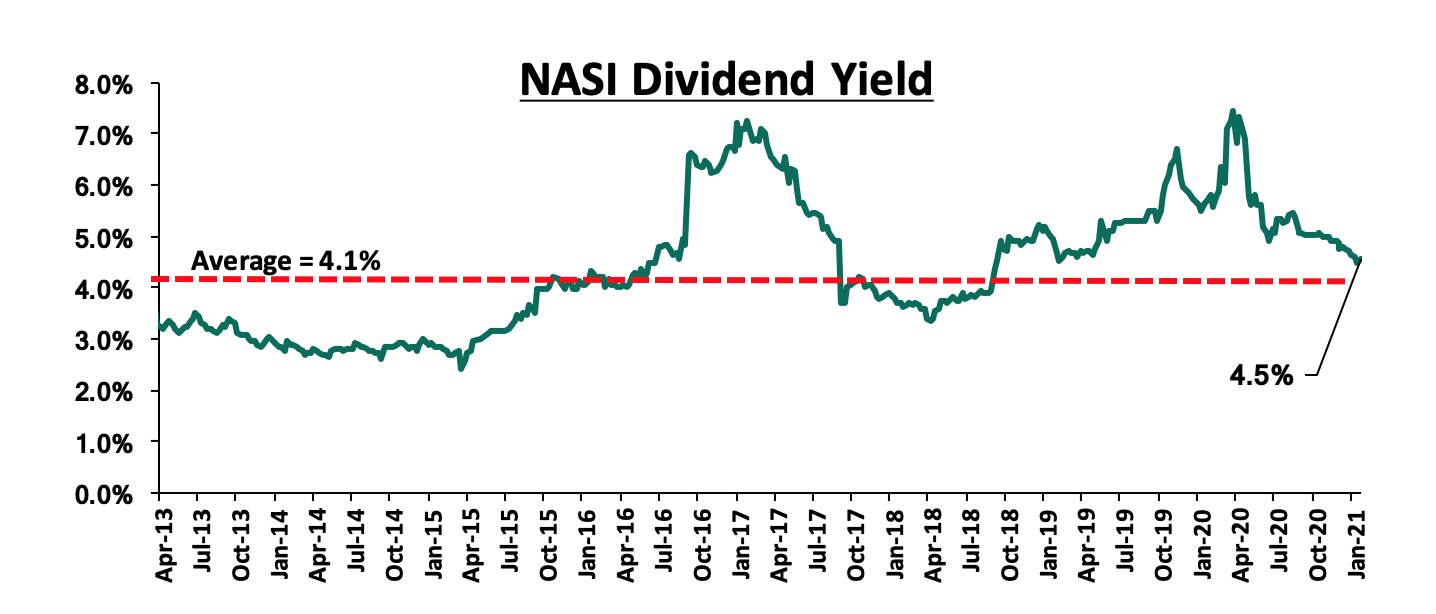
The market is currently trading at a price to earnings ratio (P/E) of 11.5x, 11.0% below the 11-year historical average of 12.9x. The average dividend yield is currently at 4.5%, unchanged from what was recorded the previous week and 0.4% points above the historical average of 4.1%.
With the market trading at valuations below the historical average, we believe that there are pockets of value in the market for investors with a higher risk tolerance. The current P/E valuation of 11.5x is 49.4% above the most recent valuation trough of 7.7x experienced in the first week of August 2020. The charts below indicate the market’s historical P/E and dividend yield.
Weekly Highlight:
During the week, the Central Bank of Kenya (CBK), released the Commercial Banks’ Credit Survey Report for the quarter ended December 2020. The quarterly Credit Officer Survey is undertaken by the CBK to identify the potential drivers of credit risk in the banking sector. The survey is collected from senior credit officers of banks, requiring them to indicate their banks’ perception or actual position in the quarter and the subsequent quarter in terms of demand for credit, credit standards, interest rates, asset quality, credit recovery efforts, deployment of liquidity and impact of implementing new standards. For the quarter ended December 31st 2020, 38 operating commercial banks and 1 mortgage finance company participated in the Commercial Banks Credit Officer Survey. The key take-outs from the report include:
- The banking sector’s loan book recorded a 7.1% y/y growth, with gross loans increasing to Kshs 3.0 tn in December 2020, from Kshs 2.8 tn in December 2019. Profit Before Tax (PBT) for the banking sector declined by 21.9% y/y to Kshs 112.8 bn in FY’2020, from Kshs 159.1 bn in FY’2019, attributable to the adverse effects of the pandemic with the banks recording increased operational costs as they had to bear all loan extension and loan restructuring costs and also due to an increase in the loan loss provisions. On a q/q basis, PBT declined by 19.2% to Kshs 23.6 bn Q4’2020, from Kshs 29.2 bn recorded in Q3’2020, attributable to a faster growth in expenses across the sector, which increased by 10.4%, compared to the 4.4% increase in income,
- The aggregate balance sheet recorded a 12.5% increase y/y to Kshs 5.4 tn in FY’2020, from Kshs 4.8 tn in FY’2019. Quarterly, the balance sheet grew by 1.9% to Kshs 5.4 tn in December 2020, from Kshs 5.3 tn in September 2020. The 12.5% y/y growth in the balance sheet is attributable to an 11.1% increase in deposits to Kshs 4.0 tn in December 2020, from Kshs 3.6 tn in December 2019 as a result of increased use of alternative digital channels for deposit mobilization in the sector, coupled with a 7.1% increase in gross loans to Kshs 3.0 tn in December 2020, from Kshs 2.8 tn in December 2019,
- Asset quality in the banking sector deteriorated, with the Gross NPL ratio rising by 2.1% points y/y to 14.1% in December 2020, from 12.0% in December 2019 and this followed a further deterioration in the fourth quarter where the NPL ratio rose by 0.5% points from the 13.6% recorded in September 2020. The deterioration in asset quality is due to the adverse effects of the COVID-19 pandemic such as cash flow constraints and job losses on economic output. NPLs increased during the quarter in Personal and Household by 55.0%, Tourism, 53.0%; Real Estate, 53.0%; Transport and Communication, 47.0%; Trade, 45.0%; and Building and Construction, 41.0%,
- The perceived demand for credit remained unchanged in seven economic sectors namely; Agriculture, Mining and Quarrying, Building and Construction, Financial Services, Energy and Water, Tourism, Restaurant and Hotels and Transport and Communication. The perceived demand for credit increased in Trade and Personal and Household sectors and decreased in the Real Estate Sector due to subdued business activities during the period in the sector,
- The banking sector remained adequately capitalized, with the capital adequacy ratio increasing by 0.4% points y/y to 19.2%, from 18.8% recorded in December 2019. Quarterly, capital adequacy increased by 1.0% points to 19.2% in December 2020, from 18.2% in September 2020. This was as a result of a 6.4% increase in total capital, which increased at a higher rate compared to total risk weighted assets, which recorded a 1.3% increase. The banking sector’s capital adequacy ratio reported in December 2020 was 4.7% points above the minimum statutory limit of 14.5%,
- IFRS 9 implementation had an adverse effect on the banking sector’s capital adequacy as a result of increased provisioning due to the challenging business environment. Commercial banks have therefore injected additional capital to accommodate the expected increase in credit losses,
- In the quarter ended December 2020, 90.0% of respondents indicated that the demand for credit remained unchanged after the repeal of capping of interest rate which was a 1.0% points decline from 91.0% respondent in December, and,
- Average liquidity in the banking sector increased by 4.9% points y/y to 54.6% in December 2020, from 49.7% in December 2019. The average liquidity of 54.6% was also a 1.3% points increase from 53.3% recorded in September 2020. This was 34.6% above the minimum statutory ratio of 20.0%. Interbank lending also increased q/q, with 64.0% of commercial banks reporting an increase in their interbank lending activities during the quarter. The improved liquidity position in December 2020 was as a result of increased deposits which contributed 46.0%, maturity of government securities which contributed 21.0%, loan recovery which contributed 21.0% and capital injection contributing 5.0%.
The reduced profitability in the banking sector has led to six listed banks issuing profit warnings during the period. Notably, the Central Bank governor highlighted that the NPL ratio would increase to 17.0% in the near term, if the economy fails to rebound as expected coupled with commercial banks restructuring 54.2% of the loan book as at December 2020. In our view, we believe that the Central Bank should support the sector in the recovery period in its capacity as the lender of last resort and provide additional funding to the sector while closely monitoring the NPL growth across the industry. We expect commercial banks to utilize their improved liquidity for lending to the private sector in the first quarter of 2021. This will in turn boost the sector’s funded income, which declined in 2020 as a result of loan restructuring due to the subdued business environment. We expect the banking sector to remain resilient boosted by the CBK’s efforts to improve their liquidity positions by maintaining the Cash Reserve Ratio at 4.25%, proactive monitoring of the loan book by commercial banks and improved capital adequacy across the sector.
Universe of Coverage:
|
Banks |
Price at 29/01/2021 |
Price at 05/02/2021 |
w/w change |
YTD Change |
Year Open |
Target Price* |
Dividend Yield |
Upside/ Downside** |
P/TBv Multiple |
Recommendation |
|
Diamond Trust Bank*** |
76.0 |
68.5 |
(9.9%) |
(10.7%) |
76.8 |
105.1 |
3.9% |
57.4% |
0.3x |
Buy |
|
I&M Holdings*** |
47.0 |
44.2 |
(6.1%) |
(1.6%) |
44.9 |
60.1 |
5.8% |
41.9% |
0.7x |
Buy |
|
Kenya Reinsurance |
2.5 |
2.4 |
(1.6%) |
5.2% |
2.3 |
3.3 |
4.5% |
40.3% |
0.3x |
Buy |
|
Sanlam |
13.0 |
11.8 |
(9.6%) |
(9.6%) |
13.0 |
16.4 |
0.0% |
39.6% |
1.1x |
Buy |
|
KCB Group*** |
35.9 |
37.1 |
3.3% |
(3.5%) |
38.4 |
46.0 |
9.4% |
33.6% |
1.0x |
Buy |
|
Co-op Bank*** |
12.6 |
12.2 |
(3.2%) |
(2.8%) |
12.6 |
14.5 |
8.2% |
27.0% |
1.0x |
Buy |
|
ABSA Bank*** |
9.3 |
9.3 |
(0.6%) |
(2.7%) |
9.5 |
10.5 |
11.9% |
25.3% |
1.2x |
Buy |
|
Liberty Holdings |
7.5 |
7.9 |
5.3% |
2.6% |
7.7 |
9.8 |
0.0% |
24.1% |
0.6x |
Buy |
|
Standard Chartered*** |
138.5 |
137.0 |
(1.1%) |
(5.2%) |
144.5 |
153.2 |
9.1% |
20.9% |
1.1x |
Buy |
|
Equity Group*** |
36.5 |
37.3 |
2.1% |
2.8% |
36.3 |
43.0 |
5.4% |
20.8% |
1.1x |
Buy |
|
Jubilee Holdings |
280.0 |
272.0 |
(2.9%) |
(1.4%) |
275.8 |
313.8 |
3.3% |
18.7% |
0.7x |
Accumulate |
|
Britam |
7.5 |
7.5 |
1.1% |
7.7% |
7.0 |
8.6 |
3.3% |
17.4% |
0.8x |
Accumulate |
|
Stanbic Holdings |
80.0 |
79.5 |
(0.6%) |
(6.5%) |
85.0 |
84.9 |
8.9% |
15.7% |
0.8x |
Accumulate |
|
NCBA*** |
24.8 |
24.5 |
(1.0%) |
(7.9%) |
26.6 |
25.4 |
1.0% |
4.7% |
0.7x |
Lighten |
|
CIC Group |
2.1 |
2.1 |
1.4% |
(0.5%) |
2.1 |
2.1 |
0.0% |
0.0% |
0.8x |
Sell |
|
HF Group |
3.9 |
3.6 |
(6.2%) |
15.3% |
3.1 |
3.0 |
0.0% |
(17.1%) |
0.1x |
Sell |
|
*Target Price as per Cytonn Analyst estimates **Upside/ (Downside) is adjusted for Dividend Yield ***Banks in which Cytonn and/ or its affiliates are invested in |
||||||||||
We are “Neutral” on the Equities markets in the short term. We expect the recent discovery of a new strain of COVID-19 coupled with the introduction of strict lockdown measures in major economies to continue dampening the economic outlook. However, we maintain our bias towards a “Bullish” equities markets in the medium to long term. We believe there exist pockets of value in the market, with a bias on financial services stocks given the resilience exhibited in the sector. The sector is currently trading at historically cheaper valuations and as such, presents attractive opportunities for investors.
I. Industry Reports
During the week, Hass Consult released the Q4’2020 House Price Index, highlighting that residential house prices stagnated in Q4’2020, registering a 1.2% q/q decline bringing the overall performance for the year to a marginal increase of 0.2% y/y. This was attributed to an average price decline of 4.6% y/y on apartments, while both detached and semi-detached houses retained positive price growth at 0.03% y/y. Other key take-outs from the report include;
- Kileleshwa and Kilimani apartments registered the highest decline in prices of 2.6% and 2.8%, q/q, respectively, as well as declines of 9.9% and 8.6% y/y, respectively, largely attributed to the overall high stock of houses with reduced uptake amid the pandemic,
- Residential rental prices recorded a 1.1% increase q/q, despite a 1.2% fall in apartment’s rental prices during the same period, with apartments in Kilimani registering the highest decline at 4.0%, followed by Kileleshwa at 2.6%, as landlords reduced rental rates in a bid to woo tenants to take up units,
- Average rental prices increased by 5.5% y/y attributed to a 7.3% y/y rise in rental prices for detached houses in 2020, attributed to consumers’ preference to renting as opposed to buying.
The above indices are in line with our Cytonn Annual Markets Review-2020 report, which highlighted that the residential unit prices stagnated with detached houses recording a 0.1% y/y increase in house prices in 2020 while apartments recorded a 0.5% y/y decline in unit prices. This was attributed to tough economic environment that caused buyers to hold on to money amid market uncertainty and reduced disposable income. We expect the market to continue experiencing constrained transaction volumes with the ongoing pandemic, however markets such as Rosslyn, Ridgeways and Ruiru continue to offer above average returns for detached units while for apartments, investment opportunity lies in satellite towns such as Thindigua and Syokimau.
Hass Consult also released their Q4’2020 Land Price Index, and the key take-outs were:
- Land prices in Nairobi’s satellite towns registered sluggish growth in Q4’2020, coming in at 0.4% q/q while the y/y growth dampened registering an unprecedented fall of 1.1% in 2020 compared to a 6.9% rise in 2019,
- Land in Kiambu County registered extensive price corrections in 2020, as Kiambu Town, Ruiru and Limuru recorded the highest annual price declines of 11.4%, 6.0% and 3.0%, respectively after years of speculative land buying activity due to massive infrastructure upgrades,
- Land prices in Nairobi’s suburbs remained stagnant during the quarter and declined y/y by 2.6% in 2020 compared to a 1.7% y/y rise in 2019, and,
- Parklands registered the highest land price decline in 2020 coming in at 7.4% y/y, followed by Riverside at 7.2% y/y. In our view, this is attributable to reduced demand for development land on the commercial space front given the existing oversupply of both office and retail space.
The above findings are slightly different from our Cytonn Annual Markets Review-2020 report, which highlighted that land prices remained resilient in 2020 despite the tough economic environment evidenced by a 2.3% annual capital appreciation and 10.7% 9-year CAGR. In our view, land performance is expected to be on an upward trajectory as investors still consider land a good investment asset in the long term, with land prices in satellite towns expected to continue outperforming those in suburbs due to their affordability, availability in bulk and the improving infrastructure with the implementation of select projects.
II. Residential Sector
During the week, Shelter Afrique, a Pan-African housing lender and real estate developer, partnered with NCBA Bank to provide mortgage financing to 200 home buyers in Nairobi, Mombasa, Kisumu, Kiambu and Machakos counties, in targeted projects such as Tatu City in Kiambu, Eden Beach in Mombasa, and, Edenvale in Nairobi. The housing units being financed include maisonettes and apartments whose prices range between Kshs 5.5 mn to Kshs 20.3 mn, at an interest rate of 13.0%, higher than the market average rate of 11.3% according to the Central Bank of Kenya, with a minimum deposit rate of 10.0% of the property value and a maximum repayment period of 25 years, compared to the market average of 20 years. NCBA Bank seeks to provide customers with property loans to cover purchase of plots, construction financing and loans to buy and build thereby boosting the number of mortgage accounts which stands at 27,993 as at 2019 out of an adult population of more than 24.0 million people in Kenya. In terms of mortgage penetration, Kenya has continued to record a relatively low mortgage to GDP ratio which stands at 2.5% as at 2019, compared to other African countries such as Namibia at 25.4%. The low mortgage uptake has been low due to; i) the high interest rates and high deposit requirements, ii) soaring of property prices, iii) low-income levels making it hard to service loans, and, v) lack of credit risk information for those in the informal sector leading to their exclusion.
The graph below shows the Mortgage to GDP ratio of different countries as of 2019;
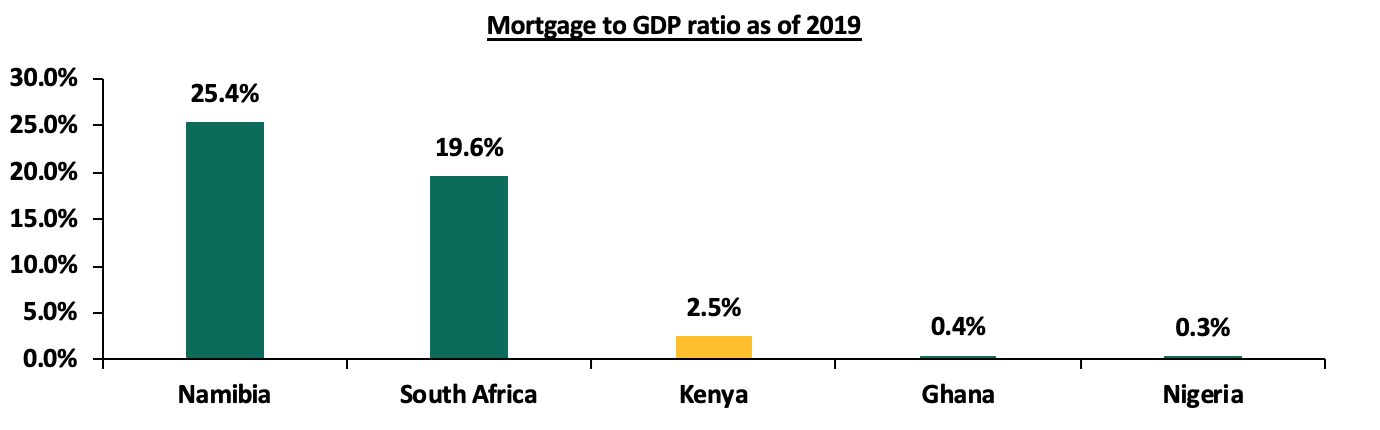
Source: Centre of Affordable Housing Africa
The above partnership is expected to result in increased mortgage uptake thus sparking an increase in the urban home ownership level which has remained low in Kenya at approximately 21.3%, implying that more than 78.7% of the total population are renters, compared to more developed countries such as South Africa which have more than 53.0% of the population owning homes. The low home ownership level in Kenya is mainly attributed to unavailability and unaffordability of housing finance.
The graph below shows the home ownership percentages for different countries in comparison to Kenya;
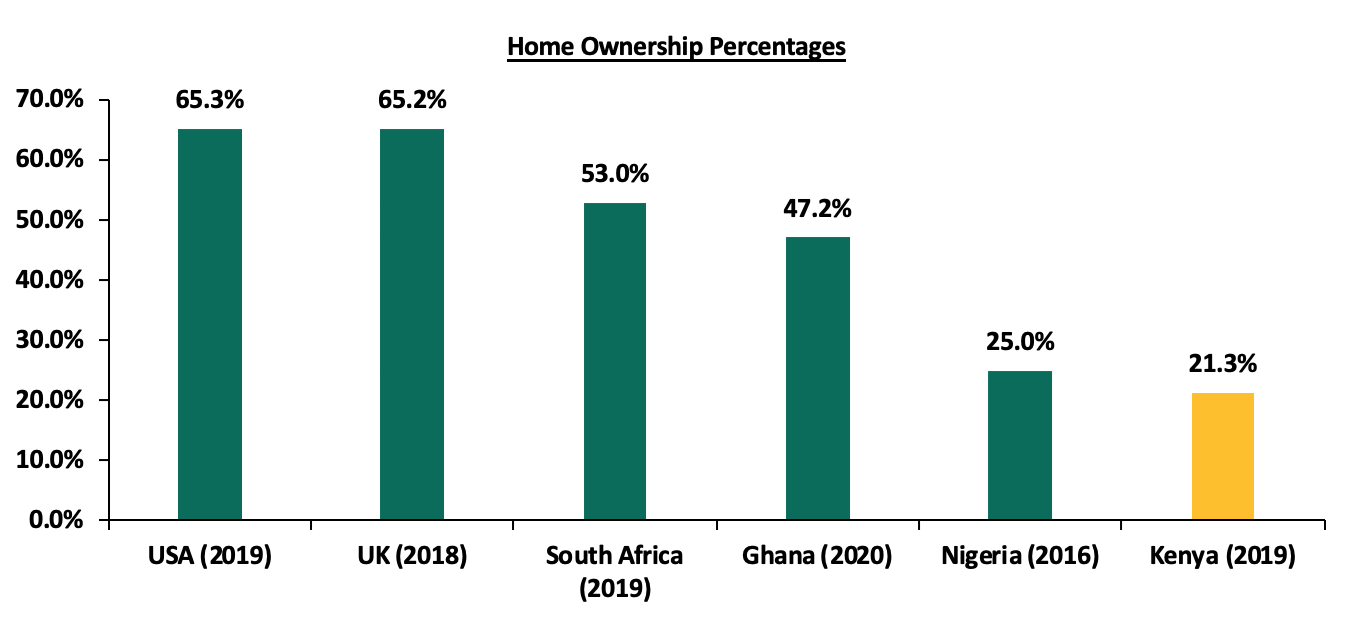
Source: Centre of Affordable Housing Africa
III. Retail Sector
During the week, French Retailer Carrefour opened a new outlet at Nextgen Mall along Mombasa Road, in an expansion drive that saw it take up 1,800 SQFT of space previously occupied by Souk Bazar supermarket. This brings its number of operational outlets to 10 having opened its first outlet in Mombasa County at City Mall in Nyali in November 2020. The continued expansion into Nextgen Mall is supported by the high quality space with the mall, improved infrastructure, as well as high footfall within the mixed-use development. The average rent per SQFT in Mombasa Road stands at Kshs 140, which is relatively low compared to the market average of Kshs 169. This is mainly attributable to dwindled demand for space within the node due to unattractiveness to investors given the traffic congestion in the area.
The table below shows the retail performance of nodes in the Nairobi Metropolitan Area in 2020;
(All values in Kshs unless stated otherwise)
|
Nairobi Metropolitan Area Retail Market Performance FY’2020 |
|||
|
Area |
Rent /SQFT FY’2020 (Kshs) |
Occupancy% FY’2020 |
Rental Yield FY’2020 |
|
Westlands |
209 |
81.5% |
9.9% |
|
Karen |
217 |
81.0% |
9.8% |
|
Kilimani |
171 |
82.5% |
8.5% |
|
Ngong Road |
178 |
80.3% |
8.2% |
|
Kiambu road |
176 |
67.5% |
6.9% |
|
Thika Road |
158 |
70.5% |
6.3% |
|
Eastlands |
137 |
70.2% |
6.1% |
|
Mombasa road |
140 |
70.0% |
5.9% |
|
Satellite towns |
133 |
73.0% |
5.8% |
|
Average |
169 |
75.2% |
7.5% |
Source: Cytonn research 2020
The taking up of space left by troubled retailers such as Tuskys and Shoprite, and the continued expansion by local and international retailers is expected to cushion the retail sector, however, we expect the trend towards online shopping to continue affecting uptake of physical space whose oversupply in the Nairobi Metropolitan Area currently stands at 3.1 mn SQFT.
The table below shows the number of stores of key local and international retail supermarket chains in Kenya;
|
Main Local and International Retail Supermarket Chains |
||||||
|
Name of Retailer |
Initial number of branches |
Number of branches opened in 2021 |
Closed branches |
Current number of Branches |
Branches expected to be opened / closed |
Projected total number of branches 2021 |
|
Naivas Supermarket |
69 |
0 |
0 |
69 |
1 |
70 |
|
Tuskys |
52 |
0 |
14 |
52 |
27 |
25 |
|
QuickMart |
35 |
0 |
0 |
35 |
0 |
35 |
|
Chandarana Foodplus |
20 |
0 |
0 |
20 |
0 |
20 |
|
Carrefour |
9 |
1 |
0 |
10 |
2 |
12 |
|
Uchumi |
37 |
0 |
33 |
4 |
0 |
4 |
|
Game Stores |
3 |
0 |
0 |
3 |
0 |
3 |
|
Choppies |
15 |
0 |
13 |
2 |
0 |
2 |
|
Shoprite |
4 |
0 |
2 |
2 |
0 |
2 |
|
Nakumatt |
65 |
0 |
65 |
0 |
0 |
0 |
|
Total |
309 |
1 |
127 |
197 |
30 |
173 |
Source: Online Research
We expect the performance of the real estate sector to be cushioned by resilience of land prices, provision of mortgage facilities to increase home ownership and expansion by local and international retail chains taking up spaces left by troubled retailers.
With the emergence of COVID-19, measures to reduce the spread of the virus such as: social distancing, working from home and minimizing physical touch, have been put in place by most governments and consequently, this has led to the adoption of cashless payment systems. According to the Central Bank of Kenya (CBK), since March 2020, the country has witnessed a rapid increase in mobile and digital payments with the monthly volume of Person-to-person transactions increasing by 87.0% to hit Kshs 684.5 bn. On 28th December 2020, CBK circulated the draft Kenya National Payment System Vision and Strategy 2021-2025, a strategy document which sets out the vision and strategic initiatives for the National Payment System for the next five years (2021-2025) for comments from the public up to 29th January 2021. This move by the Central Bank is aimed at beefing up regulations around digital payment services, which include mobile money. The regulator’s main objective is to formulate and implement policies that best promote the establishment, regulation and supervision of efficient and effective payment, clearing and settlement systems.
In our previous weekly on FinTech amid COVID-19, we briefly discussed how the FinTech industry has been affected by the pandemic and concluded that the pandemic had hastened the trend towards digitization of financial services. It was clear that the trend towards greater digitalization of financial services is here to stay, and that to build inclusive societies and address rising inequalities during and after the ongoing crisis, there needs to be concerted efforts to close the digital divide across and within countries to reap the benefits of digital financial services.
This week, we will focus on mobile payment platforms where we will look at:
- The Evolution of Mobile Payments,
- Current Regulation around Mobile Payment Platforms in Kenya,
- Factors driving the Growth of Mobile Payment Platforms and their Benefits, and
- Conclusion
Section I: The Evolution of Mobile Payments
Payment systems have existed for a while and have been evolving, in the 20th Century we saw the invention of credit card payments. The most recent developments in the payments industry is the use of mobile phones to transact, the first being PayPal in 1998, followed by the idea of digital wallets whose popularity has grown quite fast. Mobile phones can do so much more today than they could about 10 years ago, and due to their near-universal presence, the adoption of mobile payment platforms comes as no surprise. Aside from this, the pandemic has certainly accelerated the adoption of mobile payments and according to a study done by Juniper Research on alternative payments and the evolving e-commerce landscape, e-commerce payments are forecasted to reach USD 3.1 tn in 2025, from the USD 2.1 tn recorded in 2020.
In Africa, mobile payment platforms are becoming more common and there has been significant investment into the industry due to its growth potential with more than USD 50.0 bn having been put into the industry since 2010. The huge investment in Africa is due to the huge opportunity that has been brought about by the positive demographics, for example, according to a report by the Global System for Mobile Communications Association (GSMA), the number of unique mobile subscribers in Sub-Saharan Africa as at the end of 2019 was 477 mn subscribers, and is projected to grow at a CAGR of 4.3% over the next five years to 614.0 mn subscribers. Africa still has a lot of unbanked population estimated at 66.0% as at 2019, and therefore there is still significant room to improve on financial services penetration.
Closer home, the central government has been instrumental in the development of payment platforms which started with the modernization program in 2005, which led to the establishment of the Kenya Electronic Payment and Settlement System (KEPSS) or the Kenya RTGS system. This was meant to help resolve several weaknesses that the system suffered such as; the limited interoperability and coordination across payment infrastructure where there was limited sharing of information. In 2007, through the Central Bank of Kenya’s facilitation, mobile money was introduced in the country through the birth of M-PESA, which has been instrumental in the development of the industry to a global level. The amount of cash transacted has continued to increase growing at a CAGR of 20.2% over the last 10 years with Safaricom having a market share 98.8%. The progress made in mobile money can be seen from the below graph which highlights the growth of transaction values over the past 10 years:
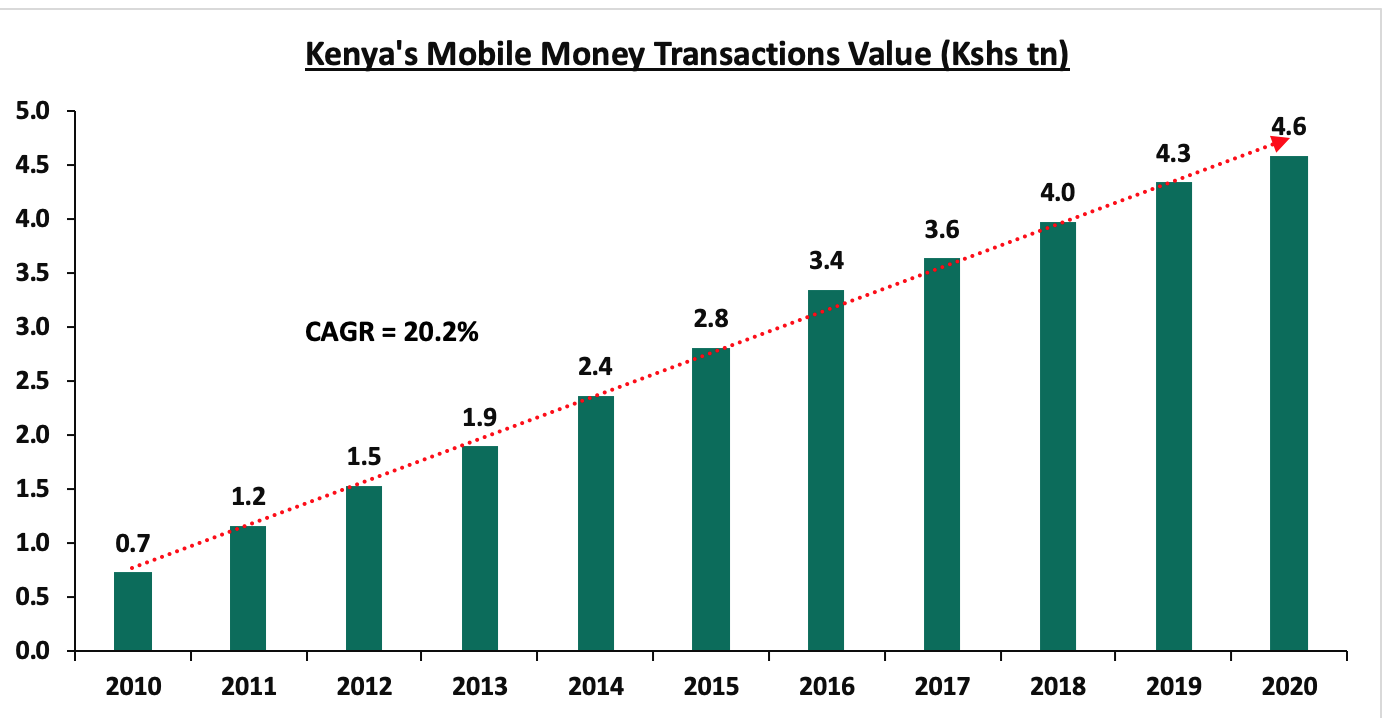
Source: Central Bank of Kenya
As a result of the increasing importance of mobile payment platforms, the Central Bank is set to tighten oversight of mobile money in a bid to curb the increased risks of fraud or cybercrime that could lead to a potential loss of clients’ funds.
Section II: Current Regulation around Mobile Payment Platforms in Kenya
The first National Payment System (NPS) framework in Kenya was developed in 2004 with the main objective being modernizing the existing payment system and providing a basis for a new legal and regulatory framework, which would later enable the development of the NPS Act, 2011 and NPS Regulation, 2014. Back then, some of the challenges had been; (i) the lack of a real-time settlement system, (ii) lack of trust on cheque payments especially for high values, and, (iii) the lack of coordinated public awareness among key stakeholders.
In 2003, only two out of every ten Kenyans had access to prudentially regulated financial service. Today, that number stands at eight out of every ten Kenyans, providing not only a means of holding monetary value but also a safe way of transmitting it. The NPS has improved and comprises of payment service providers (PSPs), clearing and settlement participants and users (individuals, businesses, corporate and government institutions), who interact based on rules and procedures that govern different parts of the payments system.
Following the continued advancement in financial and digital inclusion, the dominance of cash, even in low-value transactions, is reducing although at a slow pace. Below is a graph highlighting the trend since 2010:
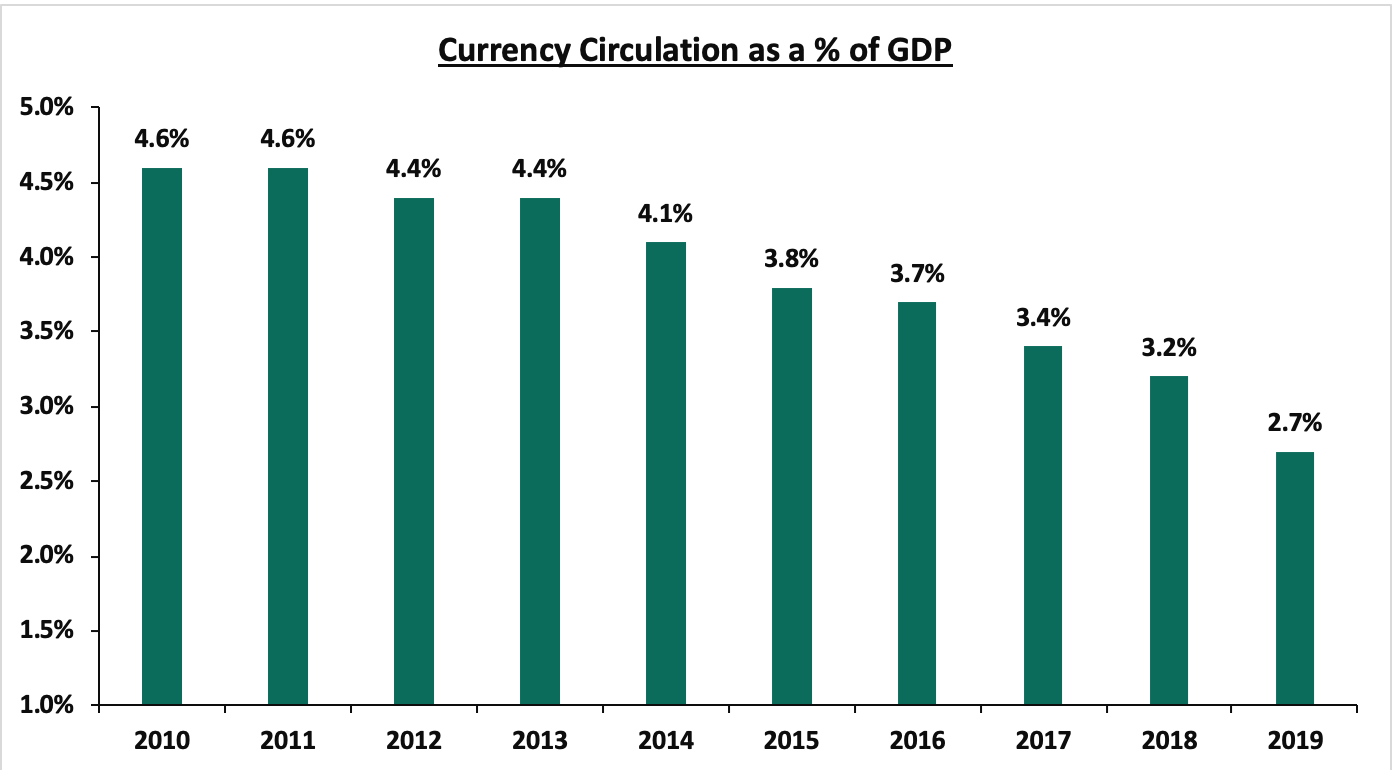
Source: Central Bank of Kenya
It is important to note that there have been some significant developments in the payments system over the past 5 years, particularly in the growth of digital payments where, in 2013, government-to-person (G2P) payments was launched, (e-Citizen). This has enabled a range of public services to be offered online and paid for through mobile money. Despite the progress, one of the areas of concern is the pricing of payment services which are quite high sometimes or too complex to understand, leading users to lose trust. The government is keen to change the narrative and intends to gradually roll out pricing principles such as those introduced in December 2020 across the payment ecosystem.
The CBK is still aware of the fact that a significant part of the population still finds it hard to access the NPS and this is one of the main motivations behind the draft Kenya National Payment System Vision and Strategy 2021-2025. According to the document, the foundational element of the payment system is the legal and regulatory framework as outlined in the NPC Act of 2011, and the NPS Regulation of 2014. For example, the Kenya RTGS system (Kenya Electronic Payment and Settlement System - KEPSS) has its own set of rules that govern how the participants relate with each other. Some of the strategic objectives from the CBK document include;
- To facilitate the establishment of payment systems that will meet the diverse needs of users and supports the country’s development agenda,
- To ensure payment systems are secure through influencing industry and global standards and adopting safe technologies,
- To implement a supportive policy, legal and regulatory framework that is firmly enforced across all existing and emerging players, and,
- To power an ecosystem based on collaboration leading to the launch of premier and globally competitive innovations.
Based on the ongoing discussions around the NPS vision and strategy 2021-2025, Central Bank intends to review the NPS Act, 2011 and Regulations, 2014 to make the laws future-proof. This will ultimately pave way for the development of any further guidelines and give the regulator (CBK) the necessary powers for enhanced oversite of the payments system. In our view, the initiative by the CBK is very timely and it will go a long way in helping them achieve their goal of enhancing the country’s leadership in digital payments. Enhanced regulation around this area will bring clarity in terms of the rules to be followed and fast track the development of the industry.
Section III: Factors driving the Growth of Mobile Payment Platforms and their Benefits
One of the main factors that has driven the growth of mobile payment platforms over the past year is the pandemic, as people now prefer using mobile or card payments as opposed to traditional cash transactions in line with the social distancing restrictions that were introduced. Further to this, governments have been advocating for the same in a bid to curb the spread of the Covid-19 virus. Aside from this, transitioning into a cashless economy is a topic that has been on our minds for a few years now. The factors that have supported the growth of mobile payment platforms include:
- The growth of E-commerce – many businesses today are opting for an online-based business model which has proven to be more cost effective due to the low setup and overhead costs. As more people continue to embrace this, more transactions are being done through mobile phones and applications with these businesses. According to the e-commerce foundation, more than 25.0% of consumers purchase weekly through mobile platforms. Ordering food through an app and paying for it remotely is becoming a norm and with the increasing number of data analysis tools, this is helping business owners everywhere to customize their offerings to increase sales. The increase in number of ecommerce businesses means higher volumes for mobile payment platforms,
- The increasing number of mobile phone subscribers – as highlighted earlier, the growing number of mobile phone subscribers, currently at 5.2 bn subscribers according to the Global System for Mobile Communications - GSMA, has made it easy for these mobile platforms to access a wider customer base compared to traditional payment methods. For example, in countries like Kenya where mobile phone penetration is high, a large portion of the population is able to transact with ease through a mobile platform. In areas with low penetration, it is takes a longer time for mobile payment platforms to gain traction, and,
- Government Initiatives - the involvement of government in the development of payment systems has proven to be a key factor when it comes to the growth of mobile payments. In Kenya for example, the central bank was involved during the inception of M-PESA and also other initiatives such as e-Citizen have promoted the growth of mobile payment platforms in the country. Additionally, proper guidelines and regulation is important since it provides a clear mode of operation for the various players in the ecosystem. The involvement of the government also builds trust in the system and ultimately, more users will be willing to use the service,
During the advent of the coronavirus, the CBK announced and rapidly implemented several emergency measures to support the financial sector in its role of financing the economy. The government did so to encourage the use of contactless modes of payment, to prevent the spread of the virus through handling banknotes. Consequently, a significant increase in the use of mobile money was noted during the period the measures were in place; person-to-person transactions increased by 87.0% between February and October 2020.
Benefits of mobile payment platforms:
Some of the major benefits of using mobile payments include:
- Convenience – by using mobile payment platforms to make payments, consumers find it easier to pay for any goods or services since the process is not only faster but it increases the engagement between the seller and the buyer. A vendor can send coupons to his/her customers and recommend other products or even just collect feedback on the use of the product. This ultimately promotes customer loyalty,
- Security – using mobile payment platforms are considered to be a more secure way to transact because it eliminates the need to carry hard cash or cards which can be stolen. Additionally, the extra layers of authentication such as the use of biometrics or two-step verification helps ensure the payments being made are not fraudulent,
- Cost-Effective – as a result of the already existing infrastructure, i.e. mobile phones, it is relatively cheaper to set up and transact over a mobile-based platform than traditional methods. For example, to be able to transact using a card, one has to acquire the same through a third party and the vendor also needs to support payments through the same by setting up the necessary infrastructure. For mobile platforms, on the other hand, one might only have to download and register on an app and transacting is a few button presses away, and,
- Easy tracking – the use of mobile payment platforms make tracking one’s transactions easier and helps when it comes to household budgeting and tracking ones spending. Further to this, it reduces paper waste and is more cost-effective for businesses.
Section IV: Conclusion
In conclusion, mobile payment platforms in the country have grown significantly mainly supported by the increasing number of mobile phone users, coupled with the rapid growth in ecommerce where businesses make use of the same platforms for ease of transacting. The move by the government to set up the National Payment Service Vision and Strategy 2021-2025 is a step in the right direction, given the collaborative approach the CBK has taken by including both industry experts and other stakeholders. This means that for mobile payments, there will be: (i) increased regulation where we might see changes like the possible rationalization of transaction fees and other charges related to mobile transactions. This will ultimately improve the quality of services that users will be receiving and help provide financial services to the unbanked population in the country.
We recommend that the government provide incentives to help encourage service providers to participate to encourage competition in the sector where M-PESA controls more than 95.0% of the market.
Disclaimer: The views expressed in this publication are those of the writers where particulars are not warranted. This publication is meant for general information only and is not a warranty, representation, advice or solicitation of any nature. Readers are advised in all circumstances to seek the advice of a registered investment advisor.

- Talk to us
- Kenya
- P.O Box 20695 - 00200, Nairobi, Kenya
- Cell +254709101200
- Tel +254709101200
- WhatsApp +254741676635
- United States
- +254709101200
- DOWNLOAD OUR APP
-


- Kenya
- 8th Floor, Pinetree Plaza, Kaburu Drive, Ngong Road, Nairobi, Kenya
- USA
- Suite 1150, 1775 Eye Street NW, USA, Washington DC 20006, USA
- Investments
- High Yield
- Private Equity
- Real Estate
- Real Estate
- RiverRun Estates
- Cytonn Towers
- The Ridge
- Taraji Heights
- The Alma