Cytonn Annual Markets Review - 2020
By Research Team, Jan 3, 2021
Executive Summary
Global Market Review
The world economy is projected to have contracted by 4.4% in 2020 but is projected to recover in the coming years, with OECD projecting a 4.2% growth in 2021. The key path and pace of recovery shall largely be dependent on how fast the COVID- 19 vaccinations shall reach most countries and how effective the same shall be. Government policies which have remained relatively accommodative shall be the key drivers towards recovery and this should involve investing in the right sectors and ensuring that there is money in circulations amidst the significant job losses and business struggles;
Sub-Saharan Africa Region Review
The region is projected to have witnessed its first contraction in the last 27 years, with the overall economy having contracted by an average of up to 3.3% in 2020. In line with the global outlook, it is projected that there would be recovery in 2021 driven by commodity demand globally and as regional governments put in place policies to support growth. There has been a lot of support from international organisations like the IMF to help support these vulnerable economies through direct provision of funding and also offering debt relief;
Kenya Macro Economic Review
The Kenyan economy was worst hit by the pandemic in the first half of the year having contracted by 0.4%, as there was a 5.7% contraction in Q2’2020 compared to a 5.3% growth recorded in a similar period in 2019. This is the first contraction since the third quarter of 2001 when the country recorded a 2.5% contraction. The worst-hit sector was Accommodation and Food Services which contracted by 83.3% in Q2’ 2020 as most facilities operated at bare minimums. With the reduced activity we have seen the fiscal deficit widen to 8.2% from the 6.0% projected in the budget due to the reduction in tax revenues. There is projection of recovery in the coming years but this will largely be dependent on the health situations and if there will be a need for more containment measures;
Fixed Income
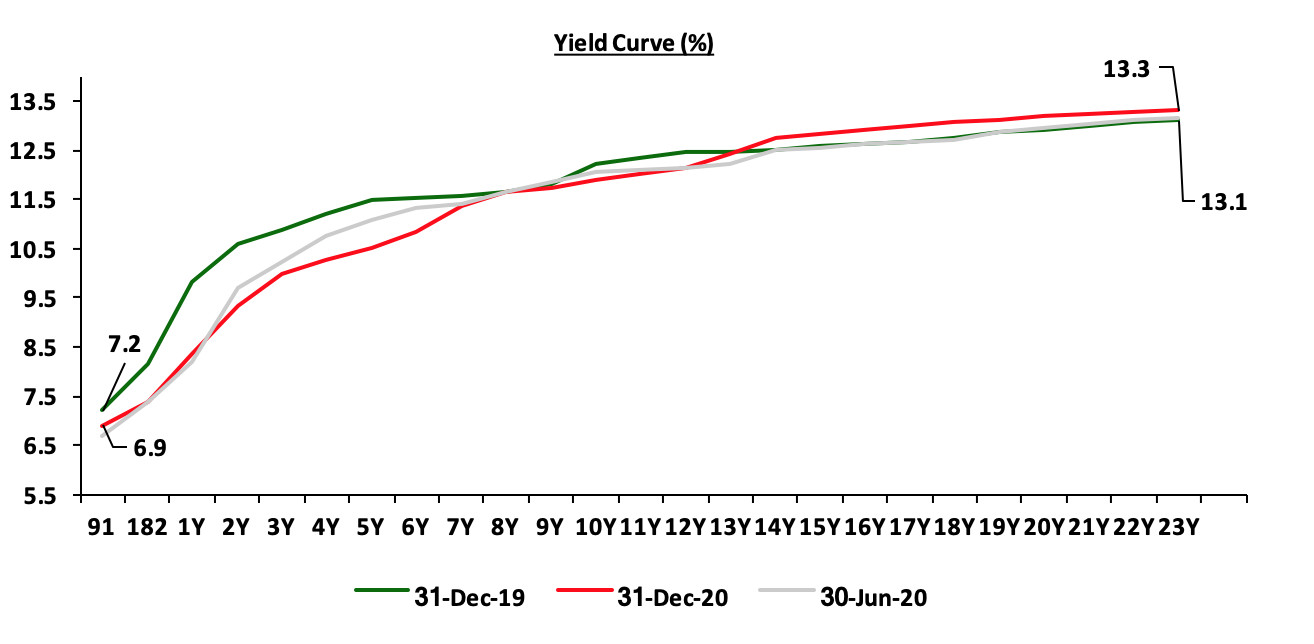
The accommodative monetary stance and the perceived increased risk aversion by banks, led to an increase in demand for government securities with T– bills and T-bonds being 130.3% and 130.9% subscribed respectively. The Monetary Policy Committee revised the Central Bank Rate down to 7.0% from 8.5% at the beginning of the year and also reduced the Cash reserve ratio to 4.25% from 5.25%. The yield curve steepened with the shorter papers yields adjusting downwards while those of longer dated papers adjusted upwards. The yields on the 91-day, 182-day and 364-day T-bills declined to 6.9%, 7.4% and 8.3% in 2020 from 7.2%, 8.2% and 9.8% at the end of 2019, respectively;
Equities
The Kenyan equities market was on a downward trend with all indices declining: NASI, NSE 25 and NSE 20 were down by 8.6%, 16.7% and 29.6%, respectively. One of the worst hit sectors was the banking sector, which was down by 28.7% due to the poor performance as the companies reported a 32.4% decline in their Earnings per Share (EPS) growth. Safaricom recorded gains of 8.7% as they benefited from the working from home environment and increased digitization. This year, 15 companies issued profit warnings, as compared to 10 companies in 2019. On the positive side, HomeBoyz Entertainment was listed by way of introduction on the Growth Enterprise Market Segment and NSE rolled out the Unquoted Securities Platform, a market infrastructure that will facilitate the trading, clearing and settlement of securities of unlisted companies;
Real Estate
In 2020, the real estate sector recorded moderate activities with a general decline in concluded transactions. There was a decline in the performance of all the sectors, resulting to an average rental yield for the real estate market of 6.1%, 0.9% points lower compared to 7.0% recorded in 2019.
The table below is a summary of thematic performance of average rental yields in 2020 compared to 2019;
|
Real Estate Thematic Performance- Average Rental Yields |
|||
|
Theme |
Rental Yield FY’2020 |
Rental Yield FY’2019 |
Y/Y Change (% Points) |
|
Residential |
4.7% |
5.0% |
(0.3%) |
|
Commercial Office |
7.0% |
7.5% |
(0.5%) |
|
Retail |
7.5% |
7.8% |
(0.3%) |
|
Mixed_Use Developments (MUDs) |
7.1% |
7.3% |
(0.2%) |
|
Serviced Apartments |
4.0% |
7.6% |
(3.6%) |
|
Grand Average |
6.1% |
7.0% |
(0.9%) |
The subdued performance is attributable to reduced sale and rental rates in a bid to attract and retain tenants amid a tough economic environment, as well as oversupply of approximately 6.3 mn SQFT of office space and 3.1 msn SQFT of retail space in the wake of reduced demand for physical space in the two sectors.
- Weekly Rates:
- Cytonn Money Market Fund closed the week at a yield of 10.73%. To invest, just dial *809#;
- Cytonn High Yield Fund closed the week at a yield of 13.52% p.a. To invest, email us at sales@cytonn.com and to withdraw the interest you just dial *809#;
- For an exclusive tour of Cytonn’s real estate developments, visit: Sharp Investor's Tour and for more information, email us at sales@cytonn.com;
- We successfully handed over Phase 3 of the Alma project on the 22nd of December 2020. Please see attached photos of the happy homeowners;
- We continue to offer Wealth Management Training daily, from 9:00 am to 11:00 am, through our Cytonn Foundation. The training aims to grow financial literacy among the general public. To register for any of our Wealth Management Training, click here;
- For Pension Scheme Trustees and members, we shall be having different industry player’s talk about matters affecting Pension Schemes and the pensions industry at large. Join us every Wednesday from 9:00 am to 11:00 am for in-depth discussions on matters pension;
- If interested in our Private Wealth Management Training for your employees or investment group, please get in touch with us through wmt@cytonn.com;
- We have 10 investment-ready projects, offering attractive development and buyer targeted returns. See further details here: Summary of Investment-ready Projects;
- We are currently running a Christmas offer on some of our Real Estate projects, email at us at sales@cytonn.com for more information;
For recent news about the company, see our news section here.
Global Economic Growth
Global growth is projected to have contracted by 4.4%, according to IMF, World Economic Outlook (October 2020) led by the significant contraction of 5.5% and 3.3% for the developed and developing economies respectively. The decline was largely due to the impact of COVID-19 more specifically:
- Worsening economic conditions as a result of COVID-19 infections leading to large disruptions in business activity than expected,
- Decline in consumption of goods and services as people had to rely on their savings due to loss of jobs and inactive business environment as well as effects from adhering to social distancing and movement restrictions set in place to reduce the Virus spread,
- Depressed mobility as both domestic and international travel, and,
- A contraction in global trade due to the measures put in place to control COVID-19 such as restricted movement.
According to the World Trade Organization (WTO) in a press release (Press/862 Press Release) world merchandise trade volume is projected to have contracted by 9.2% in 2020 a less severe drop compared to earlier projection of 12.9% in April 2020.
Global Equities Market Performance
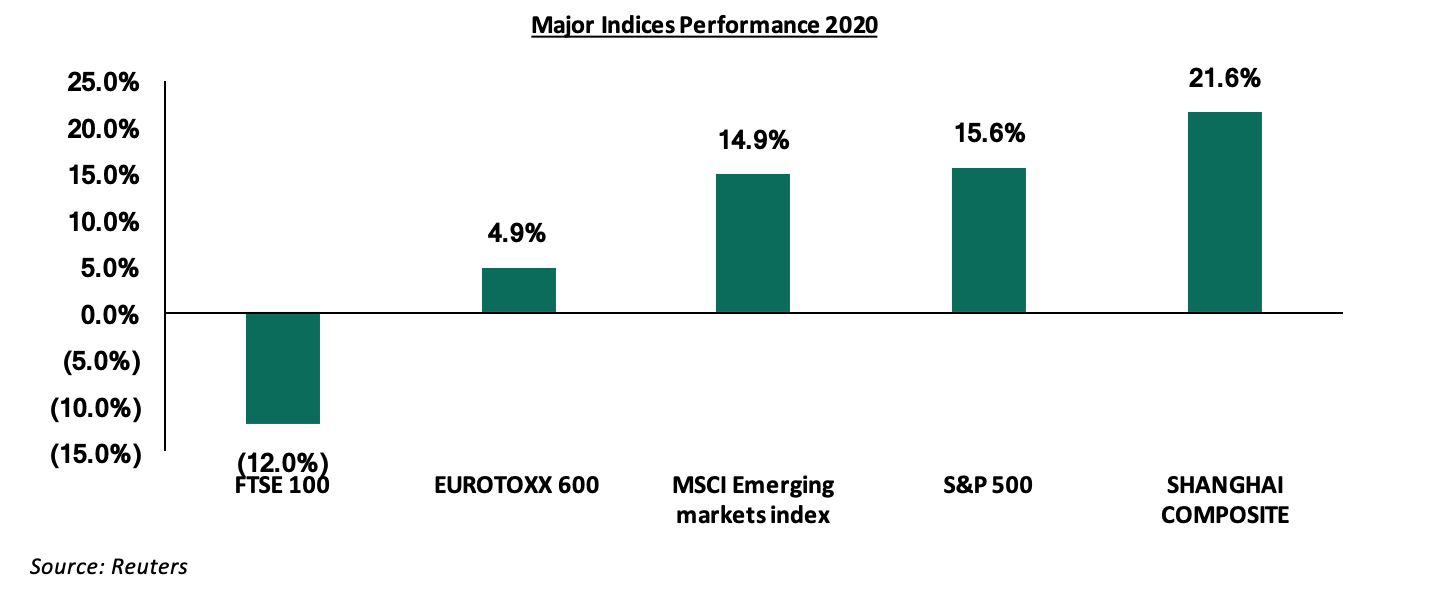
Global equity markets registered mixed performance during the year, with FTSE 100 being the only loser among the major world indices. Despite the tenacity of the COVID-19 pandemic, equities markets have been driven higher by the expected economic recovery and eased monetary policies coupled with the rally in tech stocks during the third and fourth quarters of the year. Positive results from late-stage COVID-19 vaccine trials also led to the spontaneous recovery of the markets. Below is a chart highlighting the performance of select stock indices;
Global Commodities Market Performance
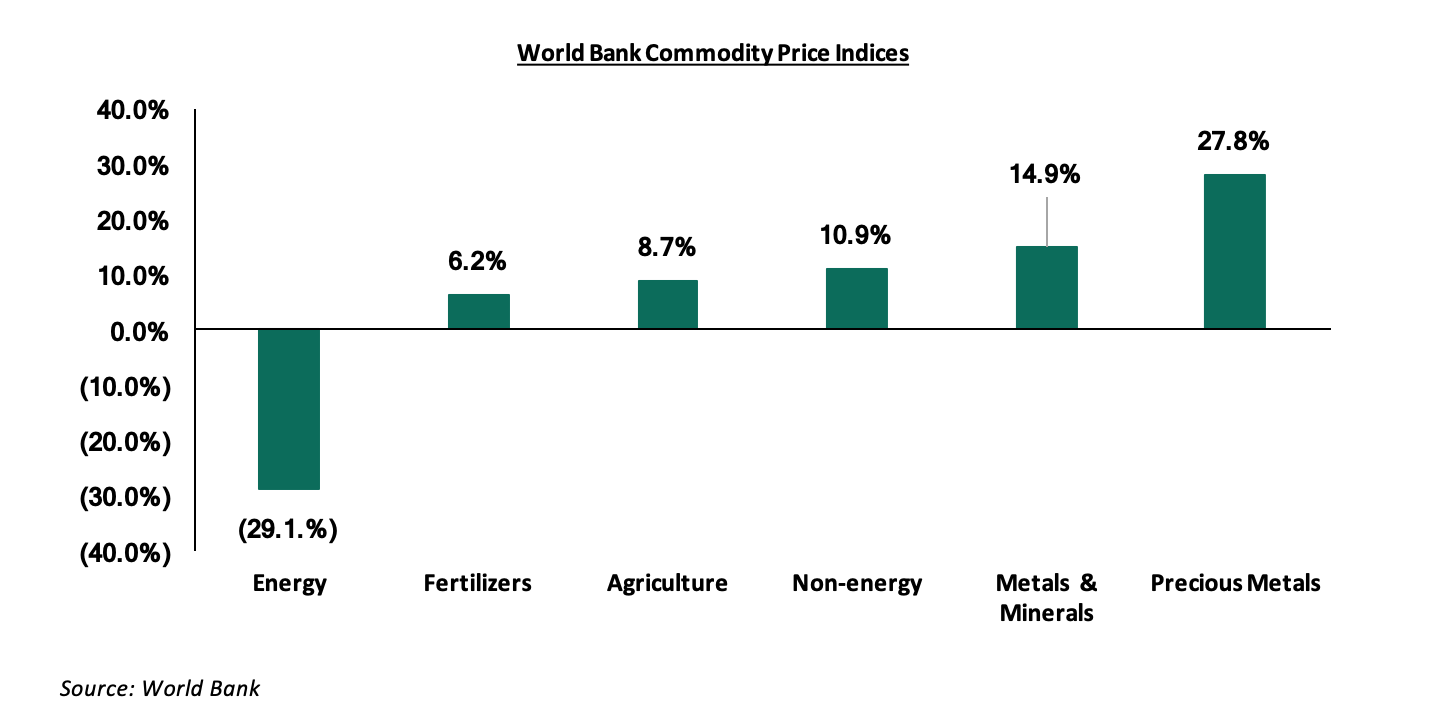
Global commodity prices registered mixed performance in 2020, with energy prices getting the greatest impact from COVID-19 having declined by 29.1% largely driven by slowing global demand. Fertilizers, agriculture, non-energy commodities, metals & minerals, registered gains of 6.2%, 8.7%, 10.9% and 14.9%, respectively while precious metals were the largest gainers gaining by 27.8%, according to the World Bank Commodity Prices Index. The gains by precious metals can be attributed to the heightened preference by investors who sought them as the key store of value. Below is a summary performance of various commodities;
Economic Growth
According to the World Bank’s latest African Pulse Issue, economic activity in the region is projected to have contracted by 3.3% in 2020, while the IMF, in their Regional economic outlook: Sub-Saharan Africa publication project a 3.0% contraction, from the 2.3% growth recorded in 2019. The contraction represents the first recession in Sub-Saharan Africa in 27 years, when the regional economy contracted by 0.9% in 1993 according to World Bank data. A combination of containment measures to curb the spread of the pandemic coupled with contraction in key sectors such as global trade, tourism and diaspora remittances contributed to subdued economic activity and the subsequent contraction in economic growth. The World Bank however expects the Sub-Saharan economy to pick up to a growth of 2.1% in 2021, with the IMF projecting a more optimistic recovery of 3.1%, boosted by the relaxation of containment measures, a rebounding global economy and stabilisation of commodity prices.
Currency Performance
All select currencies depreciated against the US Dollar in 2020, apart from the Ugandan Shilling, which gained by 0.4%, supported by subdued appetite for hard currency among commercial banks and importers in the manufacturing, telecommunications and energy sectors. The Zambian Kwacha was the worst performer for the third year running, depreciating by 50.4% against the dollar, attributable to low copper production, low commodity prices arising from subdued demand and high demand for hard currency from investors and the government as it seeks to meet its debt repayment obligations. The Kenya Shilling depreciated by 7.7% in 2020 to close at Kshs 109.2 against the US Dollar, compared to Kshs 101.3 recorded at the end of 2019, driven by the decline in dollar receipts from dollar-earning sectors such as tourism and horticulture in addition to high demand for hard currency from investors.
Below is a table showing the performance of select African currencies;
|
Select Sub Saharan Africa Currency Performance vs USD |
|||||
|
Currency |
Dec-18 |
Dec-19 |
Dec-20 |
2019 y/y change (%) |
2020 y/y change (%) |
|
Ugandan Shilling |
3,699.3 |
3,660.0 |
3,647.0 |
1.1% |
0.4% |
|
Tanzanian Shilling |
2,295.0 |
2,293.0 |
2,314.0 |
0.1% |
(0.9%) |
|
Botswana Pula |
10.7 |
10.6 |
10.8 |
1.3% |
(2.3%) |
|
Ghanaian Cedi |
4.8 |
5.7 |
5.8 |
(17.4%) |
(3.2%) |
|
Malawian Kwacha |
719.8 |
729.1 |
763.2 |
(1.3%) |
(4.7%) |
|
South African Rand |
14.3 |
14.0 |
14.7 |
2.5% |
(5.0%) |
|
Kenyan Shilling |
101.8 |
101.3 |
109.2 |
0.5% |
(7.7%) |
|
Mauritius Rupee |
34.2 |
36.2 |
39.6 |
(6.0%) |
(9.3%) |
|
Nigerian Naira |
307.0 |
306.0 |
380.7 |
0.3% |
(24.4%) |
|
Zambian Kwacha |
11.9 |
14.1 |
21.1 |
(18.1%) |
(50.4%) |
Source: Reuters
African Eurobonds
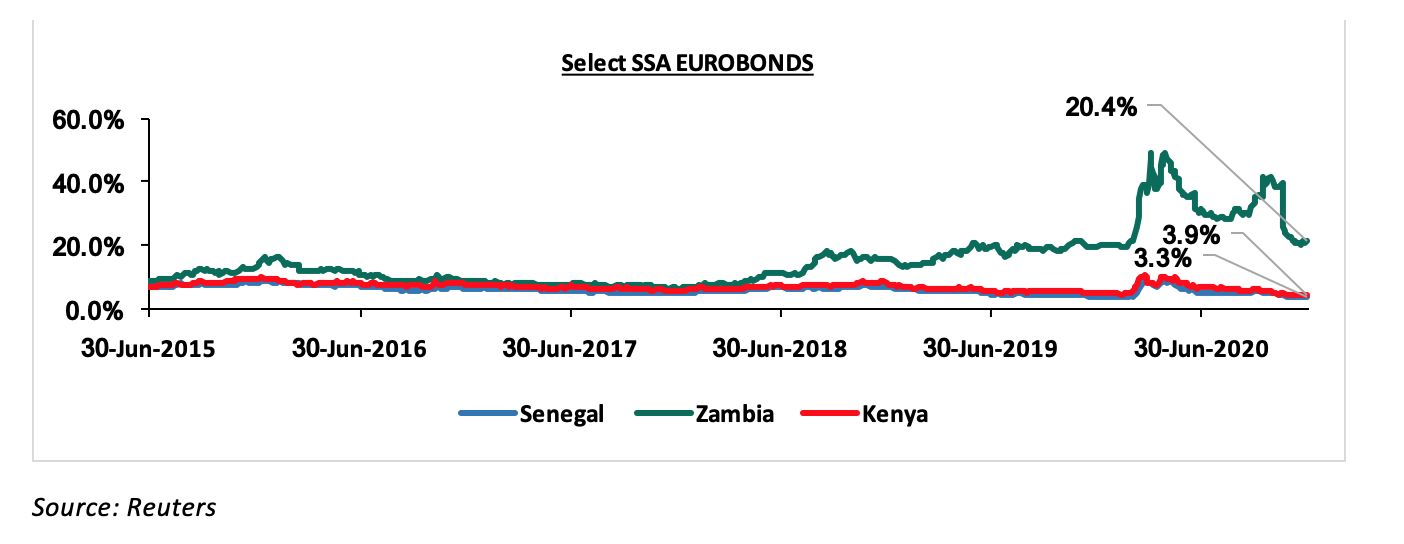
Yields on African Eurobonds generally declined in 2020, partly attributed to the global hunt for higher yields as a result of massive monetary easing in developed markets and recovering private capital inflows. Key to note is that there was a spike recorded during Q2’2020 due to the heavy outflows recorded by emerging market funds as investors dumped risky assets amid the coronavirus crisis. Yields on the Zambia Eurobond however recorded a rise during the year, attributable to the exodus of foreign investors as the country failed to honour its service obligations of a USD 42.5 mn Eurobond coupon in November. The country is struggling with high debt levels. According to the IMF’s Regional Economic Outlook: Sub-Saharan Africa, Zambia’s debt to GDP ratio is estimated at 120.0% in 2020, further confirming fears of a debt crisis in the country. The Government of Zambia’s debt was downgraded by Fitch Ratings in September 2020 to C from CC.
Below is a graph showing the Eurobond secondary market performance of select 10-year Eurobonds issued by their respective countries;
Equities Market Performance
Sub-Saharan Africa (SSA) stock markets recorded mixed performance in 2020, with Nigeria’s NGSEASI being the best performing index gaining by 20.6% driven by the accommodative monetary stance adopted by the Central Bank. Zambia’s LASIZ was the worst-performing index with losses of 39.0% due to the economic uncertainties in the country. Below is a summary of the performance of key exchanges:
|
Equities Market Performance (Dollarized*) |
||||||
|
Country |
Index |
Dec-18 |
Dec-19 |
Dec-20 |
2019 y/y change (%) |
2020 y/y change (%) |
|
Nigeria |
NGSEASI |
102.4 |
87.7 |
105.8 |
(14.3%) |
20.6% |
|
Rwanda |
RSEASI |
0.1 |
0.1 |
0.2 |
(1.4%) |
3.4% |
|
Tanzania |
DARSDSEI |
1.6 |
1.5 |
1.5 |
(7.0%) |
0.7% |
|
South Africa |
JALSH |
3,675.7 |
4,079.3 |
4,069.0 |
11.0% |
(0.3%) |
|
Kenya |
NASI |
1.4 |
1.6 |
1.4 |
19.2% |
(15.2%) |
|
Ghana |
GGSECI |
518.5 |
405.5 |
332.5 |
(21.8%) |
(18.0%) |
|
Uganda |
USEASI |
0.4 |
0.5 |
0.4 |
10.3% |
(26.8%) |
|
Zambia |
LASILZ |
440.7 |
303.3 |
185.2 |
(31.2%) |
(39.0%) |
|
*The index values are dollarized for ease of comparison |
||||||
Source: Reuters
GDP growth in Sub-Saharan Africa region is expected to recover in 2021 in line with the rest of the global economy. The region still faces key challenges among them Covid-19 and the probability that the region shall be among the last to get the vaccinations. Some of the countries are suffering from high debt levels that will make them less attractive to foreign capital. The significant weakening of the currencies has made debt service also become very expensive.
Economic Growth:
During the first half of the year the economy contracted by 0.4% due to the 5.7% contraction in Q2’2020 down from a growth of 5.3% recorded in a similar period in 2019. The contraction was largely driven by the 83.3% decline in the accommodation and food sector following the closure of most facilities and also the reduction in tourist arrivals into the country. Some of the other sectors like agriculture helped cushion the economy from further decline. This is the first contraction since the third quarter of 2001 when the country recorded a 2.5% contraction.
Considering the recent easing of some of the restrictions and reopening of some of the sectors we expect the economy to slightly rebound and this is already reflected by the improvement in PMI where we’ve seen readings as high as 59.1 in October 2020, pointing to an improvement in the Kenya private sector outlook. The IMF October Report: A long and difficult ascent also expects the Kenyan Economy to grow by 1.0% an improvement from the June projections of a (1.0%) growth but the economy should recover to grow at 4.7% in 2021. Notably, H1’2020 average GDP growth now stands at 1.0%. For more information, see our Q2’2020 GDP Note.
The Kenya Shilling:
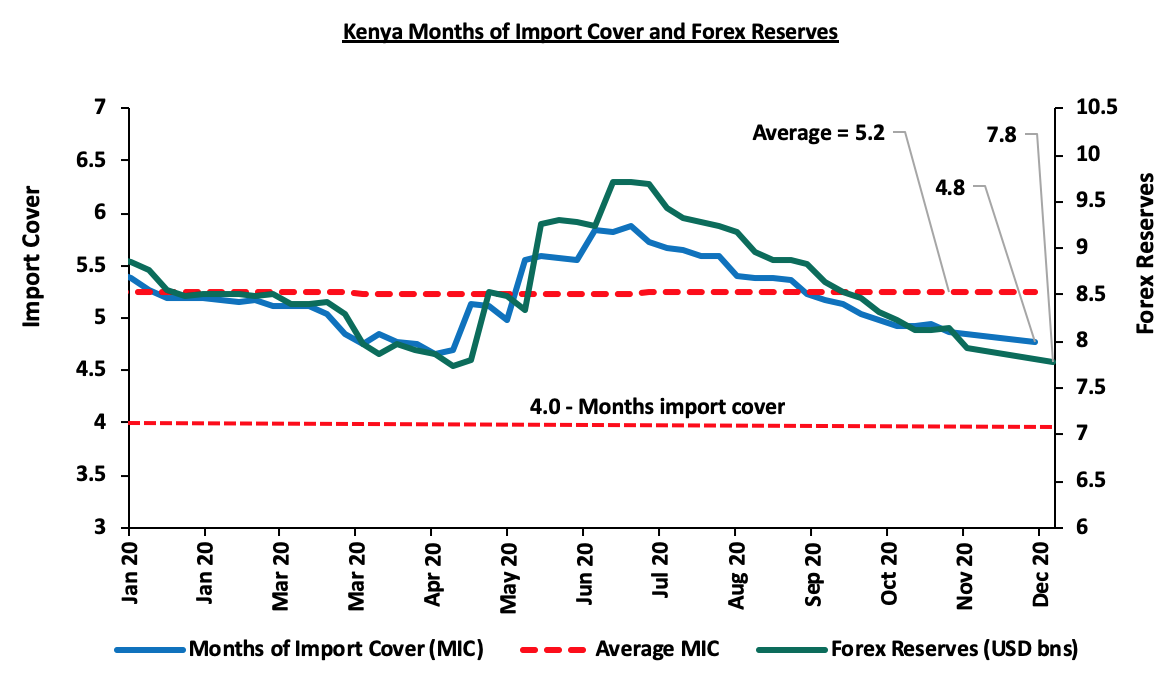
The Kenya Shilling depreciated by 7.7% against the US Dollar to close at Kshs 109.2 in 2020, compared to Kshs 101.3 at the end of 2019.
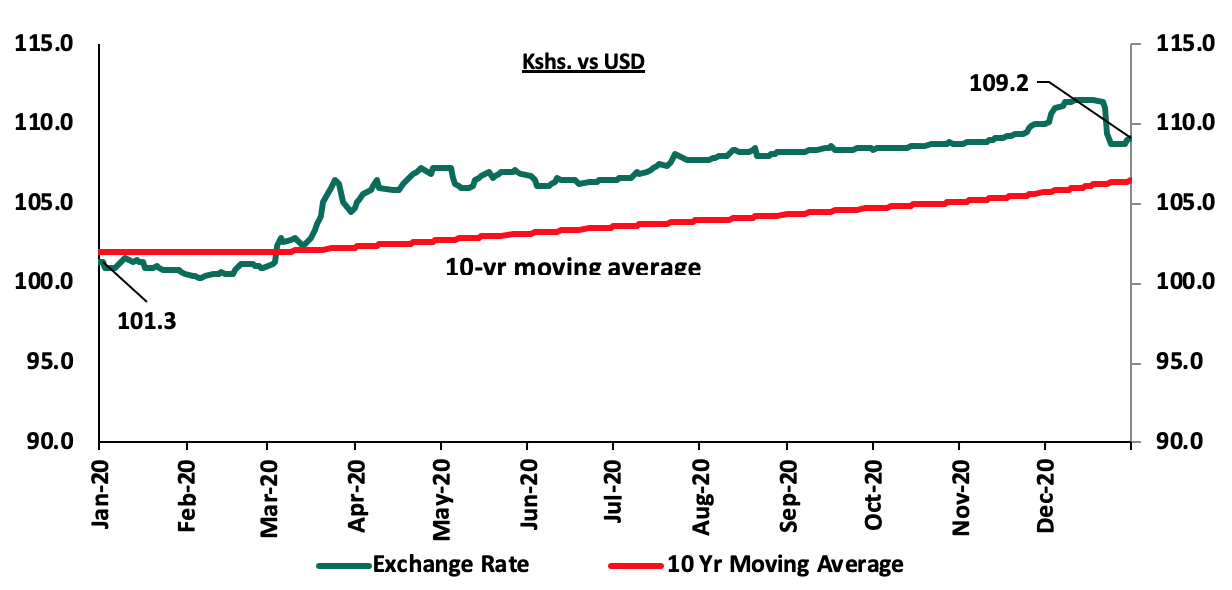
The shilling was under pressure from increased dollar demand as people prefer holding onto hard currency during such times and also a decline in dollar inflows from both exports of goods and services like tourism. The Central Bank, however, was active in the market to help support the currency. Consequently, the county’s foreign exchange reserves have been on the decline but despite this, we are still well above the statutory requirement of maintaining at least 4.0-months of import cover, and the EAC region’s convergence criteria of 4.5-months of import cover. This can be seen in the below diagram;
Some of the measures instituted during the year to cushion the shilling include:
- The Government agreed to a USD 2.3 bn credit drawdown facility with the IMF, Kenya targeting an initial disbursement of about USD 725.0 mn in this fiscal year. The facility will be a welcome relief to the currency as it will aid in boosting the forex reserves and help improve market sentiments. This was after the IMF completed its virtual mission to Kenya identifying that the country has suffered unprecedented shock from the pandemic and held discussions with the authorities on a program to support the next phase of their COVID-19 response,
- CBK’s supportive activities in the money market, such as repurchase agreements and selling of dollars, and,
- Monetary policy support from CBK by maintaining the policy rate at the current 7.0%, a further reduction would lead to a further depreciation of the shilling.
Inflation:
The inflation rate remained relatively low in 2020 with the average monthly inflation rate coming in at 5.2%. The December numbers were 5.6% up from November 5.5% and lower than the December 2019 number of 5.8% The low inflation can be attributed to the low fuel prices experienced during the first half of the year, coupled with the favorable weather conditions experienced at the tail end of the year which has ensured that food commodity prices remained low through most of the year.
Going forward, we expect the inflation rate to remain within the government’s set range of 2.5% - 7.5% with the key risks being drought in the first quarter of the year, high fuel costs due to increased crude prices globally as economies recover and further depreciation of the currency.
Monetary Policy:
During the year the Monetary Policy Committee met 8 times. They lowered the Central Bank Rate (CBR) twice, in the meetings held on 27th January 2020 and 23rd March 2020, from 8.25% at the beginning of the year to 7.00%. In their last meeting held on 26th November 2020, MPC retained the CBR at 7.0% for the fifth consecutive time, indicating that the previous cuts were having the intended effect on the economy. The committee concluded that the current accommodative monetary policies together with the fiscal measures are still being transmitted and continue to support the economy.
Additionally, the Cash Reserve Ratio was reduced to 4.25%, from 5.25% in their March 2020 meeting, to inject liquidity to banks for onward lending to businesses and households that have been adversely affected by the Coronavirus pandemic.
2020 Key Highlights:
- In May, Moody’s Credit Agency released its rating outlook where it changed Kenya’s sovereign credit outlook to “negative”, from a previous outlook of “stable”, but affirmed the earlier on B2 credit rating. The agency highlighted that the negative outlook was a result of rising financial risks brought about by the country’s large borrowing requirements especially during this time where the fiscal outlook is deteriorating due to lower revenue collections. According to Moody’s, the large borrowing needs, the negative fiscal outlook, will and continues to expose Kenya to exchange and interest rate shocks thus threatening any fiscal consolidation measures that had been set by the government. For more information, see our Cytonn Weekly #08/2020,
- During the second quarter of the year, the government was able to receive funds from international organizations to help the country fight against the negative effects of the pandemic. The table below shows the funds the government has received so far towards supporting the economy during the Coronavirus pandemic period;
|
Entity |
Amount Received in Kshs bn |
|
Central Bank of Kenya |
7.4 |
|
International Monetary Fund |
78.7 |
|
International Development Association (IDA) |
80 |
|
World Bank |
80 |
|
International Bank for Reconstruction and Development |
26.6 |
|
Total |
272.7 |
For more information, see our Cytonn Weekly #19/2020 and Cytonn Weekly #20/2020,
- The Kenyan President signed the Finance Bill 2020 and below are some of the key highlights affecting investments decisions more directly:
-
- Under the Income Tax Act, the key highlights included:
-
-
- Extending the upper limit of the Residential Income Tax to Kshs 15.0 mn from Kshs 10.0 mn to allow landlords with rental income of between Kshs 288 and Kshs 15.0 mn to access the more concessional tax rate of 10% of gross income, and reduce administrative costs of ascertaining profit for such landlords,
- Introduction of a minimum tax, to be introduced at a rate of 1.0% of the gross turnover. This new tax will apply to all persons whether they’re making profits or incurring losses.
- Introduction of Digital Service Tax, to be introduced at a rate of 1.5% of the gross transaction value, to be charged on individuals who generate income from the provision of services through the digital market place., and,
- Some allowable items such as (i) any entrance fee or annual subscription paid during that year of income to a trade association, (ii) capital expenditure on expenses relating to authorization and issue of shares, debentures or similar securities offered for purchase, listing on any securities exchange and acquiring a rating for purposes of listing, (iii) income from a registered home ownership savings plan, and, (iv) Income from employment paid in the form of bonuses, overtime, and retirement benefits to employees whose taxable employment income before bonus and overtime allowances does not exceed the lowest tax band will now not be tax allowable.
-
- The National Treasury released the 2020/2021 fiscal year budget. The total FY’2020/21 budget is estimated at Kshs 3.2 tn, a 2.6% increase from the Kshs 3.1 tn revised FY’2019/20 budget, mainly due to an 18.1% increase in the Consolidated Fund Services (CFS) to Kshs 1.0 bn from Kshs 0.9 bn in the FY’2019/20 revised estimates. The increase in Consolidated Fund Services expenditures is mainly as a result of an increase in public debt servicing expenses which will form 88.0% of the total CFS expenditure. For more information our FY 2020/21 Pre-Budget Discussion Note, and,
- The Parliamentary Budgetary Office highlighted in their Budget watch 2020/21 and the Medium Term, that the current budget would most likely not steer the country out of the current crisis. Some of the highlights from the report included;
- Revenue Prospects during the Pandemic: The ordinary revenue collected as of June 2020 was Kshs 1.6 tn, Kshs 300.0 bn (16.0%) below the set target of Kshs 1.9 tn according to the Budget estimates. The National Treasury projects ordinary revenue to decline from Kshs 1,643.4 bn in 2019/20 (revised estimates II) to Kshs 1,621.4 bn in 2020/21. A decline in income tax collection is expected to be among the major drivers of the expected decline in revenue due to income loss by workers across most sectors. According to the treasury, the ministry is targeting a fiscal deficit of 7.3% for FY2021/2022, down from the current financial year’s deficit of 8.4%,
- Debt Management FY’2020/21: The country’s debt servicing will be a significant source of liquidity pressures in FY’2020/21. Public debt service expenses are projected to increase by Kshs 157.7bn (about 20.0%) to Kshs 925.9 bn in FY’2020/21, and,
For more information, see our Cytonn Weekly #37/2020.
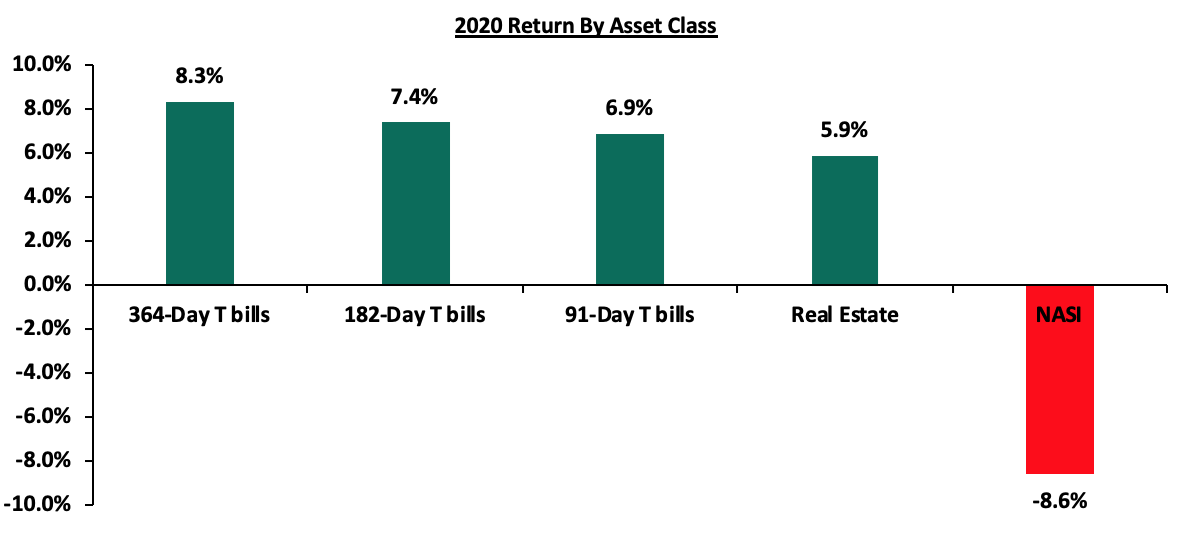
The graph below shows the summary of returns by asset class in 2020 (T- Bonds, T-Bills and Equities). The lowest-performing asset in 2020 was NASI with returns of (8.6%), while the rest had positive returns; the 364-day Government paper closed at a yield of 8.3%, the 182-day and 91-day Government papers recorded yields of 7.4% and 6.9%, respectively, while Real estate recorded returns of 5.9%.
The table below shows the macro-economic indicators that we track, indicating our expectations for each variable at the beginning of 2020 versus the experience
|
Macroeconomic Indicators 2020 Review |
||||
|
Macro-Economic Indicators |
2020 Expectations at Beginning of Year |
Outlook - Beginning of Year |
2020 Experience |
Effect |
|
Government Borrowing |
We expected the government to come under pressure to borrow as it was well behind both domestic and foreign borrowing targets for FY 2019/20, and with the expectations of KRA not achieving the revenue targets and the government having a net external financing target of Kshs 347.0 bn to finance the budget deficit |
Negative |
The government is 11.1% ahead of its prorated borrowing target of Kshs 243.1 bn having borrowed Kshs 270.1 bn. In our view, due to the current subdued economic performance brought about by the effects of the COVID-19 pandemic, the government will record a shortfall in revenue collection with the target having been set at Kshs 1.9 tn for FY’2020/2021 thus leading to a larger budget deficit than the projected 7.5% of GDP, ultimately creating uncertainty in the interest rate environment as additional borrowing from the domestic market may be required to plug the deficit. |
Negative |
|
Exchange Rate |
We project that currency will range between Kshs 101.0 and Kshs 104.0 against the USD in 2019, with continued support from the CBK in the short term through its sufficient reserves currently at USD 8.8 bn (equivalent to 5.4-months of import cover), above the statutory requirement of maintaining at least 4.0-months of import cover, and the EAC region’s convergence criteria of 4.5-months of import cover |
Neutral |
The Kenya Shilling depreciated by 7.7% against the US Dollar to close at Kshs 109.2 in 2020, compared to Kshs 101.3 at the end of 2019. We expect the currency to remain under pressure as the dollar demand for trade and government debt service outweighs the dollar inflows as some of the sectors like tourism are affected. |
Negative |
|
Interest Rates |
Despite the expectations of a bias towards expansionary monetary policy in 2020, we expect slight pressure on interest rates following the repeal of the interest rate cap which in effect is expected to result in increased competition for bank funds from both the private and public sectors as the Government tries to raise funds to plug in the budget deficit |
Neutral |
Yields on government securities are at risk of increasing due to the expected increase in government debt requirements. This is so despite the accommodative stance adopted by the Monetary Policy Committee. |
Neutral |
|
Inflation |
Inflation was expected to average 5.2%, within the government target range of 2.5%- 7.5%, compared to 7.0% last year |
Positive |
Having averaged 5.2% in 2020, we project inflation to remain within the central Banks target. |
Positive |
|
GDP |
GDP growth was projected to come in at between 5.7%, slightly higher than our 5.6%, 2019 expectations, but similar to the 5-year historical average of 5.7% |
Neutral |
After having contracted in the first half of 2020, the economy is projected to start recovering with the GDP growth for 2021 projected at *% |
Negative |
|
Investor Sentiment |
We expect 2020 to register improved foreign, mainly supported by long term investors who enter the market looking to take advantage of the current low/cheap valuations in select sections of the market |
Positive |
With economic recovery and companies having positive valuations we are projecting an improvement in investor sentiment |
Positive |
|
Security |
We expect security to be maintained in 2020, especially given that the political climate in the country has eased |
Positive |
The political climate in the country eased during the year with major discussions revolving around the containment of the pandemic. |
Positive |
Since the beginning of the year, the notable changes we have seen out of the seven metrics that we track, fall under exchange rate and GDP, where both changed from neutral to negative as highlighted in the summary above. In conclusion, macroeconomic fundamentals showed mixed performances during the year but we expect a recovery in 2021 supported by the improving business conditions in the country. This will, however, be highly dependent on how well the government can handle the pandemic which remains a major concern.
T-Bills & T-Bonds Primary Auction:
During the year 2020, T-bills auction recorded an oversubscription with the average subscription rate coming in at 130.3% compared to an average of 118.7% in 2019. The yields on the 91-day, 182-day and 364-day T-bills declined to 6.9%, 7.4% and 8.3% in 2020 from 7.2%, 8.2% and 9.8% at the end of 2019, respectively. This is mainly attributed to the Central Bank of Kenya’s (CBK’s) efforts to keep rates low by rejecting expensive bids in the auction market as well as increased demand as Banks shied away from lending to the public due to the increased credit risk.
Primary T-bond auctions in 2020 were oversubscribed with the subscription rate averaging 130.6%, which was higher than 109.7% average subscription rate in 2019. The market maintained a bias towards the medium-term bonds mainly driven by the perception that risks may not be adequately priced on the longer end of the yield curve. The average acceptance rate declined by 0.7% points to 68.5% in 2020, from the 69.2% recorded in 2019, as the market adjusted to the efforts of the CBK to maintain the rates at low levels by rejecting expensive bids.
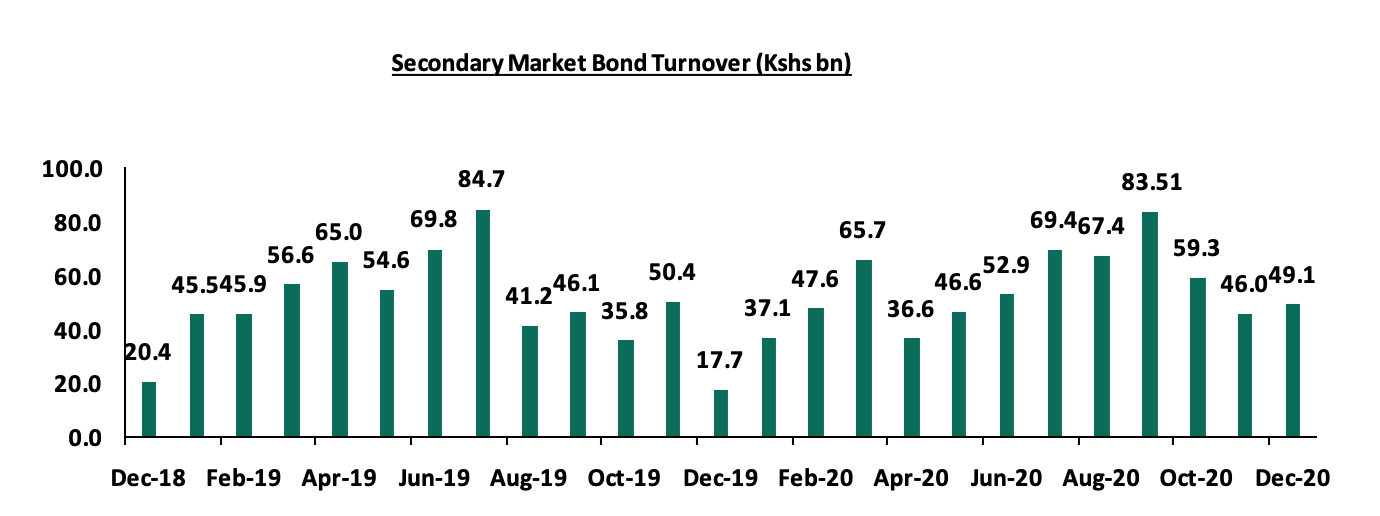
Secondary Bond Market Activity:
The secondary bond market recorded increased activity with the turnover having increased by 7.8% to Kshs 661.2 bn from Kshs 613.2 bn in 2019. This is attributable to local institutional investors increasing their allocation to treasury bonds as they sort for stable returns, after increased volatility in other asset classes.
In 2020, the yield curve steepened during the year, readjusting downwards for the shorter-dated papers but adjusting upwards for the longer-dated papers. The FTSE NSE bond index increased by 2.6% to close the year at 98.0 from 95.5 at the end of 2019. The chart below is the yield curve movement during the period;
Liquidity:
During the year, liquidity levels remained stable and well distributed in the market as indicated by the decline in the average interbank rate to 3.7% in 2020 from 4.3% in 2019, coupled with the 7.0% decline in the average volumes traded in the interbank market to Kshs 10.7 bn in 2020 from Kshs 11.5 bn recorded in 2019. The improvement in liquidity was mainly driven by government payments and mitigation measures including the reduction of the Cash Reserve Ratio (CRR) from 5.25% to 4.25% in April 2020, introduced by the CBK against potential effects of COVID 19 pandemic on the economy.
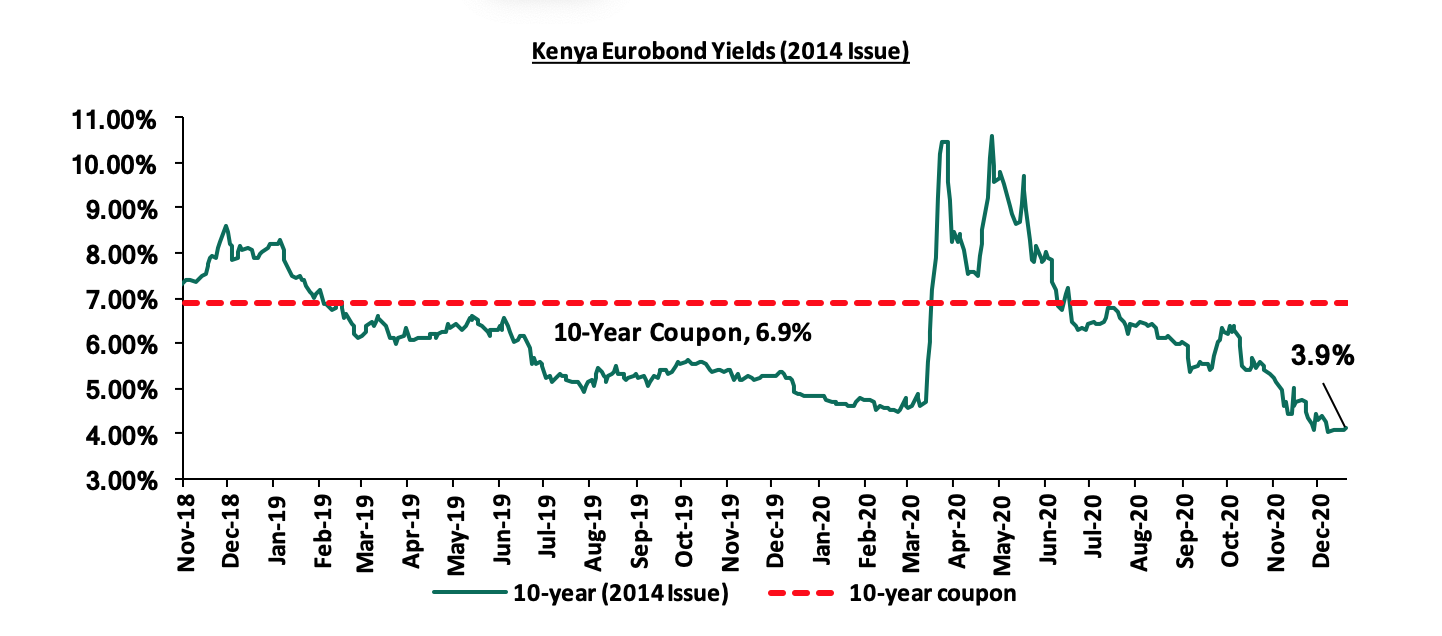
Kenya Eurobonds:
Yields on all Kenyan Eurobonds generally declined in 2020. Key to note is that there was a spike recorded during Q2’2020 due to the heavy outflows recorded by emerging market funds as investors dumped risky assets amid the coronavirus crisis. The decline was partly attributed to:
- The global hunt for higher yields as a result of massive monetary easing, through economic stimulus packages, in developed markets,
- Recovering private capital inflows resulting in increased demand for emerging market securities, and,
- The positive news surrounding the economic cushioning through intervention by global bodies, such as the announcement of a USD 2.3 bn IMF drawdown facility to help mitigate Covid-19 related economic shocks and the news of Kenya’s intention to join the Paris club - Debt Service Suspension Initiative (DSSI) that will aid in debt sustainability,
According to Reuters, the yields on the 10-Year Eurobond issued in 2014 declined by 0.9% points to 3.9%, from 4.8% recorded at the end of 2019.
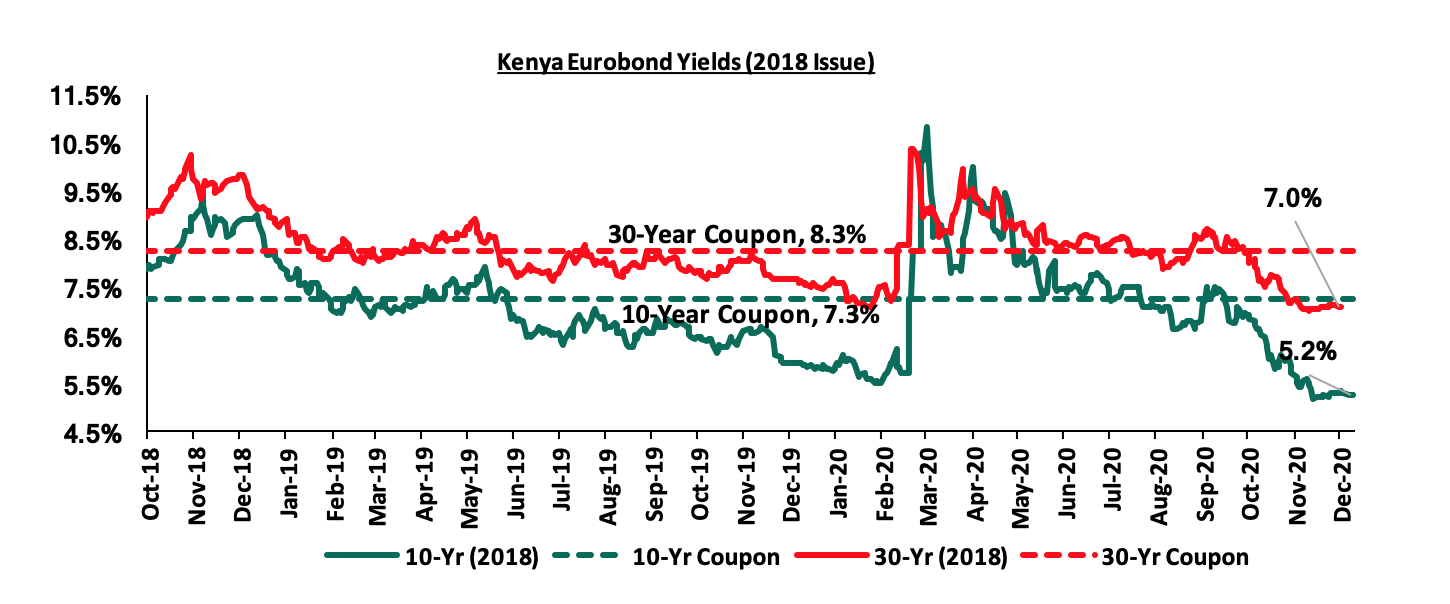
For the 2018 Eurobond issue, the yields on the 10-year Eurobond and the 30-year Eurobond both declined by 0.7% points to close the year at 5.2% and 7.0% from a yield of 5.9% and 7.7% at the close of 2019 respectively.
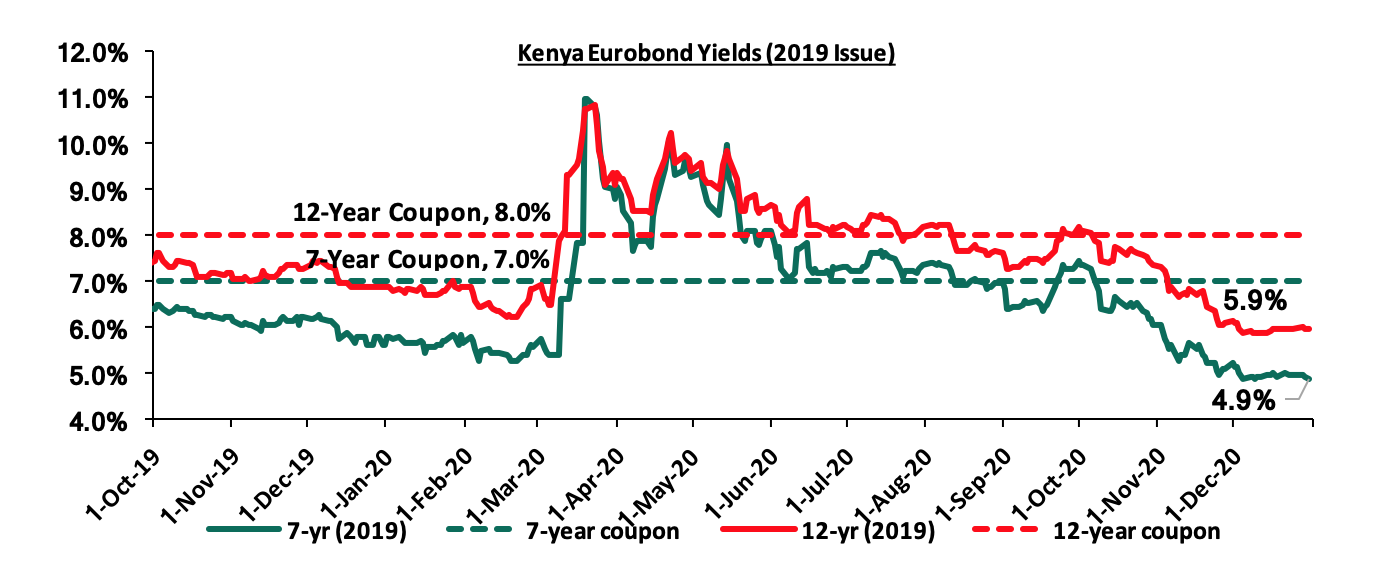
For the 2019 Dual-tranche Eurobond issue, the yields on the 7-year Eurobond and the 12-year Eurobond declined to close the year at 4.9% and 5.9% from a yield of 5.6% and 6.9% at the close of 2019, respectively.
Rates in the fixed income market have remained relatively stable due to the high liquidity in the money markets, coupled with the discipline by the Central Bank as they reject expensive bids. The government is 11.1% ahead of its prorated borrowing target of Kshs 243.1 bn having borrowed Kshs 270.1 bn. In our view, due to the current subdued economic performance brought about by the effects of the COVID-19 pandemic, the government will record a shortfall in revenue collection with the target having been set at Kshs 1.9 tn for FY’2020/2021 thus leading to a larger budget deficit than the projected 7.5% of GDP, ultimately creating uncertainty in the interest rate environment as additional borrowing from the domestic market may be required to plug the deficit. Owing to this uncertain environment, our view is that investors should be biased towards short-term to medium-term fixed income securities to reduce duration risk.
Market Performance
During the year, the Kenyan equities market was on a downward trajectory, with NASI, NSE 25, and NSE 20 declining by 8.6%, 16.7%, and 29.6%, respectively. Large-cap decliners during the year included Bamburi, Equity Group, Diamond Trust Bank, KCB Group, and Standard Chartered which declined by 52.7%, 31.7%, 31.2%, 29.4%, and 28.8%, respectively. Key to note, Safaricom recorded gains of 8.7% YTD as they benefited from the working from home environment and increased digitization trends. Safaricom continues to be a key part of Kenyan equities portfolios, accounting for 59.6% of Nairobi Stock Exchange (NSE’s) market capitalization and has dominated on both the market turnover and in determining the direction of the market given its weight and liquidity in the Nairobi Securities Exchange.
Equity turnover during the year declined by 5.9% to USD 1.4 bn, from USD 1.5 bn in FY’2019. Foreign investors turned net sellers, with a net outflow of USD 280.9 mn, compared to net inflows of USD 10.7 mn recorded in FY’2019. The foreign investor outflows during the year can be attributed mainly to the COVID-19 pandemic which saw an increased flight from the Equities Markets as investors sought for safe-havens.
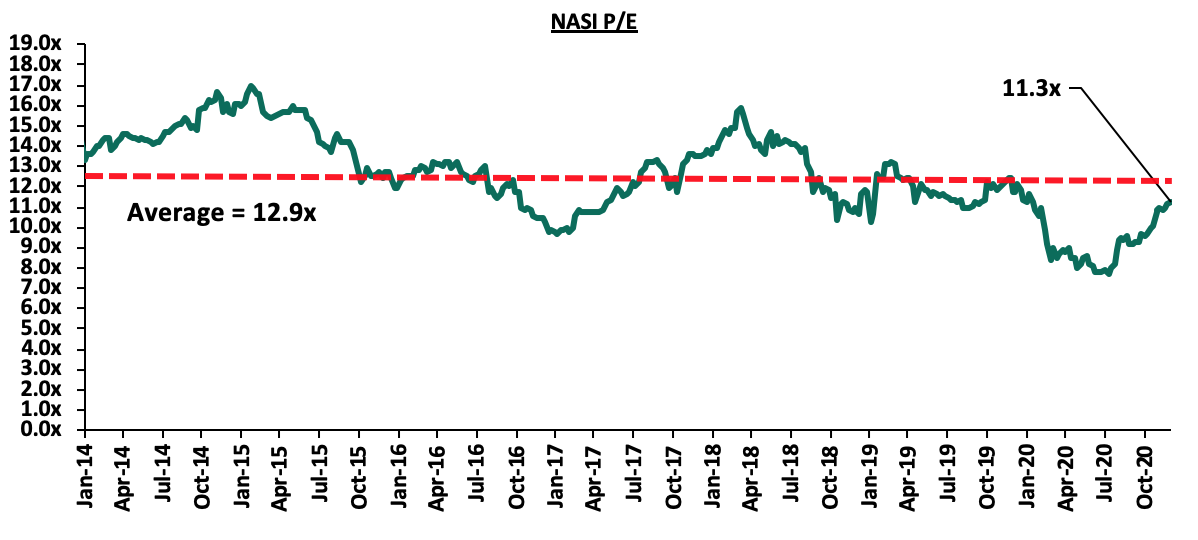
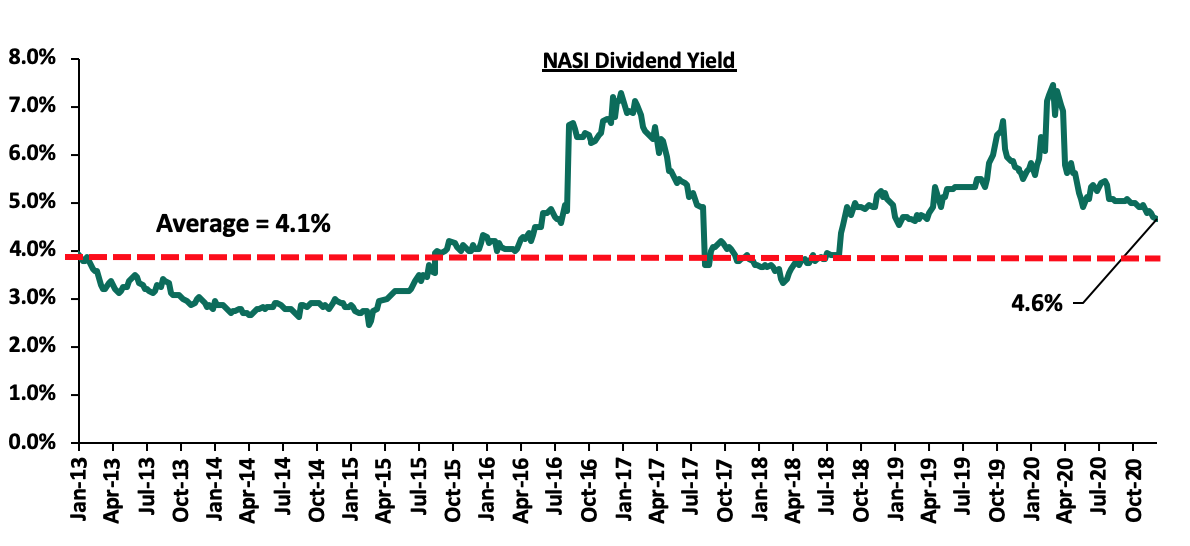
The market is currently trading at a price to earnings ratio (P/E) of 11.3x, compared to 11.8x at the end of 2019, and is 12.9% below the 11-year historical average of 12.9x. The average dividend yield is currently at 4.6%, 0.5% points above the historical average of 4.1%.
With the market trading at valuations below the historical average, we believe there are pockets of value in the market for investors with higher risk tolerance and are willing to wait out the pandemic. The current P/E valuation of 11.3x is 46.4% above the most recent valuation trough of 7.7x experienced in the first week of August 2020. The charts below indicate the market’s historical P/E and dividend yield.
Banking Sector Earnings:
As per the Q3’2020 results, banks have recorded a weighted average decline in core earnings per share of (32.4%), compared to a weighted growth of 8.7% in Q3’2019. The table below highlights the performance of the banking sector, showing the performance using several metrics, and the key take-outs of the performance.
|
Bank |
Core EPS Growth |
Interest Income Growth |
Interest Expense Growth |
Net Interest Income Growth |
Net Interest Margin |
Non-Funded Income Growth |
NFI to Total Operating Income |
Growth in Total Fees & Commissions |
Deposit Growth |
Growth in Government Securities |
Loan to Deposit Ratio |
Loan Growth |
Return on Average Equity |
|
NCBA |
(67.3%) |
4.8% |
4.1% |
5.3% |
3.2% |
11.8% |
48.7% |
47.7% |
8.1% |
12.5% |
63.0% |
0.4% |
3.9% |
|
ABSA |
(65.4%) |
1.4% |
0.8% |
1.6% |
7.1% |
4.5% |
32.7% |
(10.7%) |
4.7% |
13.1% |
84.9% |
7.8% |
15.2% |
|
KCB |
(43.2%) |
23.0% |
20.8% |
23.7% |
7.8% |
1.5% |
30.8% |
(14.2%) |
31.7% |
83.9% |
74.7% |
18.7% |
13.1% |
|
I&M |
(30.8%) |
3.0% |
8.9% |
(1.7%) |
5.3% |
1.1% |
38.1% |
(5.9%) |
7.0% |
70.9% |
73.4% |
6.7% |
2.4% |
|
SCBK |
(30.4%) |
(5.8%) |
(17.3%) |
(2.4%) |
7.0% |
(8.8%) |
31.1% |
(9.7%) |
8.0% |
7.6% |
1.5% |
11.2% |
12.9% |
|
Stanbic |
(30.2%) |
(5.4%) |
(3.1%) |
(7.3%) |
5.9% |
(18.4%) |
44.5% |
(33.3%) |
18.2% |
103.8% |
70.3% |
7.5% |
12.0% |
|
DTBK |
(27.8%) |
(3.4%) |
(8.9%) |
0.9% |
5.5% |
15.3% |
26.6% |
17.7% |
1.8% |
5.1% |
71.4% |
7.1% |
9.2% |
|
Equity |
(13.9%) |
21.7% |
21.6% |
21.8% |
7.6% |
10.1% |
38.7% |
(1.3%) |
44.5% |
37.2% |
65.7% |
30.1% |
16.9% |
|
Co-op |
(10.2%) |
7.1% |
(3.5%) |
11.7% |
8.0% |
(3.5%) |
36.5% |
(31.7%) |
16.4% |
50.5% |
75.7% |
5.7% |
16.4% |
|
HF Group |
N/A |
(12.2%) |
(16.9%) |
(1.1%) |
4.2% |
(62.2%) |
20.0% |
11.8% |
9.9% |
65.6% |
98.8% |
(4.1%) |
(7.6%) |
|
Q3'20 Mkt Weighted Average* |
(32.4%) |
10.8% |
8.2% |
11.7% |
7.0% |
2.1% |
35.9% |
(7.9%) |
23.1% |
47.4% |
65.6% |
15.0% |
13.0% |
|
Q3'19Mkt Weighted Average** |
8.7% |
4.5% |
4.3% |
4.9% |
7.7% |
15.8% |
37.9% |
22.6% |
11.0% |
3.3% |
75.7% |
11.6% |
19.3% |
|
*Market-cap-weighted as at 01/12/2020 |
|||||||||||||
|
**Market-cap-weighted as at 29/11/2019 |
|||||||||||||
Key takeaways from the table above include:
- Core Earnings Per Share (EPS) recorded a weighted (32.4%) decline in Q3’2020, compared to a weighted growth of 8.7% in Q3’2019,
- The sector recorded a weighted average deposit growth of 23.1%, faster than the 11.0% growth recorded in Q3’2019,
- Interest expense, grew faster by 8.2%, compared to 4.3% in Q3’2019. Cost of funds, however, declined, coming in at a weighted average of 2.9% in Q3’2020, from 3.1% in Q3’2019, owing to the faster growth in average interest-bearing liabilities, an indication that the listed banks were able to mobilize cheaper deposits,
- Average loan growth came in at 15.0%, faster than the 11.6% recorded in Q3’2019, but slower than the 47.4% growth in government securities, an indication of the bank's preference of investing in Government securities as opposed to lending due to the elevated credit risk occasioned by the pandemic,
- Interest income rose by 10.8%, compared to a growth of 4.5% recorded in Q3’2019. Despite the rise in interest income, the Yield on Interest Earning Assets (YIEA) declined to 9.5% from the 10.3% recorded in Q3’2019, an indication of the increased allocation to lower-yielding government securities by the sector. The decline in the YIEA can also be attributed to the reduced lending rates for customers by the sector, in line with the Central Bank Rate cuts. Consequently, the Net Interest Margin (NIM) now stands at 7.0%, 0.7% points lower than the 7.7% recorded in Q3’2019 for the whole listed banking sector, and,
- Non-Funded Income grew by 2.1% y/y, slower than 15.8% growth recorded in Q3’2019. The performance in NFI was on the back of declined growth in fees and commission of (7.9%), which was slower than the 22.6% growth recorded in Q3’2019. The poor performance of the growth in fees and commission can be attributed to the waiver on fees on mobile transactions below Kshs 1,000 and the free bank-mobile money transfer. Banks with a large customer base who rely heavily on mobile money transactions are likely to take the biggest hit.
For more information, see our Kenya Listed Banks Q3’2020 Report.
Other Key Results
Safaricom Limited released the H1’2021 results, recording core earnings per share decline of 5.7% to Kshs 0.83 from Kshs 0.88 in H1’2020. The decline in the earnings growth was attributable to the 14.5% decline in M-PESA revenue to Kshs 35.9 bn from Kshs 42.0 bn, following the Central Banks directive to waiver fees on Person to Person and Lipa na M-PESA transactions for amounts below Kshs 1,000. This was an initiative that was to support Safaricom’s customers and the government’s initiatives of curbing the spread of the virus.
This year, 15 companies issued profit warnings to investors compared to 10 companies in 2019, attributable to the tough macro-economic environment amid the COVID-19 pandemic. Companies are required to issue profit warnings if they project a more than 25.0% decline in profits year-on-year. Below is the summary of the said companies:
|
Companies that issued profit warnings Comparison |
||
|
No |
2020 |
2019 |
|
1 |
ABSA Kenya |
Nairobi Stock Exchange |
|
2 |
Diamond Trust Bank |
BOC Kenya Plc |
|
3 |
Standard Chartered |
UAP Holdings Limited |
|
4 |
I&M Holdings |
Kenya Power and Lighting Company |
|
5 |
NCBA Group |
Eaagads |
|
6 |
Britam Holdings |
Williamson Tea Kenya |
|
7 |
East African Breweries Limited |
Standard Group Plc |
|
8 |
Nation Media Group |
CIC Insurance |
|
9 |
Longhorn Publishers |
Kenya Airways |
|
10 |
Kenya Power |
Kapchorua Tea Company |
|
11 |
Unga Group |
|
|
12 |
East Africa Cables |
|
|
13 |
Kenya Orchards |
|
|
14 |
TPS East African |
|
|
15 |
Nairobi Business Ventures |
|
The key take-outs from the table above include:
- ABSA Bank attributed the shortfall in profits to the exceptional costs incurred during the year in relation to the rebranding from Barclays Bank to Absa Bank Kenya. Additionally, the projected decline in the profits is also on the back of the increased provisions amid the pandemic,
- Diamond Trust Bank issued a profit warning statement attributing dismal performance to the increased impairment provisions following the pandemic coupled with the increase in restructured and delayed loan repayments as the COVID-19 impact on their customers intensified during the year,
- Standard Chartered also issued a profit warning citing that the pandemic which has adversely affected the economy, has also affected the bank's operations. However, the bank indicated that pandemic reinforced the relevance of their three strategic priorities such as their investments in digital channels which have enabled the bank to continue supporting their clients digitally through video conferencing as well as enabling the bank's employees to work remotely,
- KPLC cited that the pandemic had adversely affected the company leading to a slower growth in their electricity sales coupled with the increase in financing costs which is set to reduce their earnings,
- In Britam’s case, the anticipated slide in earnings is attributed to the impact the pandemic has had on their business more so in real estate, which has affected the appetite for property and mortgage. Additionally, the management pointed out that the poor performance of the stock market has led to reduced returns from their Equity Investments,
- Nation Media’s expected decline is attributable to the unprecedented restriction of movement seen during the year which dampened the Group's newspaper sales. The Group also attributed the expected low earnings to be driven by the low marketing and advertising activities as most firm’s cash flows were affected by the pandemic,
- Longhorn Publishers has witnessed a declining trend in profitability attributed to the suspension of learning in schools seen during the year. The group however indicated that the full optimization of the digital learning solutions would support the recovery of the group’s performance in the long run,
- East African Cables attributed the decline in earnings to the one-off writeback that was recorded as other income in FY’2019. The Group noted that the impact of the pandemic will reduce the chances of a more aggressive top-line growth to match the performance of the previous year, and,
- East African Breweries expects the decline in profits to emanate from the COVID-19 disruptions that have affected its business across the region. The closure of bars as well as the ban on social gatherings and other leisure activities seen during the year negatively affected the demand for alcoholic beverages and products supplied by EABL.
Listing and Suspensions
During the year, we witnessed the Nairobi Securities Exchange (NSE) take actions towards the listing and suspension of listed companies as highlighted below;
- In July 2020, Kenya Airways was suspended from trading on the securities exchange following the companies operational and corporate restructuring, coupled with the eminent Government buy-out following the publication of the National Management Aviation Bill,
- In October 2020, Nairobi Business Ventures (NBV) was suspended from trading for a period of one month, to allow the completion of the company’s restructuring. The restructuring exercise included a share split, allotment, and issuance of shares to Delta International FZE and a subscription agreement between NBV and Delta. Key to note, the suspension in trading was lifted in November 2020, and,
- In December 2020, HomeBoyz Entertainment Plc (HEL) was listed by way of introduction on the Growth Enterprise Market Segment (GEMS). Notably, 63.2 mn Ordinary shares at a listing price of Kshs 4.66 per ordinary shares were listed. The listing will enable HEL to cement itself as the first company in the Media and Entertainment Sector to be listed in on the GEMS.
Legislations and other Developments
The year 2020 saw a number of legislative changes and other developments that affected the equities market and investor sentiment, namely:
- Guidance on Loan Restructuring: The Central Bank of Kenya on March 27th, 2020 provided commercial banks and mortgage finance companies with guidelines on loan reclassification, and provisioning of extended and restructured loans as per the Banking Circular No 3 of 2020. The key take-outs from the circular included:
- Central Bank stipulated that banks would be allowed to extend loan repayments for their customers for a period not more than one year,
- The cost of restructuring and extension of loans would be met by the banks and the banks would have to report any restructuring in relation to the COVID-19 pandemic to the Central Bank monthly,
- Banks would be required to keep a record of all restructured and extended loans with the details of how the pandemic has affected specific customers whose loans are restructured and monitoring measures adopted by the bank, and,
- Personal loans that have been extended or restructured by banks would not be subjected to the classification of renegotiated loans stipulated in CBK’s prudential guidelines meaning that banks would not have to classify the loans as non-performing loans.
- Capital Preservation: The Central Bank of Kenya on 14th August 2020, directed that Banks will have to get approval before declaring dividends for the current financial year, in a bid to ensure that the banks have enough capital that will enable them to respond appropriately to the COVID-19 pandemic. The Central Bank gave guidance to lenders asking them to revise their ICAAP (Internal Capital Adequacy Assessment Process) based on the pandemic as highlighted in the Banking Circular No 11 of 2020. Subject to the submission of the revised Internal Capital Adequacy Assessment Process, (ICAAP), CBK will determine if it will endorse the board’s decision to pay out dividends. A similar trend has been mirrored globally by both financial and non-financial businesses frantically seeking ways to save money with several regulators encouraging companies to cease the discretionary payments of dividends to shareholders. For instance, in the United Kingdom (UK), the seven largest banks sought to cancel dividend pay-outs despite having solid capital bases, due to fears of an economic recession. Additionally, the Central Bank of most countries has offered guidelines to the banks on dividend payments with, for instance, the Federal Reserve announcing on 25th June 2020 that it would cap dividend payments and prevent share repurchases up to the end of 2020. Closer home, on 6th April 2020, the South African Reserve Bank’s Prudential Authority advised banks not to pay out dividends this year and that the bonuses for senior executives should also be put on hold during this period as well. The authority highlighted that this directive would ensure banks conserve their capital and as such, enable the banks to fulfill their fundamental roles,
- Mobile Money Transactions: In an effort to reduce the risk of transmission of COVID-19 through the handling of banknotes, the Central Bank of Kenya announced emergency measures that would increase the use of mobile money transactions as opposed to cash. The measures that were put in place by CBK include;
- Free mobile money transactions for amounts up to Kshs 1,000,
- Increase in the mobile wallet limit to Kshs 300,000 while the daily transaction limit was increased to Kshs 300,000, and,
- Elimination of charges for transfers between mobile wallets and bank accounts for Payment Service Providers (PSP) and Commercial Banks.
Notably, the CBK announced in June 2020 that the measures put in place to facilitate mobile transactions such as the free bank-mobile money transfer and the waiver on fees on mobile transactions below Kshs 1,000 had been extended to 31st December 2020. These regulations saw the listed banking sector record a decline in their Non-Funded Income in Q3’2020, growing by a weighted average of 2.1%, slower than the 15.8% growth recorded in Q3’2019,
- Unquoted Securities Platform: Following the approval granted by the Capital Markets Authority (CMA), the Nairobi Securities Exchange (NSE) launched the Unquoted Securities Platform (USP), a market infrastructure that will facilitate the trading, clearing, and settlement of securities of unlisted companies. For trading purposes, an investor will be required to open and maintain a USP securities trading account, identified by a unique trade identification code, generated by the platform. An investor shall then trade their USP securities by placing a buy or sale order through their USP securities dealer.
- Some of the offerings that the platform will provide to issuer companies include:
- Offering issuers an opportunity to access the capital markets for long term funding through private placements whilst enjoying flexibility in listing requirements and obligations,
- Enabling unquoted companies that have a register of shareholders to enjoy price discovery and increase the liquidity of their shares, and,
- The platform will also increase transparency and accessibility to information for investors given that prices will be published daily.
The move is in line with the objectives of the CMA’s 10-year strategic plan Capital Market Master Plan (2014-2023) of developing a deeper and more liquid domestic equities market through increased listings,
- Consolidation: Consolidation activity remained one of the key highlights witnessed in 2020, as players in the sector were either acquired or merged, leading to the formation of relatively larger, well-capitalized, and possibly more stable entities. The following were some of the major M&A’s activities witnessed during the year:
- On 27th January 2020, Nigerian lender, Access Bank PLC completed the acquisition of a 100% stake in Transnational Bank PLC for an undisclosed amount, with Access Bank PLC targeting to enhance its corporate and retail banking business in Kenya through the acquisition. Access Bank is Nigeria’s largest lender by assets, with an asset base of USD 16.7 bn (equivalent to Kshs 1.7 tn) as at Q1’2020. The deal will see Nigerian banks deepen their presence in Kenya with the United Bank of Africa (UBA) and Guarantee Trust Bank already in the market. Read more information on the transaction here,
- On 4th May 2020, the Central Bank of Kenya approved the acquisition of Imperial Bank’s assets and assumption of liabilities worth Kshs 3.2 bn each by KCB Group effective 2nd June 2020. The move will see Imperial Bank depositors paid a total of Kshs 3.2 bn over a period of 4 years and will have cumulatively recovered 37.3% of the deposits since 2015 when payments commenced. Imperial Bank was put under receivership (a process that can assist creditors to recover funds in default and can help troubled companies to avoid bankruptcy) in October 2015 due to inappropriate banking practices, with the CBK transferring Imperial Bank’s management and control to the KDIC. Read more on the same here,
- On 25th August 2020, Co-operative Bank Kenya completed the 90.0% acquisition of Jamii Bora Bank and rebranded it to Kingdom Bank Limited. The transaction that had started in March for a 100.0% purchase of the Bank at Kshs 1.1 bn, was completed in August after receiving all the approvals, with Co-operative Bank varying its initial offer of 100.0% stake to a 90.0% stake. Read more information on the transaction here,
- Equity Group Holdings completed the 66.5% stake acquisition of the Banque Commerciale Du Congo (BCDC) at a cost of USD 95.0 mn (Kshs 10.3 bn). Initially, the deal was to cost USD 105.0 mn (Kshs 11.4 bn), however factoring in the adverse effects of the COVID-19 pandemic on the two economies, the two parties agreed to reduce the amount to USD 95.0 mn (Kshs 10.3 bn). Read more information on the transaction here,
- I&M Holdings plc issued a cautionary statement to its shareholders on its intention to acquire 90.0% of the share capital of Orient Bank Limited Uganda (OBL). Subsequently, in the fourth quarter, the shareholders have given the approval to proceed with the acquisition. Read more on the same here.
- On 25th November 2020, KCB Group disclosed that it had entered into an agreement with Atlas Mara Limited (ATMA) to acquire 62.1% stake in Banque De Populaire du Rwanda (BPR) in Rwanda and a 100.0% stake in African Banking Corporation Ltd Tanzania (ABC Tanzania). Key to note, Equity Group had previously entered into a binding agreement in April 2019 with Atlas Mara on the acquisition of banking assets in four countries (Rwanda, Tanzania, Zambia, and Mozambique);0% of the share capital of Banque Populaire du Rwanda (BPR); 100.0% of the share capital of Africa Banking Corporation Zambia (ABCZam) Ltd; 100.0% of the share capital of Africa Banking Corporation Tanzania (ABCTz); and, 100.0% of the share capital of Africa Banking Corporation Mozambique Ltd (ABCMoz). In the 62.1% BPR acquisition, KCB will pay a cash consideration based on the net asset value of the BPR at the completion of the transaction using a price to book multiple of 1.1x. Key to note, according to the latest BPR financials, the bank had a book value of Rwf 46.6 bn (Kshs 5.2 bn), and thus at the trading multiple of 1.1x, we estimate KCB will have to part with Kshs 5.7 bn. The Group also separately intends to make an offer to acquire the remaining shares from the respective shareholders. Read more on the same here.
Below is a summary of the deals in the last 5-years that have either happened, been announced or expected to be concluded:
|
Acquirer |
Bank Acquired |
Book Value at Acquisition (Kshs. Bns) |
Transaction Stake |
Transaction Value |
P/Bv Multiple |
Date |
|
KCB Group |
Banque Commerciale Du Congo |
5.2 |
62.1% |
5.7 |
1.1x |
Nov-20* |
|
KCB Group |
ABC Tanzania |
Unknown |
100.0% |
Undisclosed |
0.4x |
Nov-20* |
|
Co-operative Bank |
Jamii Bora Bank |
3.4 |
90.0% |
1 |
0.3x |
Aug-20 |
|
I&M Holdings |
Orient Bank Ltd |
3.5 |
90.0% |
3.6 |
1.1x |
Jul-20* |
|
Commercial International Bank |
Mayfair Bank Limited |
1 |
51.0% |
Undisclosed |
N/D |
May-20* |
|
Access Bank PLC (Nigeria) |
Transnational Bank PLC. |
1.9 |
100.0% |
1.4 |
0.7x |
Feb-20* |
|
Equity Group ** |
Banque Commerciale Du Congo |
8.9 |
66.5% |
10.3 |
1.2x |
Nov-19* |
|
KCB Group |
National Bank of Kenya |
7 |
100.0% |
6.6 |
0.9x |
Sep-19 |
|
CBA Group |
NIC Group |
33.5 |
53%:47% |
23 |
0.7x |
Sep-19 |
|
Oiko Credit |
Credit Bank |
3 |
22.8% |
1 |
1.5x |
Aug-19 |
|
CBA Group** |
Jamii Bora Bank |
3.4 |
100.0% |
1.4 |
0.4x |
Jan-19 |
|
AfricInvest Azure |
Prime Bank |
21.2 |
24.2% |
5.1 |
1.0x |
Jan-18 |
|
KCB Group |
Imperial Bank |
Unknown |
Undisclosed |
Undisclosed |
N/A |
Dec-18 |
|
SBM Bank Kenya |
Chase Bank Ltd |
Unknown |
75.0% |
Undisclosed |
N/A |
Aug-18 |
|
DTBK |
Habib Bank Kenya |
2.4 |
100.0% |
1.8 |
0.8x |
Mar-17 |
|
SBM Holdings |
Fidelity Commercial Bank |
1.8 |
100.0% |
2.8 |
1.6x |
Nov-16 |
|
M Bank |
Oriental Commercial Bank |
1.8 |
51.0% |
1.3 |
1.4x |
Jun-16 |
|
I&M Holdings |
Giro Commercial Bank |
3 |
100.0% |
5 |
1.7x |
Jun-16 |
|
Mwalimu SACCO |
Equatorial Commercial Bank |
1.2 |
75.0% |
2.6 |
2.3x |
Mar-15 |
|
Centum |
K-Rep Bank |
2.1 |
66.0% |
2.5 |
1.8x |
Jul-14 |
|
GT Bank |
Fina Bank Group |
3.9 |
70.0% |
8.6 |
3.2x |
Nov-13 |
|
Average |
|
|
74.7% |
|
1.2x |
|
|
* Announcement Date ** Deals that were dropped |
||||||
In 2020, Kenya’s operating environment was characterized by challenging macro-economic conditions owing to the adverse effects of the COVID-19 pandemic that disrupted business operations. In 2020, the market remained slumped with P/E below its’ historical average of 12.9x to 11.3x, below the most recent peak of 15.9x in April 2018, showing that pockets of value still exist. We are “Neutral” on the Equities markets in the short term but “Bullish” in the medium to long term. We expect the recent discovery of a new strain of COVID-19 coupled with the introduction of strict lockdown measures in major economies to continue dampening the economic outlook. However, we believe there exist pockets of value in the market, with a bias on financial services stocks given the resilience exhibited in the sector. The sector is currently trading at historically cheaper valuations and as such, presents attractive opportunities for investors.
In 2020, the real estate sector recorded moderate activities with a general decline in closed transactions. The effects of the pandemic were mainly felt in the sector from Q2’2020 with the real estate and construction recording growth of 6.1% in Q2’2020, compared to 13.2% growth recorded in Q2’2019, according to KNBS Quarterly Gross Domestic Product Report - Q2’2020.
Some of the challenges that affected the performance of the real estate sector included:
- Reduced revenue due to slow market uptake and downward pressure on prices and rents,
- Constrained financing to developers as financiers such as banks aimed to limit exposure amidst increasing loan deferrals and defaults,
- Decrease in the value of building approvals for the first nine months of the year to Kshs 120.8 bn compared to Kshs 176.5 bn recorded over a similar period in 2019, with no approvals made in June and July owing to Covid-19 lockdown restrictions that led to closure of the National Lands Commission offices,
- Travel restrictions which mainly affected the performance of the hospitality sector,
- Constrained consumer spending due to low purchasing power, and,
- Oversupply of 6.3mn SQFT and 3.1mn SQFT of commercial office space and retail space, respectively.
Nevertheless, the performance of the real estate sector was cushioned by:
- The government’s continued focus on affordable housing projects to serve the middle and low income earners with the aim of increasing home ownership,
- Operationalization and licensing of the Kenya Mortgage and Refinance Company to provide relatively cheap mortgage facilities,
- Introduction of the Land Information Management System (LIMS) in April 2020 aimed at eliminating fraud and enabling digitization of processes at the lands ministry,
- Improvement of infrastructure with ongoing select projects such as construction of the Nairobi Expressway and construction of phase two of the Standard Gauge Railway, among many others, and,
- Easing of travel bans and restrictions in Q3’2020 coupled with the government’s stimulus package such as post-COVID recovery funds, intended to enhance the recovery of the hospitality sector.
In terms of performance, residential, commercial office, retail, mixed-use developments and serviced apartments sectors registered average rental yields of 4.7%, 7.0%, 7.5%, 7.1%, and 4.0%, respectively, resulting to an average rental yield for the real estate market of 6.1%, 0.9% points lower compared to 7.0% recorded in 2019. Existing properties recorded a (0.2%) price correction thus the resultant average total returns came in at 5.9%, down from 9.0% recorded in 2019. The decline is attributed to subdued performance across all sectors due to reduced sale and rental rates in a bid to attract and retain tenants.
|
Annual Real Estate Returns Summary Table, for Existing Properties |
|||||
|
|
2017 |
2018 |
2019 |
2020 |
Y/Y Change (% Points) |
|
Average Rental Yield |
7.6% |
7.4% |
7.0% |
6.1% |
(0.9%) |
|
Average Capital Appreciation |
6.5% |
3.8% |
2.0% |
(0.2%) |
(2.2%) |
|
Total Returns |
14.1% |
11.2% |
9.0% |
5.9% |
(3.1%) |
|
· In 2020, average rental yields in the real estate sector came in at 6.1%, bringing the average total returns to 5.9%, a 3.1% points decline from 9.0% recorded in 2019 |
|||||
Source: Cytonn Research 2020
For the detailed real estate market review report, see our Real Estate Annual Markets Review 2020 Note.
I. Residential Sector
In terms of performance, the residential sector recorded a decline in performance in 2020 with average total returns coming in at 4.7% down from 6.1% recorded in 2019. Rental yields recorded a 0.1% points marginal drop to 4.9% as a results of reduced rental rates amid a tough economic environment while average annual uptake stagnated at 19.3%, as buyers held on to money amid market uncertainty. Apartments performed better than detached units, recording average total returns of 5.2% in comparison to the detached average of 4.2%. The better performance is attributed to the higher rental yield averaging 5.7% in comparison to 4.1% for the detached units. However, in terms of prices, apartments recorded higher price decline compared to detached units owing to slow uptakes as potential buyers face liquidity pressures amid reduced disposable income.
Detached units recorded a decline in performance in 2020 compared to 2019 with average returns to investors coming in at 4.2%, down from 5.3% recorded in 2019. This was attributed to reduced house prices in the wake of market uncertainty amid the Covid-19 pandemic that saw low transactional volumes hence reduced uptakes with the average annual uptake coming in at 16.9%, a 1.8% points decline from 18.7% recorded in 2019.
Apartments registered subdued performance with average total returns of 5.2% in 2020, a 1.6% points decline from 6.8% recorded in 2019. Satellite towns was the best performing segment with an average total returns of 5.5% attributed to the relatively high rental yield averaging 6.1% as more people opted to rent in areas such as Thindigua, which was the best performing node in terms of rental yield averaging 8.2%, followed by Kitengela at 6.7%. The growing popularity of housing in satellite towns is attributable to growing focus on affordable housing options among buyers amid reduced disposable income.
All Values in Kshs Unless Stated Otherwise)
|
Residential Market Performance Summary FY’2020 |
|||||||
|
Segment |
Average Price per SQM |
Average Rent per SQM |
Average Occupancy |
Average Annual Uptake |
Average Rental Yield |
Average Price Appreciation |
Annual Total Returns |
|
Detached Units |
|||||||
|
High-End |
195,524 |
720 |
82.9% |
17.3% |
3.8% |
0.6% |
4.4% |
|
Upper Mid-End |
135,403 |
597 |
86.3% |
16.5% |
4.5% |
(0.3%) |
4.2% |
|
Satellite Towns |
75,610 |
306 |
81.8% |
17.0% |
3.9% |
0.1% |
4.0% |
|
Average |
135,512 |
541 |
83.7% |
16.9% |
4.1% |
0.1% |
4.2% |
|
Apartments |
|||||||
|
Upper Mid-End |
123,608 |
697 |
83.7% |
20.3% |
5.2% |
0.0% |
5.2% |
|
Lower Mid-End |
95,310 |
530 |
88.1% |
22.3% |
5.8% |
(0.9%) |
4.9% |
|
Satellite Towns |
75,187 |
408 |
85.8% |
22.5% |
6.0% |
(0.6%) |
5.5% |
|
Average |
98,035 |
545 |
85.9% |
21.7% |
5.7% |
(0.5%) |
5.2% |
|
Residential Market Average |
116,774 |
543 |
84.8% |
19.3% |
4.9% |
(0.2%) |
4.7% |
|
· Average annual total returns came in at 4.7%, 1.4% points lower than 6.1% recorded similar period in 2019. Consequently, rental yields recorded a 0.1% points marginal drop from 5.0% in 2019% to 4.9% in 2020 due to reduced rental rates. |
|||||||
Cytonn Research 2020
Our outlook for the residential sector is NEUTRAL supported by the continued launch of affordable housing projects, and, operationalization of the Kenya Mortgage and Refinance Company (KMRC) to provide the much needed mortgage facilities aimed at increasing home ownership. However, we expect the tough economic environment to continue affecting transaction volumes. For detached units, investment opportunity lies in areas such as Rosslyn, Ridgeways and Ruiru while for apartments, investment opportunity lies in satellite towns such as Thindigua and Syokimau, as well as the upper mid-end segment in areas such as Kilimani.
II. Commercial Office Sector
The commercial office sector recorded an average rental yield and occupancy rate of 7.0%, and 77.7%, lower than the 7.5% and 80.3% recorded in 2019, respectively. The decline in the rental yields and occupancy rates is attributable to reduced demand of commercial spaces brought about by the ongoing COVID-19 pandemic as some businesses restructured their operations hence scaled down while other organizations adopted work from home strategies. The asking rents also declined by 3.2% to an average of Kshs 93 per SQFT in 2020 from Kshs 96 per SQFT in 2019 while the average asking price declined by 2.9% to Kshs 12,280 per SQFT in 2020 from Kshs 12,638 per SQFT in 2019. The decline in rates is attributable to discounts or concessions offered by landlords in a bid to cushion their clients amid a tough financial environment.
The table below highlights the performance of the Nairobi Metropolitan Area (NMA) Commercial Office sector over time;
(All values in Kshs unless stated otherwise)
|
Nairobi Metropolitan Area (NMA) Commercial Office Returns Over Time |
|||||||||
|
Year |
Q1' 2019 |
H1' 2019 |
Q3' 2019 |
FY' 2019 |
Q1'2020 |
H1"2020 |
Q3' 2020 |
FY'2020 |
∆ FY'2019/FY '2020 |
|
Occupancy % |
82.4% |
81.0% |
80.5% |
80.3% |
81.7% |
80.0% |
79.9% |
77.7% |
(2.6%) points |
|
Asking Rents (Kshs/SQFT) |
100 |
97 |
96 |
96 |
97 |
95 |
94 |
93 |
(3.2%) |
|
Average Prices (Kshs/SQFT) |
12,574 |
12,637 |
12,638 |
12,638 |
12,535 |
12,516 |
12,479 |
12,280 |
(2.9%) |
|
Average Rental Yields (%) |
8.0% |
7.8% |
7.7% |
7.5% |
7.8% |
7.3% |
7.2% |
7.0% |
(0.5%) points |
|
· The commercial office sector has seen major declines in the occupancy rates, asking prices, asking rents and average rental yields attributable to reduced uptake and demand for commercial spaces, and pressure on landlords to reduce the rental charges to attract clients and maintain the existing clients, additionally, the existing oversupply of commercial spaces of 6.3 mn SQFT as at 2019 has also affected the performance of the sector. |
|||||||||
Source: Cytonn Research 2020
Our outlook for the NMA commercial office sector is NEGATIVE attributed to the reduced demand for commercial spaces brought about by the COVID-19 pandemic amid the tough economic environment as some firms downsize due to financial constrains while others embrace the working from home strategy. The asking prices and rents are also expected to decline as landlords continue giving discounts and concessions to attract and retain clients. Currently the best areas for investments in commercial spaces are Gigiri, Westlands, and, Karen with relatively high returns compared to the market averages in addition to availability of high quality spaces suitable for the high-end and middle income clients.
III. Retail Sector
The retail sector performance recorded a 0.3% decline in rental yields to 7.5% in 2020 from 7.8% in 2019. The average occupancy dropped by 0.7% points from 75.9% in 2019 to 75.2% in 2020, while the average monthly rental rates declined by 4.1% to Kshs 169 per SQFT from Kshs 176 per SQFT in 2019. The general decline in performance in 2020 is as a result of; i) exit by some retailers, both local and international to cushion themselves against the pandemic, ii) reduced demand for physical retail spaces as a result of the shifting focus to e-commerce by some retailers, iii) reduced consumer spending attributed to the tough economic environment, and, iv) the current existing oversupply in the retail sector of 2.0 mn SQFT in the Kenyan retail market and 3.1 mn SQFT in the NMA Metropolitan Area.
The table below shows the performance of the retail sector in Nairobi over time;
(All values in Kshs unless stated otherwise)
|
Summary of NMA Retail Sector Performance Over Time |
|||||||||
|
Item |
Q1' 2019 |
H1' 2019 |
Q3' 2019 |
FY' 2019 |
Q1'2020 |
H1'2020 |
Q3'2020 |
FY'2020 |
∆ FY’2020 |
|
Average Asking Rents (Kshs/SQFT) |
174 |
170 |
167 |
176 |
173 |
170 |
169 |
169 |
(4.1%) |
|
Average Occupancy (%) |
76.8% |
75.6% |
74.5% |
75.9% |
76.3% |
74.0% |
74.20% |
75.2% |
(0.7%) Points |
|
Average Rental Yields |
8.5% |
8.2% |
8.0% |
7.8% |
7.7% |
7.4% |
7.4% |
7.5% |
(0.3%) points |
|
|||||||||
Source: Cytonn Research 2020
Other notable highlights during the year included; see our previous reports Cytonn Q1’ Markets Review, H1’2020 Markets Review, and, Cytonn Q3’2020 Market Review. For Q4’2020;
- Big Square, a local fast-food retail chain, opened its second branch outside Nairobi, in Eldoret at Rupa’s Mall, bringing the total number of stores operated by the retail chain to 12. For more information, please see Cytonn Weekly #41/2020,
- Naivas Supermarket opened several braches among them; Rongai Branch, Lifestyle Mall Branch in Nairobi CBD, Hazina Towers, and, Ananas Mall in Thika town bringing the total number of outlets 69 with 8 outlets opened during the year thus completing the series of outlets they had initially announced that will be opened earlier this year. For more information, see Cytonn Weekly #51/2020 , Cytonn Weekly #48/2020, and, Cytonn Weekly #42/2020,
- QuickMart, local retail chain, opened an outlet in Nanyuki Mall situated in Nanyuki town, bringing the total number of Quickmart’s outlets to 35, with 6 outlets opened in 2020. For more analysis, see Cytonn Weekly #46/2020,
- Tuskys Supermarket a local retail chain, shut down five of its branches namely; Tuskys Magic branch in Nakuru Town, Tuskys Pioneer on Moi Avenue Street in Nairobi, Adams Arcade branch on Ngong Road and the Kitengela branch, Tuskys Shiloah Kakamega Branch. The retailer also announced plans to close down half of its branches, in an attempt to stabilize operations amid financial woes. For more analysis, see Cytonn Weekly #45/2020, Cytonn Weekly #47/2020, Cytonn Monthly-October 2020, and, Cytonn Weekly #43/2020, and,
- Carrefour Supermarket, opened its first outlet in Mombasa County at City Mall in Nyali, bringing its total number of operational outlets to 9 countrywide. For more information, see Cytonn Monthly-November 2020,
The table below shows the summary of the number of stores of the key local and international retail supermarket chains in Kenya as at December 2020;
|
Main Local and International Retail Supermarket Chains |
||||||
|
Name of Retailer |
Initial number of branches |
Number of branches opened in 2020 |
Closed branches |
Current number of Branches |
Branches expected to be opened / closed |
Projected total number of branches |
|
Naivas Supermarket |
61 |
8 |
0 |
69 |
0 |
69 |
|
Tuskys |
64 |
2 |
14 |
52 |
27 |
25 |
|
QuickMart |
29 |
6 |
0 |
35 |
0 |
35 |
|
Chandarana Foodplus |
19 |
1 |
0 |
20 |
0 |
20 |
|
Carrefour |
7 |
1 |
0 |
8 |
3 |
11 |
|
Uchumi |
37 |
0 |
33 |
4 |
0 |
4 |
|
Game Stores |
2 |
1 |
0 |
3 |
0 |
3 |
|
Choppies |
15 |
0 |
13 |
2 |
0 |
2 |
|
Shoprite |
4 |
0 |
2 |
2 |
0 |
2 |
|
Nakumatt |
65 |
0 |
65 |
0 |
0 |
0 |
|
Total |
303 |
19 |
127 |
194 |
31 |
171 |
Source: Online Research
We have a NEUTRAL outlook for the Kenyan retail sector with factors such as; i) reduced demand for physical space due to shifting focus to online shopping, ii) reduced purchasing power among consumers amid a tough economic environment, iii) reduced rental rates as landlords offer rental concessions to retain tenants and exit by some local retailers such as Tuskys, affecting the performance of the sector. However, continued expansion by local and international retail chains is expected to cushion the performance of the retail sector supported by; i) continued improvement of infrastructure opening up areas for investment, ii) relatively high population growth rate, iii) investor confidence due to the ease of doing business in Kenya, having been ranked position #56 by World Bank in the ease of doing business, and, iv) the growing middle class with increased purchasing power.
IV. Mixed-Use Developments (MUDs)
In 2020, Mixed-Use Developments recorded average rental yields of 7.1%, 0.3% points higher than the respective single use retail, commercial office and residential themes with 6.8%. retail, offices and residential spaces in MUDs recorded rental yields of 7.8%, 7.3% and 6.2%, respectively, compared to the single-use average of 7.5%, 7.2%, and 5.6%, respectively. The relatively better performance by MUDs is attributed to the prime locations, mostly serving the high and growing middle class supported by the concept’s convenience as it incorporates working, shopping and living experience.
Westlands was the best performing node recording an average MUD yield of 8.5% with the retail, office and residential spaces recording rental yields of 9.8%, 8.2% and 7.0%, respectively, 2.0%, 0.9% and 0.8% points higher than the sector averages of 7.8%, 7.3% and 6.2%, respectively. The performance was driven by the prime office and retail spaces, in addition to Westlands being a prime commercial node with high demand for commercial and residential space supported by the improved infrastructure; i.e., construction of the Nairobi Expressway along Waiyaki Way which will increase business activities in the area.
Eastlands was the worst performing node recording an average rental yield of 5.5% attributed to low rental charges attributable to unavailability of quality space and relatively high competition from informal Mixed-Use Developments.
The table below shows the performance of Mixed-Use Developments by node in 2020:
(All values in Kshs Unless stated otherwise)
|
C |
|||||||||||||||
|
|
Retail Performance |
Office Performance |
Residential Performance |
|
|||||||||||
|
Location |
Price/SQFT |
Rent/SQFT |
Occupancy (%) |
Rental Yield (%) |
Price/ SQFT |
Rent/SQFT |
Occupancy %) |
Rental Yield (%) |
Price/SQM |
Rent/SQM |
Annual Uptake % |
Rental Yield % |
Average MUD yield |
||
|
Westlands |
15,833 |
178 |
70.8% |
9.8% |
12,667 |
117 |
73.3% |
8.2% |
211,525 |
1,226 |
24.5% |
7.0% |
8.5% |
||
|
Limuru Rd |
23,900 |
223 |
85.0% |
9.5% |
13,500 |
130 |
65.0% |
7.5% |
147,496 |
1,166 |
20.0% |
7.3% |
|||
|
Karen |
23,333 |
143 |
88.5% |
6.7% |
13,200 |
123 |
80.0% |
9.0% |
7.3% |
||||||
|
Kilimani |
17,400 |
143 |
75.0% |
7.5% |
13,250 |
108 |
68.8% |
6.6% |
7.2% |
||||||
|
UpperHill |
15,485 |
120 |
65.0% |
6.0% |
12,500 |
107 |
65.0% |
6.7% |
6.6% |
||||||
|
Msa Rd |
20,000 |
150 |
70.0% |
6.3% |
13,000 |
100 |
70.0% |
6.5% |
157,440 |
874 |
14.3% |
6.7% |
6.5% |
||
|
Thika Rd |
26,250 |
200 |
85.0% |
8.5% |
13,750 |
105 |
64.0% |
5.9% |
143,803 |
705 |
22.5% |
5.9% |
6.4% |
||
|
Eastlands |
20,000 |
110 |
80.0% |
5.3% |
12,000 |
100 |
55.0% |
5.5% |
72,072 |
333 |
18.0% |
5.6% |
5.5% |
||
|
Average |
18,857 |
157 |
75.7% |
7.8% |
12,957 |
112 |
69.9% |
7.3% |
146,023 |
835 |
20.3% |
6.2% |
7.1% |
||
|
· Westlands was the best performing node recording an average MUD yield of 8.5% with the retail, office and residential spaces recording rental yields of 9.8%, 8.2% and 7.0%, respectively, 2.0%, 0.9% and 0.8% points higher than the sector averages of 7.8%,7.3% and 6.2%, respectively · Thika Road and Eastlands were the worst performing areas recording yields of 6.4% and 5.5%, respectively attributed to low rental charges as a result of competition from informal Mixed-Use Developments |
|||||||||||||||
Source: Cytonn Research 2020
The outlook for Mixed-Use Developments (MUDs) is NEUTRAL supported by the relatively high returns offered by the residential spaces amid subdued performance of the retail and office themes mainly constrained by oversupply 0f 3.1 mn SQFT and 6.3mn SQFT of retail and office spaces, respectively, within the Nairobi Metropolitan Area. The investment opportunity within the Nairobi Metropolitan Area lies in areas with relatively high returns such as Westlands which recorded an average MUD rental yield of 8.5%, and, Limuru Road and Karen recording average MUD yields of 7.3% each.
V. Hospitality Sector
During the year, the hospitality sector recorded subdued performance attributed to the COVID-19 pandemic which resulted in reduced demand. The sector’s contribution to GDP through accommodation and food services declined by 83.3% during the second quarter of 2020 compared to an expansion of 12.1% during the same period in 2019, according to the KNBS Quarterly Gross Domestic Product Report -Q2'2020,. The total number of international arrivals through Jomo Kenyatta International Airport (JKIA) and Moi International Airport (MIA) recorded a 71.5% decline from 1.2 mn persons between January to September 2019 to 0.3 mn during the same period in 2020. However, this was an increase from 13,919 persons in August 2020 to 20,164 persons in September 2020.
In terms of developments, 106-room Emara Hotel Ole Sereni located along Mombasa Road came into the market this year as a key accommodation facility targeting visitors landing through the Jomo Kenyatta International Airport. Hyatt, a US-based hospitality chain announced plans to build a 225-room facility in Nairobi along Mombasa road, marking the brand’s entry into the Kenya hospitality market. Additionally, Accor Hotels announced that they would continue with their expansion plans in Kenya and the African region despite the COVID-19 pandemic affecting the sector. The entry and expansion plans by the various brands signals investor confidence in the Kenya’s hospitality industry despite being one of the hardest hit by the COVID-19 pandemic.
In terms of performance, we tracked the performance of serviced apartments in 7 nodes in the Nairobi Metropolitan area. According to the Nairobi Metropolitan Area Serviced Apartments Report, serviced apartments recorded subdued performance in 2020 with the average rental yields declining by 3.6% points to 4.0% in 2020 from 7.6% in 2019. The decline in performance is attributed to low demand due to the decline in the number of tourist arrivals. The occupancy rates also declined by 31.3% points to 48.0% from 79.4% while the monthly charges per SQM declined by 14.9% from Kshs 2,806 to Kshs 2,448 as facilities offer discounts to attract and maintain clients amid a tough economic environment.
The table below shows market performance summary;
(All values in Kshs Unless Stated Otherwise)
|
NMA Serviced Apartments performance 2020 |
|||||||||
|
Node |
Occupancy 2019 |
Occupancy 2020 |
Occupancy rates ∆ |
Monthly Charge per SQM (Kshs) 2019 |
Monthly Charge per SQM (Kshs) 2020 |
% Change of Monthly Charges |
Rental Yield 2019 |
Rental Yield 2020 |
∆ in Rental Yield |
|
Westlands& Parklands |
80.8% |
49.4% |
(31.4%) |
3,884 |
3,578 |
(8.6%) |
10.8% |
6.1% |
(4.7%) |
|
Kilimani |
80.0% |
48.4% |
(31.6%) |
3,353 |
2,783 |
(20.5%) |
9.5% |
4.8% |
(4.7%) |
|
Limuru Road |
88.2% |
51.4% |
(36.8%) |
3,430 |
2,839 |
(20.8%) |
9.4% |
4.5% |
(4.8%) |
|
Kileleshwa& Lavington |
82.4% |
48.1% |
(34.3%) |
2,845 |
2,553 |
(11.4%) |
8.2% |
4.3% |
(3.9%) |
|
UpperHill |
67.8% |
48.9% |
(18.9%) |
2,577 |
2,121 |
(21.5%) |
6.0% |
3.6% |
(2.4%) |
|
Nairobi CBD |
72.0% |
42.1% |
(29.9%) |
2,230 |
2,122 |
(5.1%) |
5.1% |
2.9% |
(2.2%) |
|
Thika Road |
84.4% |
48.1% |
(36.3%) |
1,321 |
1,138 |
(16.1%) |
4.0% |
2.0% |
(2.0%) |
|
Average |
79.4% |
48.0% |
(31.3%) |
2,806 |
2,448 |
(14.9%) |
7.6% |
4.0% |
(3.6%) |
Source: Cytonn Research 2020
Our outlook of the hospitality sector is NEUTRAL. Despite the sector being the hardest hit by the COVID-19 pandemic, it has begun to gradually recover supported by financial aid from government through the Post-Corona Hospitality Sector Recovery Stimulus by the Ministry of Tourism through the Tourism Finance Corporation (TFC) and other international agencies, repackaging of the tourism sector to appeal to domestic tourists and relaxation of travel advisories. We expect this to fuel resumption of activities and resultant improved performance in the medium term.
VI. Land Sector
The NMA land sector remained resilient in 2020 despite the tough economic environment evidenced by a 2.3% annual capital appreciation and 10.7% 9-year CAGR, indicating that investors still consider land a good investment asset in the long term. Asking land prices within satellite towns outperformed asking land prices in Nairobi suburbs recording an average annual capital appreciation of 5.4% and 0.2%, respectively, attributable to affordability of the former amid reduced disposable income amid economic slowdown, availability of land in bulk and the improving infrastructure opening up areas for development.
The table below shows the summary of the NMA land performance;
(All values in Kshs Unless Stated Otherwise)
|
NMA Land Performance Trend |
|||||||
|
Location |
*Price in 2011 |
*Price in 2017 |
*Price in 2018 |
*Price in 2019 |
*Price in 2020 |
9 Year CAGR |
Annual Capital Appreciation 2019/'20 |
|
Unserviced land- Satellite Towns |
9.0 mn |
20.4 mn |
22.7 mn |
24.9 mn |
26.8 mn |
12.9% |
7.1% |
|
Serviced land- Satellite Towns |
6.0 mn |
14.4 mn |
14.3 mn |
14.3 mn |
14.8 mn |
10.6% |
3.8% |
|
Nairobi Suburbs - Low Rise Residential Areas |
56.0 mn |
82.4 mn |
89.4 mn |
91.6 mn |
93.8 mn |
5.9% |
3.2% |
|
Nairobi Suburbs - High Rise residential Areas |
46.0 mn |
134.6 mn |
135.0 mn |
137.5 mn |
135.7 mn |
12.8% |
1.2% |
|
Nairobi Suburbs - Commercial Areas |
156.0 mn |
429.8 mn |
447.3 mn |
428.5 mn |
413.0 mn |
11.4% |
(3.8%) |
|
Average |
54.6 mn |
144.5 mn |
155.4 mn |
139.4 mn |
136.8 mn |
10.7% |
2.3% |
Source: Cytonn Research 2020
We have a POSITIVE outlook for the land sector with the performance being cushioned by; (i) the growing demand for development land especially in the satellite towns as developers strive to drive the government’s Big Four government agenda on the provision of affordable housing, (ii) improving infrastructure, and (iii) demand for development land by the growing middle-income population.
VII. Statutory Review
In 2020, various statutory reforms were made to facilitate home ownership and simplify land and property transactions, and we expect the changes to impact the real estate sector positively. Notable highlights during the year see our previous reports Cytonn Q1’ Markets Review, H1’2020 Markets Review, and, Cytonn Q3’2020 Market Review. For Q4’2020;
i. The president of Kenya, Uhuru Kenyatta signed into law the Sectional Properties Act 2019, and, the Statute Law (Miscellaneous Amendments) 2020 bill.
- The new Sectional Properties Act, 2019 which repeals the Sectional Properties Act of 1987, provides for the division of buildings into units to be owned by individual proprietors and common property to be owned by proprietors of the units as tenants in common and to provide for the use and management of the units and common property and for connected purposes;
- The Statute Law (Miscellaneous Amendments) 2020 Act on the other hand includes; Amendment of the Housing Act (Cap.117) to remove the mandatory nature of contributions to the National Housing Development Fund, and, Amendment of The Kenya Roads Board Act 1999 (No.7 of 1999) to include a minimum number of days the board can hold every year at 4 days in a year hence departing from the current provision where the board is required to hold meetings every month For more information, see Cytonn Weekly #51/2020.
VIII. Infrastructure Sector
Notable highlights for the infrastructure sector during the year see our previous reports Cytonn Q1’ Markets Review, H1’2020 Markets Review, and, Cytonn Q3’2020 Market Review. For Q4’2020;
- The Kenyan government through the Kenya Rural Roads Authority, a state corporation within the State Department of Infrastructure, commenced the tarmacking of the first 7.0 km of Juja Farm Road in Kiambu County at a cost of Kshs 3.9 bn. The road is part of Kshs 30.0 bn Mau Mau roads that are being constructed in Murang’a, Nyeri and Kiambu Counties and set for completion in six months starting November. For more information, see Cytonn Weekly #45/2020, and,
- Kenya Urban Roads Authority (KURA), announced plans to construct two elevated carriage ways in the Nairobi Central Business District (CBD). The Kshs 2.9 bn project which has been assigned to China Road and Bridge Corporation will take shape after the completion of the Nairobi Expressway which is currently under construction by the Kenya National Highways Authority (KENHA), and is expected to be completed by 2023. For more information, see Cytonn Weekly #48/2020.
Despite the reduced budget allocation for the infrastructure sector with funds being redirected to dealing with the COVID-19 pandemic, the government continues to implement select projects and we expect this to open up areas for developments upon their completion thus boosting the real estate sector.
IX. Listed Real Estate & D-REITs
The Fahari I-REIT closed the year 2020 at Kshs 5.6 per share, trading at an average of Kshs 6.7 during the year compared to Kshs 8.9 in 2019. On a Year-to- date basis, the REIT recorded a 41.7% loss of value from Kshs 9.6 recorded in January 2020, and a 72.0% drop from its initial price of Kshs 20.0 as at November 2015. The REIT market continues to perform poorly attributable to; i) the subdued performance of the real estate market, ii) insufficient institutional grade real estate assets, iii) lack of investor appetite in the instrument, and iv) negative investor sentiments.
The graph below shows the historic performance of the I-REIT since listing;
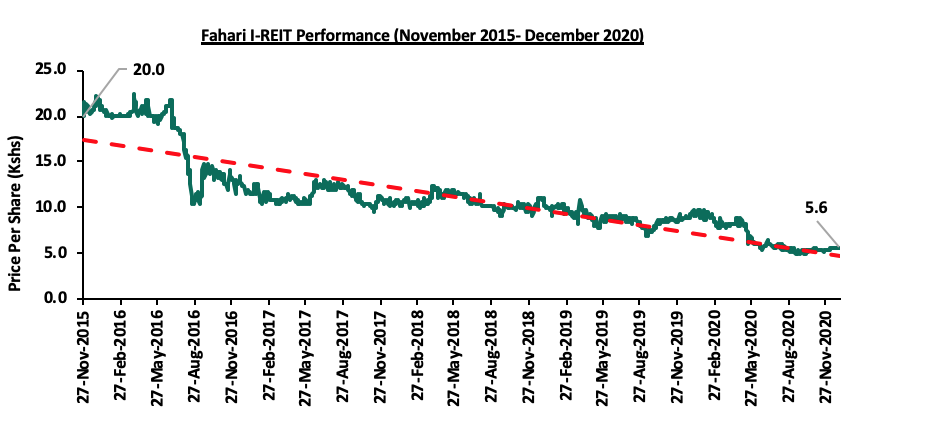
During the year, Acorn holdings, a real estate developer, announced plans to establish a D-REIT and an I-REIT in the next 3 years with an expected Internal Rate of Return of 18.0%. In line with the same, in November 2020, Acorn Investment Management Limited, a subsidiary of Acorn Holdings, was licensed as a REIT Manager by the Capital Markets Authority (CMA). This was followed by the Authority’s approval on the issuance of The Development Real Estate Investment Trust (D-REIT) and Investment Real Estate Investment Trust (I-REIT) in December the same year. The fund size for the two REITS is estimated at Kshs 4.0 bn for the D-REIT and Kshs 4.1 bn for the I-REIT in the initial fundraising. In their campaign, Acorn sought for investors to invest a total of 24.0% equity on the development of student accommodation D-REIT, and up to 67.0% in the I-REIT. By October, the firm had secured Kshs 1.0 bn equity investment from one of its anchor investor, InfraCo, a private infrastructure development group. The D-REIT is expected to finance the student hostels whereas the I-REIT will be used to acquire property for rental income.
The D-REIT market in Kenya has failed to take off despite the regulations having come into force in 2013. The Fusion Capital D-REIT, which was issued in 2016, failed due to low subscription rates; the Cytonn D-REIT faced delays in approvals given the high levels of capital required for a Corporate Trustee, of at least Kshs. 100m, leading the promoter to discontinue the effort. The poor performance of the D-REITs is attributed to several factors: (i) the high minimum investment amounts set at Kshs 5.0 mn that is over 100x the median income in Kenya, (ii) high minimum capital requirement for a trustee at Kshs 100.0 mn that reduces the pool of approved REIT Trustees, which is currently just three, namely; Housing Finance, Cooperative Bank and KCB Bank, and, (iii) lengthy approval process. Without addressing the two regulatory frameworks, DREITs will continue to be a mirage and there will be continued lack of capital to support housing development.
For more analysis see Cytonn Weekly#50/2020.
Our outlook for the REIT market is NEGATIVE due to the continued poor performance of the REIT market. However, we are of the view that for the REIT market to pick, some of the supportive framework that can be put in place include; i) broadening the pool of trustees by reducing the minimum capital requirement which currently stands at Kshs 100.0 mn, ii) Reducing the minimum investment amount for real state finance vehicles which is currently Kshs 5.0 mn, and, iii) removing the intense conflicts of interest between the governance of the Capital Markets Authority (CMA) and the fund structures so that there is more tolerance to constructive feedback.
Overall, our outlook on the real estate sector is NEUTRAL. We expect the real estate sector performance to record improvement in 2021 supported by launch of affordable housing projects, the Kenya Mortgage and Refinance Company (KMRC) providing relatively cheap mortgage to facilitate increase in home ownership, expansion of local and international retailers, the government’s post- COVID stimulus package set to boost performance of the hospitality sector, and, improvement of infrastructure opening up areas for investment. The sector will however continue to experience constraints such as oversupply of 6.3mn SQFT of office space 3.1mn SQFT of retail space and sluggish performance of the REIT market.
The graph below is a summary of real estate performance in terms of rental yields in 2020;
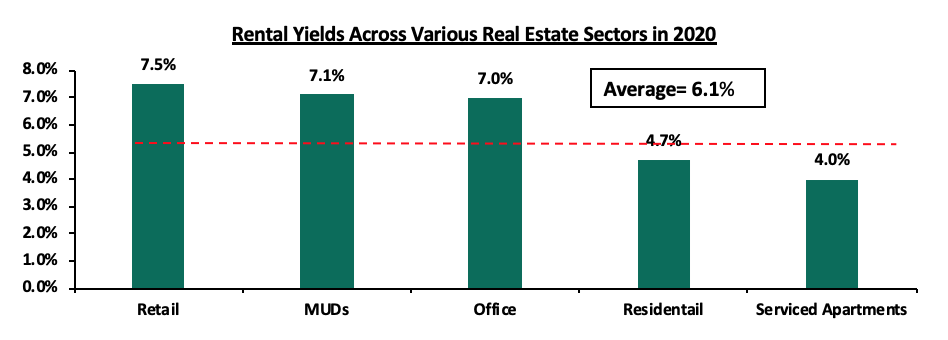
Disclaimer: The views expressed in this publication are those of the writers where particulars are not warranted. This publication is meant for general information only and is not a warranty, representation, advice or solicitation of any nature. Readers are advised in all circumstances to seek the advice of a registered investment advisor.

- Talk to us
- Kenya
- P.O Box 20695 - 00200, Nairobi, Kenya
- Cell +254709101200
- Tel +254709101200
- WhatsApp +254741676635
- United States
- +254709101200
- DOWNLOAD OUR APP
-


- Kenya
- 8th Floor, Pinetree Plaza, Kaburu Drive, Ngong Road, Nairobi, Kenya
- USA
- Suite 1150, 1775 Eye Street NW, USA, Washington DC 20006, USA
- Investments
- High Yield
- Private Equity
- Real Estate
- Real Estate
- RiverRun Estates
- Cytonn Towers
- The Ridge
- Taraji Heights
- The Alma