Nairobi Metropolitan Area Residential Report 2024, & Cytonn Weekly #19/2024
By Research Team, May 12, 2024
Executive Summary
Fixed Income
During the week, T-bills were oversubscribed for the second consecutive week, with the overall oversubscription rate coming in at 223.6%, significantly higher than the oversubscription rate of 108.2% recorded the previous week. Investors’ preference for the shorter 91-day paper persisted, with the paper receiving bids worth Kshs 17.3 bn against the offered Kshs 4.0 bn, translating to an oversubscription rate of 431.3%, higher than the oversubscription rate of 252.6% recorded the previous week. The subscription rates for the 182-day and 364-day papers increased significantly to 229.6% and 134.4% respectively from 52.0% and 106.6% respectively recorded the previous week. The government accepted a total of Kshs 49.5 bn worth of bids out of Kshs 53.7 bn bids received, translating to an acceptance rate of 92.3%. The yields on the government papers were on an upward trajectory, with the yield on the 364-day, 182-day, and 91-day papers increasing by 1.2 bps, 1.4 bps, and 3.8 bps to 16.51%, 16.50% and 15.90% from 16.50%, 16.49% and 15.87% respectively recorded the previous week;
Additionally, during the week, the Central Bank of Kenya released the auction results for the FXD1/2024/10 tap sale with a tenor to maturity of 9.9 years. The bond was undersubscribed with the overall subscription rate coming in at 47.4%, receiving bids worth Kshs 7.1 bn against the offered Kshs 15.0 bn. The government accepted bids worth Kshs 7.0 bn, translating to an acceptance rate of 98.8%. The weighted average yield of accepted bids remained unchanged at 16.2%, equal to the rate recorded for the reopened bond last week, while the coupon rate for the bond was fixed at 16.0%. With the Inflation rate at 5.0% as of April 2024, the real return of the bonds is 11.2%;
During the week, Stanbic Bank released its monthly Purchasing Manager's Index (PMI) highlighting that the index for the month of April 2024 improved slightly, coming in at 50.1, fractionally above the 50.0 neutral, up from 49.7 in March 2024, signaling a modest and softer improvement in operating conditions across Kenya;
Equities
During the week, the equities market was on an upward trajectory, with NASI gaining the most by 1.8%, while NSE 10, NSE 25, and NSE 20 gained by 1.2%, 1.1%, and 0.7% respectively, taking the YTD performance to gains of 19.3%, 16.9%, 15.8% and 10.0% for NSE 10, NSE 25, NASI and NSE 20 respectively. The equities market performance was driven by gains recorded by large-cap stocks such as Stanbic Bank, Safaricom, and ABSA of 5.5%, 3.4%, and 3.3% respectively. The performance was, however, weighed down by losses recorded by large-cap stocks such as NCBA, Bamburi, and Equity of 2.9%, 1.9%, and 1.5% respectively;
During the week, Stanbic Bank released their Q1’2024 financial results recording a 2.8% increase in Profit After Tax (PAT) to Kshs 4.0 bn, from Kshs 3.9 bn recorded in Q1’2023. The performance was mainly driven by a 19.6% increase in Net-Interest Income to Kshs 6.5 bn in Q1’2024, from Kshs 5.4 bn recorded in Q1’2023, but was weighed down by a 34.0% decrease in Non-Interest Income to Kshs 3.8 bn from Kshs 5.7 bn recorded in Q1’2023;
Also during the week, Safaricom released their FY’2024 financial results, recording a 16.8% increase in Earnings Before Interest, Taxes, Depreciation, and Amortization (EBITDA) to Kshs 163.3 bn, from Kshs 139.9 bn in FY’2023, while Profit After Tax (PAT) decreased by 18.7% to Kshs 42.7 bn, from Kshs 52.5 bn recorded in FY’2023. The performance was mainly driven by a 12.4% increase in total revenue to Kshs 349.4 bn in FY’2024, from Kshs 310.9 bn recorded in FY’2023. The performance was however weighed down by an 8.8% increase in operating costs to Kshs 186.2 bn in FY’2024, from Kshs 171.0 bn in FY’2023;
Real Estate
During the week, the Central Bank of Kenya (CBK) released the Quarterly Economic Review Q4’2023 Report, which highlighted the status and performance of Kenya’s economy of the period under review. The report highlighted that year-on-year (y/y) gross loans advanced to the Real Estate sector increased by 7.2% to Kshs 509.0 bn in Q4’2023, from Kshs 475.0 bn in Q4’2022;
In the infrastructure sector, President Ruto presided over the launch of the second phase of the Kenya Urban Support Programme (KUSP) in collaboration with the World Bank, where Kenya received Kshs 46.5 bn towards strengthening the capacity of urban areas by improving settlement structures;
In the Unquoted Securities Platform, Acorn D-REIT and I-REIT traded at Kshs 24.5 and Kshs 22.0 per unit, respectively, as of 9th May 2024. The performance represented a 22.5% and 10.0% gain for the D-REIT and I-REIT, respectively, from the Kshs 20.0 inception price. Additionally, the Nairobi Securities Exchange Plc (NSE) admitted Linzi Sukuk to the NSE Unquoted Securities Platform (USP), marking it as the first Shariah-compliant product to be admitted on the platform. This brings the total number of securities on the USP to three. The Linzi Sukuk bond aimed to raise Kshs 3.0 bn to finance the development of 3,069 institutional-grade affordable housing units, with bids coming in at Kshs 3.02 bn, allowing it to successfully meet its target;
Focus of the Week
This week, we update our previous research with the Nairobi Metropolitan Area (NMA) Residential Report 2024 titled ‘Untapped Investment Niches’ by highlighting the residential sector's performance in the region in terms of price appreciation, rental yields, and market uptake, based on the coverage of 35 regions within the Nairobi Metropolis;
Investment Updates:
- Weekly Rates:
- Cytonn Money Market Fund closed the week at a yield of 17.08% p.a. To invest, dial *809# or download the Cytonn App from Google Play store here or from the Appstore here;
- We continue to offer Wealth Management Training every Monday and Thursday, from 7.00 pm to 8:00 pm. The training aims to grow financial literacy among the general public. To register for any of our Wealth Management Trainings, click here;
- If interested in our Private Wealth Management Training for your employees or investment group, please get in touch with us through wmt@cytonn.com;
- Cytonn Insurance Agency acts as an intermediary for those looking to secure their assets and loved ones’ future through insurance namely; Motor, Medical, Life, Property, WIBA, Credit and Fire and Burglary insurance covers. For assistance, get in touch with us through insuranceagency@cytonn.com;
- Cytonn Asset Managers Limited (CAML) continues to offer pension products to meet the needs of both individual clients who want to save for their retirement during their working years and Institutional clients that want to contribute on behalf of their employees to help them build their retirement pot. To more about our pension schemes, kindly get in touch with us through pensions@cytonn.com;
Real Estate Updates:
- For more information on Cytonn’s Real Estate developments, email us at sales@cytonn.com;
- Phase 3 of The Alma is now ready for occupation and the show house is open daily. To join the waiting list to rent, please email properties@cytonn.com;
- For Third Party Real Estate Consultancy Services, email us at rdo@cytonn.com;
- For recent news about the group, see our news section here;
Hospitality Updates:
- We currently have promotions for Staycations. Visit cysuites.com/offers for details or email us at sales@cysuites.com;
Money Markets, T-Bills Primary Auction:
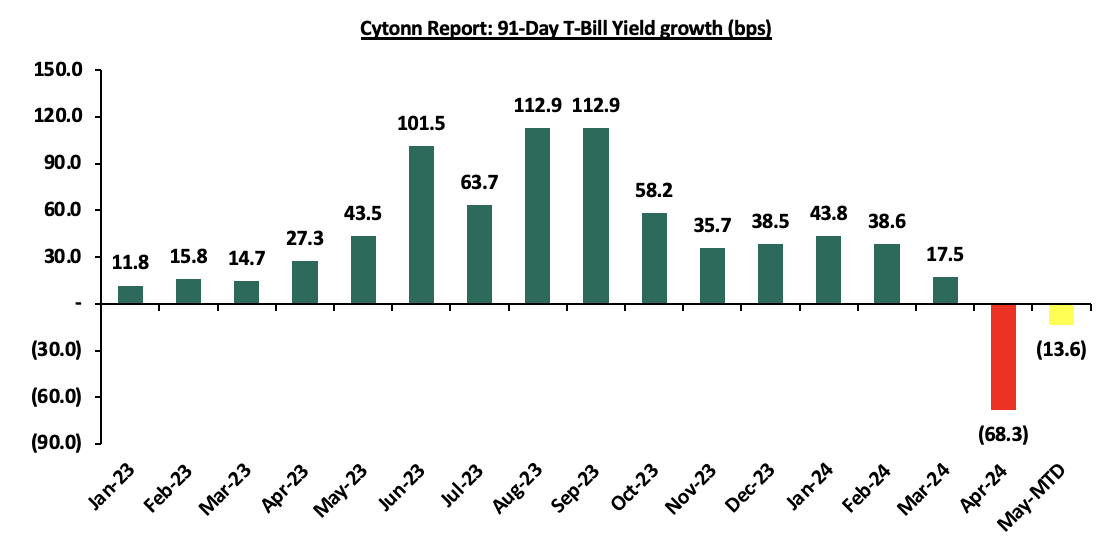
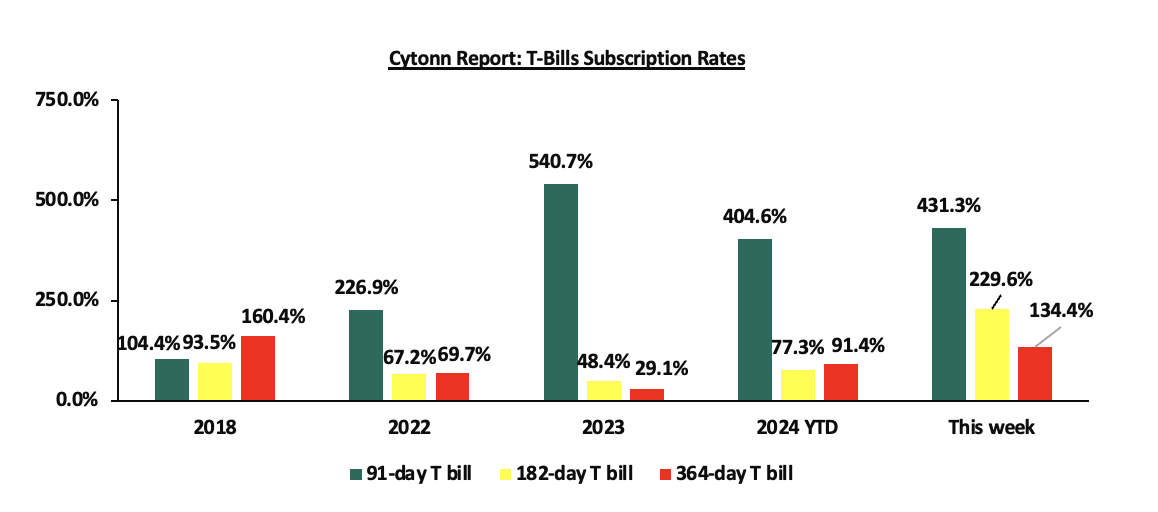
During the week, T-bills were oversubscribed for the second consecutive week, with the overall oversubscription rate coming in at 223.6%, significantly higher than the oversubscription rate of 108.2% recorded the previous week. Investors’ preference for the shorter 91-day paper persisted, with the paper receiving bids worth Kshs 17.3 bn against the offered Kshs 4.0 bn, translating to an oversubscription rate of 431.3%, higher than the oversubscription rate of 252.6% recorded the previous week. The subscription rates for the 182-day and 364-day papers increased significantly to 229.6% and 134.4% respectively from 52.0% and 106.6% respectively, recorded the previous week. The government accepted a total of Kshs 49.5 bn worth of bids out of Kshs 53.7 bn bids received, translating to an acceptance rate of 92.3%. The yields on the government papers were on an upward trajectory, with the yield on the 364-day, 182-day, and 91-day papers increasing by 1.2 bps, 1.4 bps, and 3.8 bps to 16.51%, 16.50% and 15.90% from 16.50%, 16.49% and 15.87% respectively recorded the previous week. The chart below shows the yield growth rate for the 91-day paper over the period:
The chart below compares the overall average T-bill subscription rates obtained in 2018, 2022, 2023, and 2024 Year-to-date (YTD):
Additionally, during the week, the Central Bank of Kenya released the auction results for the FXD1/2024/10 tap sale with a tenor to maturity of 9.9 years. The bond was undersubscribed with the overall subscription rate coming in at 47.4%, receiving bids worth Kshs 7.1 bn against the offered Kshs 15.0 bn. The government accepted bids worth Kshs 7.0 bn, translating to an acceptance rate of 98.8%. The weighted average yield of accepted bids remained unchanged at 16.2%, equal to the rate recorded for the reopened bond last week, while the coupon rate for the bond was fixed at 16.0%. With the Inflation rate at 5.0% as of April 2024, the real return of the bonds is 11.2%.
Money Market Performance:
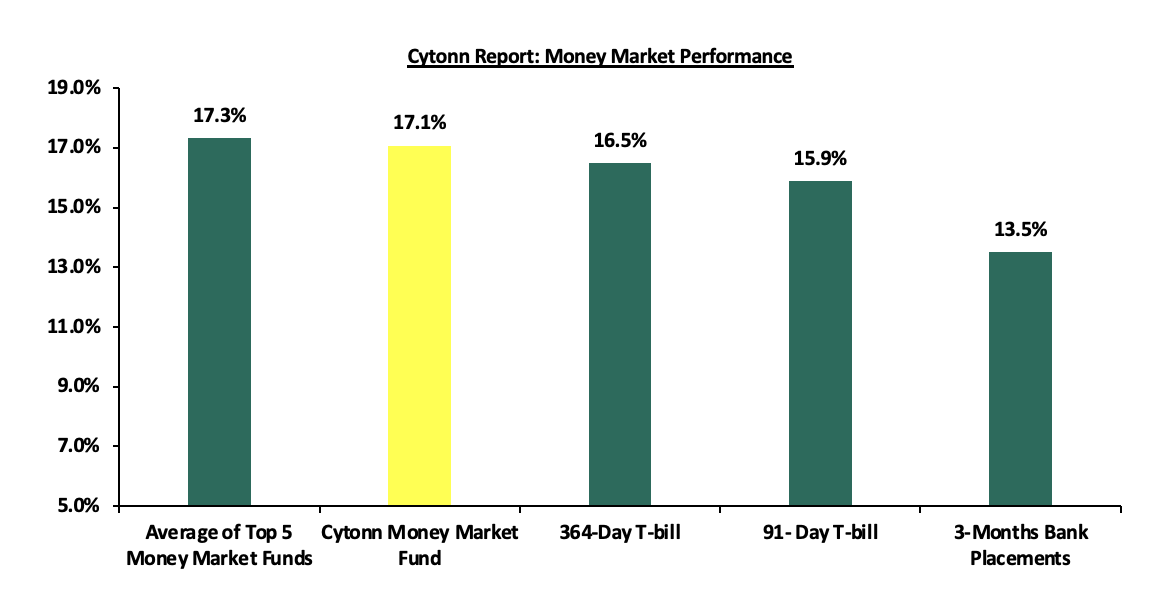
In the money markets, 3-month bank placements ended the week at 13.5% (based on what we have been offered by various banks), and the yields on the government papers were on an upward trajectory, with the yield on the 364-day and 91-day papers increasing by 1.2 bps and 3.8 bps to 16.5% and 15.9%, both remaining relatively unchanged from last week. The yields on the Cytonn Money Market Fund decreased by 5.0 bps to remain relatively unchanged at 17.1% recorded the previous week, while the average yields on the Top 5 Money Market Funds decreased by 12.2 bps to 17.3% from the 17.4% recorded the previous week.
The table below shows the Money Market Fund Yields for Kenyan Fund Managers as published on 10th May 2024:
|
Cytonn Report: Money Market Fund Yield for Fund Managers as published on 10th May 2024 |
||
|
Rank |
Fund Manager |
Effective Annual Rate |
|
1 |
Lofty-Corban Money Market Fund |
18.3% |
|
2 |
Etica Money Market Fund |
18.0% |
|
3 |
Cytonn Money Market Fund (Dial *809# or download the Cytonn app) |
17.1% |
|
4 |
GenAfrica Money Market Fund |
16.8% |
|
5 |
Nabo Africa Money Market Fund |
16.3% |
|
6 |
Kuza Money Market fund |
16.1% |
|
7 |
Enwealth Money Market Fund |
16.1% |
|
8 |
Apollo Money Market Fund |
16.0% |
|
9 |
Mali Money Market Fund |
15.5% |
|
10 |
Madison Money Market Fund |
15.5% |
|
11 |
Jubilee Money Market Fund |
15.4% |
|
12 |
KCB Money Market Fund |
15.4% |
|
13 |
Co-op Money Market Fund |
15.3% |
|
14 |
Absa Shilling Money Market Fund |
15.2% |
|
15 |
Sanlam Money Market Fund |
15.0% |
|
16 |
Mayfair Money Market Fund |
14.9% |
|
17 |
GenCap Hela Imara Money Market Fund |
14.5% |
|
18 |
AA Kenya Shillings Fund |
14.2% |
|
19 |
Dry Associates Money Market Fund |
13.7% |
|
20 |
Old Mutual Money Market Fund |
13.5% |
|
21 |
Orient Kasha Money Market Fund |
13.4% |
|
22 |
CIC Money Market Fund |
13.2% |
|
23 |
Equity Money Market Fund |
12.6% |
|
24 |
ICEA Lion Money Market Fund |
12.3% |
|
25 |
British-American Money Market Fund |
10.0% |
Source: Business Daily
Liquidity:
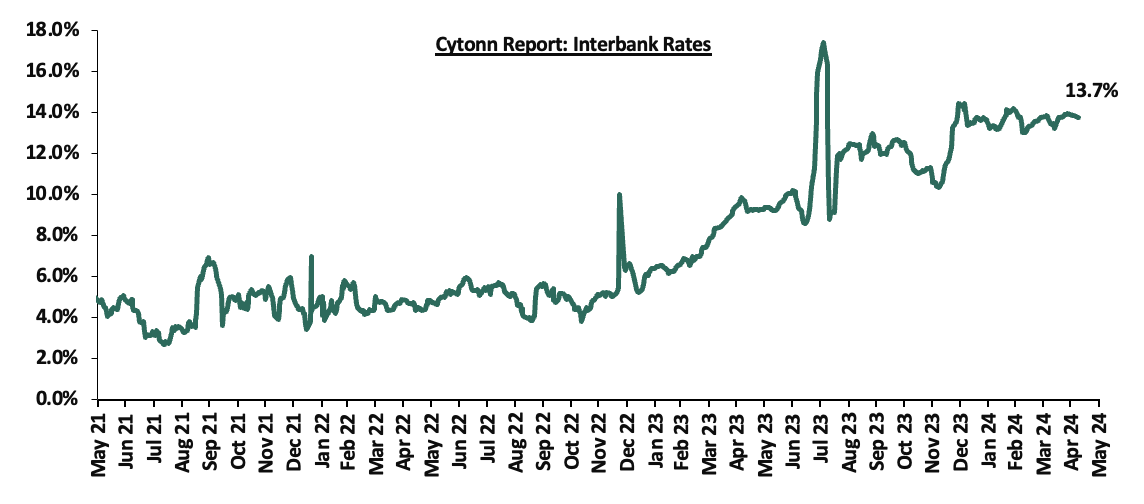
During the week, liquidity in the money markets eased, with the average interbank rate decreasing by 10.9 bps, to 13.8%, from 13.9% recorded the previous week, partly attributable to government payments that offset tax remittances. The average interbank volumes traded decreased by 42.5% to Kshs 15.6 bn from Kshs 27.2 bn recorded the previous week. The chart below shows the interbank rates in the market over the years:
Kenya Eurobonds:
During the week, the yields on Eurobonds were on a downward trajectory, with the yields on the 10-year Eurobond issued in 2018 decreasing the most by 40.2 bps to 8.8% from 9.2% recorded the previous week. The table below shows the summary of the performance of the Kenyan Eurobonds as of 9th May 2024;
|
Cytonn Report: Kenya Eurobonds Performance |
||||||
|
|
2018 |
2019 |
2021 |
2024 |
||
|
Tenor |
10-year issue |
30-year issue |
7-year issue |
12-year issue |
13-year issue |
7-year issue |
|
Amount Issued (USD) |
1.0 bn |
1.0 bn |
0.9 bn |
1.2 bn |
1.0 bn |
1.5 bn |
|
Years to Maturity |
3.8 |
23.8 |
3.0 |
8.0 |
10.1 |
6.8 |
|
Yields at Issue |
7.3% |
8.3% |
7.0% |
7.9% |
6.2% |
10.4% |
|
01-Jan-24 |
9.8% |
10.2% |
10.1% |
9.9% |
9.5% |
|
|
1-May-24 |
9.3% |
10.2% |
9.3% |
10.0% |
10.0% |
10.0% |
|
2-May-24 |
9.2% |
10.1% |
9.1% |
9.9% |
9.9% |
9.8% |
|
3-May-24 |
9.0% |
9.9% |
8.9% |
9.6% |
9.7% |
9.6% |
|
6-May-24 |
9.0% |
9.9% |
8.9% |
9.6% |
9.7% |
9.7% |
|
7-May-24 |
8.7% |
9.7% |
8.4% |
9.4% |
9.4% |
9.4% |
|
8-May-24 |
8.8% |
9.8% |
8.6% |
9.4% |
9.5% |
9.4% |
|
9-May-24 |
8.8% |
9.8% |
8.7% |
9.5% |
9.5% |
9.5% |
|
Weekly Change |
(0.4%) |
(0.2%) |
(0.3%) |
(0.4%) |
(0.4%) |
(0.4%) |
|
MTD Change |
(0.5%) |
(0.3%) |
(0.5%) |
(0.5%) |
(0.5%) |
(0.5%) |
|
YTD Change |
(1.0%) |
(0.3%) |
(1.4%) |
(0.4%) |
0.0% |
- |
Source: Central Bank of Kenya (CBK) and National Treasury
Kenya Shilling:
During the week, the Kenya Shilling gained against the US Dollar by 1.4%, to close at Kshs 131.3, from Kshs 133.1 recorded the previous week. On a year-to-date basis, the shilling has appreciated by 16.4% against the dollar, a contrast to the 26.8% depreciation recorded in 2023.
We expect the shilling to be supported by:
- Diaspora remittances standing at a cumulative USD 4,457.0 mn in the 12 months to April 2024, 11.9% higher than the USD 3,985.0 mn recorded over the same period in 2023, which has continued to cushion the shilling against further depreciation. In the April 2024 diaspora remittances figures, The United States of America remained the largest source of remittances to Kenya accounting for 49.0% in the period, and,
- The tourism inflow receipts which came in at USD 352.5 bn in 2023, a 31.5% increase from USD 268.1 bn inflow receipts recorded in 2022, and owing to tourist arrivals that improved by 27.6% to 182,000 in the 12 months to January 2024, from 151,000 recorded during a similar period in 2023.
The shilling is however expected to remain under pressure in 2024 as a result of:
- An ever-present current account deficit which came at 3.5% of GDP in Q3’2023 from 6.4% recorded in a similar period in 2022,
- The need for government debt servicing, continues to put pressure on forex reserves given that 67.5% of Kenya’s external debt was US Dollar denominated as of September 2023, and,
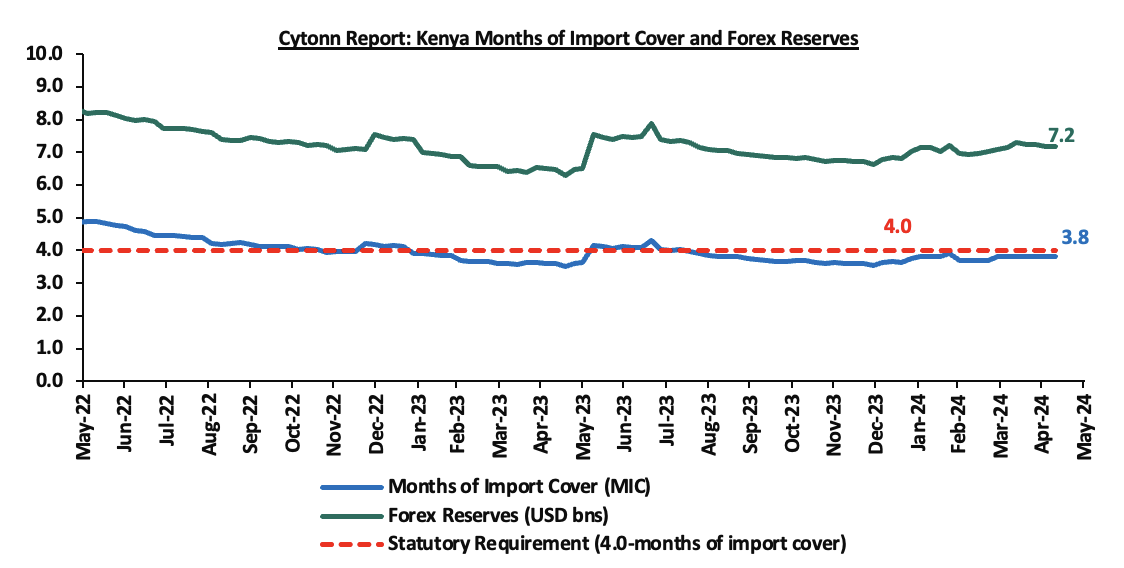
- Dwindling forex reserves, currently at USD 7.2 mn (equivalent to 3.8 months of import cover), which is below the statutory requirement of maintaining at least 4.0 months of import cover.
Key to note, Kenya’s forex reserves increased marginally by 0.01% during the week to remain relatively unchanged at USD 7.2 bn recorded the previous week, equivalent to 3.8 months of import cover same as the previous week, and remained below the statutory requirement of maintaining at least 4.0-months of import cover.
The chart below summarizes the evolution of Kenya's months of import cover over the years:
Weekly Highlights
- Stanbic Bank’s April 2024 Purchasing Manager’s Index (PMI)
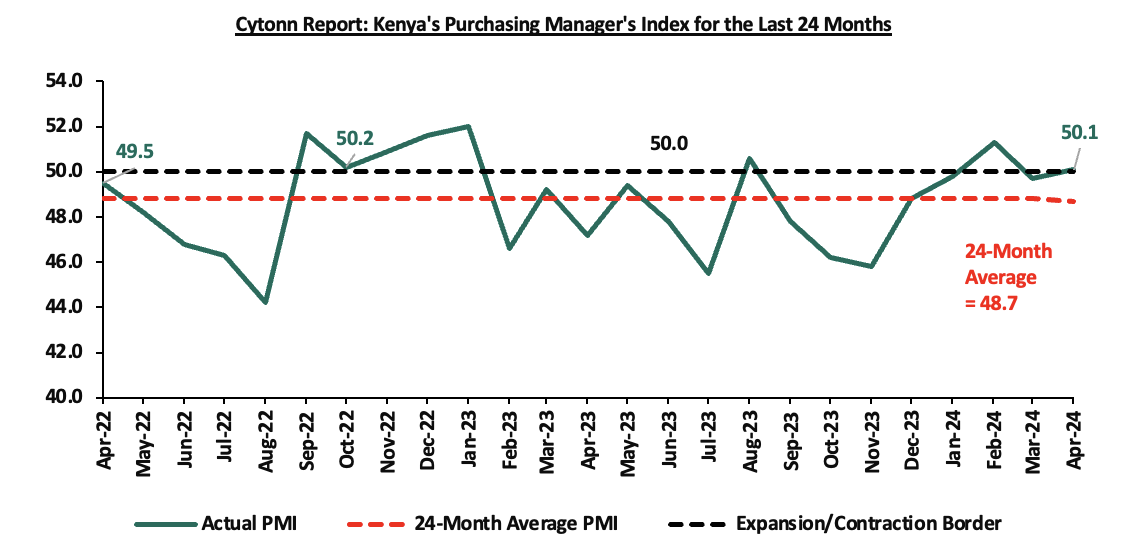
During the week, Stanbic Bank released its monthly Purchasing Manager's Index (PMI) highlighting that the index for the month of April 2024 improved slightly, coming in at 50.1, fractionally above the 50.0 neutral, up from 49.7 in March 2024, signaling a modest and softer improvement in operating conditions across Kenya. Private sector conditions stabilized during the month of April, recording the third increase this year. On a year-to-year basis, the index recorded a 6.1% improvement from the 47.2 recorded in April 2023. The modest and softer improvement of the general business environment is mainly attributable to easing inflation and the service sector experiencing improved business conditions, with inflation coming in at CBK’s preferred target of 5.0% and below for the first time since October 2020, and remaining within the Central Bank of Kenya (CBK) target range of 2.5% to 7.5% for the tenth consecutive month, a decrease of 0.7% points from 5.7% in March. Notably, the prices for Super Petrol, Diesel, and Kerosene decreased by Kshs 5.3, Kshs 10.0, and Kshs 18.7 from the March prices and to retail at Kshs 193.8, Kshs 180.4, and Kshs 170.0 per litre respectively.
The average input charges fell for the first time since June 2020, signaling weaker price pressures in the Kenyan private sector. The sector data showed a cooling of inflationary pressures in all segments except agriculture and construction, with the wholesale & retail sector posting the largest decline in input prices. With cost pressures easing and the downturn in sales softening, purchasing activity at Kenyan firms increased in April, helping businesses to raise their inventories and prospects of new business for the third consecutive month. Despite delays due to flooding, suppliers' average delivery times decreased as they competed for business. Similarly, the employment levels improved for the fourth consecutive month in April, with a rise in staff costs and increased inventories driven by expectations of a potential uptick in customer demand.
Notably, overall sentiment towards future output over the next 12 months reached the highest level since March 2023, rebounding from the lowest recorded sentiment in February. The outlook reflected anticipated investment in marketing, capacity enhancements, new branches, recruitment, and expansion into other African markets, with service providers recording the strongest growth expectations. Key to note, a PMI reading of above 50.0 indicates an improvement in the business conditions, while readings below 50.0 indicate a deterioration. The chart below summarizes the evolution of PMI over the last 24 months:
Going forward, we expect the business climate to be restrained in the short to medium term as a result of the difficult economic environment caused by high interest rates from tightening monetary policy, increasing taxes, and an overall rise in the cost of living. However, we expect firms to benefit from reduced inflationary pressures and an appreciating Shilling, which will lower input prices.
Rates in the Fixed Income market have been on an upward trend given the continued high demand for cash by the government and the occasional liquidity tightness in the money market. The government is 23.3% ahead of its prorated net domestic borrowing target of Kshs 354.4 bn, having a net borrowing position of Kshs 437.2 bn out of the domestic net borrowing target of Kshs 407.0 bn for the FY’2023/2024. However, we expect a downward readjustment of the yield curve in the short and medium term, with the government looking to increase its external borrowing to maintain the fiscal surplus, hence alleviating pressure in the domestic market. As such, we expect the yield curve to normalize in the medium to long-term and hence investors are expected to shift towards the long-term papers to lock in the high returns.
During the week, the equities market was on an upward trajectory, with NASI gaining the most by 1.8%, while NSE 10, NSE 25, and NSE 20 gained by 1.2%, 1.1%, and 0.7% respectively, taking the YTD performance to gains of 19.3%, 16.9%, 15.8% and 10.0% for NSE 10, NSE 25, NASI, and NSE 20 respectively. The equities market performance was driven by gains recorded by large-cap stocks such as Stanbic Bank, Safaricom, and ABSA of 5.5%, 3.4%, and 3.3% respectively. The performance was, however, weighed down by losses recorded by large-cap stocks such as NCBA, Bamburi, and Equity of 2.9%, 1.9%, and 1.5% respectively.
During the week, equities turnover increased significantly by 76.8% to USD 8.6 mn from USD 4.9 mn recorded the previous week, taking the YTD total turnover to USD 195.9 mn. Foreign investors remained net buyers for the fifth consecutive week with a net buying position of USD 0.7 mn, from a net selling position of USD 1.6 mn recorded the previous week, taking the YTD foreign net selling position to USD 7.8 mn.
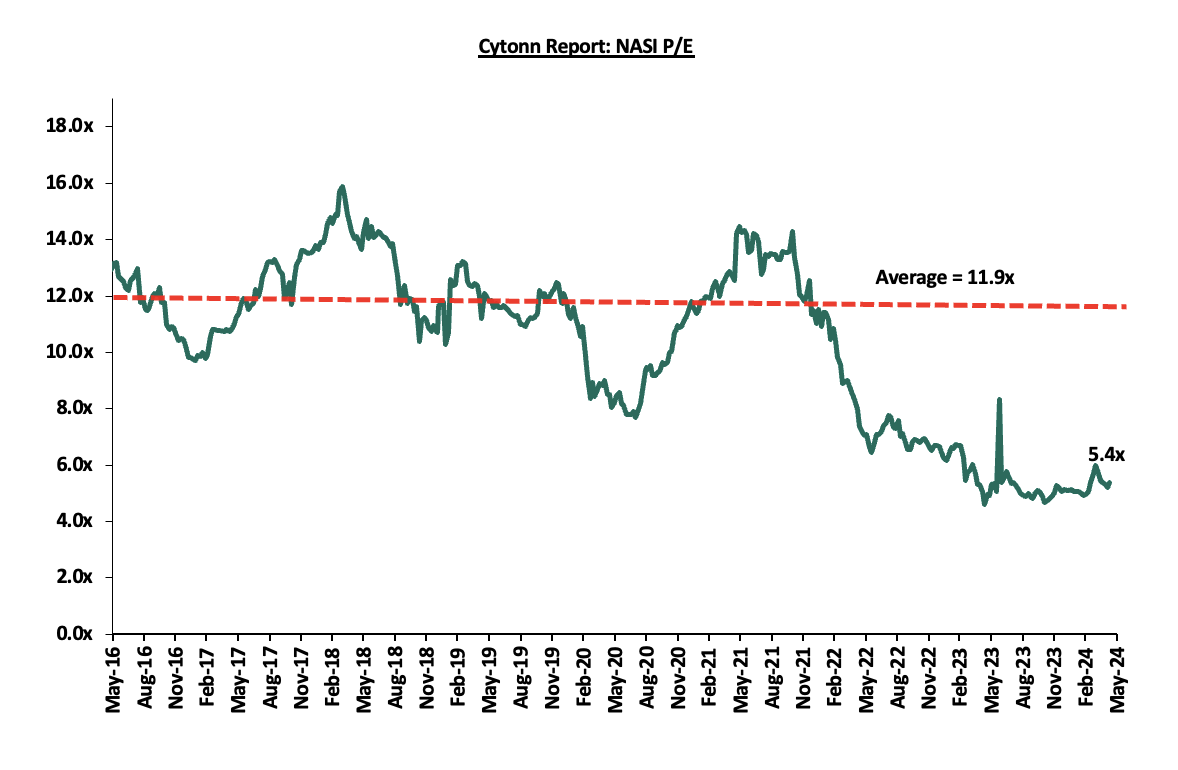
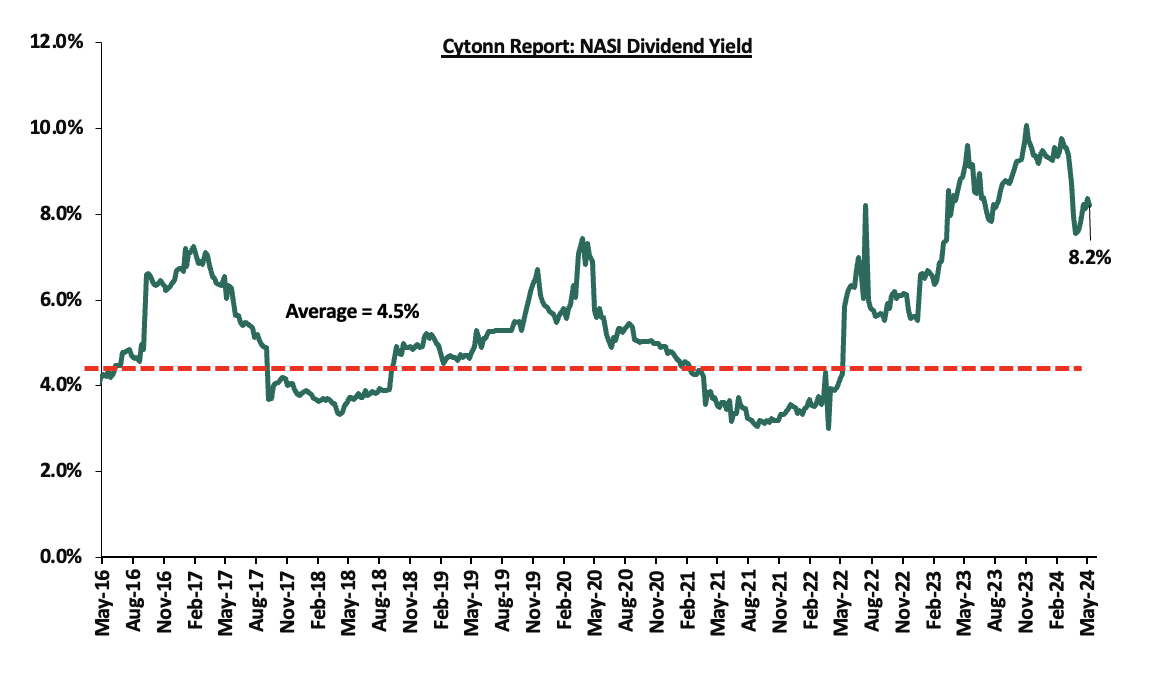
The market is currently trading at a price-to-earnings ratio (P/E) of 5.4x, 55.0% below the historical average of 11.9x. The dividend yield stands at 8.2%, 3.7% points above the historical average of 4.5%. Key to note, NASI’s PEG ratio currently stands at 0.6x, an indication that the market is undervalued relative to its future growth. A PEG ratio greater than 1.0x indicates the market is overvalued while a PEG ratio less than 1.0x indicates that the market is undervalued.
The charts below indicate the historical P/E and dividend yields of the market:
Universe of Coverage:
|
Cytonn Report: Equities Universe of Coverage |
|||||||||
|
Company |
Price as at 03/05/2024 |
Price as at 09/05/2024 |
w/w change |
YTD Change |
Target Price* |
Dividend Yield |
Upside/ Downside** |
P/TBv Multiple |
Recommendation |
|
NCBA*** |
39.4 |
38.2 |
(2.9%) |
(1.7%) |
55.2 |
12.4% |
56.9% |
0.7x |
Buy |
|
Co-op Bank*** |
12.2 |
12.1 |
(1.2%) |
6.2% |
17.2 |
12.4% |
55.2% |
0.6x |
Buy |
|
Equity Group*** |
42.6 |
41.9 |
(1.5%) |
22.5% |
60.2 |
9.5% |
53.2% |
0.8x |
Buy |
|
Jubilee Holdings |
182.0 |
178.0 |
(2.2%) |
(3.8%) |
260.7 |
6.7% |
53.2% |
0.3x |
Buy |
|
ABSA Bank*** |
12.0 |
12.4 |
3.3% |
6.9% |
17.3 |
12.6% |
52.6% |
1.0x |
Buy |
|
Standard Chartered*** |
171.5 |
176.3 |
2.8% |
10.0% |
225.2 |
16.5% |
44.2% |
1.2x |
Buy |
|
I&M Group*** |
18.0 |
17.6 |
(2.2%) |
0.9% |
22.5 |
14.5% |
42.3% |
0.4x |
Buy |
|
Diamond Trust Bank*** |
50.0 |
50.0 |
0.0% |
11.7% |
65.2 |
10.0% |
40.4% |
0.2x |
Buy |
|
Kenya Reinsurance |
1.9 |
2.0 |
2.1% |
5.4% |
2.5 |
10.3% |
39.0% |
0.2x |
Buy |
|
Sanlam |
6.5 |
6.5 |
(0.6%) |
8.0% |
8.8 |
0.0% |
36.0% |
1.8x |
Buy |
|
Stanbic Holdings |
118.5 |
125.0 |
5.5% |
17.9% |
145.3 |
12.3% |
28.5% |
0.8x |
Buy |
|
KCB Group*** |
29.5 |
30.1 |
1.9% |
36.9% |
37.2 |
0.0% |
23.8% |
0.5x |
Buy |
|
CIC Group |
2.2 |
2.1 |
(0.5%) |
(6.6%) |
2.5 |
6.1% |
22.9% |
0.7x |
Buy |
|
Britam |
5.8 |
5.3 |
(8.6%) |
3.5% |
6.5 |
0.0% |
22.2% |
0.7x |
Buy |
|
Liberty Holdings |
5.5 |
5.4 |
(1.8%) |
38.9% |
6.1 |
7.0% |
20.8% |
0.4x |
Buy |
|
HF Group |
3.7 |
4.4 |
17.1% |
27.0% |
4.6 |
0.0% |
5.7% |
0.2x |
Hold |
Weekly Highlights
- Earnings Release
During the week, Stanbic Holdings released their Q1’2024 financial results. Below is a summary of the performance;
|
Balance Sheet Items (Kshs bn) |
Q1'2023 |
Q1'2024 |
y/y change |
|
Net Loans and Advances |
230.3 |
255.8 |
11.1% |
|
Kenya Government Securities |
49.9 |
35.8 |
(28.4%) |
|
Total Assets |
391.6 |
491.5 |
25.5% |
|
Customer Deposits |
291.0 |
355.5 |
22.2% |
|
Deposits Per Branch |
9.7 |
11.9 |
22.2% |
|
Total Liabilities |
335.5 |
429.6 |
28.0% |
|
Shareholders' Funds |
56.1 |
61.9 |
10.4% |
|
Balance Sheet Ratios |
Q1'2023 |
Q1'2024 |
% point change |
|
Loan to Deposit ratio |
79.1% |
71.9% |
(7.2%) |
|
Government Securities to Deposits ratio |
17.1% |
10.1% |
(7.1%) |
|
Return on Average Equity |
20.7% |
20.8% |
0.1% |
|
Return on Average Assets |
3.0% |
2.8% |
(0.2%) |
|
Income Statement (Kshs bn) |
Q1'2023 |
Q1'2024 |
y/y change |
|
Net interest Income |
5.4 |
6.5 |
19.6% |
|
Net non-interest income |
5.7 |
3.8 |
(34.0%) |
|
Total Operating income |
11.2 |
10.3 |
(8.0%) |
|
Loan loss provision |
(1.1) |
(1.1) |
(0.5%) |
|
Total Operating expenses |
(5.7) |
(4.8) |
(15.2%) |
|
Profit before tax |
5.5 |
5.5 |
(0.5%) |
|
Profit after tax |
3.9 |
4.0 |
2.8% |
|
Core EPS |
9.8 |
10.1 |
2.8% |
|
Income Statement Ratios |
Q1'2023 |
Q1'2024 |
% point change |
|
Yield from interest-earning assets |
2.8% |
3.8% |
1.1% |
|
Cost of funding |
2.8% |
4.5% |
1.7% |
|
Net Interest Margin |
7.2% |
8.4% |
1.2% |
|
Net Interest Income as % of operating income |
48.6% |
63.1% |
14.5% |
|
Non-Funded Income as a % of operating income |
51.4% |
36.9% |
(14.5%) |
|
Cost to Income Ratio |
50.7% |
46.8% |
(4.0%) |
|
Cost to Income without LLP |
40.5% |
35.7% |
(4.8%) |
|
Cost to Assets |
1.2% |
0.7% |
(0.4%) |
|
Capital Adequacy Ratios |
Q1'2023 |
Q1'2024 |
% points change |
|
Core Capital/Total Liabilities |
16.9% |
14.8% |
(2.1%) |
|
Minimum Statutory ratio |
8.0% |
8.0% |
|
|
Excess |
8.9% |
6.8% |
(2.1%) |
|
Core Capital/Total Risk Weighted Assets |
14.6% |
13.3% |
(1.3%) |
|
Minimum Statutory ratio |
10.5% |
10.5% |
|
|
Excess |
4.1% |
2.8% |
(1.3%) |
|
Total Capital/Total Risk Weighted Assets |
17.8% |
16.2% |
(1.6%) |
|
Minimum Statutory ratio |
14.5% |
14.5% |
|
|
Excess |
3.3% |
1.7% |
(1.6%) |
|
Liquidity Ratio |
45.6% |
51.2% |
5.6% |
|
Minimum Statutory ratio |
20.0% |
20.0% |
|
|
Excess |
25.6% |
31.2% |
5.6% |
For a more detailed analysis, see our Stanbic Bank’s Q1’2024 Earnings Note
Asset Quality
The table below shows the asset quality of listed banks that have released their Q1’2024 results using several metrics:
|
Cytonn Report: Listed Banks Asset Quality in Q1’2024 |
||||||
|
|
Q1'2024 NPL Ratio* |
Q1'2023 NPL Ratio** |
% point change in NPL Ratio |
Q1'2024 NPL Coverage* |
Q1'2023 NPL Coverage** |
% point change in NPL Coverage |
|
Stanbic Bank |
8.9% |
11.7% |
(2.9%) |
72.3% |
66.7% |
5.6% |
|
Mkt Weighted Average* |
8.9% |
12.6% |
(3.7%) |
72.3% |
63.7% |
8.6% |
|
*Market cap weighted as at 09/05/2024 |
||||||
|
**Market cap weighted as at 15/06/2023 |
||||||
Key take-outs from the table include;
- Asset quality for the listed bank that has released improved during Q1’2024, with market-weighted average NPL ratio declining by 3.7% points to 8.9% from 12.6% in Q1’2023, and,
- Market-weighted average NPL Coverage for the listed bank increased by 8.6% points to 72.3% in Q1’2024 from 63.7% recorded in Q1’2023. The increase was attributable to Stanbic Holding’s NPL coverage ratio increasing by 5.6% points to 72.3% from 66.7% in Q1’2023.
Summary Performance
The table below shows the performance of listed banks that have released their Q1’2024 results using several metrics:
|
Cytonn Report: Listed Banks Performance in Q1’2024 |
|||||||||||||
|
Bank |
Core EPS Growth |
Interest Income Growth |
Interest Expense Growth |
Net Interest Income Growth |
Net Interest Margin |
Non-Funded Income Growth |
NFI to Total Operating Income |
Growth in Total Fees & Commissions |
Deposit Growth |
Growth in Government Securities |
Loan to Deposit Ratio |
Loan Growth |
Return on Average Equity |
|
Stanbic Holdings |
2.8% |
53.9% |
130.2% |
19.6% |
8.4% |
(34.0%) |
36.9% |
(10.4%) |
22.2% |
(28.4%) |
71.9% |
11.1% |
20.8% |
|
Q1'24 Mkt Weighted Average* |
2.8% |
53.9% |
130.2% |
19.6% |
8.4% |
(34.0%) |
36.9% |
(10.4%) |
22.2% |
(28.4%) |
71.9% |
11.1% |
20.8% |
|
Q1'23 Mkt Weighted Average** |
25.0% |
26.2% |
40.2% |
20.1% |
7.3% |
48.1% |
41.3% |
30.0% |
19.0% |
(1.2%) |
73.1% |
19.6% |
22.1% |
|
*Market cap weighted as at 09/05/2024 |
|||||||||||||
|
**Market cap weighted as at 15/06/2023 |
|||||||||||||
Key take-outs from the table include:
- The listed bank recorded a 2.8% growth in core Earnings per Share (EPS) in Q1’2024, compared to the weighted average growth of 25.0% in Q1’2023, an indication of sustained performance owing to the improved operating environment experienced during the quarter,
- Non-Funded Income declined by 34.0% compared to market-weighted average decline of 48.1% in Q1’2023, despite the increased revenue diversification efforts by the bank, and,
- The Bank recorded a deposit growth of 22.2%, lower than the market-weighted average deposit growth of 19.0% in Q1’2023
- Safaricom FY’2024 Financial Performance
During the week, Safaricom released their FY’2024 financial results, recording a 16.8% increase in Earnings Before Interest, Taxes, Depreciation, and Amortization (EBITDA) to Kshs 163.3 bn, from Kshs 139.9 bn in FY’2023, while Profit After Tax (PAT) decreased by 18.7% to Kshs 42.7 bn, from Kshs 52.5 bn recorded in FY’2023. The performance was mainly driven by a 12.4% increase in total revenue to Kshs 349.4 bn in FY’2024, from Kshs 310.9 bn recorded in FY’2023. The performance was however weighed down by an 8.8% increase in operating costs to Kshs 186.2 bn in FY’2024, from Kshs 171.0 bn in FY’2023;
|
Cytonn Report: Safaricom PLC Income Statement |
|||
|
Item (All figures in Bns) |
FY'2023 |
FY'2024 |
y/y change |
|
Total Revenue |
310.9 |
349.4 |
12.4% |
|
Operating costs |
(171.0) |
(186.2) |
8.8% |
|
EBITDA |
139.9 |
163.3 |
16.8% |
|
Depreciation & Amortization |
(54.9) |
(82.9) |
51.2% |
|
Operating Profit |
85.0 |
80.3 |
(5.5%) |
|
Net Finance Costs |
(7.1) |
(16.6) |
134.8% |
|
Profit Before Tax |
88.3 |
84.7 |
(4.1%) |
|
Profit After Tax |
52.5 |
42.7 |
(18.7%) |
|
Dividend Per Share |
1.2 |
1.2 |
0.0% |
|
Payout Ratio |
47.3% |
61.0% |
|
|
Dividend Yield |
7.7% |
7.5% |
|
Source: Safaricom FY’2024 Financial Report
|
Cytonn Report: Safaricom PLC Balance Sheet |
|||
|
Item (All figures in Bns) |
FY'2023 |
FY'2024 |
y/y change |
|
Current Assets |
72.4 |
82.5 |
14.0% |
|
Non-Current Assets |
436.8 |
558.6 |
27.9% |
|
Total Assets |
509.2 |
641.2 |
25.9% |
|
Current Liabililities |
140.4 |
167.8 |
19.6% |
|
Non-Current Liabilities |
105.5 |
137.6 |
30.5% |
|
Total liabilities |
245.8 |
305.4 |
24.2% |
|
Shareholder funds |
187.6 |
226.3 |
20.7% |
|
Minority Interest |
75.8 |
109.4 |
44.3% |
|
Total Equity |
263.4 |
335.7 |
27.5% |
Source: Safaricom FY’2024 Financial Report
Key take outs from the financial performance include;
- Net revenue increased by 16.8% to Kshs 163.3 bn in FY’2024, from Kshs 139.9 bn recorded in FY’2023, mainly driven by the 12.4% increase in total revenue to Kshs 349.4 bn in FY’2024, from Kshs 310.9 bn in FY’2023. Notably, the increase in total revenue is attributed to the 13.4% increase in service revenue to Kshs 335.4 bn in FY’2024, from Kshs 295.7 bn in FY’2023,
- Total operating expenses increased by 8.8% to Kshs 186 bn, from Kshs 171.0 bn in FY’2023, attributable to a 12.4% increase in other operating costs to Kshs 83.3 bn, from Kshs 74.1 bn in FY’2023, coupled with a 5.2% increase in direct costs to Kshs 97.0 bn from Kshs 92.2 bn in FY’2023,
- Operating profit decreased by 5.5% to Kshs 80.3 bn in FY’2024, from Kshs 85.0 bn in FY’2023, largely driven by the 51.2% increase in the depreciation and amortization costs to 82.9 bn from 54.9 bn in FY’2023,
- The balance sheet recorded an expansion as total assets increased by 25.9% to Kshs 641.2 bn, from Kshs 509.2 bn in FY’2023, mainly driven by a 27.9% increase in non-current assets to Kshs 558.6 bn, from Kshs 436.8 bn in FY’2023,
- The current liabilities increased by 19.6% to Kshs 167.8 bn in FY’2024, from Kshs 140.4 bn recorded in FY’2023, mainly attributable to a significant 272.9% increase in dividends payables to Kshs 6.6 bn in FY’2024 from Kshs 1.8 bn in FY’2023,
- Earnings per share (EPS) increased marginally by 1.3% to Kshs 1.57 in FY’2024, from Kshs 1.55 in FY’2023, mainly due to the 16.8% increase in the net revenue to Kshs 163.3 bn in FY’2024, from Kshs 139.9 bn recorded in FY’2023, and,
- The board of directors recommended a final dividend of Kshs 0.65 having paid Kshs 0.55 in interim dividend, which brings the total dividend per share in FY’2024 to Kshs 1.2, remaining unchanged from FY’2023. The payout ratio stands at 61.0%, an increase from 47.3% in FY’2023, while the dividend yield currently stands at 7.5%.
Amidst the tough macroeconomic climate, Safaricom recorded an 18.7% decline in Profits after Tax (PAT) to Kshs 42.7 bn in FY’2024, from Kshs 52.5 bn recorded in FY’2023. The challenging operating environment was characterized by rising inflation adversely affecting customers' disposable income and a global downward trend in voice service, which led to a decline in voice revenue and posed challenges to the company's profitability. However, going forward, we expect the company's earnings to be supported by strong growth in M-PESA and mobile data revenue as a result of increased usage and customer acquisitions. Notably, the company has invested significantly in rolling out operations in Ethiopia, which is expected to contribute to future revenue growth. These actions will facilitate diversification of revenue streams and increased revenue from emerging markets, thus mitigating the impact of challenges in the domestic market.
We are “Neutral” on the Equities markets in the short term due to the current tough operating environment and huge foreign investor outflows, and, “Bullish” in the long term due to current cheap valuations and expected global and local economic recovery. With the market currently being undervalued for its future growth (PEG Ratio at 0.6x), we believe that investors should reposition towards value stocks with strong earnings growth and that are trading at discounts to their intrinsic value. We expect the current high foreign investors’ sell-offs to continue weighing down the equities outlook in the short term.
- Industrial Report
During the week, the Central Bank of Kenya (CBK) released the Quarterly Economic Review Q4’2023 Report, which highlighted the status and performance of Kenya’s economy during the period under review. The following were the key take outs from the report, with regard to the Real Estate and related sectors;
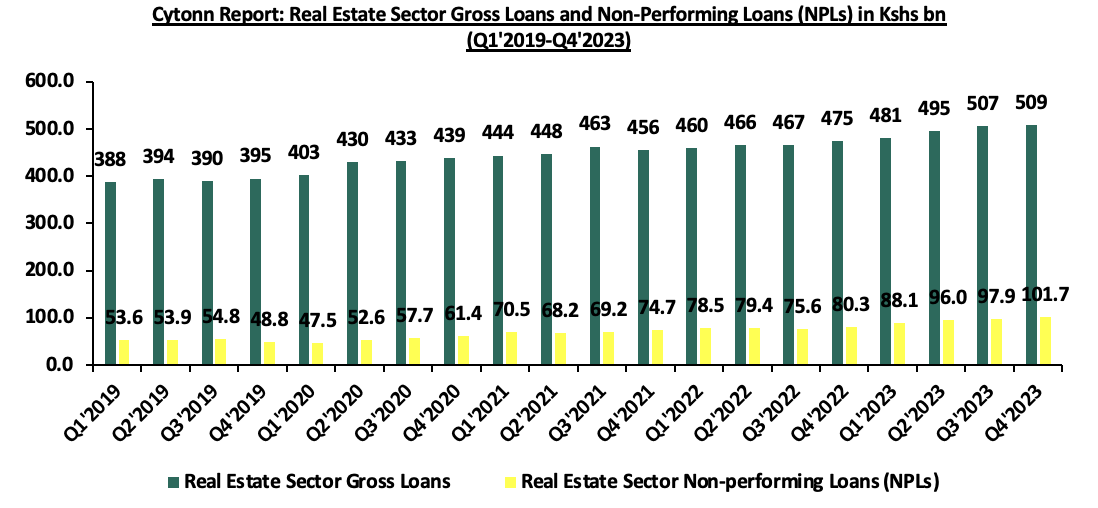
- The year-on-year (y/y) gross loans advanced to the Real Estate sector increased by 7.2% to Kshs 509.0 bn in Q4’2023, from Kshs 475.0 bn in Q4’2022. The advanced loans also represented a 0.4%-points quarter-on-quarter (q/q) increase from Kshs 507.0 bn realized in Q3’2023. The increase was primarily driven by heightened construction activities in select Real Estate sectors particularly in the residential sector, fueled by private players, individual homebuyer demand, and the government’s continuous drive to provide affordable housing to its citizens and address the housing deficit which is estimated to be at 80.0%,
- The gross Non-Performing Loans (NPLs) in the Real Estate sector realized a q/q increase of 3.9% to Kshs 101.7 bn in Q4’2023, from Kshs 97.9 bn in Q3’2023. On a y/y basis, gross NPLs advanced to the Real Estate sector increased by 26.7% to Kshs 101.7 mn from Kshs 80.3 mn recorded in Q4’2022. This was attributed to; i) delay in repayment on the back of tough macro-economic conditions, ii) increasing interest rates by lenders as a result of the increase of the Central Bank lending rates, iii) diminishing purchasing power by consumers hence leading to instances such as rent default directly affecting investors’ ability to pay loans, iii) delay in building plans approval which disrupts the cash flow projections, and, iv) increased cost of constructions hence developers reducing investors profit margin as well as cashflow issues. The graph below shows the Gross Loans advanced to the Real Estate sector against Non-Performing Loans in the sector from Q1’2019 to Q4’2023;
Source: Central Bank of Kenya (CBK)
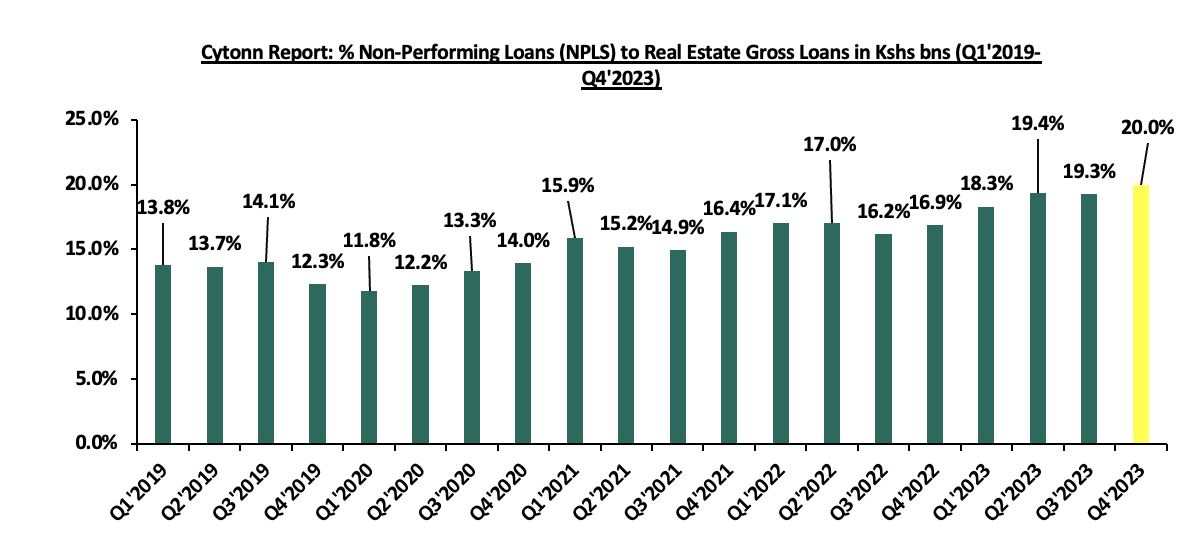
- From 2019 to 2023, there has been a notable increase in the percentage of Non-Performing Loans (NPLs) advanced to the real estate sector. In Q1’2019, it registered at 13.8%, while in Q4’2023, it escalated to 20.0%, indicating that developers are struggling to repay their loans. This trend can be attributed to several factors, including the unprecedented impact of the Covid-19 pandemic on the sector and the challenging macro-economic conditions, such as inflation and the depreciation of the Kenyan Shilling. These challenges have created significant financial strain on developers, making it increasingly difficult for them to meet their loan obligations. The graph below shows the percentage of Non-Performing Loans to Gross Loans advanced to the real estate sector sector from Q1’2019 to Q4’2023;
Source: Central Bank of Kenya (CBK)
- The gross loans advanced to the hospitality sector increased by 9.8% y/y to Kshs 123.0 bn in Q4’2023, from Kshs 112.0 bn in Q4’2022. On a q/q basis, the performance also represented a 0.8%-points increase from Kshs 122.0 bn recorded in Q3’2023. The increase was attributed to the increased need for operational capital in the sector driven by; i) increased operational expenses such as increased taxes, increased inflation, and the weakening of the Kenyan shilling, ii) increased need for capital infusion by hotels as they aim to recover from the Covid 19 Pandemic, iii) increment in the cost of mergers and acquisitions,
- Gross NPLs in the hospitality sector increased on a y/y basis by 41.5% to Kshs 17.4 bn in Q4’2023 from Kshs 12.3 bn in Q4’2022. On a q/q basis the NPLs increased by 48.7% to Kshs 17.4 bn in Q4’2023 from Kshs 11.7 bn in Q3’2023. The performance was primarily driven by the increased cost of operations on the back of increased inflationary pressures. The graph below shows Gross Loans advanced to the Hospitality sector against Non-Performing Loans in the sector from Q1’2019 to Q4’2023;
Source: Central Bank of Kenya (CBK)
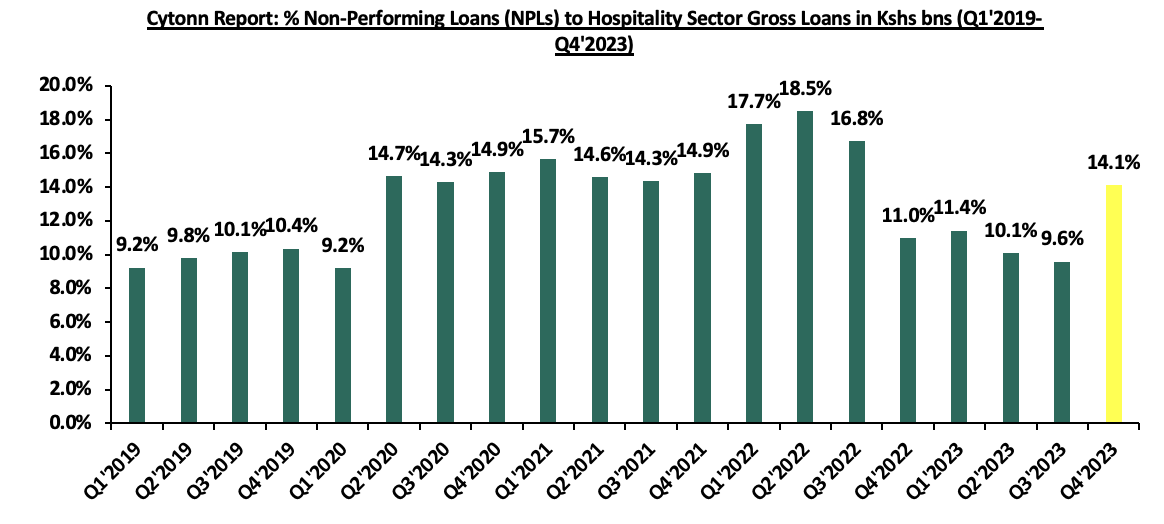
- It is evident that there has been a surge in Non-Performing Loans (NPLs) advanced in the hospitality sector. The NPLs reached 10.0% in Q3’2019 with the onset of the Covid-19 pandemic, and the numbers have been on the rise since then, with Q2’2022 registering an 18.5% figure owing to the effects of the pandemic, particularly travel restrictions. However, with the gradual reopening of economies following the mass administration of Covid-19 vaccines, the hospitality sector has been in recovery mode, as evidenced notably in FY’2023, when the NPLs dipped to below 15.0%. The graph below shows Gross Loans advanced to the Hospitality sector against Non-Performing Loans in the sector from Q1’2019 to Q4’2023;
Source: Central Bank of Kenya (CBK)
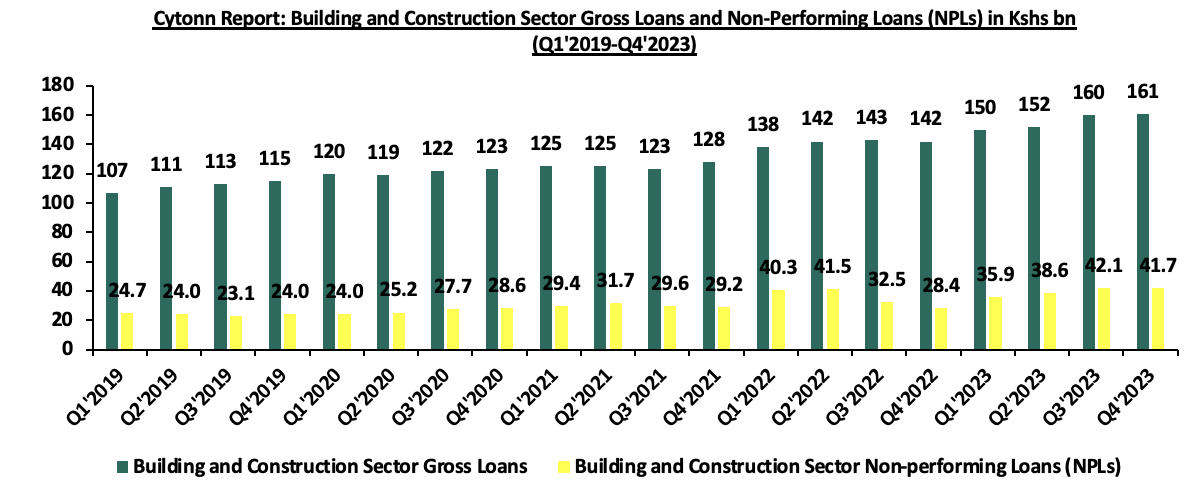
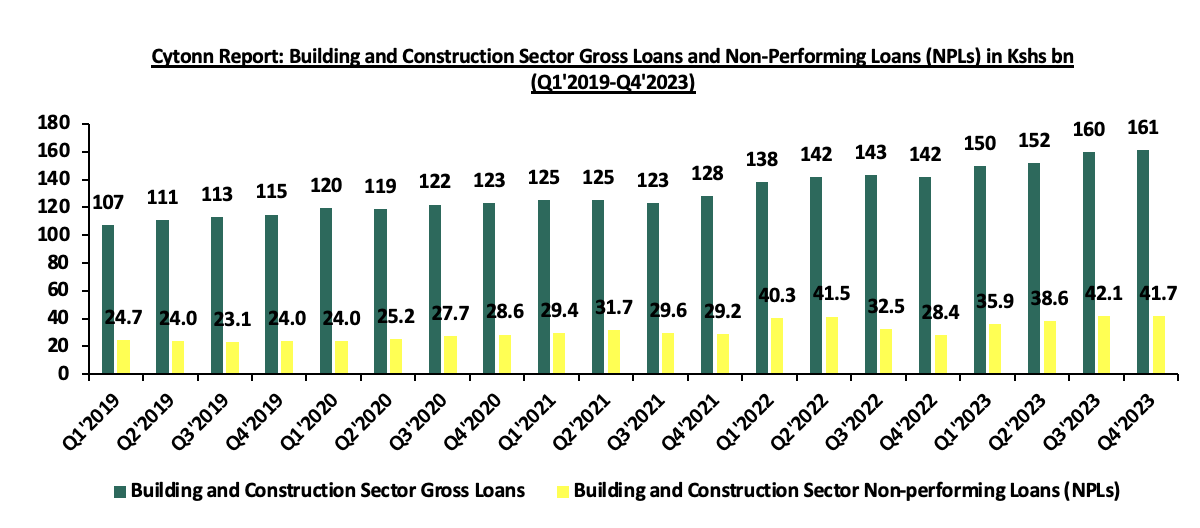
- Gross loans advanced to the building and construction sector registered a y/y growth of 13.4% to Kshs 161.0 bn in Q4’2023, from Kshs 150.0 bn in Q4’2022. This also represented a 0.6% q/q increase from Kshs 160.0 bn recorded in Q3’2023. The performances were mainly driven by continuous construction activities particularly in the housing and infrastructure sectors by both private and public sectors. Additionally, we can attribute this performance to the 27.0% uptick in the cost of construction, averaging at Kshs 9,365 in Q1’2023, from Kshs 5,210 in 2022, necessitating the need for more funding,
- Gross NPLs in the building and construction sector increased by 46.8% on a y/y to Kshs 41.7 bn in Q4’2023 from Kshs 28.4 bn in Q4’2022 at the back of operational challenges such as project delays in the Real Estate and hospitality sectors. These challenges were exacerbated by economic challenges, including increased taxation, inflationary pressure, and the weakening shilling, which have impacted the ability of businesses in the building and construction sector to service their loans. The graph below shows Gross Loans advanced to the Hospitality sector against Non-Performing Loans in the sector from Q1’2019 to Q4’2023;
Source: Central Bank of Kenya (CBK)
- The Non-Performing Loans (NPLs) to Gross Loans in the construction sector have remained high, largely attributable to the tough economic environment characterized by factors such as inflation, increased taxation, and the weakening of the Kenyan shilling. Furthermore, the sector has been adversely affected by a consistent increase in the cost of construction materials, exacerbated by a hostile geopolitical environment. This has led to a rise in shipping costs for some commodities in the sector, further straining the financial health of construction projects and contributing to the elevated NPL levels. The graph below shows Gross Loans advanced to the Building and Construction sector against Non-Performing Loans in the sector from Q1’2019 to Q4’2023;
https://cytonnreport.com/storage/research/6640940d760e97.70649283.png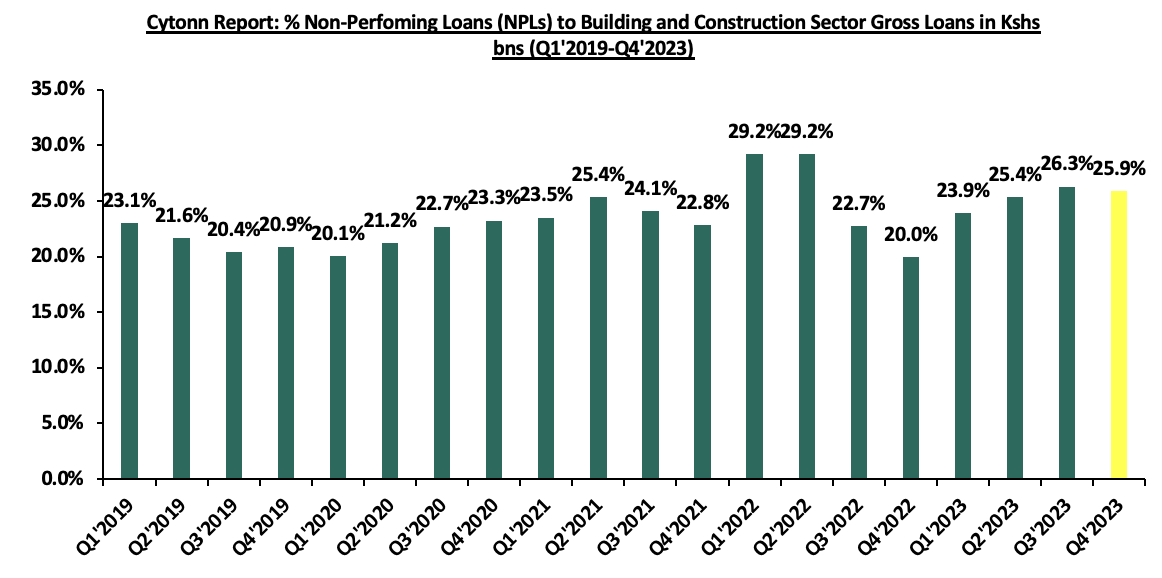
Source: Central Bank of Kenya (CBK)
- Infrastructure Sector
During the week, President Ruto presided over the launch of the second phase of the Kenya Urban Support Programme (KUSP) in collaboration with the World Bank, where Kenya received Kshs 46.5 bn towards strengthening the capacity of urban areas by improving settlement structures. The project will be implemented in 77 municipalities across 45 counties, excluding Nairobi and Mombasa. The project aligns with the government’s affordable housing agenda and aims to address prevailing challenges such as inadequate infrastructure, stormwater management, and sanitation. The five-year program, which runs from 2024 to 2028, envisages enhancing connectivity, overall accessibility, and safety and security in the beneficiary counties, benefiting approximately 7,100,000 people.
Upon implementation, the program will be vital in addressing challenges currently witnessed in the country, such as stormwater management, which has adverse effects. Additionally, the program will help improve Kenya’s urban infrastructure, create employment both directly and indirectly, enhance urban areas' capacity to generate revenue, improve livelihoods, and open up many urban areas for investment opportunities.
- Real Estate Investments Trusts (REITs)
In the Unquoted Securities Platform, Acorn D-REIT and I-REIT traded at Kshs 24.5 and Kshs 22.0 per unit, respectively, as of 9th May 2024. The performance represented a 22.5% and 10.0% gain for the D-REIT and I-REIT, respectively, from the Kshs 20.0 inception price. The volumes traded for the D-REIT and I-REIT came in at 12.3 mn and 30.7 mn shares, respectively, with a turnover of Kshs 257.5 mn and Kshs 633.8 mn, respectively, since inception in February 2021.
Additionally, Nairobi Securities Exchange Plc (NSE) admitted Linzi Sukuk to the NSE Unquoted Securities Platform (USP), marking it as the first Shariah-compliant product to be admitted on the platform. This brings the total number of securities on the USP to three. The Linzi Sukuk bond aimed to raise Kshs 3.0 bn, with bids coming in at 3.02 bn, allowing it to successfully meet its target. Issued by Linzi FinCo Trust, the bond has a maturity period of 15 years, offering an internal rate of return of 11.1%. The proceeds from the Sukuk will be channelled towards the development of 3,069 affordable institutional housing units in line with the government’s Affordable Housing Program, aiming to create 3,000 direct jobs. According to the Affordable Housing Act 2024, Part 8 outlines that the Affordable Housing Board may approve the participation of private players in the Affordable Housing program alongside the government.
Essentially, Sukuk differs from conventional bonds in that investors in Sukuk are given ownership of the assets underlying the debt instrument floated, and periodic returns are pegged on the performance of these assets. The issuance plays a vital role in providing capital for affordable housing, unlocking the potential for more Shariah-compliant products, and fostering growth in the country’s capital market.
REITs present various benefits such as tax advantages, diversified investment portfolios, and steady long-term returns. However, the ongoing decline in the performance of Kenyan REITs and the restructuring of their business portfolios pose obstacles to significant investments that were previously made. Other common challenges include: i) inadequate comprehension of the investment instrument among investors, ii) protracted approval processes for establishing REITs, and, iii) high minimum capital requirements of Kshs 100.0 mn for trustees.
We expect the sector performance to grow driven by several factors such as; i) the implementation of the Affordable Housing Program, ii) persistent demand for housing driven by positive demographics such as a rising population rate and increased urbanization rate, and, iii) ongoing infrastructure development by the government, increasing accessibility, especially in satellite towns. However, challenges such as escalating construction costs, limited investor knowledge in Real Estate Investment Trusts (REITs), and existing oversupply in certain real estate sectors will persist, constraining the sector's optimal performance by limiting developments and investments.
In 2023, we published the Nairobi Metropolitan Area Residential Report 2023 themed ‘Resilient Market with Steady Growth Potential’. This week, we update our previous research with the Nairobi Metropolitan Area (NMA) Residential Report 2024 titled ‘Untapped Investment Niches’ by highlighting the residential sector's performance in the region in terms of price appreciation, rental yields, and market uptake, based on the coverage of 35 regions within the Nairobi Metropolis. We shall also discuss factors influencing residential supply and demand, current developments affecting the industry, and conclude with a look at investment options as well as the sector's general outlook for the coming fiscal year. As such, we shall discuss the following;
- Overview of the Residential Sector,
- Recent Developments in the Sector,
- Residential Market Performance, and,
- Conclusion, Residential Market Outlook, and Investment Opportunity.
Disclaimer: The views expressed in this publication are those of the writers where particulars are not warranted. This publication, which is in compliance with Section 2 of the Capital Markets Authority Act Cap 485A, is meant for general information only and is not a warranty, representation, advice or solicitation of any nature. Readers are advised in all circumstances to seek the advice of a registered investment advisor


