Nairobi Metropolitan Area (NMA) Industrial Real Estate Report 2025, & Cytonn Weekly #42/2025
By Research Team, Oct 19, 2025
Executive Summary
Fixed Income
During the week, T-bills were oversubscribed for the second consecutive week, with the overall subscription rate coming in at 114.7%, higher than the subscription rate of 106.9% recorded the previous week. Investors’ preference for the shorter 91-day paper waned, with the paper receiving bids worth Kshs 3.6 bn against the offered Kshs 4.0 bn, translating to a subscription rate of 91.0%, albeit higher than the subscription rate of 90.0%, recorded the previous week. The subscription rates for the 182-day paper decreased to 25.5% from the 28.5% recorded the previous week, while that of the 364-day paper increased to 213.5% from the 192.0% recorded the previous week. The government accepted a total of Kshs 27.3 bn worth of bids out of Kshs 27.5 bn bids received, translating to an acceptance rate of 99.1%. The yields on the government papers were on a downward trajectory with the yields on the 91-day paper decreasing the most by 3.2 bps to 7.86% from the 7.89% recorded the previous week, while the 364-day and 182-day papers decreased by 2.6 bps and 2.1 bps to 9.36% and 7.91% respectively from 9.39% and 7.93% respectively recorded the previous week;
During the week, the Central Bank of Kenya released the auction results for the re-opened treasury bonds FXD1/2018/015 and FXD1/2021/020 with tenors to maturities of 7.7 years and 15.9 years respectively and fixed coupon rates of 12.7% and 13.4% respectively. The bonds were oversubscribed, with the overall subscription rate coming in at 237.8%, receiving bids worth Kshs 118.9 bn against the offered Kshs 50.0 bn. The government accepted bids worth Kshs 85.3 bn, translating to an acceptance rate of 71.7%. The weighted average yield for the accepted bids for the FXD1/2018/015 and FXD1/2021/020 came in at 12.7% and 13.5% respectively, compared to 14.3% and 14.0% recorded during the previous reopening of the FXD1/2018/015 and FXD1/2021/020 on 20th January 2025 and 22nd August 2022 respectively. With the Inflation rate at 4.6% as of September 2025, the real returns of the FXD1/2018/015 and FXD1/2021/020 are 8.1% and 8.9%. Given the 10.0% withholding tax on the bonds, the tax equivalent yields for shorter term bonds with 15.0% withholding tax are 13.4% and 14.0% for the FXD1/2018/015 and FXD1/2021/020 respectively;
During the week, The Energy and Petroleum Regulatory Authority (EPRA) released their monthly statement on the maximum retail fuel prices in Kenya, effective from 15th October 2025 to 14th November 2025. Notably, the maximum allowed prices for Super Petrol, Diesel and Kerosene remained unchanged from the previous pricing in September. Consequently, Super Petrol, Diesel and Kerosene will continue to retail at Kshs 184.5, Kshs 171.5 and Kshs 154.8 per litre respectively;
Equities
During the week, the equities market was on an upward trajectory, with NASI, NSE 25, NSE 20 and NSE 10 gaining by 2.2%, 2.1%, 1.4% and 0.6% respectively, taking the YTD performance to gains of 45.0%, 40.7%, 35.4% and 33.2% for NSE 20, NASI, NSE 25, and NSE 10 respectively. The equities market performance was mainly driven by gains recorded by large-cap stocks such as NCBA, Standard Chartered and Safaricom, of 20.7%, 3.7% and 3.1%, respectively. The performance was, however, weighed down by losses by large cap stocks such as EABL and Cooperative Bank of 2.1% and 0.3% respectively;
Additionally, in the regional equities market, the East African Exchanges 20 (EAE 20) share index gained by 1.8%, attributable to gains recorded by large cap stocks such as CRDB Bank, Bank of Baroda Uganda and Stanbic Uganda of 7.1%, 4.0% and 1.7% respectively. The performance was, however weighed down by losses by large cap stocks such as Cooperative Bank, Tanga Cement Company and Tanzania Cigarette Cooperation of 2.6%, 2.5% and 1.5% respectively;
Real Estate
During the week, Business Bay Square developer Abdiweli Hassan announced plans to invest Kshs 65.0 bn in a 60-acre mixed-use development at Tatu City. The project marks a strategic expansion by the Eastleigh-based investor into large-scale ventures beyond Nairobi’s central business district. The ambitious development will comprise residential units, office spaces, retail outlets, warehouses, and a mosque. Construction is expected to commence within the next year and will span approximately a decade under the Tatu City Special Economic Zone framework;
On the Unquoted Securities Platform, Acorn D-REIT and I-REIT traded at Kshs 27.4 and Kshs 23.2 per unit, respectively, as per the last updated data on 26th September 2025. The performance represented a 37.0% and 16.0% gain for the D-REIT and I-REIT, respectively, from the Kshs 20.0 inception price. Additionally, ILAM Fahari I-REIT traded at Kshs 11.0 per share as of 26th September 2025, representing a 45.0% loss from the Kshs 20.0 inception price;
Focus of the Week
Industrial Real Estate often receives less attention compared to dominant segments like residential, commercial office, and retail Real Estate. However, in recent years, the government has actively promoted industrial activities through initiatives such as the Special Economic Zones (SEZs) and Export Processing Zones (EPZs) under the Ministry of Investments Trade and Industry (MITI). Additionally, Kenya's growing population has led to an increasing demand for commodities, fueling a rise in industrial activity. While industrial Real Estate in Kenya is often associated with manufacturing facilities and warehouses, it also includes other classes like slaughterhouses and emerging classes such as data centers, which are reshaping the sector. Given these developments, we find it prudent to analyze the Industrial Real Estate sector, with a particular focus on the Nairobi Metropolitan Area (NMA).
Money Markets, T-Bills Primary Auction:
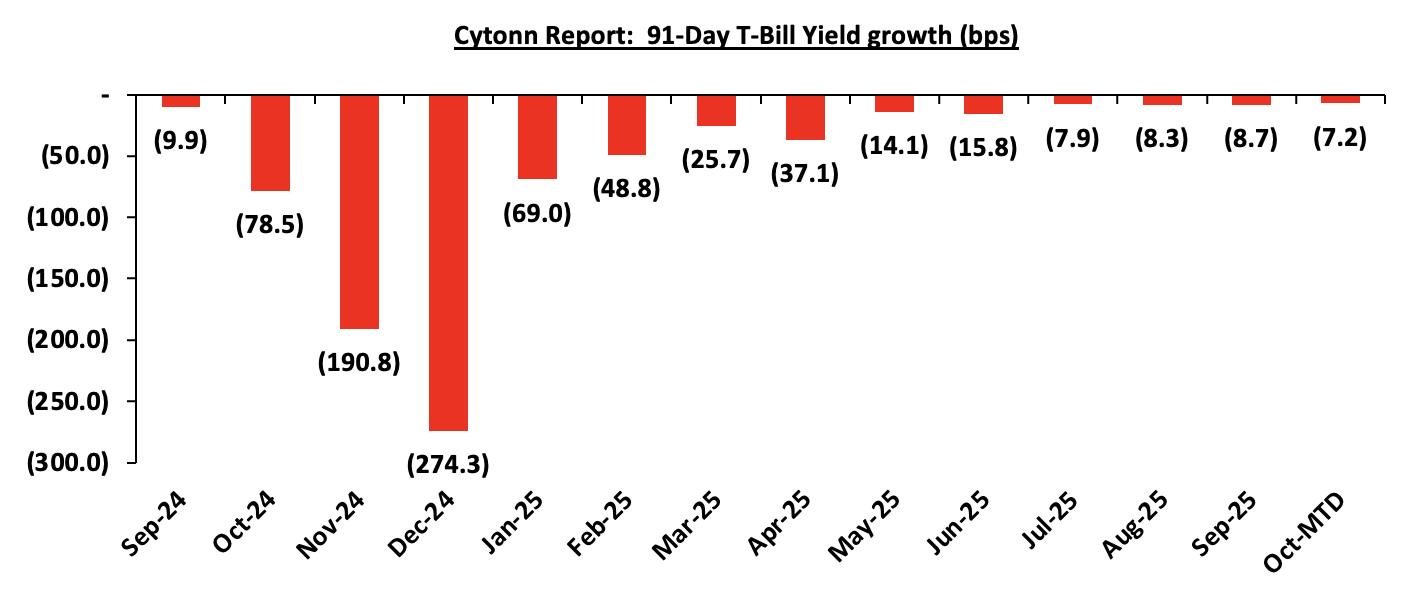
This week, T-bills were oversubscribed for the second consecutive week, with the overall subscription rate coming in at 114.7%, higher than the subscription rate of 106.9% recorded the previous week. Investors’ preference for the shorter 91-day paper waned, with the paper receiving bids worth Kshs 3.6 bn against the offered Kshs 4.0 bn, translating to a subscription rate of 91.0%, albeit higher than the subscription rate of 90.0%, recorded the previous week. The subscription rates for the 182-day paper decreased to 25.5% from the 28.5% recorded the previous week, while that of the 364-day paper increased to 213.5% from the 192.0% recorded the previous week. The government accepted a total of Kshs 27.3 bn worth of bids out of Kshs 27.5 bn bids received, translating to an acceptance rate of 99.1%. The yields on the government papers were on a downward trajectory with the yields on the 91-day paper decreasing the most by 3.2 bps to 7.86% from the 7.89% recorded the previous week, while the 364-day and 182-day papers decreased by 2.6 bps and 2.1 bps to 9.36% and 7.91% respectively from 9.39% and 7.93% respectively recorded the previous week.
The chart below shows the yield growth rate for the 91-day paper in the year to September 2025 and October month-to-date:
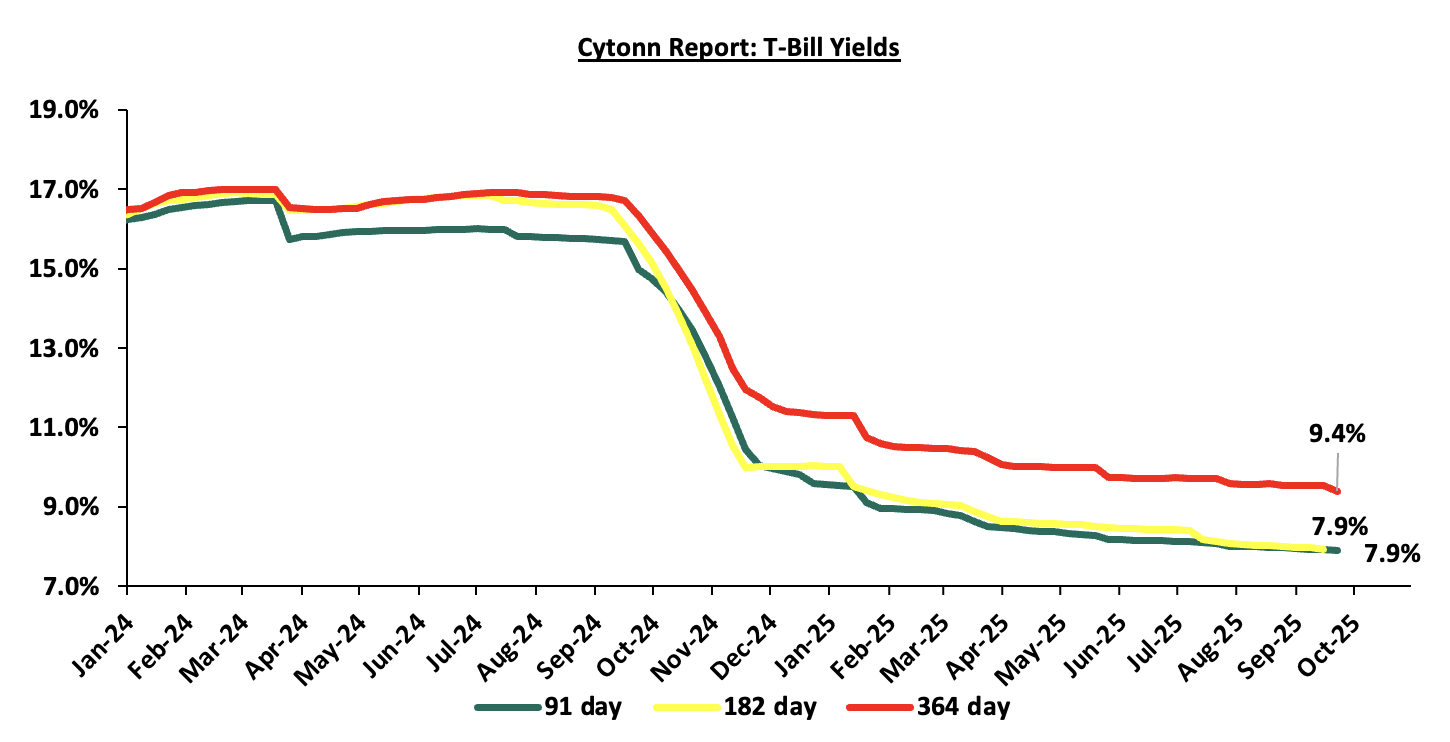
The charts below show the performance of the 91-day, 182-day and 364-day papers from January 2024 to October 2025:
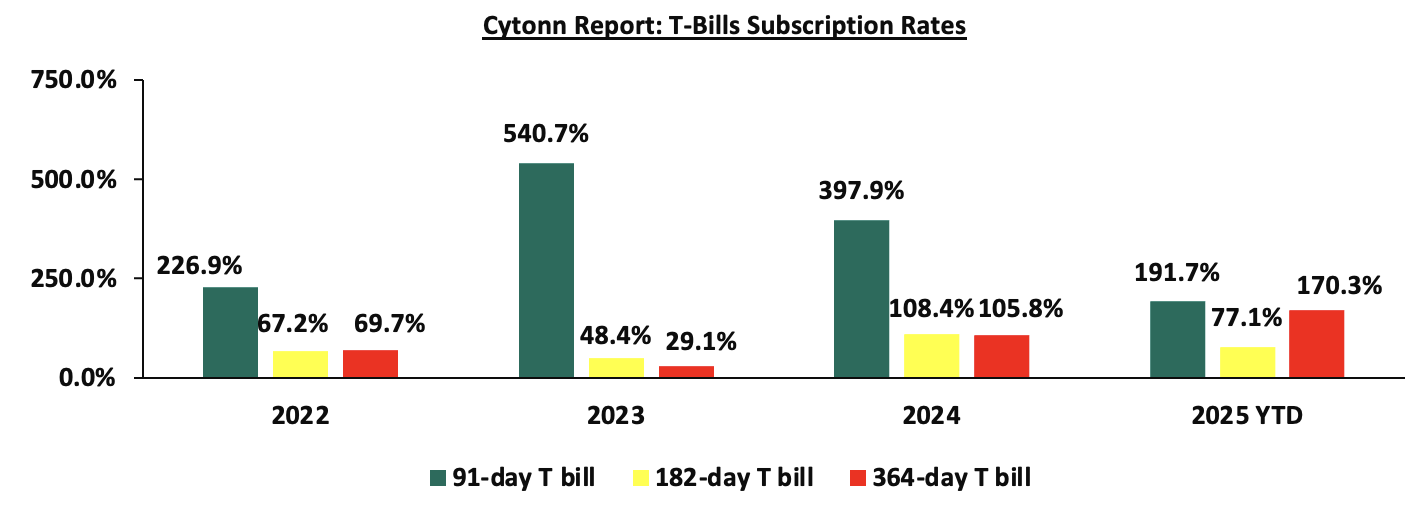
The chart below compares the overall average T-bill subscription rates obtained in 2022,2023, 2024 and 2025 Year-to-date (YTD):
The Central Bank of Kenya released the auction results for the re-opened treasury bonds FXD1/2018/015 and FXD1/2021/020 with tenors to maturities of 7.7 years and 15.9 years respectively and fixed coupon rates of 12.7% and 13.4% respectively. The bonds were oversubscribed, with the overall subscription rate coming in at 237.8%, receiving bids worth Kshs 118.9 bn against the offered Kshs 50.0 bn. The government accepted bids worth Kshs 85.3 bn, translating to an acceptance rate of 71.7%. The weighted average yield for the accepted bids for the FXD1/2018/015 and FXD1/2021/020 came in at 12.7% and 13.5% respectively, compared to 14.3% and 14.0% recorded during the previous reopening of the FXD1/2018/015 and FXD1/2021/020 on 20th January 2025 and 22nd August 2022 respectively. With the Inflation rate at 4.6% as of September 2025, the real returns of the FXD1/2018/015 and FXD1/2021/020 are 8.1% and 8.9%. Given the 10.0% withholding tax on the bonds, the tax equivalent yields for shorter term bonds with 15.0% withholding tax are 13.4% and 14.0% for the FXD1/2018/015 and FXD1/2021/020 respectively.
Money Market Performance:
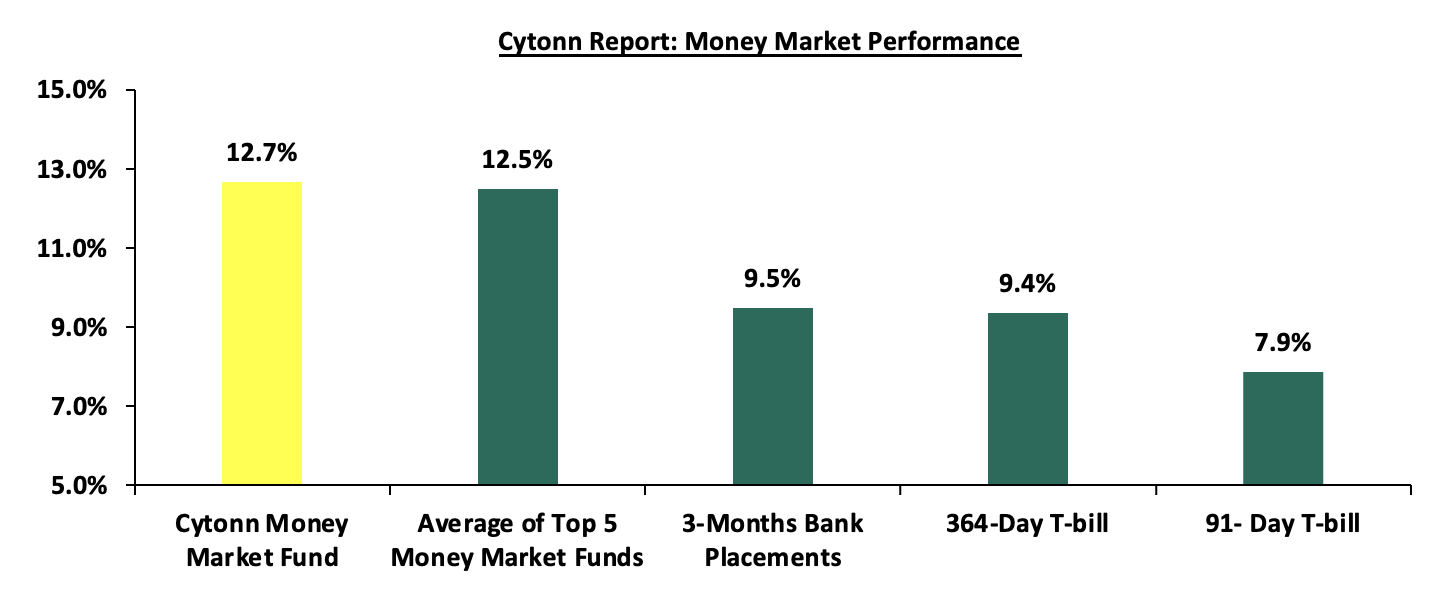
In the money markets, 3-month bank placements ended the week at 9.5% (based on what we have been offered by various banks). The yield on the 91-day and 364-day papers decreased by 3.2 bps and 2.6 bps to 7.86% and 9.36% from the 7.89% and 9.39% respectively recorded the previous week. The yield on the Cytonn Money Market Fund increased by 5.0 bps to 12.7%, from 12.6% recorded in the previous week, while the average yields on the Top 5 Money Market Funds increased by 5.2 bps to remain relatively unchanged from the 12.5% recorded the previous week.
The table below shows the Money Market Fund Yields for Kenyan Fund Managers as published on 17th October 2025:
|
Money Market Fund Yield for Fund Managers as published on 17th October 2025 |
||
|
Rank |
Fund Manager |
Effective Annual Rate |
|
1 |
Ndovu Money Market Fund |
13.1% |
|
2 |
Cytonn Money Market Fund (Dial *809# or download Cytonn App) |
12.7% |
|
3 |
Nabo Africa Money Market Fund |
12.5% |
|
4 |
Gulfcap Money Market Fund |
12.2% |
|
5 |
Etica Money Market Fund |
12.1% |
|
6 |
Lofty-Corban Money Market Fund |
11.8% |
|
7 |
Kuza Money Market fund |
11.1% |
|
8 |
Enwealth Money Market Fund |
11.1% |
|
9 |
Orient Kasha Money Market Fund |
10.9% |
|
10 |
Old Mutual Money Market Fund |
10.7% |
|
11 |
Jubilee Money Market Fund |
10.7% |
|
12 |
British-American Money Market Fund |
10.6% |
|
13 |
GenAfrica Money Market Fund |
10.6% |
|
14 |
Arvocap Money Market Fund |
10.5% |
|
15 |
Madison Money Market Fund |
10.3% |
|
16 |
Apollo Money Market Fund |
10.0% |
|
17 |
Dry Associates Money Market Fund |
9.9% |
|
18 |
Faulu Money Market Fund |
9.7% |
|
19 |
Sanlam Money Market Fund |
9.4% |
|
20 |
Mali Money Market Fund |
9.3% |
|
21 |
KCB Money Market Fund |
9.0% |
|
22 |
Co-op Money Market Fund |
8.8% |
|
23 |
CPF Money Market Fund |
8.7% |
|
24 |
ICEA Lion Money Market Fund |
8.7% |
|
25 |
CIC Money Market Fund |
8.5% |
|
26 |
Mayfair Money Market Fund |
8.4% |
|
27 |
Genghis Money Market Fund |
8.4% |
|
28 |
Absa Shilling Money Market Fund |
8.1% |
|
29 |
AA Kenya Shillings Fund |
7.3% |
|
30 |
Stanbic Money Market Fund |
6.4% |
|
31 |
Ziidi Money Market Fund |
6.3% |
|
32 |
Equity Money Market Fund |
5.0% |
Source: Business Daily
Liquidity:
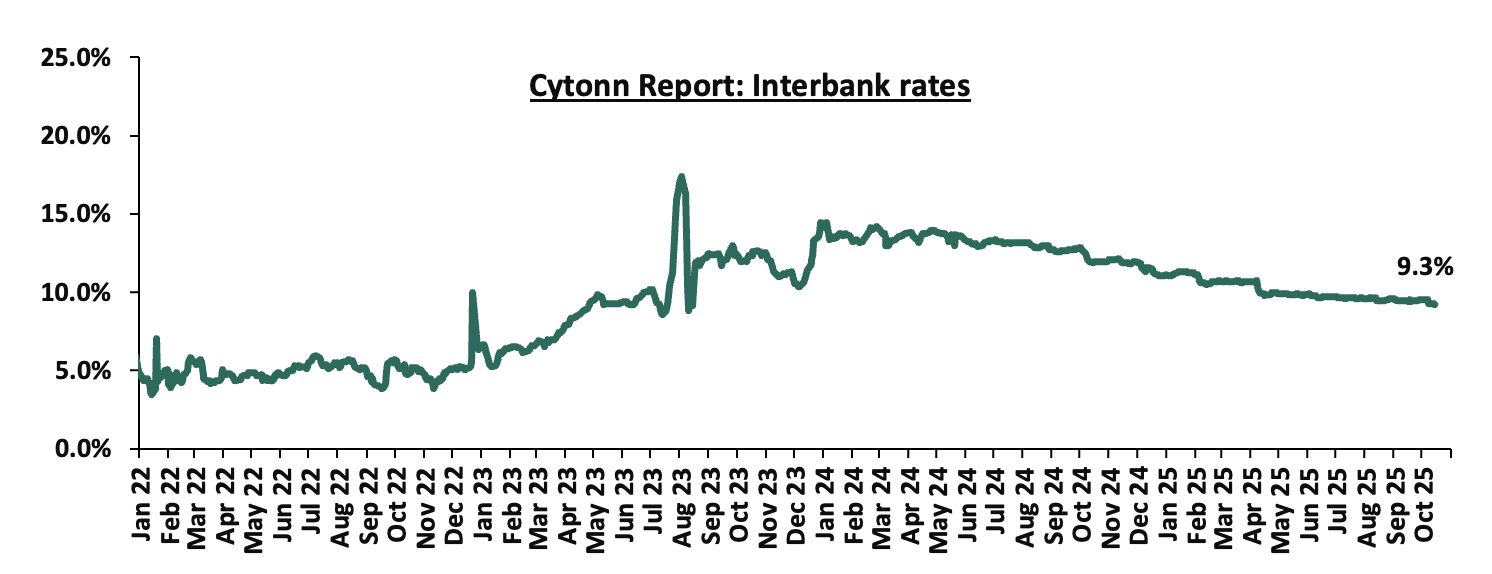
During the week, liquidity in the money markets marginally eased with the average interbank rate decreasing by 21.6 bps, to 9.3% from the 9.5% recorded the previous week, partly attributable to government payments that offset tax remittances. The average interbank volumes traded decreased significantly by 50.5% to Kshs 7.9 bn from Kshs 15.9 bn recorded the previous week. The chart below shows the interbank rates in the market over the years:
Kenya Eurobonds:
During the week, the yields on Kenya’s Eurobonds registered mixed performance with the yields on the 13-year Eurobond issued in 2021 increasing the most by 2.8 bps to remain relatively unchanged from the 8.6% recorded the previous week while the 30-year Eurobond issued in 2018 decreased the most by 4.4 bps to remain relatively unchanged from the 9.4% recorded the previous week. The table below shows the summary performance of the Kenyan Eurobonds as of 16th October 2025;
|
Cytonn Report: Kenya Eurobond Performance |
|||||||
|
|
2018 |
2019 |
2021 |
2024 |
2025 |
||
|
Tenor |
10-year issue |
30-year issue |
7-year issue |
12-year issue |
13-year issue |
7-year issue |
11-year issue |
|
Amount Issued (USD) |
1.0 bn |
1.0 bn |
0.9 bn |
1.2 bn |
1.0 bn |
1.5 bn |
1.5 bn |
|
Years to Maturity |
2.5 |
22.5 |
1.7 |
6.7 |
8.8 |
5.5 |
10.5 |
|
Yields at Issue |
7.3% |
8.3% |
7.0% |
7.9% |
6.2% |
10.4% |
9.9% |
|
2-Jan-25 |
9.1% |
10.3% |
8.5% |
10.1% |
10.1% |
10.1% |
|
|
1-Oct-25 |
5.8% |
9.3% |
- |
8.1% |
8.4% |
7.9% |
|
|
9-Oct-25 |
5.9% |
9.4% |
- |
8.3% |
8.6% |
8.1% |
|
|
10-Oct-25 |
5.9% |
9.6% |
- |
8.5% |
8.9% |
8.2% |
|
|
13-Oct-25 |
5.9% |
9.5% |
- |
8.5% |
8.8% |
8.2% |
|
|
14-Oct-25 |
6.0% |
9.6% |
- |
8.6% |
9.0% |
8.3% |
|
|
15-Oct-25 |
5.8% |
9.4% |
- |
8.3% |
8.7% |
8.0% |
10.0% |
|
16-Oct-25 |
5.9% |
9.4% |
- |
8.2% |
8.6% |
8.0% |
|
|
Weekly Change |
(0.0%) |
(0.0%) |
- |
(0.0%) |
0.0% |
(0.0%) |
- |
|
MTD Change |
0.0% |
0.1% |
- |
0.1% |
0.2% |
0.1% |
0.0% |
|
YTD Change |
(3.2%) |
(0.9%) |
- |
(1.8%) |
(1.5%) |
(2.1%) |
0.0% |
Source: Central Bank of Kenya (CBK) and National Treasury
Kenya Shilling:
During the week, the Kenya Shilling appreciated marginally by 0.3 bps to remain relatively unchanged from the Kshs 129.2 recorded previous week. On a year-to-date basis, the shilling has appreciated by 5.4 bps against the dollar, compared to the 17.6% appreciation recorded in 2024.
We expect the shilling to be supported by:
- Diaspora remittances standing at a cumulative USD 5,080.0 mn in the twelve months to August 2025, 7.6% higher than the USD 4,723.0 mn recorded over the same period in 2024. These has continued to cushion the shilling against further depreciation. In the August 2025 diaspora remittances figures, North America remained the largest source of remittances to Kenya accounting for 60.6% in the period,
- The tourism inflow receipts which are projected to reach KSh 560.0 bn in 2025 up from KSh 452.2 bn in 2024 a 23.9% increase, and owing to tourist arrivals that improved by 9.9% to 2,424,382 in the 12 months to June 2025 from 2,206,469 in the 12 months to June 2024, and
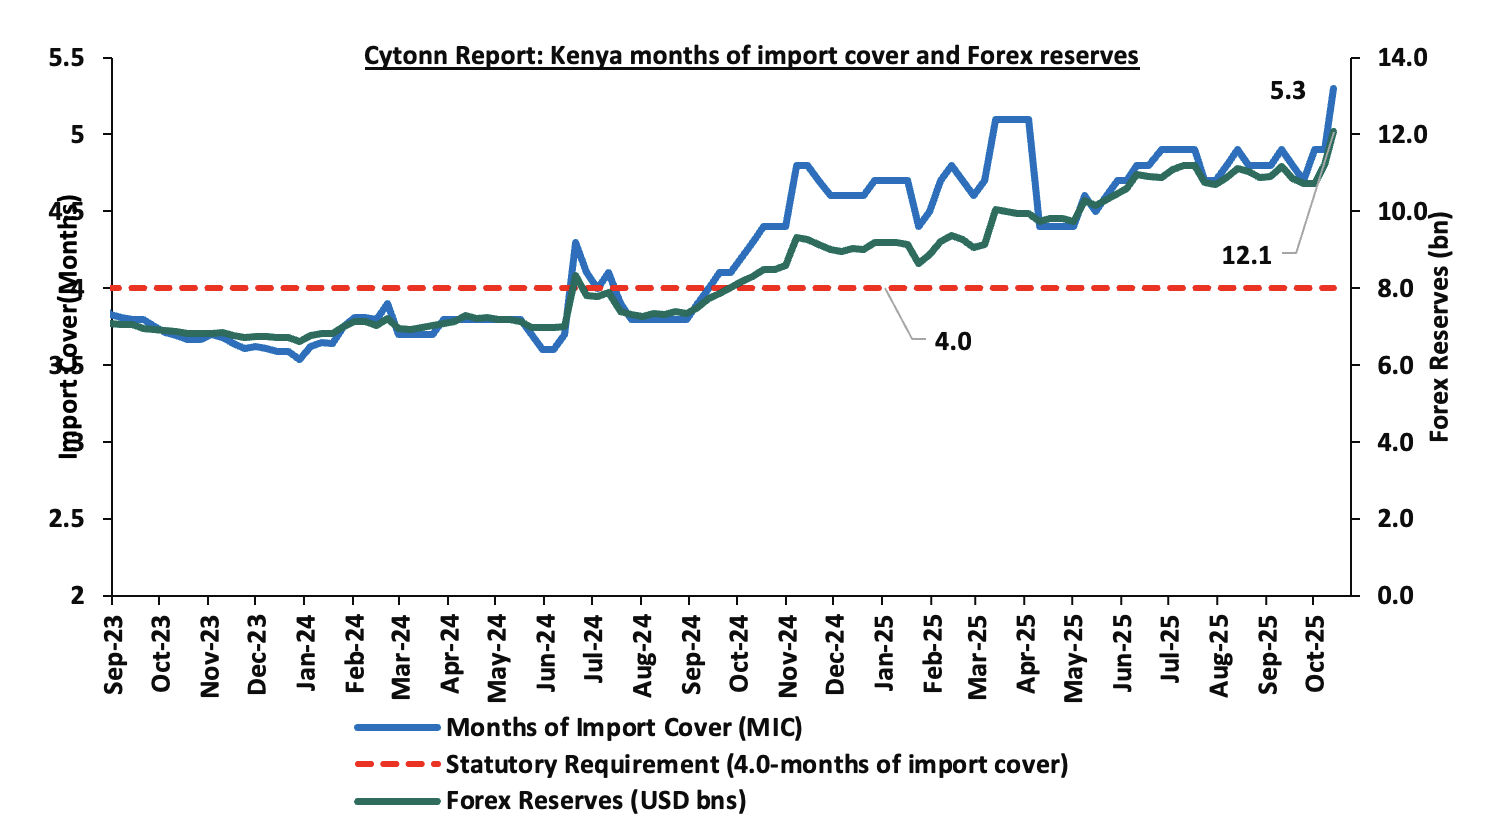
- Improved forex reserves currently at USD 12.1 bn (equivalent to 5.3-months of import cover), which is above the statutory requirement of maintaining at least 4.0-months of import cover and above the EAC region’s convergence criteria of 4.5 months of import cover.
The shilling is however expected to remain under pressure in 2025 as a result of:
- An ever-present current account deficit which came at 2.1% of GDP in the twelve months to August 2025, and,
- The need for government debt servicing, continues to put pressure on forex reserves given that 61.4% of Kenya’s external debt is US Dollar-denominated as of March 2025.
Key to note, Kenya’s forex reserves increased by 7.5% during the week, to USD 12.1 bn from the USD 11.2 bn recorded in the previous week, equivalent to 5.3 months of import cover, and above the statutory requirement of maintaining at least 4.0-months of import cover and above the EAC region’s convergence criteria of 4.5 months of import cover. The sharp rise in reserves was primarily due to large external inflows, specifically disbursements from multilateral lenders and bilateral partners, as well as Eurobond proceeds credited to the CBK during the week, which temporarily boosted the reserve position.
The chart below summarizes the evolution of Kenya's months of import cover over the years:
Weekly Highlights
- Fuel Prices effective 15th October 2025 to 14th November 2025
During the week, The Energy and Petroleum Regulatory Authority (EPRA) released their monthly statement on the maximum retail fuel prices in Kenya, effective from 15th October 2025 to 14th November 2025. Notably, the maximum allowed prices for Super Petrol, Diesel and Kerosene remained unchanged from the previous pricing cycle in September. Consequently, Super Petrol, Diesel and Kerosene will continue to retail at Kshs 184.5, Kshs 171.5 and Kshs 154.8 per litre respectively.
Other key take-outs from the performance include,
- The average landing cost per cubic metre of Super Petrol decreased slightly by 0.1% to USD 620.2 in September 2025 from USD 620.8 recorded in August 2025. However, the average landing cost of Kerosene and Diesel increased by 3.0% and 1.6% to USD 627.7 and USD 623.8 respectively from USD 609.6 and USD 614.1 respectively over the same period.
- The Kenyan Shilling appreciated against the US Dollar, by 7.7 bps to KShs 129.5 in September 2025 from the Kshs 129.6 recorded in August 2025.
We note that fuel prices in the country have stabilized in recent months largely due to the government's efforts to stabilize pump prices through the petroleum pump price stabilization mechanism which expended Kshs 13.7 bn in the FY’2024/25 to cushion the increases applied to the petroleum pump prices, coupled with the stabilization of the Kenyan Shilling against the dollar and other major currencies, as well as a decrease in international fuel prices. Additionally, the government’s increased spending through the price stabilization mechanism, subsidizing Kshs 0.07, Kshs 0.54 and Kshs 3.48 per litre for Petrol, Diesel and Kerosene respectively, compared to Kshs 1.38 for Kerosene in September saw a stabilization in fuel prices for the period under review. Going forward, we expect that fuel prices will stabilize in the coming months as a result of the government's efforts to mitigate the cost of petroleum through the pump price stabilization mechanism and a stable exchange rate. As such, we expect the business environment in the country to improve as fuel is a major input cost, as well as continued stability in inflationary pressures, with the inflation rate expected to remain within the CBK’s preferred target range of 2.5%-7.5% in the short to medium term.
Rates in the Fixed Income market have been on a downward trend due to high liquidity in the money market which allowed the government to front load most of its borrowing. The government is 154.5% ahead of its prorated net domestic borrowing target of Kshs 193.6 bn, having a net borrowing position of Kshs 492.6 bn (inclusive of T-bills). However, we expect stabilization of the yield curve in the short and medium term, with the government looking to increase its external borrowing to maintain the fiscal surplus, hence alleviating pressure in the domestic market. As such, we expect the yield curve to stabilize in the short to medium-term and hence investors are expected to shift towards the long-term papers to lock in the high returns
Market Performance:
During the week, the equities market was on an upward trajectory, with NASI, NSE 25, NSE 20 and NSE 10 gaining by 2.2%, 2.1%, 1.4% and 0.6% respectively, taking the YTD performance to gains of 45.0%, 40.7%, 35.4% and 33.2% for NSE 20, NASI, NSE 25, and NSE 10 respectively. The equities market performance was mainly driven by gains recorded by large-cap stocks such as NCBA, Standard Chartered and Safaricom, of 20.7%, 3.7% and 3.1%, respectively. The performance was, however, weighed down by losses by large cap stocks such as EABL and Cooperative Bank of 2.1% and 0.3% respectively.
Additionally, in the regional equities market, the East African Exchanges 20 (EAE 20) share index gained by 1.8%, attributable to gains recorded by large cap stocks such as CRDB Bank, Bank of Baroda Uganda and Stanbic Uganda of 7.1%, 4.0% and 1.7% respectively. The performance was, however weighed down by losses by large cap stocks such as Cooperative Bank, Tanga Cement Company and Tanzania Cigarette Cooperation of 2.6%, 2.5% and 1.5% respectively.
During the week, equities turnover declined by 15.4% to USD 11.4 mn from USD 13.4 mn recorded the previous week, taking the YTD turnover to USD 819.8 mn. Foreign investors remained net sellers for the second consecutive week, with a net selling position of USD 0.5 mn, from a net selling position of USD 0.7 mn recorded the previous week, taking the YTD net selling position to USD 55.6 mn.
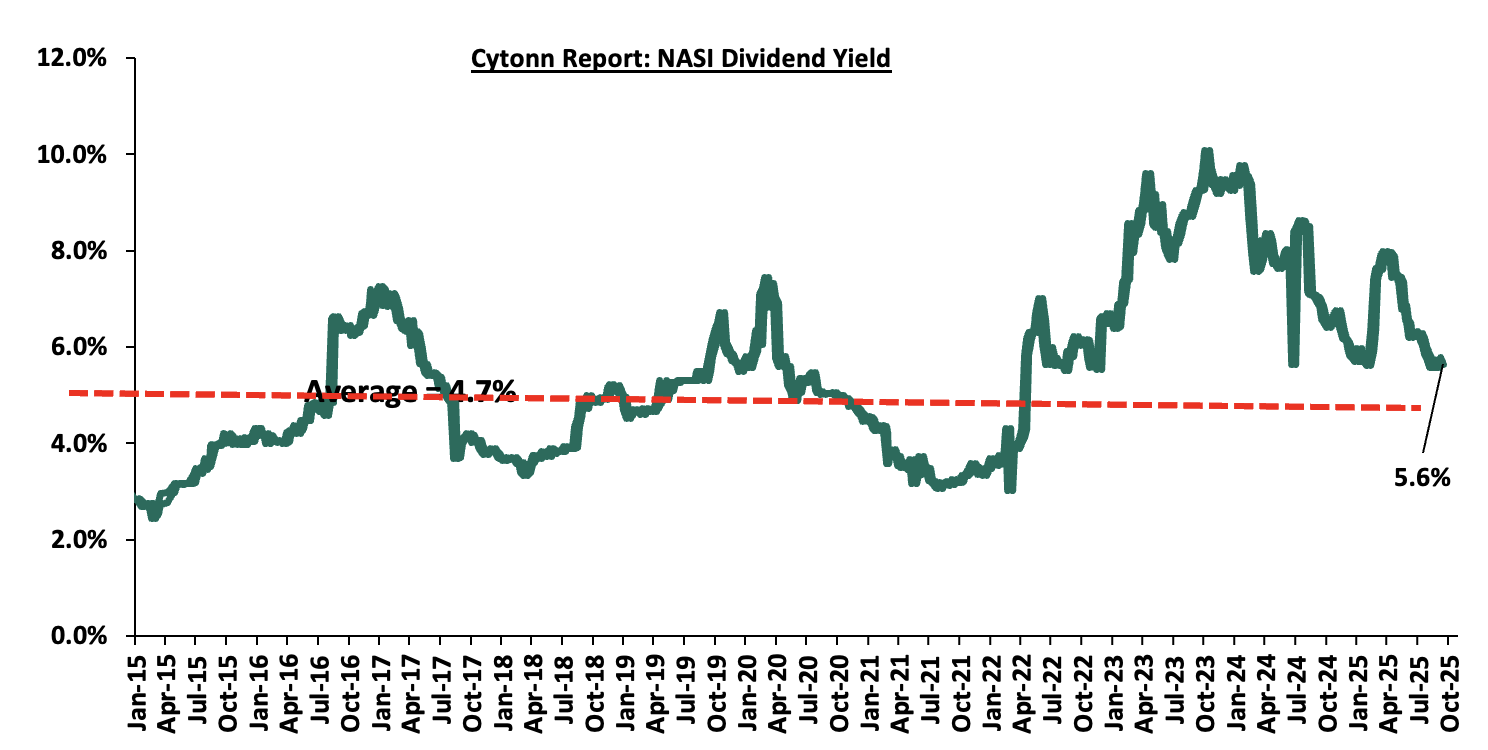
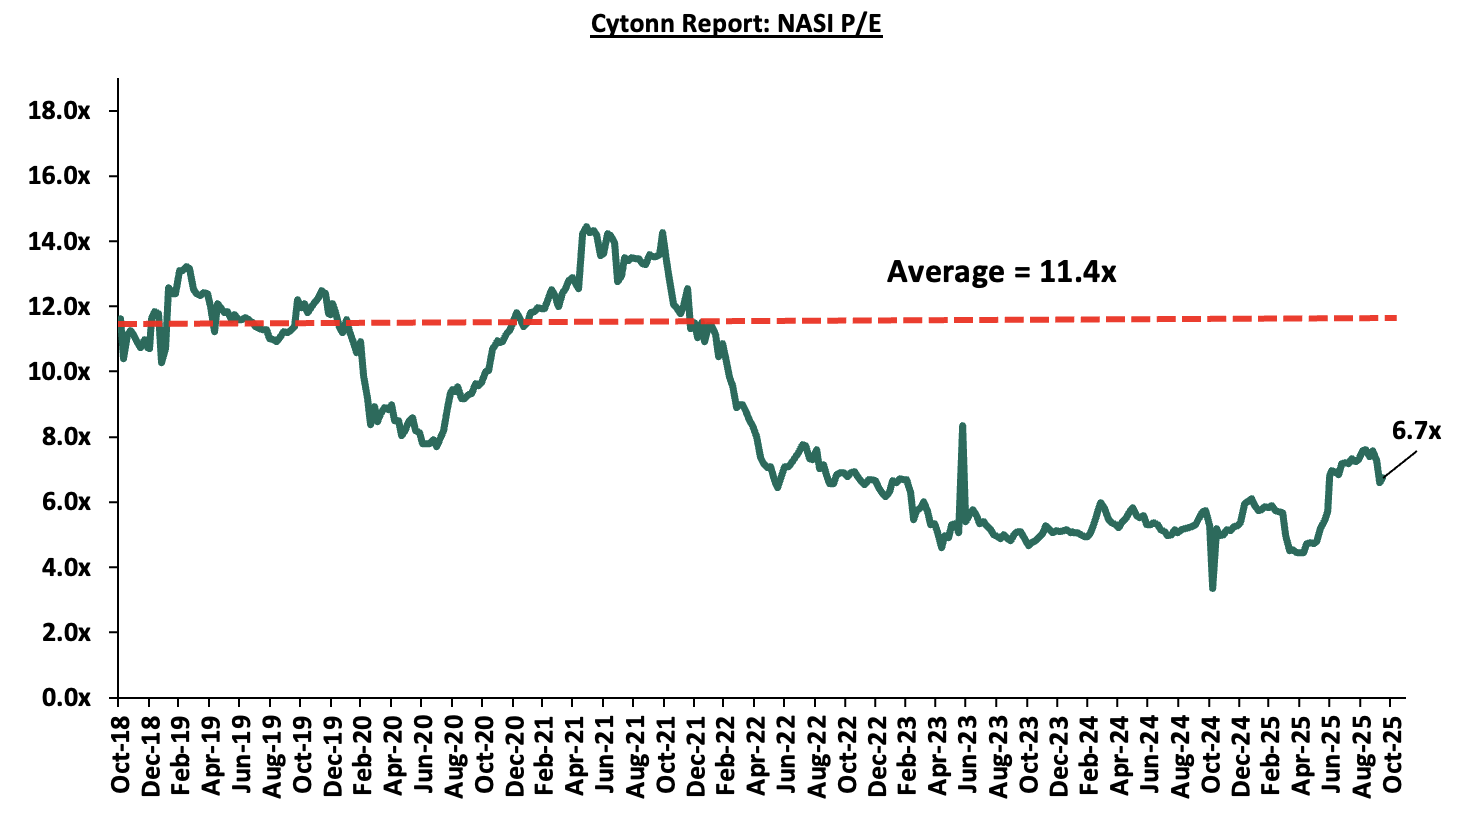
The market is currently trading at a price to earnings ratio (P/E) of 6.7x, 40.9% below the historical average of 11.4x, and a dividend yield of 5.6%, 0.9% points above the historical average of 4.7%. Key to note, NASI’s PEG ratio currently stands at 0.8x, an indication that the market is undervalued relative to its future growth. A PEG ratio greater than 1.0x indicates the market may be overvalued while a PEG ratio less than 1.0x indicates that the market is undervalued.
The charts below indicate the historical P/E and dividend yields of the market;
Universe of Coverage:
|
Cytonn Report: Equities Universe of Coverage |
||||||||||||
|
Company |
Price as at 09/10/2026 |
Price as at 16/10/2026 |
w/w change |
q/q change |
YTD Change |
Year Open 2025 |
Target Price* |
Dividend Yield |
Upside/ Downside** |
P/TBv Multiple |
Recommendation |
|
|
Diamond Trust Bank |
103.25 |
103.75 |
0.5% |
(0.7%) |
55.4% |
66.8 |
128.3 |
6.7% |
30.4% |
0.4x |
Buy |
|
|
Standard Chartered Bank |
280.50 |
290.75 |
3.7% |
2.4% |
1.9% |
285.3 |
314.1 |
15.5% |
23.5% |
1.7x |
Buy |
|
|
I&M Group |
42.90 |
42.10 |
(1.9%) |
(2.1%) |
16.9% |
36.0 |
48.2 |
7.1% |
21.6% |
0.7x |
Buy |
|
|
ABSA Bank |
21.90 |
22.00 |
0.5% |
2.3% |
16.7% |
18.9 |
24.1 |
8.0% |
17.4% |
1.4x |
Accumulate |
|
|
KCB Group |
57.00 |
57.00 |
0.0% |
0.4% |
34.4% |
42.4 |
63.6 |
5.3% |
16.8% |
0.7x |
Accumulate |
|
|
Co-op Bank |
20.00 |
19.95 |
(0.3%) |
(6.8%) |
14.3% |
17.5 |
21.1 |
7.5% |
13.5% |
0.7x |
Accumulate |
|
|
Britam |
8.50 |
8.56 |
0.7% |
(4.0%) |
47.1% |
5.8 |
9.5 |
0.0% |
11.2% |
0.8x |
Accumulate |
|
|
Equity Group |
56.50 |
59.25 |
4.9% |
2.2% |
23.4% |
48.0 |
61.2 |
7.2% |
10.4% |
1.0x |
Accumulate |
|
|
Stanbic Holdings |
198.50 |
199.00 |
0.3% |
8.0% |
42.4% |
139.8 |
194.8 |
10.4% |
8.3% |
1.2x |
Hold |
|
|
Jubilee Holdings |
320.00 |
321.50 |
0.5% |
2.3% |
84.0% |
174.8 |
312.9 |
4.2% |
1.5% |
0.5x |
Lighten |
|
|
NCBA |
69.00 |
83.25 |
20.7% |
20.7% |
63.2% |
51.0 |
79.0 |
6.6% |
1.5% |
1.3x |
Lighten |
|
|
CIC Group |
4.56 |
4.59 |
0.7% |
(5.4%) |
114.5% |
2.1 |
4.0 |
2.8% |
(9.4%) |
1.2x |
Sell |
|
|
*Target Price as per Cytonn Analyst estimates **Upside/ (Downside) is adjusted for Dividend Yield ***Dividend Yield is calculated using FY’2024 Dividends |
||||||||||||
We are “Bullish” on the Equities markets in the short term due to current cheap valuations, lower yields on short-term government papers and expected global and local economic recovery, and, “Neutral” in the long term due to persistent foreign investor outflows. With the market currently trading at a discount to its future growth (PEG Ratio at 0.8x), we believe that investors should reposition towards value stocks with strong earnings growth and that are trading at discounts to their intrinsic value. We expect the current high foreign investors sell-offs to continue weighing down the economic outlook in the short term.
- Mixed-use development Sector
Developer embarks on Kshs 65.0 Bn Mixed-Use project at Tatu City
During the week, Business Bay Square developer announced plans to invest Kshs 65.0 bn in a 60-acre mixed-use development at Tatu City. The project marks a strategic expansion by the Eastleigh-based investor into large-scale ventures beyond Nairobi’s central business district. The ambitious development will comprise residential units, office spaces, retail outlets, warehouses, and a mosque. Construction is expected to commence within the next year and will span approximately a decade under the Tatu City Special Economic Zone framework.
Special Economic Zones (SEZs) in Kenya are designated areas where business and trade laws differ from the rest of the country to attract investment, promote industrialization, and boost exports. These zones offer incentives such as tax exemptions, reduced customs duties, streamlined licensing procedures, and improved infrastructure to encourage both local and foreign investors to establish operations. Their impact on the economy includes creating employment opportunities, enhancing technology transfer, increasing export earnings, and stimulating regional development. By fostering a competitive business environment, SEZs contribute to Kenya’s broader goals of economic diversification and integration into global value chains.
By combining residential, commercial, and industrial components, the project reinforces the shift toward mixed-use real estate, which offers convenience and integrated living. Such developments cater to rising demand for live-work-play environments among Kenya’s urban middle class.
- Real Estate Investments Trusts (REITs)
On the Unquoted Securities Platform, Acorn D-REIT and I-REIT traded at Kshs 27.4 and Kshs 23.2 per unit, respectively, as per the last updated data on 26th September 2025. The performance represented a 37.0% and 16.0% gain for the D-REIT and I-REIT, respectively, from the Kshs 20.0 inception price. The volumes traded for the D-REIT and I-REIT came in at Kshs 12.8 mn and Kshs 40.6 mn shares, respectively, with a turnover of Kshs 323.5 mn and Kshs 791.5 mn, respectively, since inception in February 2021. Additionally, ILAM Fahari I-REIT traded at Kshs 11.0 per share as of 26th September 2025, representing a 45.0% loss from the Kshs 20.0 inception price. The volume traded to date came in at 1,235,285 shares for the I-REIT, with a turnover of Kshs 1.5 mn since inception in November 2015.
REITs offer various benefits, such as tax exemptions, diversified portfolios, and stable long-term profits. However, the ongoing decline in the performance of Kenyan REITs and the restructuring of their business portfolios are hindering significant previous investments. Additional general challenges include:
- Insufficient understanding of the investment instrument among investors leading to a slower uptake of REIT products,
- Lengthy approval processes for REIT creation,
- High minimum capital requirements of Kshs 100.0 mn for REIT trustees compared to Kshs 10.0 mn for pension funds Trustees, essentially limiting the licensed REIT Trustee to banks only
- The rigidity of choice between either a D-REIT or and I-REIT forces managers to form two REITs, rather than having one Hybrid REIT that can allocate between development and income earning properties
- Limiting the type of legal entity that can form a REIT to only a trust company, as opposed to allowing other entities such as partnerships, and companies,
- We need to give time before REITS are required to list – they would be allowed to stay private for a few years before the requirement to list given that not all companies may be comfortable with listing on day one, and,
- Minimum subscription amounts or offer parcels set at Kshs 0.1 mn for D-REITs and Kshs 5.0 mn for restricted I-REITs. The significant capital requirements still make REITs relatively inaccessible to smaller retail investors compared to other investment vehicles like unit trusts or government bonds, all of which continue to limit the performance of Kenyan REITs.
We expect Kenya’s Real Estate sector to remain resilient, supported by continued investor interest across key segments such as mixed use, as well as government initiatives like the Affordable Housing Program (AHP), and large-scale mixed-use projects such as the Kshs.65.0 bn investment into Tatu City. These developments are expected to spur demand for housing, industrial parks, logistics facilities, and complementary commercial and social infrastructure. However, challenges such as high capital requirements and regulatory hurdles for REITs, rising construction costs, infrastructure bottlenecks, and oversupply in select market segments will continue to weigh on the sector’s optimal performance by slowing project pipelines and deterring some investor participation.
Industrial Real Estate often receives less attention compared to dominant segments like residential, commercial office, and retail Real Estate. However, in recent years, the government has actively promoted industrial activities through initiatives such as the Special Economic Zones (SEZs) and Export Processing Zones (EPZs) under the Ministry of Investments Trade and Industry (MITI). Additionally, Kenya's growing population has led to an increasing demand for commodities, fueling a rise in industrial activity. While industrial Real Estate in Kenya is often associated with manufacturing facilities and warehouses, it also includes other classes like slaughterhouses and emerging classes such as data centers, which are reshaping the sector. Given these developments, we find it prudent to analyze the Industrial Real Estate sector, with a particular focus on the Nairobi Metropolitan Area (NMA);
In analyzing the Industrial Nairobi Metropolitan Area (NMA) we discuss the following;
- Overview of the Real Estate sector in Kenya,
- Overview of the Industrial sector in Kenya,
- Key trends, Developments and Challenges facing Industrial Real Estate Sector in NMA,
- Summary Performance of the NMA Industrial Sector in 2024,
- Recommendations
- Conclusion and Outlook for the NMA Industrial Real Estate sector.
Section I: Overview of the Real Estate Sector in Kenya
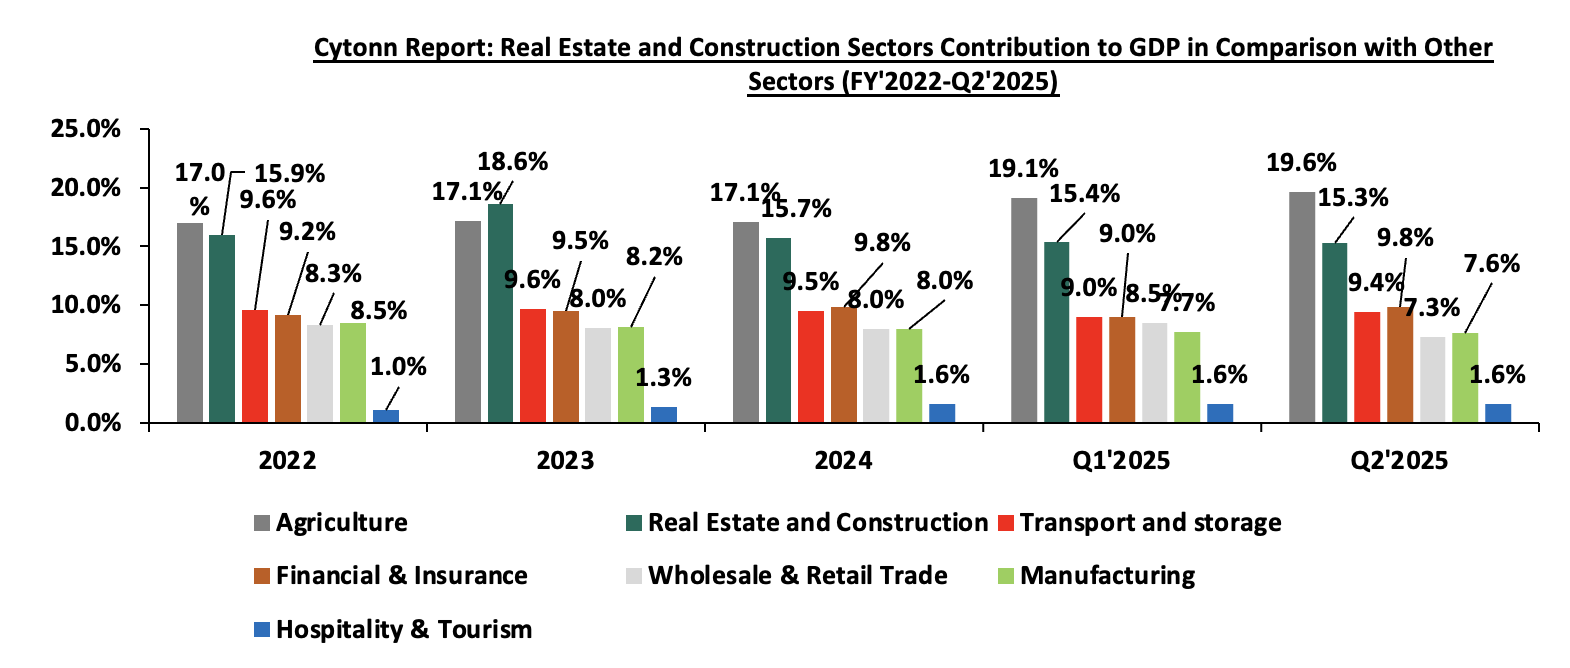
The Real Estate sector in Kenya has grown over the years to become one of the largest contributors to the country’s Gross Domestic Product (10.3% as at Q2’2025), supported by factors such as; i) positive demographics including higher urbanization and population growth rates of 3.7% p.a and 2.0% p.a, respectively, against the global average of 1.7% p.a and 1.0% p.a, respectively, as at 2024 ii) government’s sustained efforts to promote infrastructural development, opening up new areas for investments, iii) emphasis to provide affordable housing by the government through programs such as the Affordable Housing Program (AHP), iv) increased investment by both local and foreign investors, and, v) increased accessibility to low-interest loans provided by entities such as Kenya Mortgage Refinance Company (KMRC) among others.
Construction and Real Estate sectors jointly contributed to 15.3% to the country’s GDP in Q2’2025, subsequently being the second largest contributors after Agriculture which contributed 19.6%. The graph below shows the trend of the Real Estate and Construction sectors contribution to GDP between FY’2022 and Q2’2025;
Source: Kenya National Bureau of Statistics (KNBS)
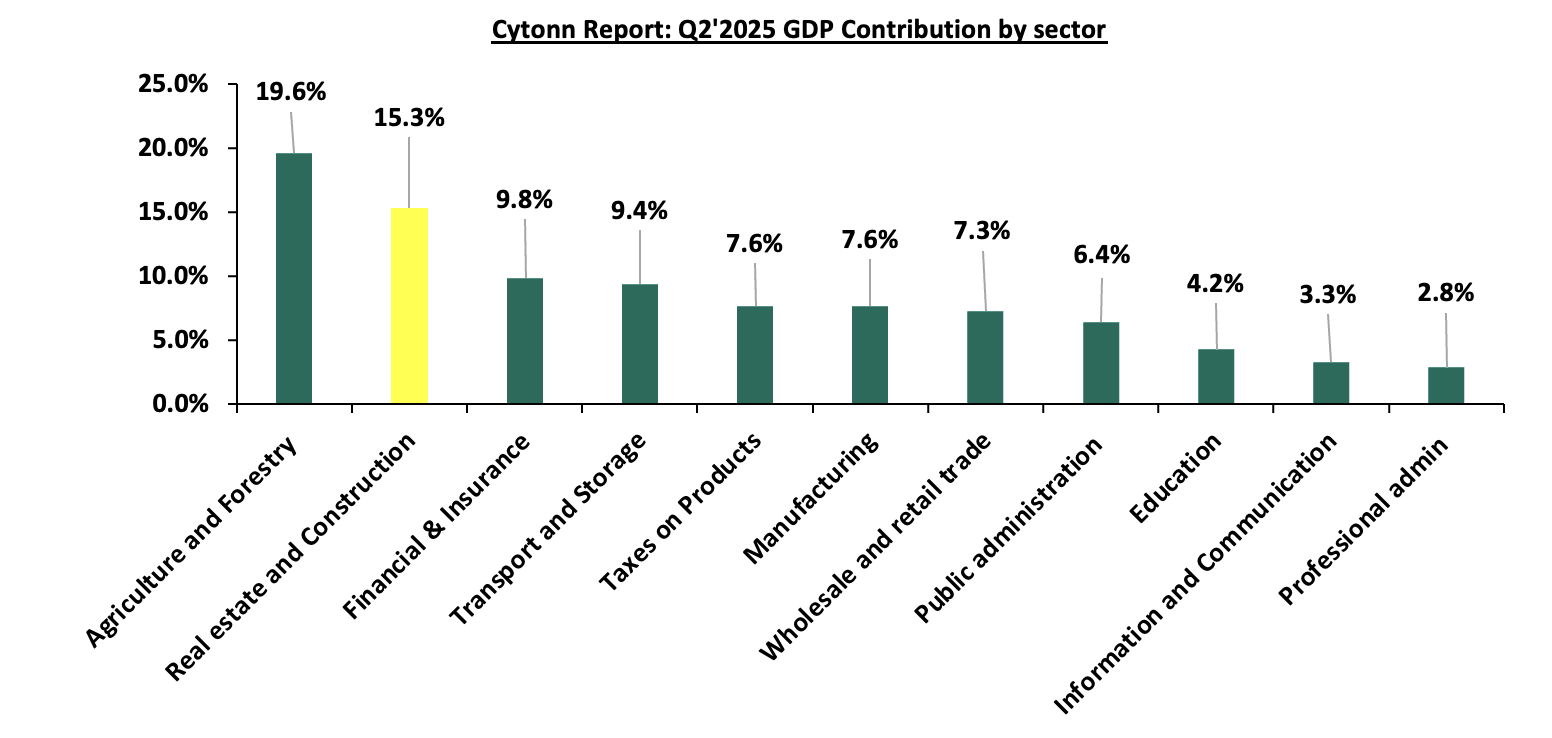
Below is a graph highlighting the top sectoral contributors to GDP in Q2’2025;
Source: Kenya National Bureau of Statistics (KNBS)
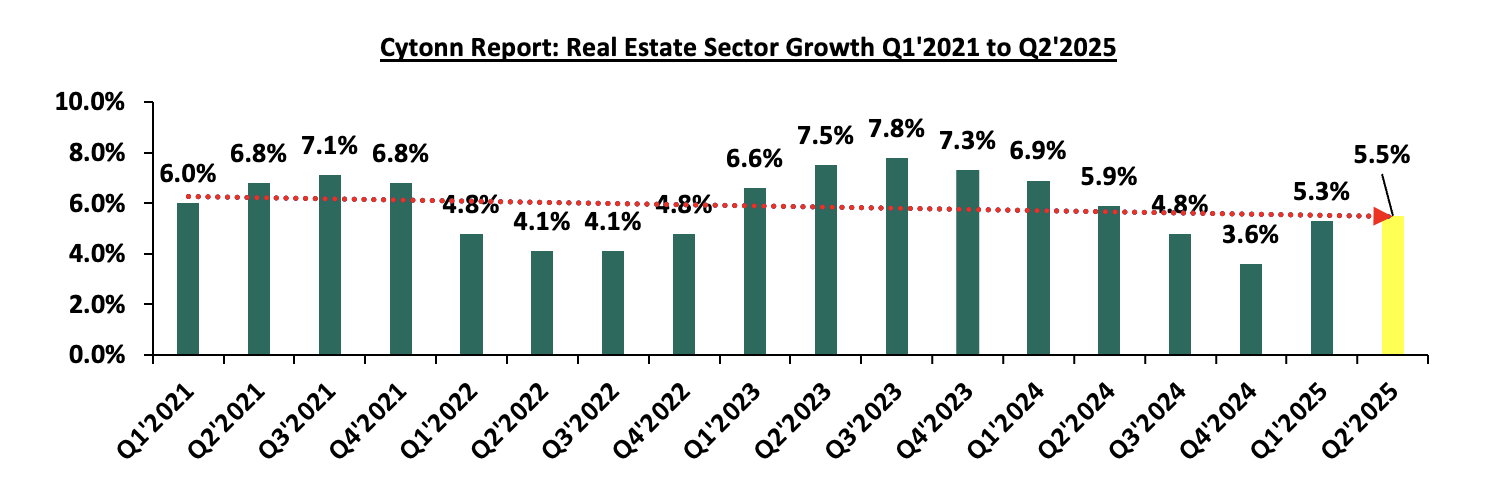
The Real Estate sector in 2025 posted steady growth of 5.5% in Q2’2025, which is 0.5% points slower than the 6.0% growth registered in Q2’2024. This growth can be attributed to the increasing need for housing in the country. However, the growth remained subdued compared to Q2’2024 due to the sustained increase in the cost of construction materials, which posed a hurdle to investors and reduced the number of activities in the sector during the period under review, as well as a diminishing purchasing power by consumers. Additionally, the value of approved building plans in the Nairobi Metropolitan Area (NMA), decreased y/y basis by 47.2% to Kshs 31.4 bn in Q2’2025, from Kshs 59.5 bn recorded in Q2’2024. The graph below shows the Real Estate Sector Growth Rate between Q1’2021 and Q2’2025;
Source: Kenya National Bureau of Statistics (KNBS)
Section II: Overview of the Industrial Sector in Kenya
The Nairobi Metropolitan Area has been on the front line and a major contributor to the Industrial Real Estate Sector accounting for approximately 90.0% of the country’s industrial space. It is known for its high concentration of industrial projects in areas like Nairobi, Kiambu, Machakos and Kajiado; with Nairobi County holding the largest share at 66.0%, largely due to its status as the capital city. Kiambu follows, housing key industrial investments such as Tatu City, Nairobi Gate Industrial Park (NGIP), Tilisi, and Northlands City. These areas have attracted major industrial projects like Africa Logistics Property (ALP) West in Tilisi and ALP North in Tatu City, bolstering Kiambu’s market share. The growth in the area has been driven by several factors such as the surge in e-commerce, demand for high-quality facilities, favorable demographics, enhanced infrastructure, government-led initiatives aligned with Vision 2030 and Nairobi’s role as East Africa’s business hub which has attracted foreign investments.
The Special Economic Zone (SEZ) sectors include free port zones, free trade zones, ICT parks, business service parks, Industrial parks, livestock and agricultural zones among others. Such zones are located at Konza Technopolis and Tatu City SEZ. These zones enjoy various benefits such as;
- Tax and Fiscal incentives- Businesses in SEZs often enjoy reduced corporate tax rates, exemptions from customs duties, VAT, and import/export levies. For example, Kenya provides tax holidays for firms operating in SEZs,
- Infrastructure development- SEZs provide modern infrastructure, including transport links, utilities, and telecommunications, which support industrial and commercial activities,
- Simplified regulations- SEZs streamline bureaucratic procedures with "one-stop-shop" services for licensing, permitting, and approvals, reducing administrative burdens on businesses,
- Increased Foreign Direct Investment (FDI)- SEZs attract FDI by providing a stable, predictable environment with business-friendly policies and guaranteed protection for investors,
- Export promotion- SEZs focus on export-driven industries, allowing businesses to operate competitively in global markets, often with preferential trade agreements, and,
- Economic diversification- SEZs enable countries to diversify away from traditional sectors by fostering new industries and technologies.
- Nairobi Metropolitan Area (NMA) Industrial Sub-Sectors
- Manufacturing
Manufacturing is a core sub-sector of industrial Real Estate, encompassing facilities like factories, assembly plants, and production hubs. These properties are purpose-built to house machinery, assembly lines, and other production infrastructure, making them critical to supply chains. Industrial parks and zones, such as Kenya's SEZs and EPZs, often integrate manufacturing with warehousing and logistics to optimize production and distribution. Key features of these facilities include high ceilings, reinforced floors, and advanced utilities tailored for large-scale operations. Manufacturing hubs not only drive demand for industrial Real Estate but also attract investment, support SMEs, and facilitate regional trade, making them integral to economic growth.
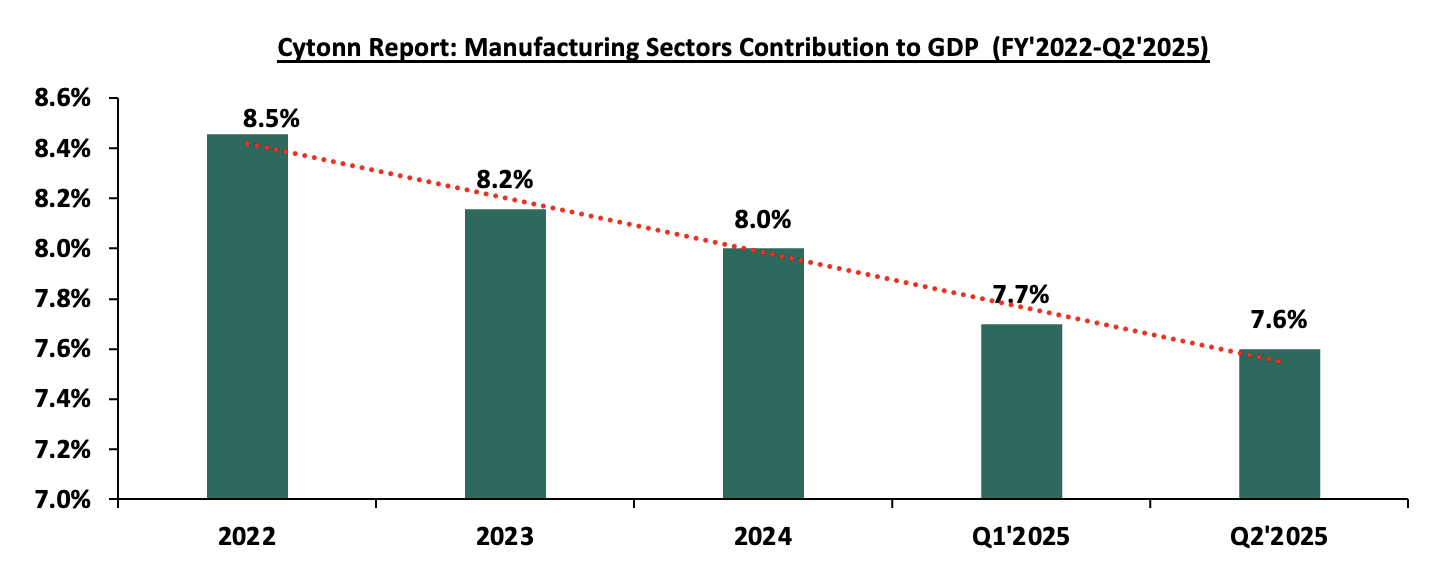
The manufacturing industry has seen gradual decline in performance, having the contribution to GDP decrease by 0.3% points to 7.6% in Q2’2025 from 7.9% recorded in Q2 2024. The manufacturing subsector accounted for about 7.6% of GDP in Q2’2025, falling short of the government’s target of 15.0%. The graph below shows the manufacturing sector contribution to GDP from FY’2022 to Q2’2025
Source: Kenya National Bureau of Statistics (KNBS)
The reduced performance in manufacturing can be attributed to i) high costs of production driven by harsh economic conditions, both locally; such as increased taxes and globally; due to supply chain disruption caused by geopolitical factors such as the Russia-Ukraine war and the Israel-Palestine war, ii) competition from imports, as some companies find it cost-effective to import goods rather than produce them locally, and, iii) decreasing purchasing power in the country hence a reduced demand of manufactured commodities. Despite the reduced growth, the industry is being promoted by the below activities;
- Textiles and Apparel- Benefiting from the African Growth and Opportunity Act (AGOA) with the U.S. and preferential market access within East Africa, textile exports have grown significantly. In 2024, export processing zones (EPZs) focusing on garment manufacturing, particularly for export to the U.S., have attracted major global brands. However, local challenges, like higher production costs compared to Asia, continue to limit the sector’s full potential. Kenya’s industrial sector is experiencing a dynamic transformation, propelled by strategic initiatives such as Special Economic Zones (SEZs) and Export Processing Zones (EPZs). These initiatives are crucial for attracting investment and fostering industrial growth. The government’s sanctioning of Tilisi Logistics Park as an EPZ in January 2024 marks a significant milestone. This move aligns with the broader strategy to enhance Kenya’s industrial capacity and export potential. Furthermore, the inauguration of a 100,000 SQM Textile Park within Nairobi Gate Industrial Park, designated as an SEZ, underscores the sector’s expansion.
- Agro-processing- With agriculture as Kenya's largest economic sector, agro-processing is an essential part of the industrial chain. Companies are focusing on value addition in tea, coffee, and horticultural products to increase their export value. For example, Kenyan tea companies have invested in new packaging facilities to export ready-to-drink tea products rather than raw tea, increasing value and market reach.
- Pharmaceuticals- Kenya aims to become East Africa's pharmaceutical manufacturing hub, especially in the wake of the COVID-19 pandemic, which highlighted the need for local drug production. Several local and foreign investors have shown interest in setting up manufacturing plants for essential drugs and vaccines, encouraged by government tax incentives.
- Data Centres
The growing need for rapid adoption of cloud services, fintech applications, and digital transformation among businesses has driven demand for data centers in the Nairobi Metropolitan Area providing a substantial boost to the growth of Industrial Real Estate growth. Companies like Safaricom, Microsoft, Amazon Web Services and the top tier lenders; are fueling the need for local data storage facilities to enhance speed and reduce latency. The sector has been supported by major investments such as Liquid Intelligent Technologies, which opened one of Africa’s largest data centers in Nairobi and Africa Data Centres (ADC). It continues to expand its footprint in Nairobi, capitalizing on the region's connectivity and demand. There is an increasing need to focus on hyperscale data centers to support multinational and regional clients. Additionally, the sector’s growth is supported by Nairobi’s advanced fiber-optic connectivity, supported by undersea cables (TEAMS and SEACOM), which position the city as a data hub. The availability of affordable electricity and cooling systems in cooler areas like Limuru also enhances viability. On the other hand, the growth in the sector is challenged by factors such as i) high initial capital requirements, iii) dependency on a reliable power grid; outages can easily disrupt operations, and iv) regulatory gaps in data security and management in Kenya.
- Ware Housing and Logistics/Ecommerce
The industrial Real Estate market in Nairobi has witnessed a notable increase in prime warehouse rental prices, driven by high demand from sectors such as e-commerce, fast-moving consumer goods (FMCG), and agribusiness. During the first half of 2025, rental rates for prime warehouses in Nairobi grew exponentially reaching Kshs 780 per SQM and achieving a rental yield of 9.5% on average, making Nairobi the third most expensive city in Africa for prime industrial rents after Kampala which recorded rental rate of Kshs 910.0 per SQM and a rental yield of 13.0% on average.
The sub-sector has been performing well due to factors such as i) surge in E-commerce supported by platforms like Jumia, Kilimall, Jambo Shop and Glovo who need warehouses to sell to their customers, ii) shift in modern warehousing from traditional go-downs due to the increased need in automation and climate-controlled environments and, iii) strategic location to areas with manager developments like Tatu City Industrial park and Infinity park in Athi River. The sector is however being undermined by factors such as i) limited availability of Grade-A warehousing, ii) poor road infrastructure in emerging warehousing zones.
- Slaughter Houses
Slaughterhouses are a vital component of industrial Real Estate in Nairobi Metropolitan Area (NMA), where the growing middle class has fueled a rising demand for meat consumption. These facilities play a critical role in meeting this demand by ensuring efficient processing, storage, and distribution of meat products. Major hubs like Kiamaiko, Bama, Neema and Nyonjoro serve as significant slaughter points, processing high volumes of livestock daily. . These facilities often cater to both local and export markets, especially for halal-certified meat, which adheres to strict religious guidelines. Several slaughterhouses operate with outdated infrastructure, leading to concerns over hygiene and public health. Regulatory bodies such as the National Environment Management Authority (NEMA) have raised concerns about effluent management and the environmental footprint of these facilities. Which highlights a gap for high quality slaughter houses in the area.
The sub-sector growth is undermined by; i) lack of proper systems to handle waste, leading to pollution of nearby rivers and water bodies, ii) densely populated areas like Kiamaiko that face logistical challenges due to limited space, poor road networks, and the proximity of slaughterhouses to residential zones, iii) regulatory crackdowns and temporary closures can destabilize the livelihoods of workers and trader’s dependent on these facilities. Striking a balance between enforcement and economic stability remains a challenge.
- Special Economic Zones (SEZs) and Export Processing Zones (EPZs)
Another important sub-sector of industrial Real Estate in Nairobi Metropolitan Area (NMA) is the Special Economic Zones (SEZs) and Export Processing Zones (EPZs). Both are investment promotion programs that aim to build export-led economic development through industrialization. They offer incentives to investors, such as corporate tax holidays, import and stamp duty exemptions, and VAT exemptions. However, they differ in their objectives, investment requirements, and approach. Also known as free zones, EPZs focus on manufacturing for export. This model has been widely used in developing countries for almost four decades. They usually combine residential and multiuse commercial and industrial activity.
The performance of this sector is promoted by factors such as; i) SEZs like Tatu City and Konza Technopolis, are attracting both local and international investors due to tax incentives and infrastructure readiness, ii) EPZ in Athi River remains one of the largest hubs, hosting over 100 companies focused on textiles, food processing, and assembly. These zones are primarily export-oriented, leveraging preferential trade agreements like AGOA (African Growth and Opportunity Act), iii) diversification in operations; beyond textiles, new EPZ entrants focus on pharmaceuticals, electronics, and processed foods. On the other hand, challenges like i) Over-dependence on AGOA, which faces periodic renewal risks, ii) high costs of compliance with export standards, especially for smaller firms, and iii) limited capacity to handle large-scale manufacturing due to infrastructure gaps.
Section III: Key trends, Developments and Challenges facing Industrial Real Estate Sector in NMA
- Key Trends in 2025
The industrial Real Estate sector in Kenya in 2025 has been defined by several trending factors including;
- The demand for quality internet services in Kenya is driven by the country's population which is estimated at 53 mn as of mid-2025. This demand is further driven by the growing adoption of remote working, which gained popularity during the COVID-19 pandemic, and the rise of e-learning. These factors have compelled Internet Service Providers to enhance their services, leading to increased demand for data centers and, consequently, growth in industrial Real Estate,
- Rising demand for warehousing and logistics facilities- The rise of e-commerce, driven by platforms like Jumia and global players like Amazon, has significantly increased demand for modern logistics and warehousing spaces. Businesses are focusing on proximity to key transport corridors, such as the Nairobi-Mombasa Road and the Nairobi Expressway, to facilitate efficient distribution,
- Large-scale industrial park developments, like Tatu Industrial Park and Infinity Industrial Park, are setting a benchmark for planned industrial zones offering modern infrastructure. There is increased interest from multinational companies looking for regional hubs, particularly due to Nairobi's strategic location in East Africa.
- Adoption of green building practices- Developers are incorporating sustainable construction practices, including energy-efficient designs and solar energy systems, to align with global ESG (Environmental, Social, Governance) goals, as well as reducing over reliance on hydroelectricity, and,
- Government incentives and policy support- Initiatives like the Special Economic Zones (SEZs) and Export Processing Zones (EPZs) offer tax incentives to attract investors into industrial real estate. Public-private partnerships are being promoted to fast-track industrial infrastructure development.
-
-
- Challenges Facing the Industrial Sector
-
- High land acquisition and construction costs to establish the Industrial Real Estate infrastructures such as warehouses. Prime land within the Nairobi metropolitan area is becoming increasingly expensive, driving developers to seek peripheral areas like Machakos and Kiambu counties. Inflation and fluctuating material costs have impacted project and products affordability,
- Inadequate infrastructure in peripheral areas remains a challenge in the sector. While central locations are well-connected, newer industrial zones face challenges such as poor road networks, unreliable power supply, and limited water access,
- Regulatory and bureaucratic hurdles such as lengthy approval processes and inconsistencies in land tenure systems discourage investment and zoning regulations sometimes conflicting with market needs, limiting flexibility in land use. Industrial firms face lengthy approval processes, particularly in sectors like pharmaceuticals and food production, where stringent standards apply. While government agencies like the Kenya Bureau of Standards (KEBS) maintain quality, the process can be slow and costly. For example, obtaining certifications for export products can take months, delaying market entry, and,
- Over-reliance on foreign investment where a significant portion of funding for industrial projects comes from foreign investors, leaving the sector vulnerable to global economic shifts.
- There is uncertainty over the renewal of the African Growth and Opportunity Act (AGOA) which expired on 30 Sept 2025. The program’s expiration has put many jobs and businesses at risk, as African exports will be subject to standard U.S. tariffs if it is not renewed.
- Recent Developments
Below are some of the highlights witnessed throughout the year;
- President William Ruto presided over the groundbreaking of Centum Investment Company’s Vipingo Special Economic Zone (SEZ) in Kilifi County, shortly after KCB Bank Kenya and the African Export-Import Bank (Afreximbank) signed a Kshs 103.0 bn financing agreement to support its development. The 2,000-acre project is envisioned as one of the most competitive manufacturing hubs in the region, offering plug-and-play infrastructure, reliable utilities and fiscal incentives designed to attract global and local manufacturers. Cytonn Weekly #37/2025.
Section IV: Summary Performance of the NMA Industrial Sector in 2025:
- Performance of Industrial Spaces in Kenya by regions
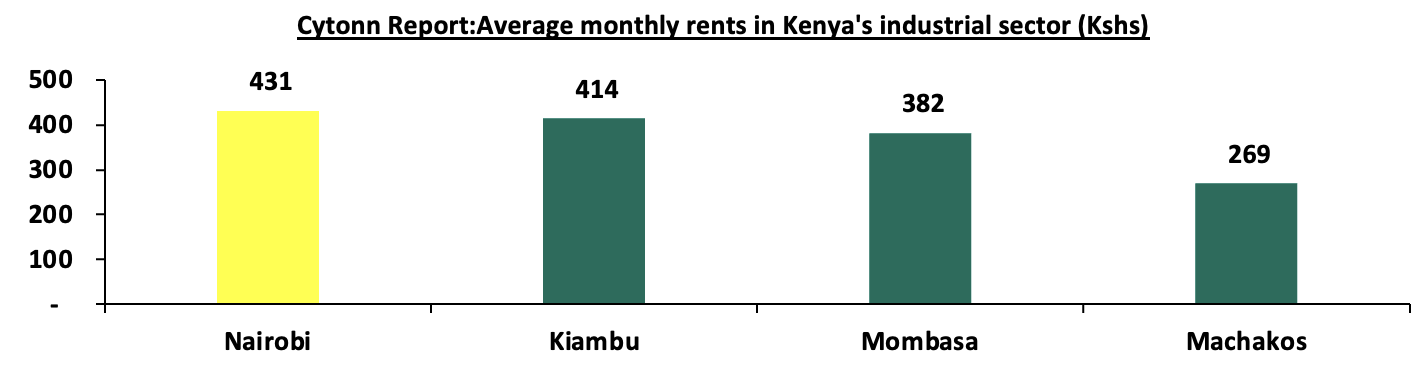
Average rental prices for Industrial spaces in the Nairobi Metropolitan Area (NMA) increased by 0.2% to Kshs 431 per SQM in 2025 from Kshs 430 per SQM recorded in 2024 whereas the average selling prices increased by 1.0% to Kshs 75,800 per SQM in 2025 from Ksh 75,000 per SQM recorded in 2024. This performance is attributable to factors such as:
- Good infrastructure such as the SGR and road networks such as bypasses, major highways and airports
- Stable political environment
- Strategic location and market access, that is, proximity to major markets as it serves as a gateway to East African markets, with strong connections to other urban centers in the region through the East African Community (EAC) and African Continental Free Trade Area (AfCFTA)
- The Nairobi region benefits from relatively reliable power and water supply compared to remote areas, despite nationwide challenges with energy costs,
- As a hub for education and innovation, Nairobi has a concentration of universities, technical institutions, and vocational training centers,
- Industries benefit from access to a pool of skilled professionals in fields such as manufacturing, technology, and engineering
- The region hosts some of Kenya’s largest Special Economic Zones (SEZs) and Export Processing Zones (EPZs), including those in Athi River and the upcoming Konza Technopolis. These zones offer tax incentives, reduced import/export tariffs, and infrastructure tailored to industrial activities. The graph below shows average monthly rental prices within the Kenyan Industrial Real Estate Sector in 2025;
Source: Cytonn Research
The graph below shows average sale prices per Sqm within the Kenyan Industrial Real Estate Sector in 2025;
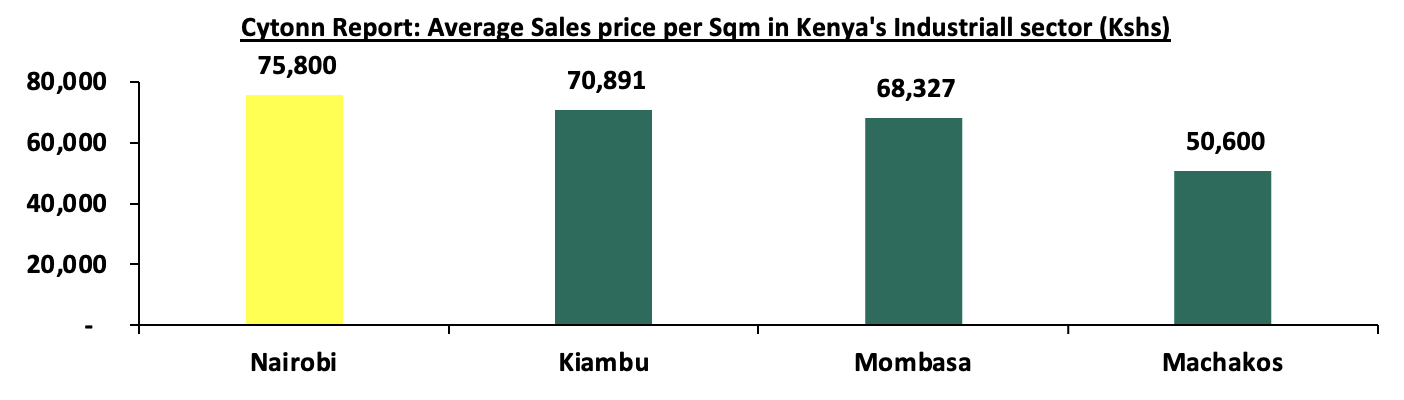
Source: Cytonn Research
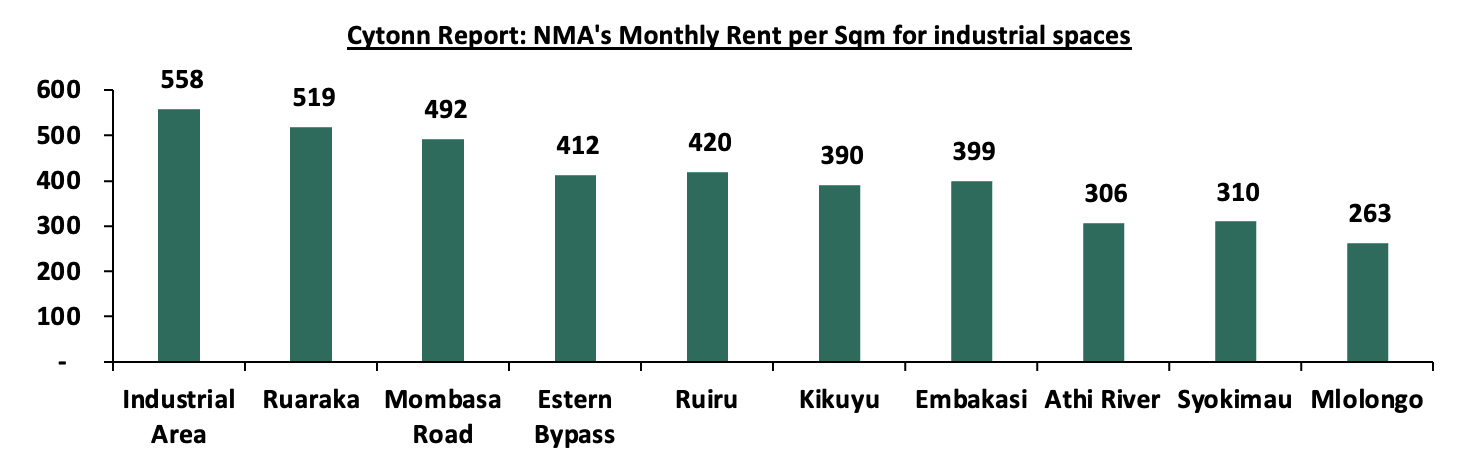
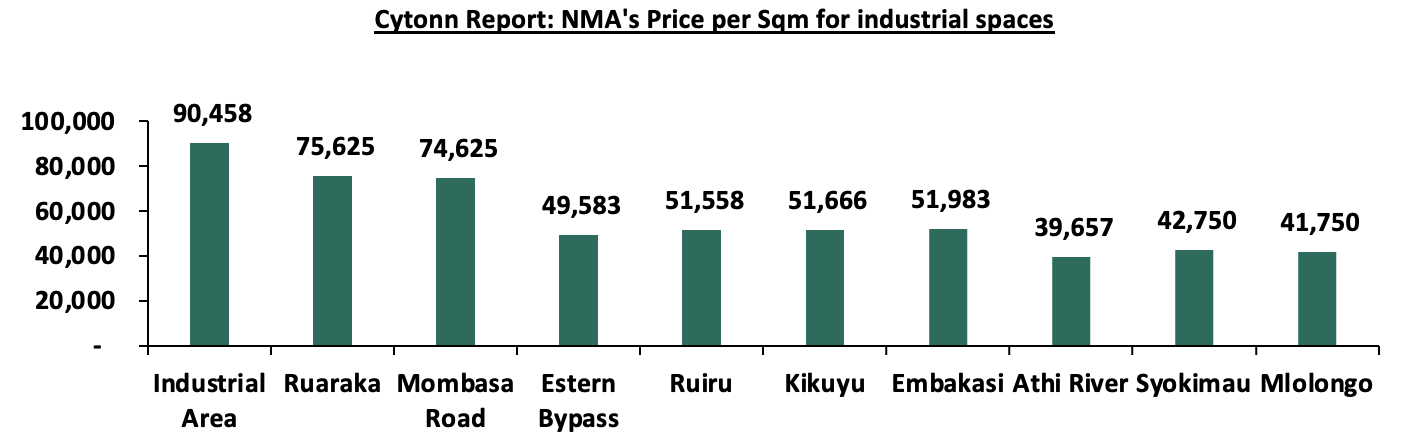
- Performance of Industrial spaces in NMA by nodes
Industrial Area, Ruaraka and Mombasa Road areas, attract high rental and selling prices. Industrial area has the highest average rent per month of Kshs 558 per SQM and selling price of Kshs 90,458 per SQM contributable to factors such as proximity to the Jomo Kenyatta International Airport (JKIA), increased road and rail network such as the Mombasa Road, Eastern Bypass, SGR and the Nairobi Expressway. On the other hand, Mlolongo is the least performing node with monthly rates of Kshs 263 per SQM and selling price per SQM of Kshs 41,750 attributable to the distance from the CBD, increased freight costs, and limited road access. The graph below compares monthly rental performance of various nodes;
Source: Cytonn Research
The graph below compares various nodes performance in terms of selling prices within Nairobi Metropolitan Area (NMA).
Source: Cytonn Research
Section V: Recommendations
The Industrial Real Estate is witnessing increased traction and activities due to the increased needs. Within the Nairobi Metropolitan Area, Athi River continues to anchor industrial investment due to its proximity to Mombasa Road, the Inland Container Depot, and abundant industrial land suitable for large-scale developments. Ruiru and the Eastern Bypass are rapidly emerging as prime locations for light manufacturing and warehousing, supported by improved road connectivity and growing residential catchments that provide affordable labour. Syokimau and Mlolongo have become preferred nodes for logistics and distribution activities, driven by their strategic access to the Nairobi Expressway and the Jomo Kenyatta International Airport. Meanwhile, Tatu City, and Kikuyu are attracting investors seeking modern, master-planned industrial environments with reliable infrastructure and integrated land-use planning. Collectively, these corridors represent the most promising zones for sustainable industrial development within the NMA, offering investors strong returns and long-term value appreciation.
Section VI: Conclusion and Outlook for the NMA Industrial Real Estate sector
The industrial Real Estate sector in Kenya in 2025 is on neutral since the sector faces a mix of challenges and opportunities. Sustained government support, increased regional trade, and continued investment in green energy and technology adoption are essential to ensure its growth. If these initiatives are maintained and bottlenecks addressed, NMA industrial sector is well-positioned to become a regional hub for manufacturing and innovation in the coming decade.
The industrial real estate sector in the Nairobi metropolitan area is experiencing significant growth, driven by evolving market demands and government support. While challenges such as high costs and infrastructural gaps persist, strategic planning, technological adoption, and focus on sustainable practices can unlock vast opportunities. Stakeholders, including developers, investors, and policymakers, should collaborate to address these challenges and leverage Nairobi’s strategic position as a regional hub.
We maintain a neutral outlook for the sector. Going forward, we expect the sector to continue on an upward trajectory driven by: i) the rising demand for data centers in the country, ii) an increasing demand for cold rooms, especially in the Nairobi Metropolitan Area, iii) demand for quality warehouses due to the growing e-commerce business in the country, iv) support from the government, as evidenced by the establishment of Special Economic Zones (SEZ) and Export Processing Zones (EPZ), v) increased development activities by industry players such as ALP Africa Logistics, vi) Kenya’s continued recognition as a regional hub, hence attracting international investors, and, vii) efforts by the government to support agricultural and horticultural products in the international market.
Disclaimer: The views expressed in this publication are those of the writers where particulars are not warranted. This publication is meant for general information only and is not a warranty, representation, advice or solicitation of any nature. Readers are advised in all circumstances to seek the advice of a registered investment advisor.

- Talk to us
- Kenya
- P.O Box 20695 - 00200, Nairobi, Kenya
- Cell +254709101200
- Tel +254709101200
- WhatsApp +254741676635
- United States
- +254709101200
- DOWNLOAD OUR APP
-


- Kenya
- 8th Floor, Pinetree Plaza, Kaburu Drive, Ngong Road, Nairobi, Kenya
- USA
- Suite 1150, 1775 Eye Street NW, USA, Washington DC 20006, USA
- Investments
- High Yield
- Private Equity
- Real Estate
- Real Estate
- RiverRun Estates
- Cytonn Towers
- The Ridge
- Taraji Heights
- The Alma