Kenya’s Listed Banks H1'2025 Report, & Cytonn Weekly #37.2025
By Cytonn Research, Sep 21, 2025
Executive Summary
Fixed Income
During the week, T-bills were undersubscribed for the first time in five weeks, with the overall subscription rate coming in at 95.7%, lower than the subscription rate of 161.5% recorded the previous week. Investors’ preference for the shorter 91-day paper waned, with the paper receiving bids worth Kshs 4.2 bn against the offered Kshs 4.0 bn, translating to a subscription rate of 106.2%, albeit lower than the subscription rate of 385.2%, recorded the previous week. The subscription rates for the 182-day paper increased to 55.8% from the 31.3% recorded the previous week, while that of the 364-day paper decreased to 131.3% from the 202.3% recorded the previous week. The government accepted a total of Kshs 22.7 bn worth of bids out of Kshs 23.0 bn bids received, translating to an acceptance rate of 98.9%.The yields on the government papers were on a downward trajectory with the yields on the 91-day paper decreasing the most by 2.6 bps to 7.9% from the 8.0% recorded the previous week while the yields on the 364-day and 182-day paper decreased by 1.2 bps and 1.0 bps to 9.54% and 8.01% respectively, from the 9.55% and 8.02% respectively recorded the previous week;
During the week, the Central Bank of Kenya released the auction results for the re-opened treasury bonds FXD1/2018/020 and FXD1/2022/025 with tenors to maturities of 12.5 years and 22.2 years respectively and fixed coupon rates of 13.2% and 14.2% respectively. The bonds were oversubscribed, with the overall subscription rate coming in at 243.2%, receiving bids worth Kshs 97.3 bn against the offered Kshs 40.0 bn. The government accepted bids worth Kshs 61.4 bn, translating to an acceptance rate of 63.2%. The weighted average yield for the accepted bids for the FXD1/2018/020 and FXD1/2022/025 came in at 13.6% and 14.1% respectively. Notably, the 14.1% on the FXD1/2022/025 was lower than the 14.5% recorded the last time the bond was reopened in June 2025 while the 13.6% on the FXD1/2018/020 was also lower than the 13.9% recorded the last time the bond was reopened in July 2025. With the Inflation rate at 4.5% as of August 2025, the real returns of the FXD1/2018/020 and FXD1/2022/025 are 9.1% and 9.6%. Given the 10.0% withholding tax on the bonds, the tax equivalent yields for shorter term bonds with 15.0% withholding tax are 14.5% and 15.0% for the FXD1/2018/020 and FXD1/2022/025 respectively;
Equities
During the week, the equities market was on a downward trajectory, with NSE 20 declining the most by 3.8%, while NSE 10, NASI and NSE 25 declined by 2.9%, 2.9% and 2.7% respectively, taking the YTD performance to gains of 41.0%, 38.4%, 30.1% and 30.0% for NSE 20, NASI, NSE25 and NSE 10 respectively. The equities market performance was driven by losses recorded by large-cap stocks such as ABSA, SCBK and BAT of 7.8%, 6.7% and 6.1% respectively. The performance was, however, supported by gains recorded by large cap stocks such as KCB and Stanbic of 1.4% and 0.6% respectively;
Additionally, in the regional equities market, the East African Exchanges 20 (EAE 20) share index gained by 1.2% to 100.3 from 99.1 recorded the previous week, attributable to gains recorded by large cap stocks such as Tanga Cement, Stanbic Uganda and Blarirwa Limited and of 7.9%, 2.9% and 1.5% respectively. The performance was, however, weighed down by losses recorded by large cap stocks such as CRDB Bank, Co-operative Bank Kenya and NMB Bank of 4.7%, 3.1% and 3.1% respectively;
Real Estate
During the week, President William Ruto presided over the groundbreaking of Centum Investment Company’s Vipingo Special Economic Zone (SEZ) in Kilifi County, shortly after KCB Bank Kenya and the African Export-Import Bank (Afreximbank) signed a Kshs 103.0 bn financing agreement to support its development. The 2,000-acre project is envisioned as one of the most competitive manufacturing hubs in the region, offering plug-and-play infrastructure, reliable utilities and fiscal incentives designed to attract global and local manufacturers.
On the Unquoted Securities Platform, Acorn D-REIT and I-REIT traded at Kshs 27.4 and Kshs 23.2 per unit, respectively, as per the last updated data on 12th September 2025. The performance represented a 37.0% and 16.0% gain for the D-REIT and I-REIT, respectively, from the Kshs 20.0 inception price. Additionally, ILAM Fahari I-REIT traded at Kshs 11.0 per share as of 12th September 2025, representing a 45.0% loss from the Kshs 20.0 inception price;
Focus of the Week
Following the release of the H1’2025 results by Kenyan listed banks, the Cytonn Financial Services Research Team undertook an analysis on the financial performance of the listed banks and identified the key factors that shaped the performance of the sector.
Investment Updates:
- Weekly Rates:
- Cytonn Money Market Fund closed the week at a yield of 12.9% p.a. To invest, dial *809# or download the Cytonn App from Google Play store here or from the Appstore here;
- We continue to offer Wealth Management Training every Tuesday, from 7:00 pm to 8:00 pm. The training aims to grow financial literacy among the general public. To register for any of our Wealth Management Trainings, click here;
- If interested in our Private Wealth Management Training for your employees or investment group, please get in touch with us through wmt@cytonn.com;
- Cytonn Insurance Agency acts as an intermediary for those looking to secure their assets and loved ones’ future through insurance namely; Motor, Medical, Life, Property, WIBA, Credit and Fire and Burglary insurance covers. For assistance, get in touch with us through insuranceagency@cytonn.com;
- Cytonn Asset Managers Limited (CAML) continues to offer pension products to meet the needs of both individual clients who want to save for their retirement during their working years and Institutional clients that want to contribute on behalf of their employees to help them build their retirement pot. To more about our pension schemes, kindly get in touch with us through pensions@cytonn.com;
Hospitality Updates:
- We currently have promotions for Staycations. Visit cysuites.com/offers for details or email us at sales@cysuites.com;
Money Markets, T-Bills Primary Auction:
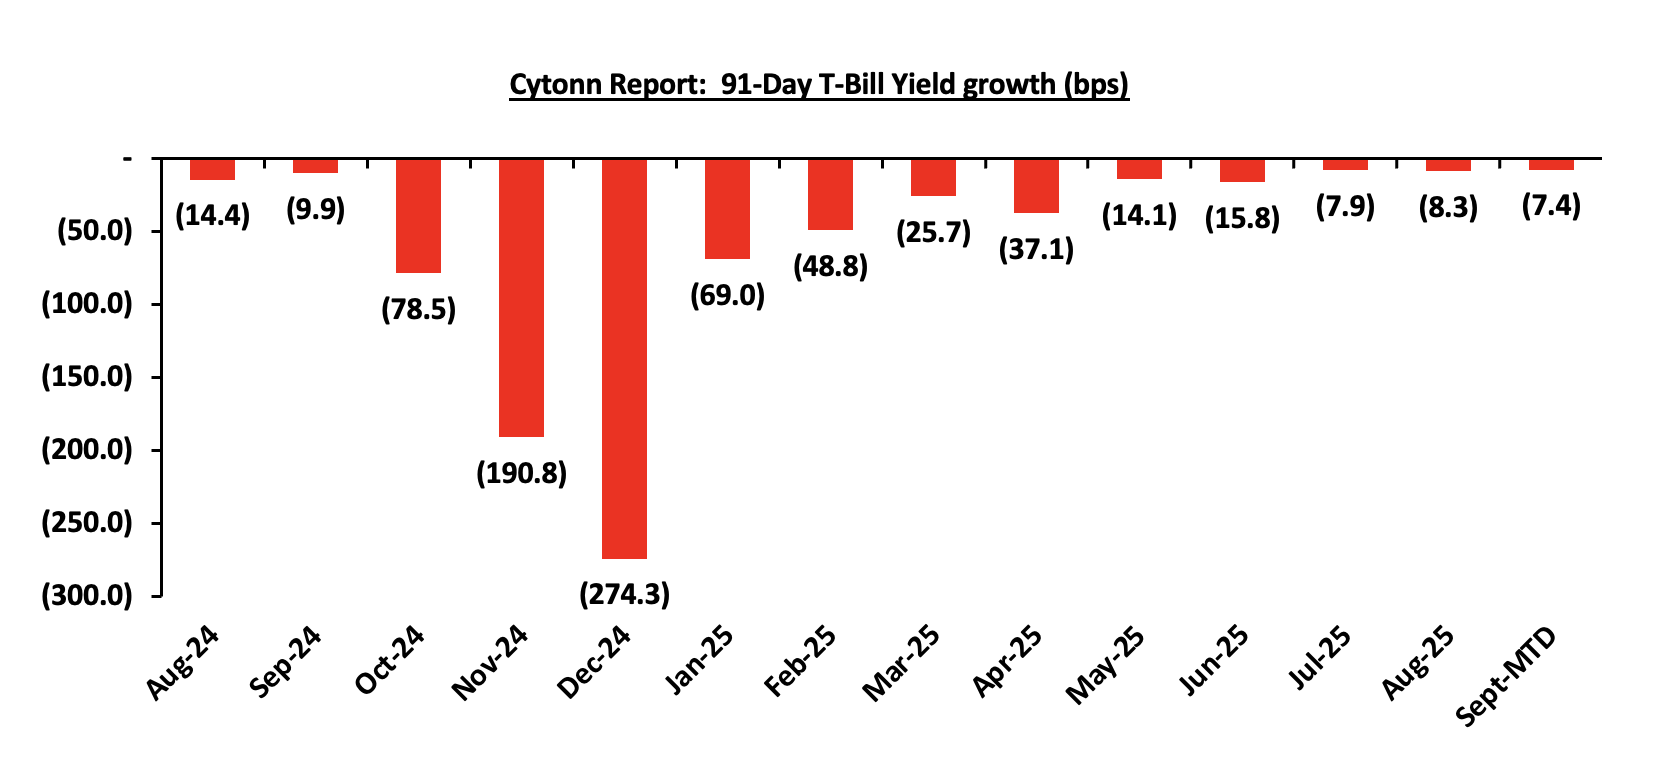
This week, T-bills were undersubscribed for the first time in five weeks, with the overall subscription rate coming in at 95.7%, lower than the subscription rate of 161.5% recorded the previous week. Investors’ preference for the shorter 91-day paper waned, with the paper receiving bids worth Kshs 4.2 bn against the offered Kshs 4.0 bn, translating to a subscription rate of 106.2%, albeit lower than the subscription rate of 385.2%, recorded the previous week. The subscription rates for the 182-day paper increased to 55.8% from the 31.3% recorded the previous week, while that of the 364-day paper decreased to 131.3% from the 202.3% recorded the previous week. The government accepted a total of Kshs 22.7 bn worth of bids out of Kshs 23.0 bn bids received, translating to an acceptance rate of 98.9%.The yields on the government papers were on a downward trajectory with the yields on the 91-day paper decreasing the most by 2.6 bps to 7.9% from the 8.0% recorded the previous week while the yields on the 364-day and 182-day paper decreased by 1.2 bps and 1.0 bps to 9.54% and 8.01% respectively, from the 9.55% and 8.02% respectively recorded the previous week.
The chart below shows the yield growth rate for the 91-day paper in the year to August 2025 and month-to-date:
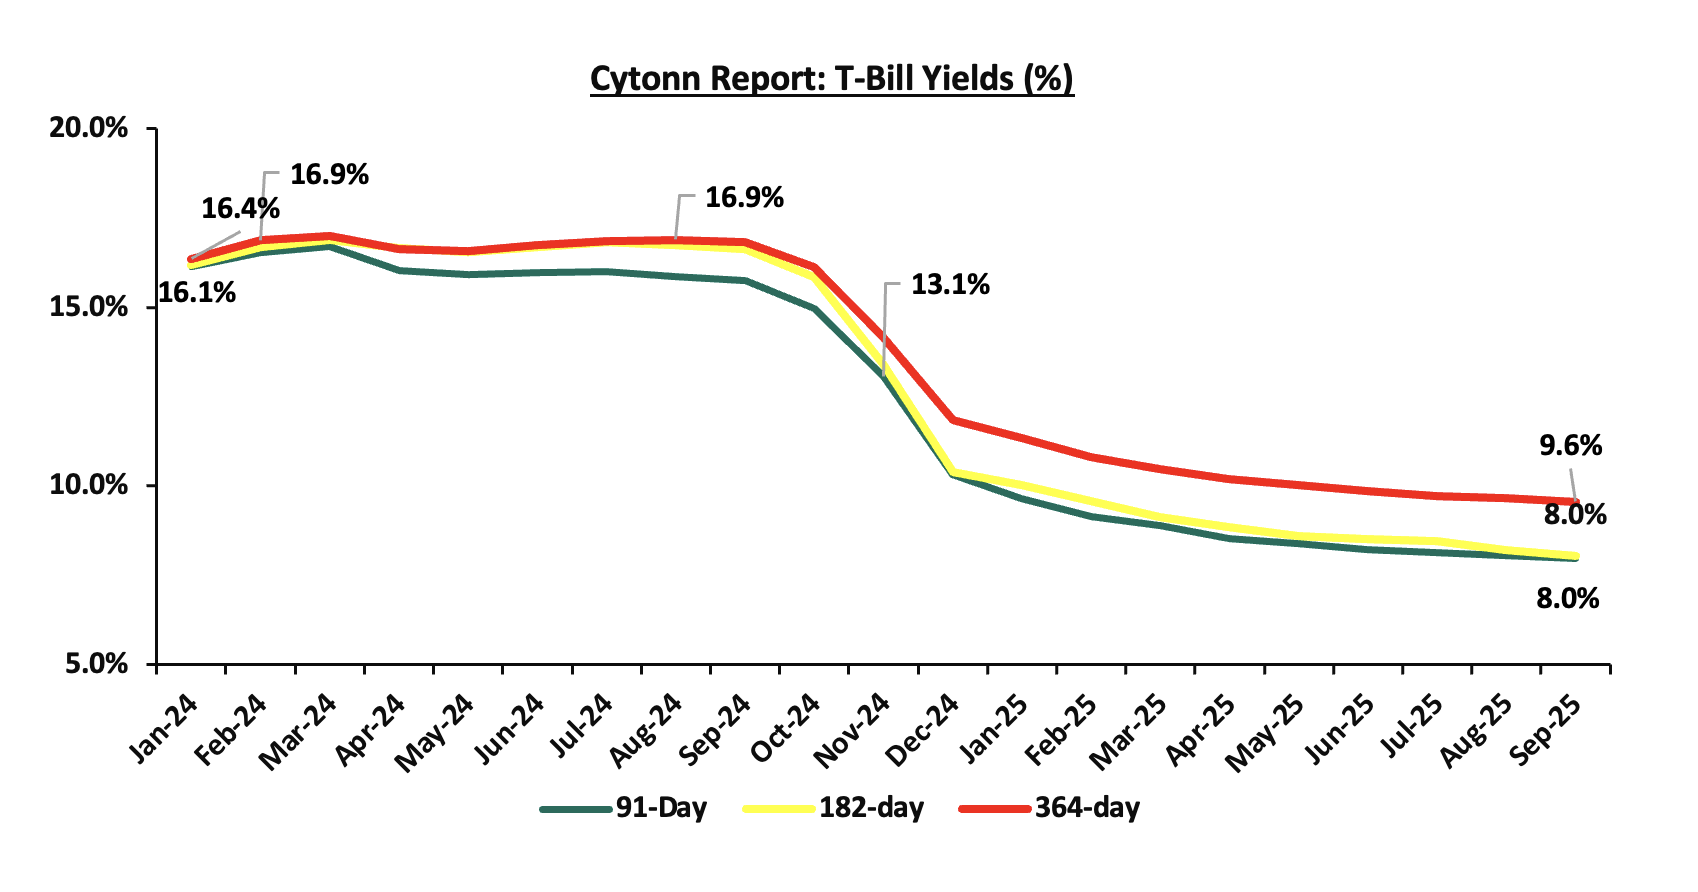
The charts below show the performance of the 91-day, 182-day and 364-day papers from January 2024 to September 2025:
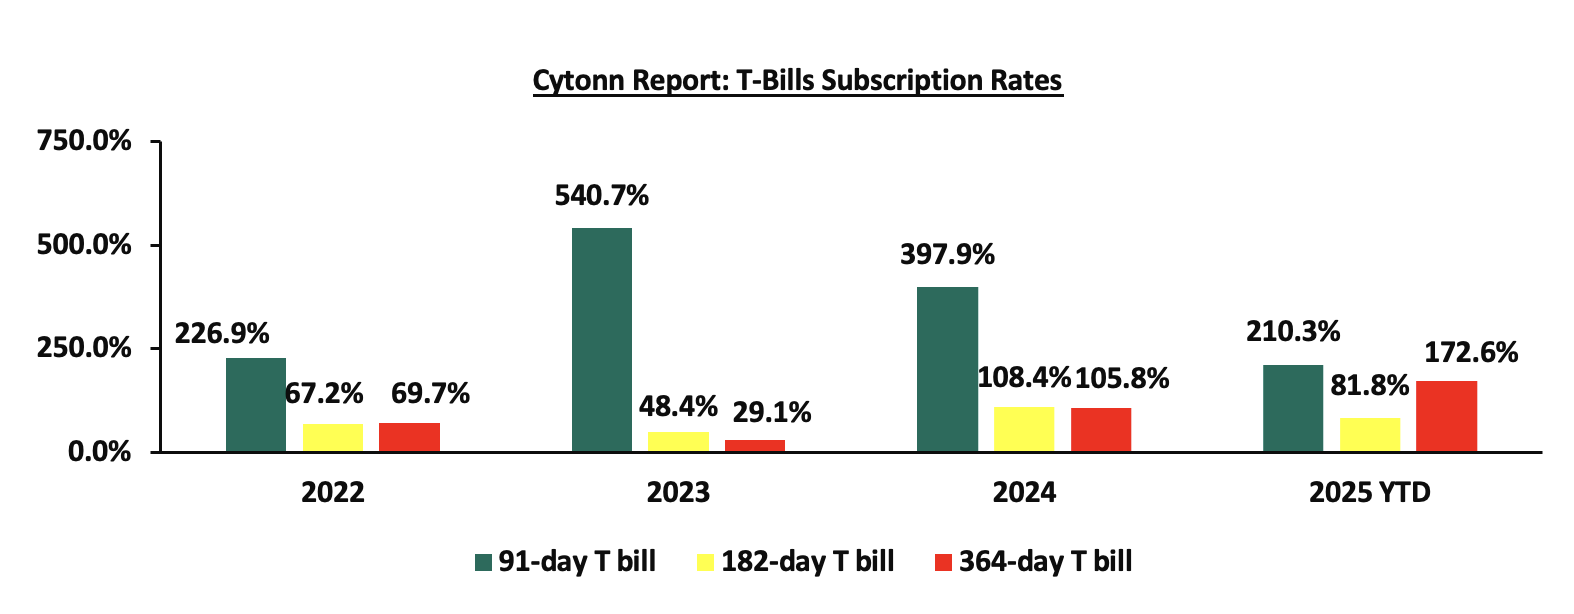
The chart below compares the overall average T-bill subscription rates obtained in 2022,2023, 2024 and 2025 Year-to-date (YTD):
During the week, the Central Bank of Kenya released the auction results for the re-opened treasury bonds FXD1/2018/020 and FXD1/2022/025 with tenors to maturities of 12.5 years and 22.2 years respectively and fixed coupon rates of 13.2% and 14.2% respectively. The bonds were oversubscribed, with the overall subscription rate coming in at 243.2%, receiving bids worth Kshs 97.3 bn against the offered Kshs 40.0 bn. The government accepted bids worth Kshs 61.4 bn, translating to an acceptance rate of 63.2%. The weighted average yield for the accepted bids for the FXD1/2018/020 and FXD1/2022/025 came in at 13.6% and 14.1% respectively. Notably, the 14.1% on the FXD1/2022/025 was lower than the 14.5% recorded the last time the bond was reopened in June 2025 while the 13.6% on the FXD1/2018/020 was also lower than the 13.9% recorded the last time the bond was reopened in July 2025. With the Inflation rate at 4.5% as of August 2025, the real returns of the FXD1/2018/020 and FXD1/2022/025 are 9.1% and 9.6%. Given the 10.0% withholding tax on the bonds, the tax equivalent yields for shorter term bonds with 15.0% withholding tax are 14.5% and 15.0% for the FXD1/2018/020 and FXD1/2022/025 respectively.
Money Market Performance:
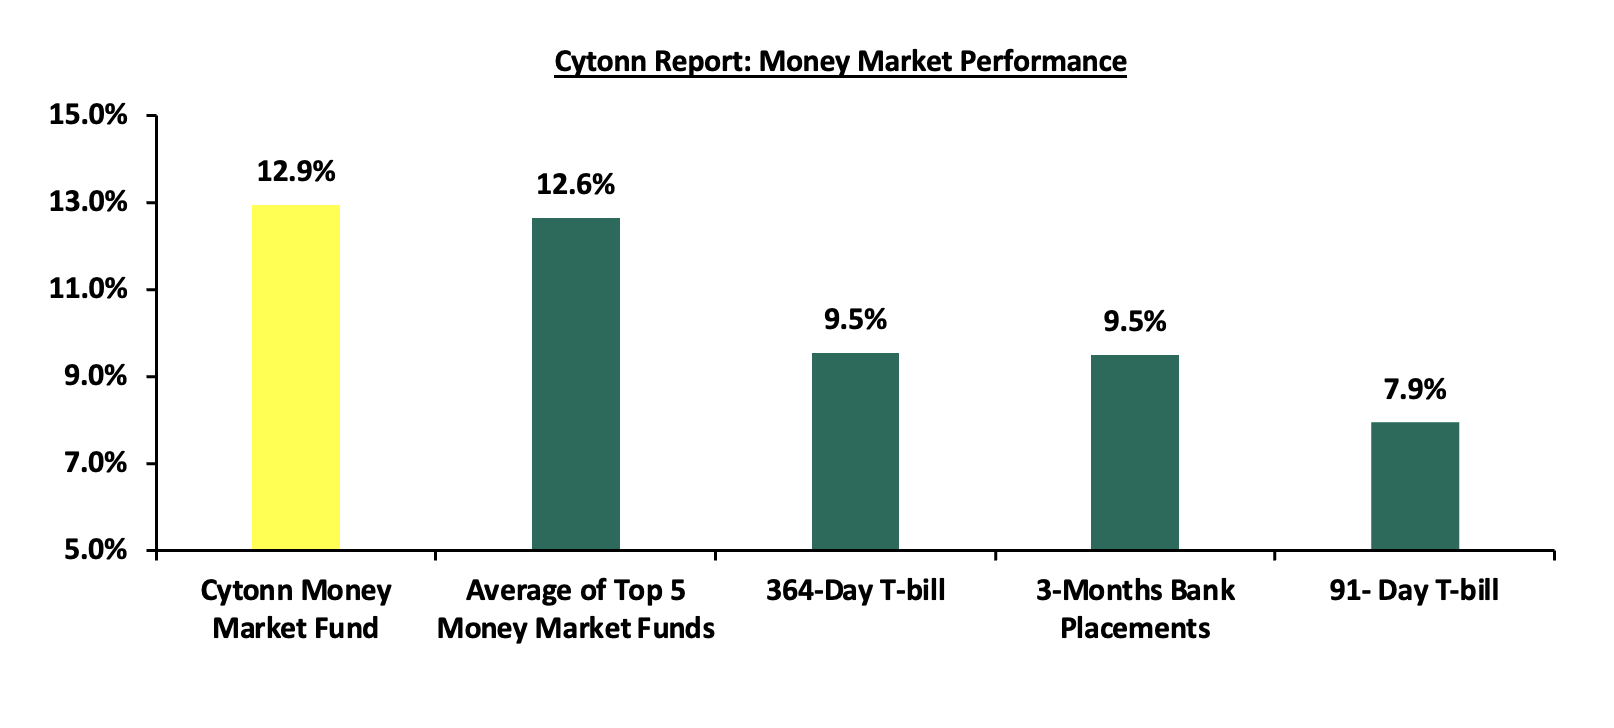
In the money markets, 3-month bank placements ended the week at 9.5% (based on what we have been offered by various banks), The yield on the 91-day paper decreased by 2.6 bps to 7.9%, from the 8.0% recorded the previous week while the yield on the 364-day paper decreased by 1.2 bps to 9.54% from the 9.55% recorded the previous week. The yield on the Cytonn Money Market Fund decreased by 10.0 bps to 12.9%, from 13.0% recorded in the previous week, while the average yields on the Top 5 Money Market Funds decreased by 2.6 bps to 12.6% from 12.7% recorded the previous week.
The table below shows the Money Market Fund Yields for Kenyan Fund Managers as published on 19th September 2025:
|
Money Market Fund Yield for Fund Managers as published on 19th September 2025 |
||
|
Rank |
Fund Manager |
Effective Annual Rate |
|
1 |
Ndovu Money Market Fund |
13.1% |
|
2 |
Cytonn Money Market Fund (Dial *809# or download Cytonn App) |
12.9% |
|
3 |
Nabo Africa Money Market Fund |
12.7% |
|
4 |
Arvocap Money Market Fund |
12.3% |
|
5 |
Gulfcap Money Market Fund |
12.2% |
|
6 |
Lofty-Corban Money Market Fund |
12.1% |
|
7 |
Etica Money Market Fund |
12.1% |
|
8 |
Orient Kasha Money Market Fund |
12.0% |
|
9 |
Kuza Money Market fund |
11.4% |
|
10 |
Enwealth Money Market Fund |
11.2% |
|
11 |
Madison Money Market Fund |
10.9% |
|
12 |
Old Mutual Money Market Fund |
10.8% |
|
13 |
GenAfrica Money Market Fund |
10.7% |
|
14 |
Jubilee Money Market Fund |
10.6% |
|
15 |
British-American Money Market Fund |
10.5% |
|
16 |
Apollo Money Market Fund |
10.2% |
|
17 |
Dry Associates Money Market Fund |
9.9% |
|
18 |
Faulu Money Market Fund |
9.6% |
|
19 |
Mali Money Market Fund |
9.6% |
|
20 |
Sanlam Money Market Fund |
9.5% |
|
21 |
KCB Money Market Fund |
9.3% |
|
22 |
Co-op Money Market Fund |
9.3% |
|
23 |
CPF Money Market Fund |
9.1% |
|
24 |
ICEA Lion Money Market Fund |
9.1% |
|
25 |
Absa Shilling Money Market Fund |
9.0% |
|
26 |
Genghis Money Market Fund |
8.8% |
|
27 |
CIC Money Market Fund |
8.5% |
|
28 |
Mayfair Money Market Fund |
8.4% |
|
29 |
AA Kenya Shillings Fund |
7.5% |
|
30 |
Ziidi Money Market Fund |
6.8% |
|
31 |
Stanbic Money Market Fund |
6.4% |
|
32 |
Equity Money Market Fund |
5.2% |
Source: Business Daily
Liquidity:
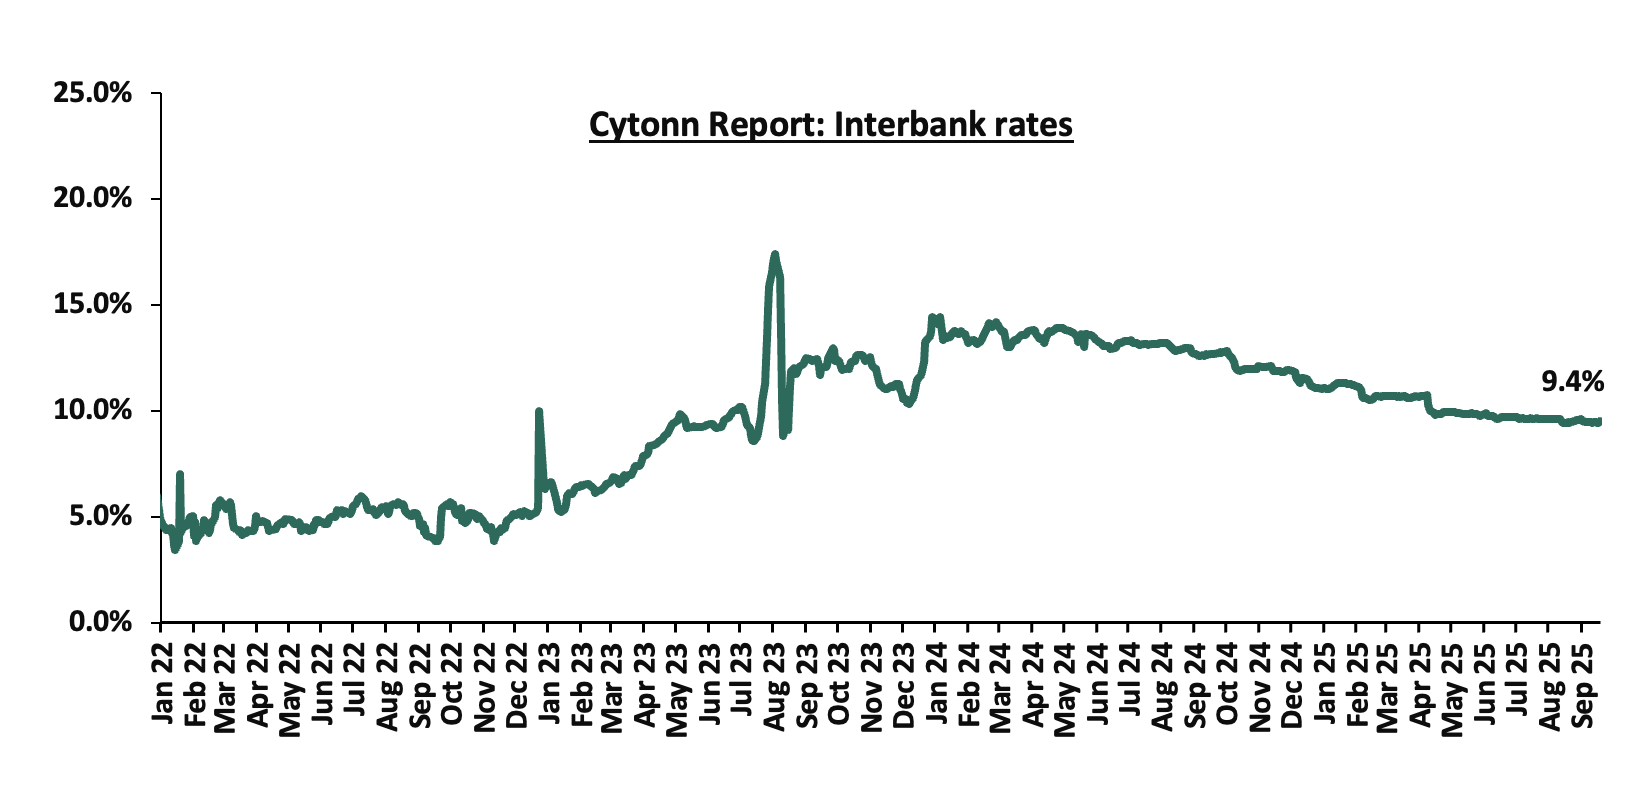
During the week, liquidity in the money markets marginally eased, with the average interbank rate decreasing by 0.2 bps, to remain unchanged from the 9.5% recorded the previous week, partly attributable to government payments that offset tax remittances. The average interbank volumes traded increased significantly by 30.7% to Kshs 7.9 bn from Kshs 11.4 bn recorded the previous week.
The chart below shows the interbank rates in the market over the years:
Kenya Eurobonds:
During the week, the yields on Kenya’s Eurobonds were on a downward trajectory with the yields on the 12-year Eurobond issued in 2019 decreasing the most by 8.3 bps to 7.9% from 8.0% recorded the previous week. The table below shows the summary performance of the Kenyan Eurobonds as of 18th September 2025;
|
Cytonn Report: Kenya Eurobond Performance |
|||||||
|
|
2018 |
2019 |
2021 |
2024 |
2025 |
||
|
Tenor |
10-year issue |
30-year issue |
7-year issue |
12-year issue |
13-year issue |
7-year issue |
11-year issue |
|
Amount Issued (USD) |
1.0 bn |
1.0 bn |
0.9 bn |
1.2 bn |
1.0 bn |
1.5 bn |
1.5 bn |
|
Years to Maturity |
2.5 |
22.5 |
1.7 |
6.7 |
8.8 |
5.5 |
10.5 |
|
Yields at Issue |
7.3% |
8.3% |
7.0% |
7.9% |
6.2% |
10.4% |
9.9% |
|
2-Jan-25 |
9.1% |
10.3% |
8.5% |
10.1% |
10.1% |
10.1% |
|
|
1-Sep-25 |
6.8% |
9.8% |
- |
8.7% |
9.2% |
8.4% |
|
|
11-Sep-25 |
6.0% |
9.2% |
- |
8.0% |
8.4% |
7.7% |
|
|
12-Sep-25 |
6.0% |
9.2% |
- |
7.9% |
8.3% |
7.7% |
|
|
15-Sep-25 |
6.0% |
9.2% |
- |
8.0% |
8.4% |
7.7% |
|
|
16-Sep-25 |
5.9% |
9.2% |
- |
7.9% |
8.3% |
7.7% |
|
|
17-Sep-25 |
5.9% |
9.2% |
- |
7.9% |
8.3% |
7.7% |
10.0% |
|
18-Sep-25 |
5.9% |
9.2% |
- |
7.9% |
8.3% |
7.7% |
|
|
Weekly Change |
(0.1%) |
0.0% |
- |
(0.1%) |
0.0% |
0.0% |
- |
|
MTD Change |
(0.9%) |
(0.6%) |
- |
(0.8%) |
(0.9%) |
(0.7%) |
0.0% |
|
YTD Change |
(3.2%) |
(1.1%) |
- |
(2.2%) |
(1.8%) |
(2.4%) |
0.0% |
Source: Central Bank of Kenya (CBK) and National Treasury
Kenya Shilling:
During the week, the Kenya Shilling remained relatively unchanged from the Kshs.129.2 recorded previous week. On a year-to-date basis, the shilling has appreciated by 0.1 % against the dollar, compared to the 17.6% appreciation recorded in 2024.
We expect the shilling to be supported by:
- Diaspora remittances standing at a cumulative USD 5,078.8 mn in the twelve months to August 2025, 9.4% higher than the USD 4,644.5 mn recorded over the same period in 2024. These has continued to cushion the shilling against further depreciation. In the August 2025 diaspora remittances figures, North America remained the largest source of remittances to Kenya accounting for 60.6% in the period,
- The tourism inflow receipts which came in at Kshs 452.2 bn in 2024, a 19.8% increase from Kshs 377.5 bn inflow receipts recorded in 2023, and owing to tourist arrivals that improved by 8.0% to 2,303,028 in the 12 months to February 2025 from 2,133,612 in the 12 months to February 2024, and,
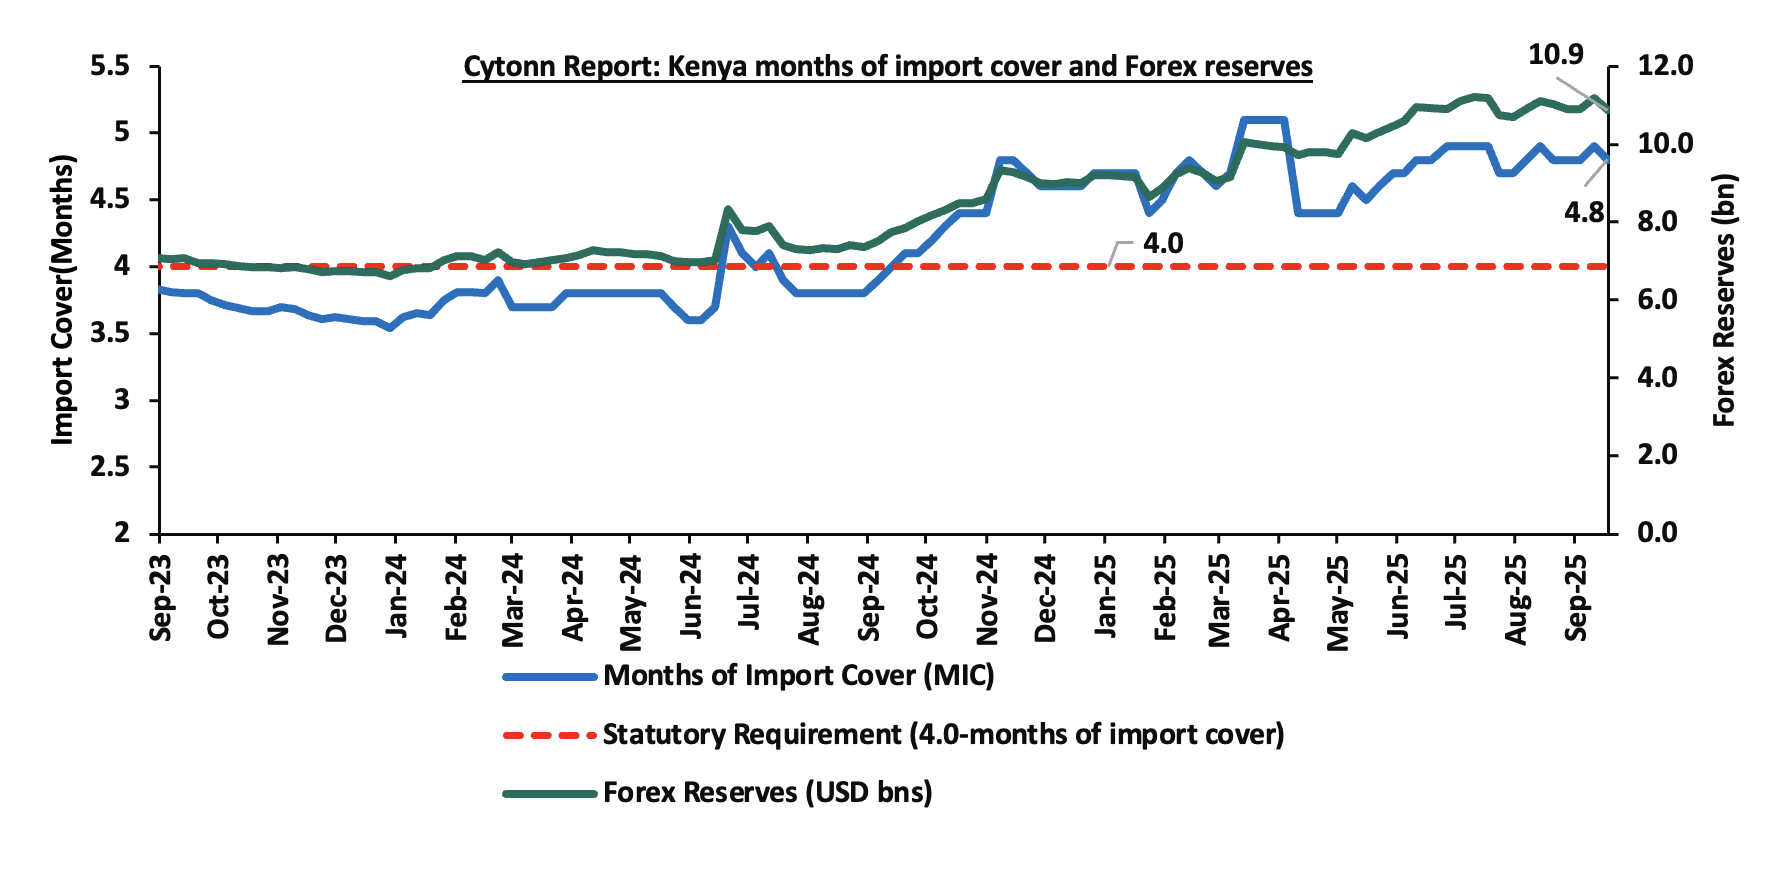
- Improved forex reserves currently at USD 10.9 bn (equivalent to 4.8-months of import cover), which is above the statutory requirement of maintaining at least 4.0-months of import cover and above the EAC region’s convergence criteria of 4.5-months of import cover.
The shilling is however expected to remain under pressure in 2025 as a result of:
- An ever-present current account deficit which came at 1.6% of GDP in the twelve months to June 2025, and,
- The need for government debt servicing, continues to put pressure on forex reserves given that 61.4% of Kenya’s external debt is US Dollar-denominated as of March 2025.
Key to note, Kenya’s forex reserves decreased by 2.8% during the week, to USD 10.9 bn from the USD 11.2 bn recorded in the previous week, equivalent to 4.8 months of import cover, and above the statutory requirement of maintaining at least 4.0-months of import cover and above the EAC region’s convergence criteria of 4.5-months of import cover.
The chart below summarizes the evolution of Kenya's months of import cover over the years:
Rates in the Fixed Income market have been on a downward trend due to high liquidity in the money market which allowed the government to front load most of its borrowing. The government is 162.5% ahead of its prorated net domestic borrowing target of Kshs 156.9 bn, having a net borrowing position of Kshs 412.0 bn (inclusive of T-bills). However, we expect stabilization of the yield curve in the short and medium term, with the government looking to increase its external borrowing to maintain the fiscal surplus, hence alleviating pressure in the domestic market. As such, we expect the yield curve to stabilize in the short to medium-term and hence investors are expected to shift towards the long-term papers to lock in the high returns
Market Performance
During the week, the equities market was on a downward trajectory, with NSE 20 declining the most by 3.8%, while NSE 10, NASI and NSE 25 declined by 2.9%, 2.9% and 2.7% respectively, taking the YTD performance to gains of 41.0%, 38.4%, 30.1% and 30.0% for NSE 20, NASI, NSE 25 and NSE 10 respectively. The equities market performance was driven by losses recorded by large-cap stocks such as ABSA, SCBK and BAT of 7.8%, 6.7% and 6.1% respectively. The performance was, however, supported down by gains recorded by large cap stocks such as KCB and Stanbic of 1.4% and 0.6% respectively.
Additionally, in the regional equities market, the East African Exchanges 20 (EAE 20) share index gained by 1.2% to 100.3 from 99.1 recorded the previous week, attributable to gains recorded by large cap stocks such as Tanga Cement, Stanbic Uganda and Blarirwa Limited and of 7.9%, 2.9% and 1.5% respectively. The performance was, however, weighed down by losses recorded by large cap stocks such as CRDB Bank, Co-operative Bank Kenya and NMB Bank of 4.7%, 3.1% and 3.1% respectively.
During the week, equities turnover increased by 17.4% to USD 41.3 mn, from USD 35.2 mn recorded the previous week, taking the YTD total turnover to USD 735.9 mn. Foreign investors remained net sellers for the third consecutive week, with a net selling position of USD 22.9 mn, from a net selling position of USD 4.1 mn recorded the previous week, taking the YTD foreign net selling position to USD 54.9 mn, compared to a net selling position of USD 16.9 mn in 2024.
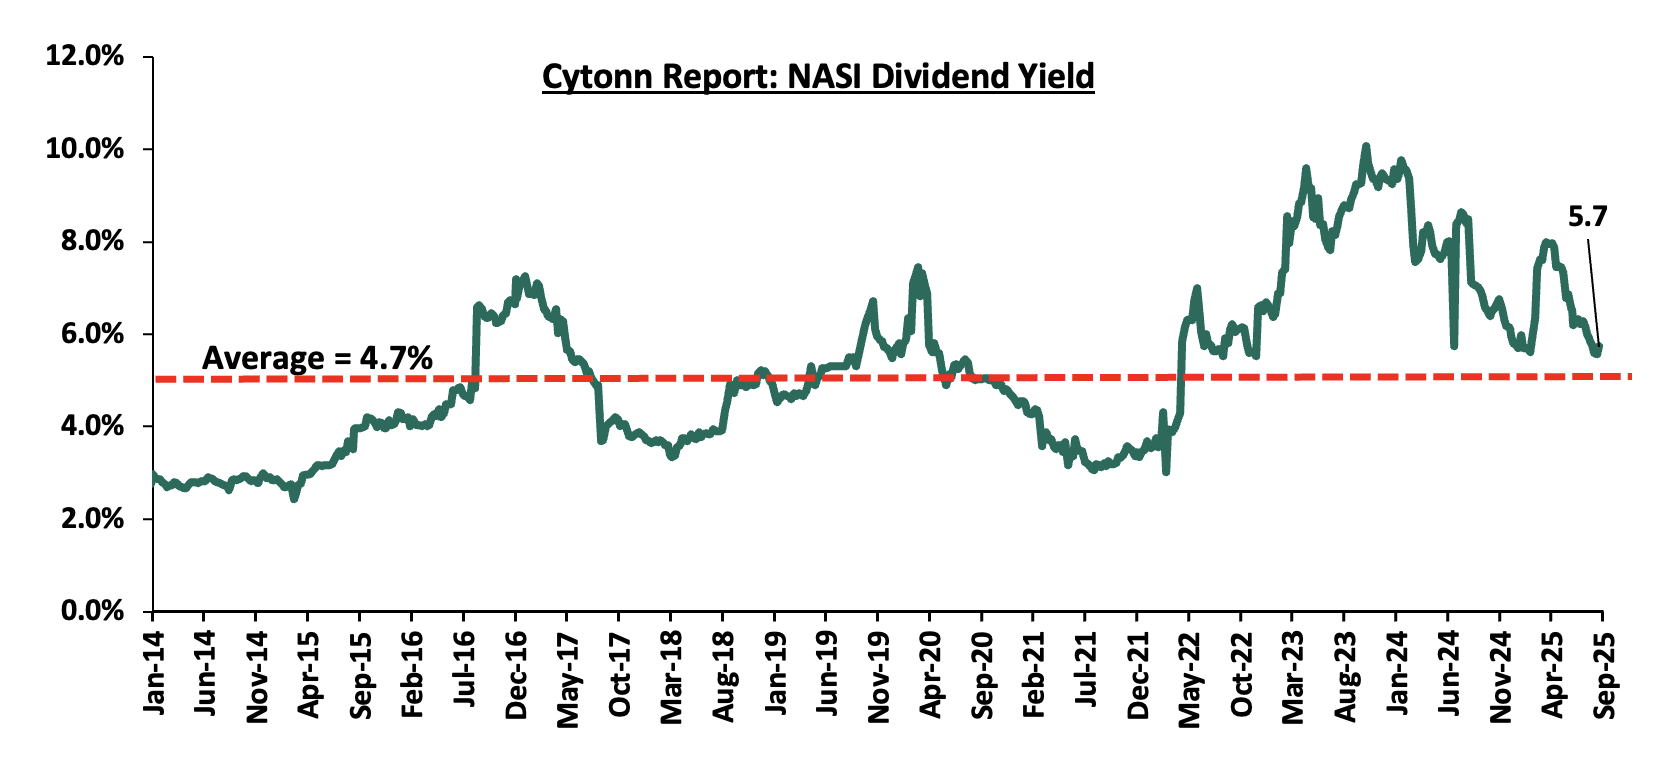
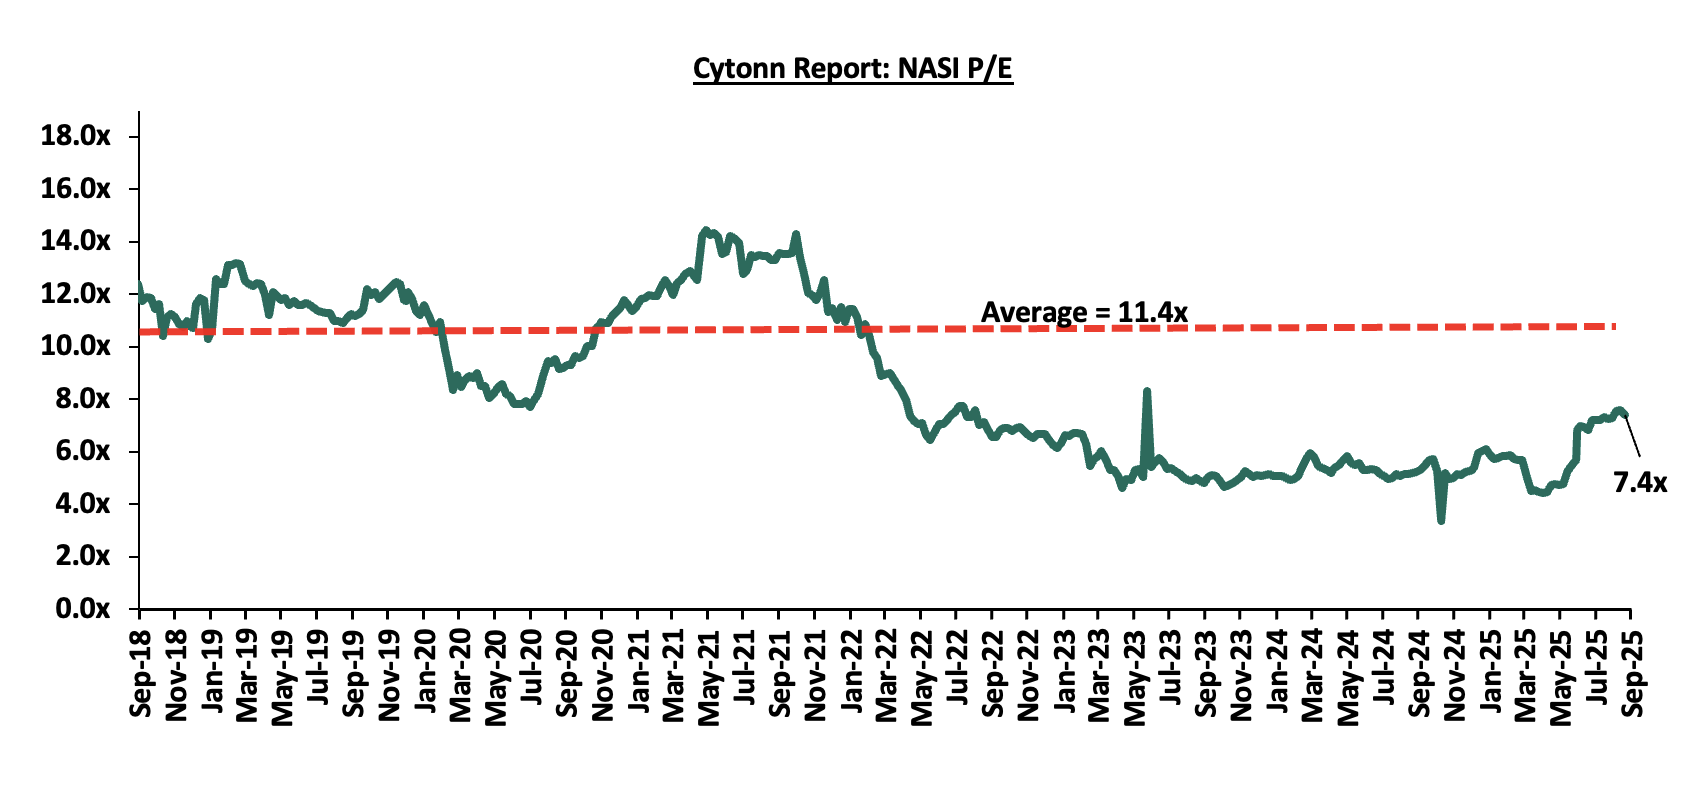
The market is currently trading at a price-to-earnings ratio (P/E) of 7.4x, 35.2% below the historical average of 11.4x. The dividend yield stands at 5.7%, 1.0% points above the historical average of 4.7%. Key to note, NASI’s PEG ratio currently stands at 0.9x, an indication that the market is undervalued relative to its future growth. A PEG ratio greater than 1.0x indicates the market is overvalued while a PEG ratio less than 1.0x indicates that the market is undervalued. The charts below indicate the historical P/E and dividend yields of the market;
Universe of Coverage:
|
Cytonn Report: Equities Universe of Coverage |
|||||||||||
|
Company |
Price as at 12/09/2025 |
Price as at 19/09/2025 |
w/w change |
YTD Change |
Year Open 2025 |
Target Price* |
Dividend Yield |
Upside/ Downside** |
P/TBv Multiple |
Recommendation |
|
|
Diamond Trust Bank |
105.25 |
104.75 |
(0.5%) |
56.9% |
66.8 |
128.3 |
6.7% |
29.1% |
0.4x |
Buy |
|
|
Standard Chartered Bank |
304.50 |
284.00 |
(6.7%) |
(0.4%) |
285.3 |
314.1 |
15.8% |
26.4% |
1.6x |
Buy |
|
|
KCB Group |
53.00 |
53.75 |
1.4% |
26.8% |
42.4 |
63.6 |
5.6% |
23.9% |
0.7x |
Buy |
|
|
NCBA |
72.50 |
68.50 |
(5.5%) |
34.3% |
51.0 |
79.0 |
8.0% |
23.4% |
1.1x |
Buy |
|
|
ABSA Bank |
23.05 |
21.25 |
(7.8%) |
12.7% |
18.9 |
24.1 |
8.2% |
21.6% |
1.4x |
Buy |
|
|
Equity Group |
54.25 |
54.00 |
(0.5%) |
12.5% |
48.0 |
61.2 |
7.9% |
21.2% |
0.9x |
Buy |
|
|
I&M Group |
43.75 |
43.00 |
(1.7%) |
19.4% |
36.0 |
48.2 |
7.0% |
19.1% |
0.8x |
Accumulate |
|
|
Stanbic Holdings |
180.25 |
181.25 |
0.6% |
29.7% |
139.8 |
194.8 |
11.4% |
18.9% |
1.1x |
Accumulate |
|
|
Co-op Bank |
19.90 |
19.15 |
(3.8%) |
9.7% |
17.5 |
21.1 |
7.8% |
18.2% |
0.7x |
Accumulate |
|
|
Britam |
8.88 |
8.80 |
(0.9%) |
51.2% |
5.8 |
9.5 |
0.0% |
8.2% |
0.8x |
Hold |
|
|
Jubilee Holdings |
310.75 |
324.25 |
4.3% |
85.6% |
174.8 |
312.9 |
4.2% |
0.7% |
0.5x |
Lighten |
|
|
CIC Group |
5.40 |
4.32 |
(20.0%) |
101.9% |
2.1 |
4.0 |
3.0% |
(3.7%) |
1.2x |
Sell |
|
|
*Target Price as per Cytonn Analyst estimates **Upside/ (Downside) is adjusted for Dividend Yield ***Dividend Yield is calculated using FY’2024 Dividends |
|||||||||||
We are “Bullish” on the Equities markets in the short term due to current attractive valuations, lower yields on short-term government papers and expected global and local economic recovery, and, “Neutral” in the long term due to persistent foreign investor outflows. With the market currently trading at par with its future growth (PEG Ratio at 0.9x), we believe that investors should reposition towards value stocks with strong earnings growth and that are trading at discounts to their intrinsic value. We expect the current high foreign investors sell-offs to continue weighing down the economic outlook in the short term.
- Industrial Sector
- Centum’s Vipingo SEZ Breaks Ground with Kshs 103.0 bn Financing Boost
During the week, President William Ruto presided over the groundbreaking of Centum Investment Company’s Vipingo Special Economic Zone (SEZ) in Kilifi County, shortly after KCB Bank Kenya and the African Export-Import Bank (Afreximbank) signed a Kshs 103.0 bn financing agreement to support its development. The 2,000-acre project is envisioned as one of the most competitive manufacturing hubs in the region, offering plug-and-play infrastructure, reliable utilities and fiscal incentives designed to attract global and local manufacturers.
The Vipingo SEZ, being developed by Centum Investments in partnership with Arise IIP, will feature ready-to-use industrial infrastructure, reliable power and water, and enhanced transport connectivity. The fiscal incentives such as zero-rated VAT, stamp duty exemptions and 100.0% capital expenditure allowances are expected to position Kenya as a preferred manufacturing and export destination in East Africa.
From a real estate perspective, this is a significant growth driver for the industrial and logistics sub-sector. The SEZ will spur demand for warehousing, factory shells and distribution centers, providing opportunities for developers to deliver high-quality industrial spaces. Long-term leases with manufacturers will also create predictable rental income streams, making the asset class attractive to institutional investors seeking stable returns.
Beyond industrial real estate, the SEZ is likely to stimulate complementary developments such as residential units for workers, retail centers, schools and healthcare facilities, effectively creating a new urban node within Kilifi County. This increased economic activity is expected to raise land values, improve property absorption rates and encourage further private sector investment in the Coastal region.
Overall, the Vipingo SEZ represents a major step towards regional economic decentralization, unlocking underutilized land for productive use and contributing to Kenya’s broader goal of boosting manufacturing’s share of GDP to 20.0% by 2030 under the Bottom-Up Economic Transformation Agenda (BETA).
We expect this development to catalyze growth in the industrial and logistics real estate sub-sector by driving demand for warehouses, factory shells, and distribution centers. It will also spur complementary residential, retail, and social infrastructure projects around the SEZ, boosting land values and property uptake in Kilifi County. However, its success will hinge on timely infrastructure delivery and effective implementation of fiscal incentives.
- Real Estate Investments Trusts (REITs)
On the Unquoted Securities Platform, Acorn D-REIT and I-REIT traded at Kshs 27.4 and Kshs 23.2 per unit, respectively, as per the last updated data on 12th September 2025. The performance represented a 37.0% and 16.0% gain for the D-REIT and I-REIT, respectively, from the Kshs 20.0 inception price. Additionally, ILAM Fahari I-REIT traded at Kshs 11.0 per share as of 12th September 2025, representing a 45.0% loss from the Kshs 20.0 inception price. The volumes traded for the D-REIT and I-REIT came in at Kshs 12.8 mn and Kshs 39.8 mn shares, respectively, with a turnover of Kshs 323.5 mn and Kshs 791.5 mn, respectively, since inception in February 2021. Additionally, ILAM Fahari I-REIT traded at Kshs 11.0 per share as of 12th September 2025, representing a 45.0% loss from the Kshs 20.0 inception price. The volume traded to date came in at 1,235,285 shares for the I-REIT, with a turnover of Kshs 1.5 mn since inception in November 2015.
REITs offer various benefits, such as tax exemptions, diversified portfolios, and stable long-term profits. However, the ongoing decline in the performance of Kenyan REITs and the restructuring of their business portfolios are hindering significant previous investments. Additional general challenges include:
- Insufficient understanding of the investment instrument among investors leading to a slower uptake of REIT products,
- Lengthy approval processes for REIT creation,
- High minimum capital requirements of Kshs 100.0 mn for REIT trustees compared to Kshs 10.0 mn for pension funds Trustees, essentially limiting the licensed REIT Trustee to banks only
- The rigidity of choice between either a D-REIT or and I-REIT forces managers to form two REITs, rather than having one Hybrid REIT that can allocate between development and income earning properties
- Limiting the type of legal entity that can form a REIT to only a trust company, as opposed to allowing other entities such as partnerships, and companies,
- We need to give time before REITS are required to list – they would be allowed to stay private for a few years before the requirement to list given that not all companies may be comfortable with listing on day one, and,
- Minimum subscription amounts or offer parcels set at Kshs 0.1 mn for D-REITs and Kshs 5.0 mn for restricted I-REITs. The significant capital requirements still make REITs relatively inaccessible to smaller retail investors compared to other investment vehicles like unit trusts or government bonds, all of which continue to limit the performance of Kenyan REITs.
We expect Kenya’s Real Estate sector to remain resilient, supported by continued investor interest across key segments such as residential, industrial, and hospitality, as well as government initiatives like the Affordable Housing Regulations, 2025, and large-scale projects such as the Vipingo Special Economic Zone. These developments are expected to spur demand for housing, industrial parks, logistics facilities, and complementary commercial and social infrastructure. However, challenges such as high capital requirements and regulatory hurdles for REITs, rising construction costs, infrastructure bottlenecks, and oversupply in select market segments will continue to weigh on the sector’s optimal performance by slowing project pipelines and deterring some investor participation.
Following the release of the H1’2025 results by Kenyan listed banks, the Cytonn Financial Services Research Team undertook an analysis on the financial performance of the listed banks and identified the key factors that shaped the performance of the sector. For the earnings notes of the various banks, click the links below:
- Equity Group H1’2025 Earnings Note
- KCB Group H1’2025 Earnings Note
- Standard Chartered Bank Kenya H1’2025 Earnings Note
- ABSA Bank Kenya H1’2025 Earnings Note
- NCBA Group H1’2025 Earnings Note
- Co-operative Bank H1’2025 Earnings Note
- Stanbic Holdings H1’2025 Earnings Note
- I&M Group Holdings H1’2025 Earnings Note
- Diamond Trust Bank Kenya H1’2025 Earnings Note
- HF Group H1’2025 Earnings Note
The core earnings per share (EPS) for the listed banks recorded a weighted growth of 8.4% in H1’2025, compared to a weighted growth of 28.9% recorded in H1’2024, an indication of deteriorated performance mainly on the back of a 5.9% decline in non-funded income in H1’2025, compared to a growth of 13.6% in H1’2024, despite a slight improvement in loan book expansion. The decline in non-funded income was majorly attributable to a decline in foreign exchange income due to reduced dollar demand coupled with lower transaction volumes weighing down on fees and commissions income. Notably, the inflation rate in H1’2025 averaged 3.7%, 1.9% points lower than the 5.6% average in H1’2024, with the Kenyan Shilling remaining stable against the US Dollar, gaining slightly by 5.5 bps in H1’2025, to close at Kshs 129.2, from Kshs 129.3 as at the beginning of the year. The performance was however supported by a 10.4% growth in net interest income, however lower than the 17.6% growth in H1’2024. Similarly, credit risk increased with the asset quality of listed banks deteriorating in H1’2025, with the weighted average Gross Non-Performing Loan ratio (NPL) increasing by 0.2% points to 13.6%, from 13.4% recorded in H1’2024. The NPL performance remained 2.0% points above the ten-year average of 11.6%.
The report is themed “Profitability Under Pressure Amid Weak Interest Income” where we assess the key factors that influenced the performance of the banking sector in H1’2025, the key trends, the challenges banks faced, and areas that will be crucial for growth and stability of the banking sector going forward. As such, we shall address the following:
- Key Themes that Shaped the Banking Sector Performance in H1’2025,
- Summary of the Performance of the Listed Banking Sector in H1’2025,
- The Focus Areas of the Banking Sector Players Going Forward, and,
- Brief Summary and Ranking of the Listed Banks based on the outcome of our analysis
Section I: Key Themes That Shaped the Banking Sector Performance in H1’2025
In this section, we will highlight the main factors influencing the banking sector in H1’2025. These include regulation, digitization, interest rates, regional expansion through mergers and acquisitions, and asset quality:
- Regulation:
- Risk-based Lending: Over the years, the government has used various policy tools to reign in interest rates and improve private sector access to credit. After the repeal of the Interest Rate Cap Law in 2019, the Central Bank of Kenya (CBK) required banks to adopt risk-based lending formulas that price loans according to a borrower’s risk profile, a move aimed at enhancing fairness and transparency, especially for MSMEs. In August 2025, CBK introduced a revised framework anchored on the Kenya Shilling Overnight Interbank Average (KESONIA), a benchmark derived from actual overnight interbank lending transactions, replacing the Central Bank Rate for shilling-denominated variable loans. Under the model, lending rates are calculated as KESONIA plus a premium that reflects the bank’s cost of funds, return on equity and borrower-specific risk, with additional fees disclosed to capture the total cost of credit. By basing loan pricing on the interbank rate, the framework strengthens monetary policy transmission, aligns Kenya with global benchmarks such as SOFR and SONIA, and enhances transparency by requiring banks to publish lending rates, premiums, and fees on both their websites and the Total Cost of Credit platform. While the approach promises lower costs for borrowers with strong credit profiles, higher-risk clients may face elevated charges, and overall lending rates will now be more responsive, but also more volatile given their closer link to interbank market conditions.
- Higher capital requirements: Following the enactment of the Business Laws (Amendment) Act, 2024, the Central Bank of Kenya (CBK) increased the minimum core capital requirement for commercial banks to Kshs 10.0 bn from the previous Kshs 1.0 bn, which had been in effect since 2012. The new framework requires lenders to comply gradually, starting with a minimum of Kshs 3.0 bn by the end of 2025, Kshs 5.0 bn by 2026, Kshs 6.0 bn by 2027, Kshs 8.0 bn by 2028, and full compliance at Kshs 10.0 bn by the end of 2029. The objective of this substantial increase is to enhance the resilience of the banking sector and ensure that institutions are well-capitalized to support economic development. However, CBK disclosures show that as of June 2025, 11 banks were still below the Kshs 3.0 bn threshold, requiring an additional Kshs 14.7 bn to meet the December 2025 deadline. These include Paramount Bank, M-Oriental, ABC Bank Kenya, Premier Bank, CIB International Bank, Middle East Bank Kenya, Development Bank of Kenya, UBA Kenya Bank, Credit Bank Plc, Access Bank Kenya and the Consolidated Bank of Kenya. To bridge the shortfall, banks are undertaking various strategies; Credit Bank is listing on the Unquoted Securities Platform (USP) to attract new investors and raise at least Kshs 1.7 bn, while M-Oriental Bank is seeking shareholder approval to waive pre-emptive rights and issue new shares to external investors, enabling it to raise capital beyond its current Kshs 2.5 bn core. Access Bank Kenya is relying on financial support from its Nigerian parent company and is expected to merge with National Bank of Kenya (NBK), following NBK’s acquisition by Access Bank Nigeria. Similarly, UBA Kenya has confirmed that it is seeking fresh capital from its parent company, UBA Plc in Nigeria, to address its Kshs 1.5 bn capital deficit. Meanwhile, Consolidated Bank, which is grappling with a negative core capital of Kshs 731.0 mn, is planning a rights issue and still awaiting long-delayed government support. A CBK stress test further warned that under a severe scenario where the non-performing loans ratio rises to 27.4%, the number of banks undercapitalized could increase to 12, with a funding gap of Kshs 19.8 bn. To address the shortfall, the regulator outlined three options: downgrading non-compliant institutions to microfinance banks until they mobilize the required funds, extending the Kshs 3.0 bn deadline, or amending the law to allow tiered capital requirements, as practiced in other jurisdictions. Earlier in 2025, CBK had asked 24 banks whose capital stood below the ultimate Kshs 10.0 bn target to submit capital-raising strategies, and by the April deadline, 22 had presented plans including capital injections, rights issues, strategic partnerships, mergers, and organic growth. CBK is reviewing these submissions as it monitors progress toward compliance.
- Lifting of moratorium on licensing of new commercial banks: In a significant policy shift, the Central Bank of Kenya (CBK) lifted the moratorium on licensing new commercial banks on July 1, 2025, ending a restriction that had been in place since November 2015. The moratorium had been introduced to address governance, risk management, and operational weaknesses in the sector, providing space for reforms. Over the past decade, the industry has undergone substantial strengthening, with improvements in legal and regulatory frameworks, a wave of mergers and acquisitions, and the entry of new strategic investors. With the moratorium now lifted, investors seeking to establish new banks must demonstrate the capacity to meet the revised minimum core capital requirement of Kshs 10.0 bn. This policy change reopens the door for greenfield licensing, marking a departure from the previous era where market entry was largely dependent on mergers and acquisitions.
- Digitization: In H1’2025, digitization continued to be a transformative force in the banking sector, significantly improving how banks operate and deliver services. There has been a significant increase in the adoption of mobile and online banking platforms as customers now prefer to perform banking transactions from the comfort of their homes, leading to a decline in the use of physical branches. For instance, most of the listed banks disclosed that the majority of transactions were conducted through alternative channels, with Equity Group and KCB Group reporting that 87.4% and 99.0% of their transactions, respectively, were done through non-branch channels as of end of H1’2025,
- Interest Rates: Interest rates were on a downward trajectory during the period under review. Notably, the yields on Kenyan government securities declined during the period under review, with the yield on the 91-day paper averaging 8.8% during the period, 7.4% points lower than the average of 16.2% in H1’2024. The significant declines in rates in H1’2025 led to a decrease in the listed bank’s interest income growth, softening to a weighted average drop of 1.9% in H1’2025, from a weighted average growth of 29.7% in H1’2024. However, the lower interest rate environment led to a substantial reduction in interest expense which declined by a weighted average of 20.6% in H1’2025, compared to the 58.6% growth in H1’2024 this decline in funding cost helped support overall profitability contributing to a 10.4% growth in net interest income in H1’2025,
- Regional Expansion through Mergers and Acquisitions: Kenyan banks are increasingly expanding their regional footprint, with subsidiaries contributing significantly to overall profitability. For instance, Equity Group reported that, regional subsidiaries contributed 46.0% of the Group’s Profit Before Tax (PBT) in H1’2025, down from 55.0% in the same period last year, demonstrating the continued importance of these subsidiaries to the group’s earnings. Additionally, KCB Group's subsidiaries contributed 32.0% of the group's PBT in H1’2025. In 2024, there was one acquisition agreement announcement between Access Bank plc and KCB Group.
- On April 14, 2025, the Central Bank of Kenya announced the acquisition of 100.0% shareholding of National Bank of Kenya Limited (NBK) by Access Bank Plc from KCB Group Plc, following CBK’s approval on April 4, 2025 under Section 13 (4) of the Banking Act, and approval by the Cabinet Secretary for the National Treasury and Economic Planning on April 10, 2025, pursuant to Section 9 of the Banking Act. As part of the transaction, CBK, on April 4, 2025, further approved the transfer of certain assets and liabilities of National Bank of Kenya Limited to KCB Bank Kenya Limited pursuant to Section 9 of the Banking Act. The acquisition and completion of the transaction was finalised on 30th May 2025 in accordance with the terms of the Agreement between the parties.
- On March 20, 2024 Access Bank Plc announced that it had entered into a share purchase agreement with KCB Group Plc that would allow Access Bank Plc to acquire 100% shareholding in National Bank of Kenya Limited (NBK) from KCB. Access Bank Plc is a wholly owned subsidiary of Access Holdings Plc listed on the Nigerian Exchange as Access Corporation. Notably, KCB Bank had acquired the National Bank of Kenya back in 2019 in a rescue deal that was supervised by the Central Bank of Kenya. The announcement followed the release of the Q1’2024 results for the KCB group, which revealed a decline in earnings with its Core earnings per share (EPS) declining by 8.3% to Kshs 11.7, from Kshs 12.7 in FY’2022. The transaction represents an important milestone for Access Bank as it moves closer to the achievement of its five-year strategic plan through increased scale in the Kenyan market. In the signed deal, Access Bank will pay multiples of 1.3x the book value of NBK, which stood at Kshs 10.6 bn as of end December 2023. This values the deal at about Kshs 13.3 bn with the actual figure to be announced when the transaction is completed.
- In April 2024, Sidian Bank disclosed that the founders of the bank and other nine individual shareholders relinquished a combined stake of 728,525 shares representing 16.6% stake to Pioneer General Insurance Limited, pioneer Life Investments Limited, Wizro Enterprises Limited, Afrah Limited, and Telesec Africa Limited. The transaction amounted to Kshs 0.8 bn translating to a price to book multiple (p/bv) of 1.0x. This follows an earlier transaction executed on October 2023 when Pioneer General Insurance, Wizpro Enterprise and Afram Limited bought 38.9% stake in the lender following a shareholders’ resolution passed on 20th September 2023 approving the sale.
The following are Mergers and Acquisitions that were completed in 2023:
-
- On January 30, 2023, the Central Bank of Kenya (CBK) announcedthat Commercial International Bank (Egypt) S.A.E (CIB) had completed the acquisition of an additional 49.0% shareholding of Mayfair CIB Bank Limited (MBL) at Kshs 5.0 bn following the earlier acquisition of 51.0% stake in MBL announced in April 2020. Consequently, MBL is now a fully owned subsidiary of CIB,
- On January 30, 2023, Equity Group Holdings , through Equity Bank Kenya Limited (EBKL) announced that it had completed the acquisition of certain assets and liabilities of the local Bank, Spire Bank Limited after obtaining all the required regulatory approvals. The completion of the acquisition followed the Assets and Liabilities Purchase Agreement, which was announced in September 2022, as highlighted in our Cytonn Weekly #37/2022. As such, Equity Bank Kenya Limited took over Spire Bank’s 12 branches as well as all existing depositors in Spire Bank, other than remaining deposits from its largest shareholder, Mwalimu Sacco. For more information, please see our Cytonn Monthly-January 2023,
- On March 17, 2023, the Central Bank of Kenya (CBK) announced that Premier Bank Limited Somalia (PBLS) had completed the acquisition of 62.5% shareholding of First Community Bank Limited (FCB) effective 27 March 2023. This came after receiving regulatory approvals from the CBK and the Cabinet Secretary for the National Treasury. FCB, which has been in operation since June 2008, is classified as a tier 3 bank in Kenya with 18 branches and a market share of 0.3% as at December 2022. The acquisition by Premier Bank Limited Somalia (PBLS), came at a time when FCB has been struggling to meet regulatory Capital adequacy requirements. For more information, please see our Cytonn Weekly #11/2023,
- On May 22, 2023, the Central Bank of Kenya (CBK) announced that Shorecap III, LP, a Private Equity fund governed by the laws of Mauritius, had acquired a 20.0% stake in Credit Bank Plc. The fund is managed by Equator Capital Partners LLC, and the acquisition took effect from June 15, 2023. While the CBK initially did not reveal the value of the deal, it has since been disclosed that Shorecap III, LP paid Ksh 0.7 billion for the 20.0% stake, valuing the bank at Ksh 3.64 bn. Shorecap III, LP assumed control of 7,289,928 ordinary shares, which make up 20.0% of the Bank’s ordinary shares. The funds helped lift Credit Bank from a regulatory capital breach. For additional details, refer to our Cytonn Weekly #21/2023,
- On December 1, 2023 Equity Group Holdings Plc (EGH) announced that it had successfully completed the acquisition of its Rwandan Subsidiary, Compagnie Générale de Banque (Cogebanque) Plc, marking a significant milestone in its regional expansion strategy. Equity Group now holds 198,250 shares representing 99.1% of the issued share capital of COGEBANQUE, following receipt of all regulatory and corporate approvals, officially making COGEBANQUE its subsidiary. EGH made the announcement it had entered into a binding agreement with the Government of Rwanda, Rwanda Social Security Board, and other investors of Compagnie Generale De Banque (Cogebanque) Plc Limited to acquire a 91.9% stake in the Rwanda based lender on June 14, 2023. Notably, EGH signed a share purchase agreement with the Sellers on July 28, 2023, committing to buy 183,854 shares at a rate of 297,406 Rwandan Francs per share upon completion on December 1, 2023, giving EGH ownership of 99.1% of the issued share capital. Concurrently, EGH proposed to purchase all outstanding shares from the other shareholders of Cogebanque, aiming to own up to 100% of Cogebanque’s issued shares,
Below is a summary of the deals in the last 10 years that have either happened, been announced or expected to be concluded:
|
Cytonn Report: Banking Sector Deals and Acquisitions |
||||||
|
Acquirer |
Bank Acquired |
Book Value at Acquisition (Kshs bn) |
Transaction Stake |
Transaction Value (Kshs bn) |
P/Bv Multiple |
Date |
|
Access Bank PLC (Nigeria) |
National Bank of Kenya |
10.6 |
100.00% |
13.3 |
1.3x |
Apr-25 |
|
Pioneer General Insurance and four other companies |
Sidian Bank |
5.0 |
16.57% |
0.8 |
1.0x |
Apr-24 |
|
Pioneer General Insurance and two other companies |
Sidian Bank |
5.0 |
38.91% |
2.0 |
1.0x |
Oct-23 |
|
Equity Group |
Cogebanque PLC ltd |
5.7 |
91.13% |
6.7 |
1.3x |
Dec-23 |
|
Shorecap III |
Credit Bank Plc |
3.6 |
20.00% |
0.7 |
1.0x |
Jun-23 |
|
Premier Bank Limited |
First Community Bank |
2.8 |
62.50% |
Undisclosed |
N/A |
Mar-23 |
|
KCB Group PLC |
Trust Merchant Bank (TMB) |
12.4 |
85.00% |
15.7 |
1.5x |
Dec-22 |
|
Equity Group |
Spire Bank |
Unknown |
Undisclosed |
Undisclosed |
N/A |
Sep-22* |
|
Access Bank PLC (Nigeria)* |
Sidian Bank |
4.9 |
83.40% |
4.3 |
1.1x |
June-22* |
|
KCB Group |
Banque Populaire du Rwanda |
5.3 |
100.00% |
5.6 |
1.1x |
Aug-21 |
|
I&M Holdings PLC |
Orient Bank Limited Uganda |
3.3 |
90.00% |
3.6 |
1.1x |
Apr-21 |
|
KCB Group** |
ABC Tanzania |
Unknown |
100.00% |
0.8 |
0.4x |
Nov-20* |
|
Co-operative Bank |
Jamii Bora Bank |
3.4 |
90.00% |
1 |
0.3x |
Aug-20 |
|
Commercial International Bank |
Mayfair Bank Limited |
1.0 |
51.00% |
Undisclosed |
N/A |
May-20* |
|
Access Bank PLC (Nigeria) |
Transnational Bank PLC. |
1.9 |
100.00% |
1.4 |
0.7x |
Feb-20* |
|
Equity Group ** |
Banque Commerciale Du Congo |
8.9 |
66.50% |
10.3 |
1.2x |
Nov-19* |
|
KCB Group |
National Bank of Kenya |
7.0 |
100.00% |
6.6 |
0.9x |
Sep-19 |
|
CBA Group |
NIC Group |
33.5 |
53%.47% |
23 |
0.7x |
Sep-19 |
|
Oiko Credit** |
Credit Bank |
3.0 |
22.80% |
1 |
1.5x |
Aug-19 |
|
CBA Group** |
Jamii Bora Bank |
3.4 |
100.00% |
1.4 |
0.4x |
Jan-19 |
|
AfricInvest Azure |
Prime Bank |
21.2 |
24.20% |
5.1 |
1.0x |
Jan-18 |
|
KCB Group |
Imperial Bank |
Unknown |
Undisclosed |
Undisclosed |
N/A |
Dec-18 |
|
SBM Bank Kenya |
Chase Bank Ltd |
Unknown |
75.00% |
Undisclosed |
N/A |
Aug-18 |
|
DTBK |
Habib Bank Kenya |
2.4 |
100.00% |
1.8 |
0.8x |
Mar-17 |
|
SBM Holdings |
Fidelity Commercial Bank |
1.8 |
100.00% |
2.8 |
1.6x |
Nov-16 |
|
M Bank |
Oriental Commercial Bank |
1.8 |
51.00% |
1.3 |
1.4x |
Jun-16 |
|
I&M Holdings |
Giro Commercial Bank |
3.0 |
100.00% |
5 |
1.7x |
Jun-16 |
|
Mwalimu SACCO |
Equatorial Commercial Bank |
1.2 |
75.00% |
2.6 |
2.3x |
Mar-15 |
|
Centum |
K-Rep Bank |
2.1 |
66.00% |
2.5 |
1.8x |
Jul-14 |
|
GT Bank |
Fina Bank Group |
3.9 |
70.00% |
8.6 |
3.2x |
Nov-13 |
|
Average |
|
|
73.3% |
|
1.3x |
|
|
Average: 2013 to 2018 |
|
|
73.5% |
|
1.7x |
|
|
Average: 2019 to 2024 |
|
|
73.2% |
|
1.0x |
|
|
* Announcement Date ** Deals that were dropped |
||||||
In H1’2025, the average acquisition valuations for banks have remained unchanged at 1.3x, similar to what was recorded in a similar period in 2024. As such, the valuations still remain low compared to historical prices paid, as highlighted in the chart below;
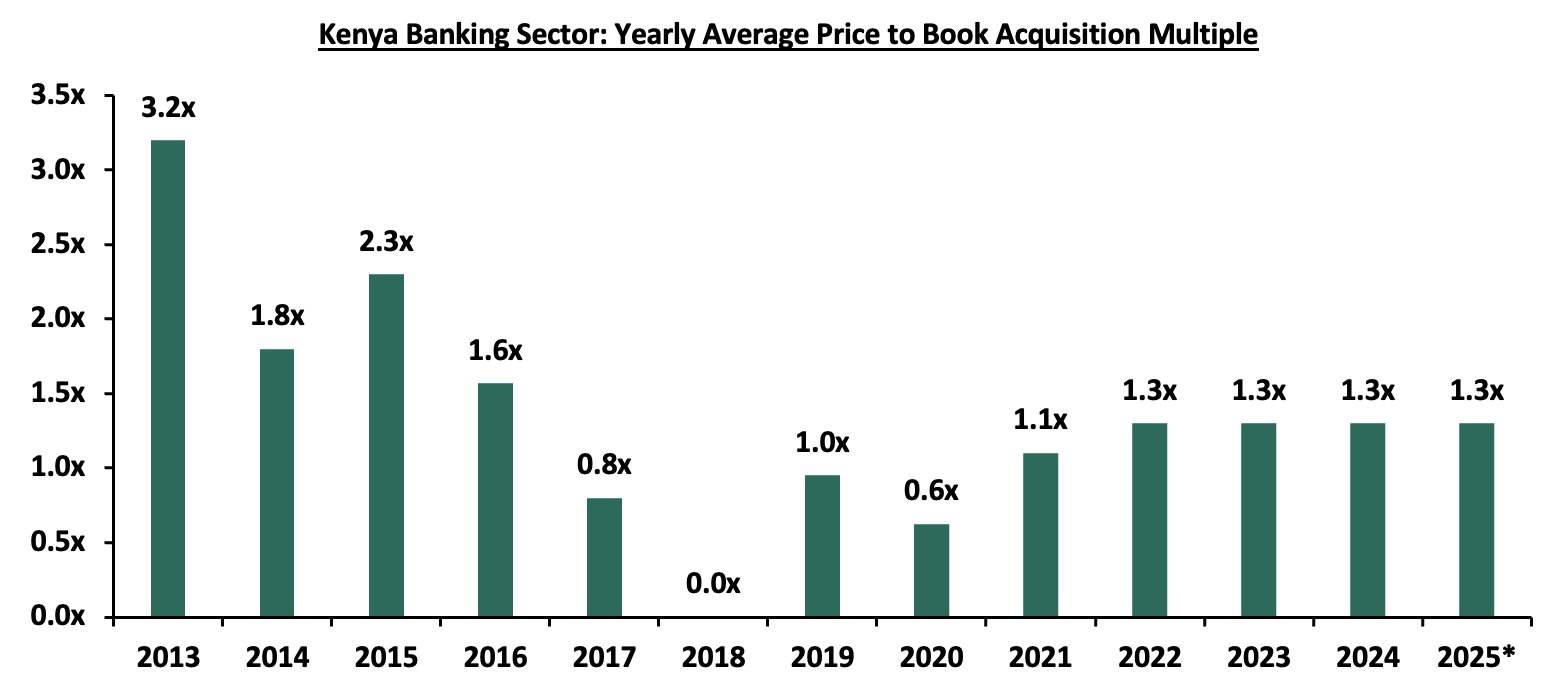
2025* data as of end of H1’2025
As at the end of H1’2025, the number of commercial banks in Kenya stood at 38, same as in H1’2024, but lower than the 43 licensed banks in FY’2015. The ratio of the number of banks per 10 million population in Kenya now stands at 6.6x, which is a reduction from 9.0x in FY’2015, demonstrating continued consolidation in the banking sector. However, despite the ratio improving, Kenya still remains overbanked as the number of banks remains relatively high compared to the African major economies. To bring the ratio to 5.6x, we ought to reduce the number of banks from the current 38 banks to about 30 banks. This is partly expected to be supported by the enactment of The Business Laws (Amendment) Act 2024 that mandated a significant increase in the minimum core capital for banks to Kshs 10.0 bn from the previous Kshs 1.0 bn that had been in effect since 2012. To facilitate compliance, lenders below this threshold were directed to incrementally grow the figure over a 5-year period, required to close 2025 with a minimum core capital of Kshs 3.0 bn, rising to Kshs 5.0 bn by the end of 2026, and full compliance at Kshs 10.0 bn by the end of 2029. The new capital requirement is likely to trigger further mergers and acquisitions (M&As), especially for smaller lenders that may struggle to meet the threshold, potentially reducing the number of banks even further. However, the effect could be muted by the lifting of the moratorium which ended on 1st July 2025. The chart below shows the commercial bank ratio per 10 million people across select African nations in comparison to Kenya;
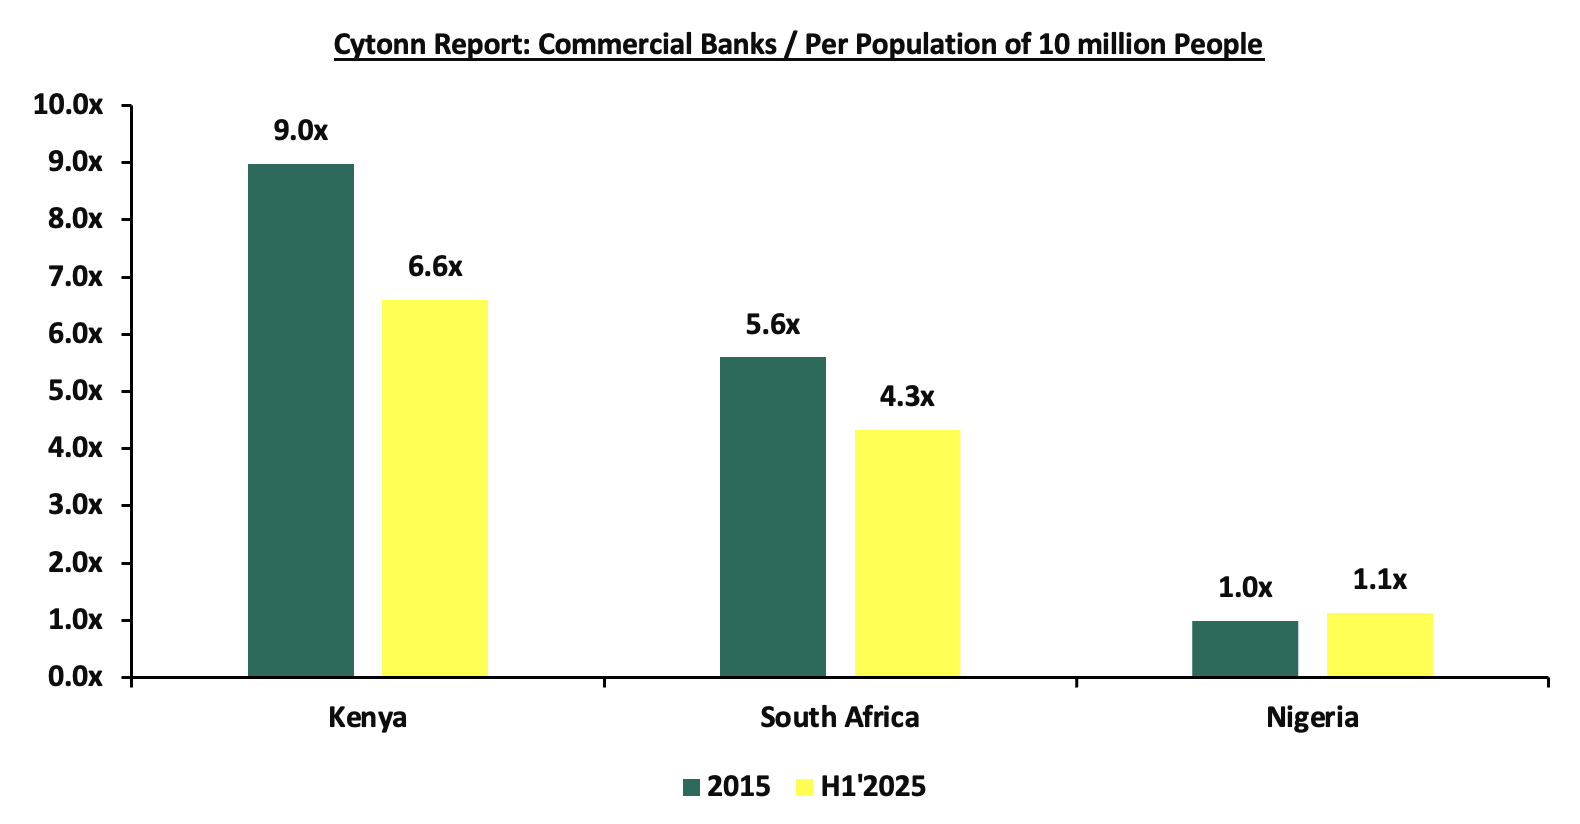
Source: World Bank, Central Bank of Kenya, South Africa Reserve Bank, Central Bank of Nigeria
Additionally, on April 16, 2025, the Central Bank of Kenya (CBK), announced that with effect from July 1, 2025, it will lift the moratorium on licensing of new commercial banks that had been in place since November 2015. The moratorium was introduced in response to governance, risk management, and operational issues within the banking sector, aiming to create room for reforms. Since then, Kenya’s banking sector has seen notable progress, including stronger legal and regulatory frameworks, increased mergers and acquisitions, and the entry of new local and international strategic investors. With the moratorium now lifted, new entrants into Kenya’s banking sector must prove their ability to meet the revised minimum core capital requirement of Kshs 10.0 bn. This move opens the door for investors to apply for greenfield licenses, unlike the previous arrangement where entry was heavily reliant on mergers and acquisitions. Over the past decade, the moratorium contributed to a reduction in the number of banks in Kenya, to 38 currently from 43 in 2015.
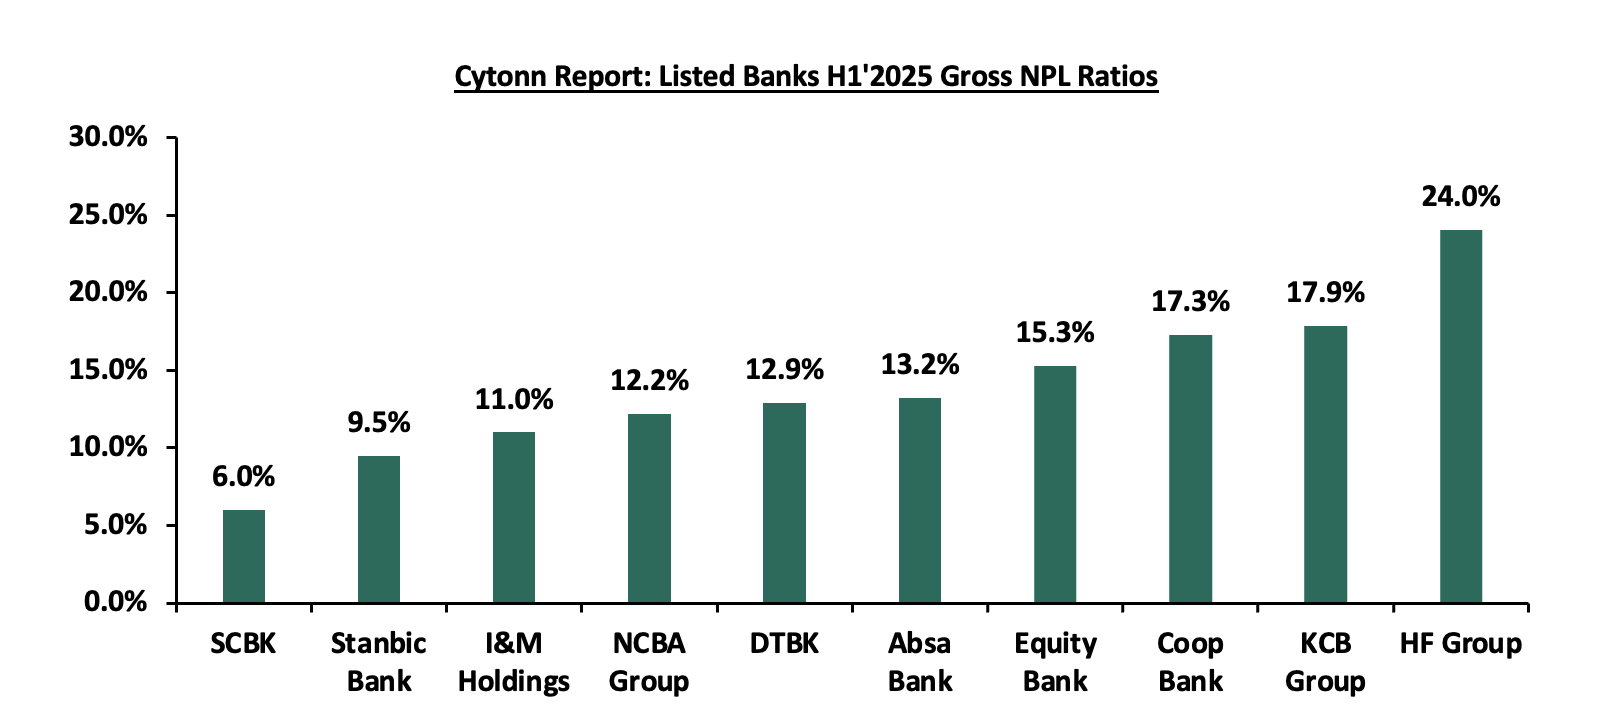
- Asset Quality: Asset quality for listed banks deteriorated in H1’2025, with the weighted average Gross Non-Performing Loan ratio (NPL) increasing by 0.2% points to 13.6%, from 13.4% recorded in H1’2024. The performance remained 2.0% points above the ten-year average of 11.6%. Notably, 6 out of the 10 listed banks recorded a decrease in their NPL ratios, signalling an improvement in asset quality even as credit risk remains elevated, albeit showing signs of moderation following recent monetary policy easing and improving lending conditions. However, most banks experienced a faster growth in gross non-performing loans compared to the growth in gross loans. As a result, the overall gross non-performing loans (NPL) ratio in the banking industry increased by 1.3 percentage points, rising to 17.6% in June 2025 from 16.3% in June 2024. Additionally, Absa Bank Plc’s NPL ratio rose the most by 1.7% points to 13.2%, from 11.5% in H1’2024, while Equity Group’s NPL ratio increased by 1.4% points to 15.3%, from 13.9% in H1’2024. Absa’s asset quality worsened due to a 12.3% rise in Gross Non-Performing Loans to Kshs 44.2 bn in H1’2025 from Kshs 39.4 bn in H1’2024, coupled with a 2.5% decline in gross loans to Kshs 334.4 bn from Kshs 343.0 bn in H1’2024. Similarly, Equity Group’s asset quality worsened due to a 16.2% rise in Gross Non-Performing Loans to Kshs 139.4 bn in H1’2025 from Kshs 119.9 bn in H1’2024, which outpaced the 5.9% growth in gross loans to Kshs 912.0 bn from Kshs 861.6 bn in H1’2024. The chart below highlights the asset quality for the listed banks in H1’2025:
The chart below highlights the asset quality trend for the listed banks:
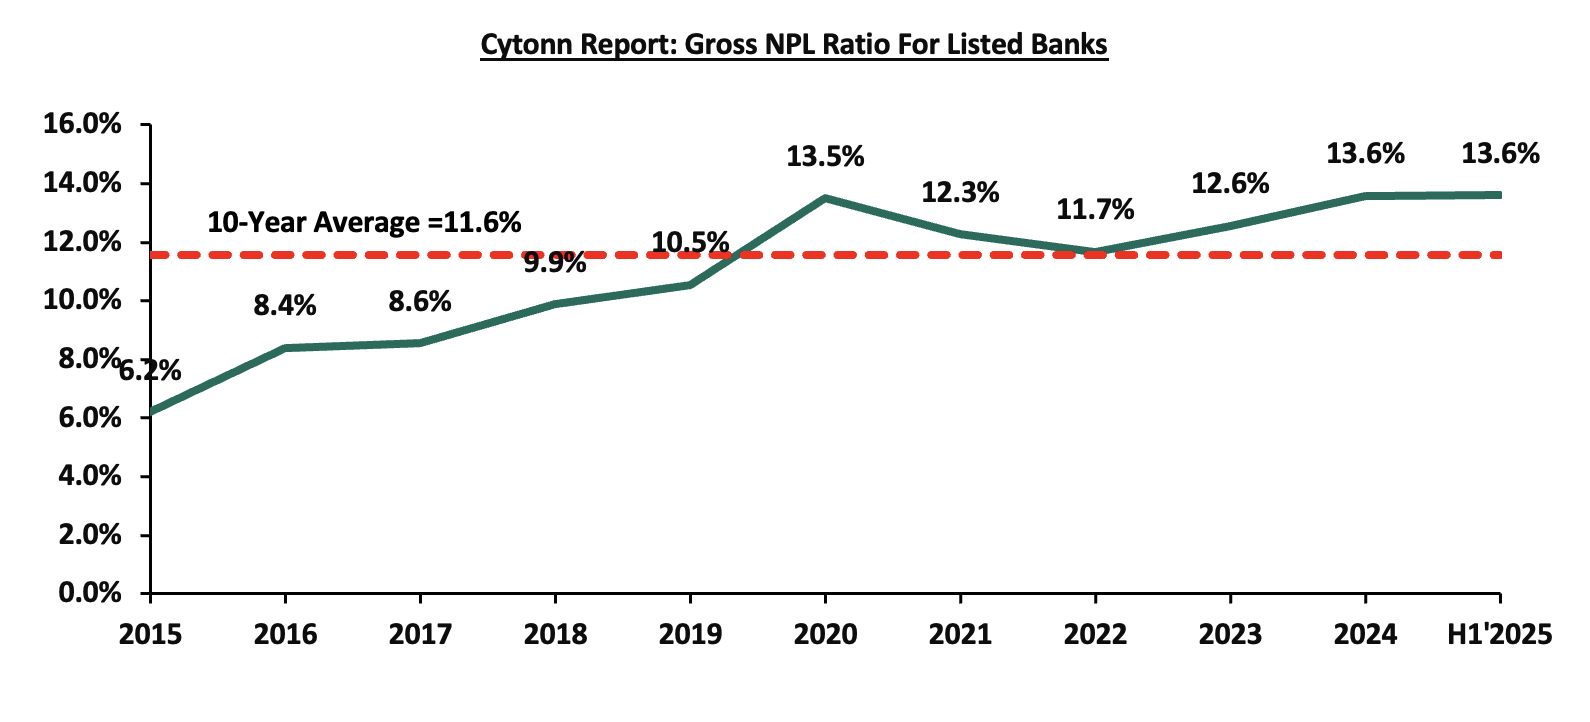
However, the deterioration in listed banks' asset quality was mitigated by an improvement in Standard Chartered Bank’s asset quality, with the Gross NPL ratio decreasing by 2.4% points to 6.0% in H1’2025 from 8.4% in H1’2024. This was attributable to the 29.4% decrease in gross non-performing loans to Kshs 9.6 bn from Kshs 13.6 bn in H1’2024, which outpaced the 0.5% decrease in gross loans to Kshs 160.0 bn from Kshs 160.9 bn in H1’2024. Diamond Trust Bank Kenya’s asset quality improved with the Gross NPL ratio decreasing by 0.6% points to 12.9% in H1’2025 from 13.5% in H1’2024. This was attributable to the 7.6% increase in gross loans to Kshs 306.7 bn from Kshs 285.0 bn in H1’2024, outpacing the 2.7% increase in gross non-performing loans to Kshs 39.6 bn from Kshs38.6 bn in H1’2024. A total of seven out of the ten listed Kenyan banks recorded an improvement in asset quality, supported by enhanced credit risk management and early signs of economic recovery as the recent Central Bank Rate (CBR) cuts begin to filter through the economy, following the credit challenges experienced in 2024, despite an overall increase in lending during the period. In a bid to curb inflation and support the Shilling the Monetary Policy Committee (MPC) had adopted a tight monetary policy stance, raising the Central Bank Rate (CBR) to 13.00% in February 2024 and maintaining it at that rate for its two subsequent sittings up to July 2024. As a result of the high interest rates, the private sector credit growth was severely constrained recording contractions of 1.1% and 1.4% in the months of November and December 2024 respectively. The chart below shows the private sector credit growth:
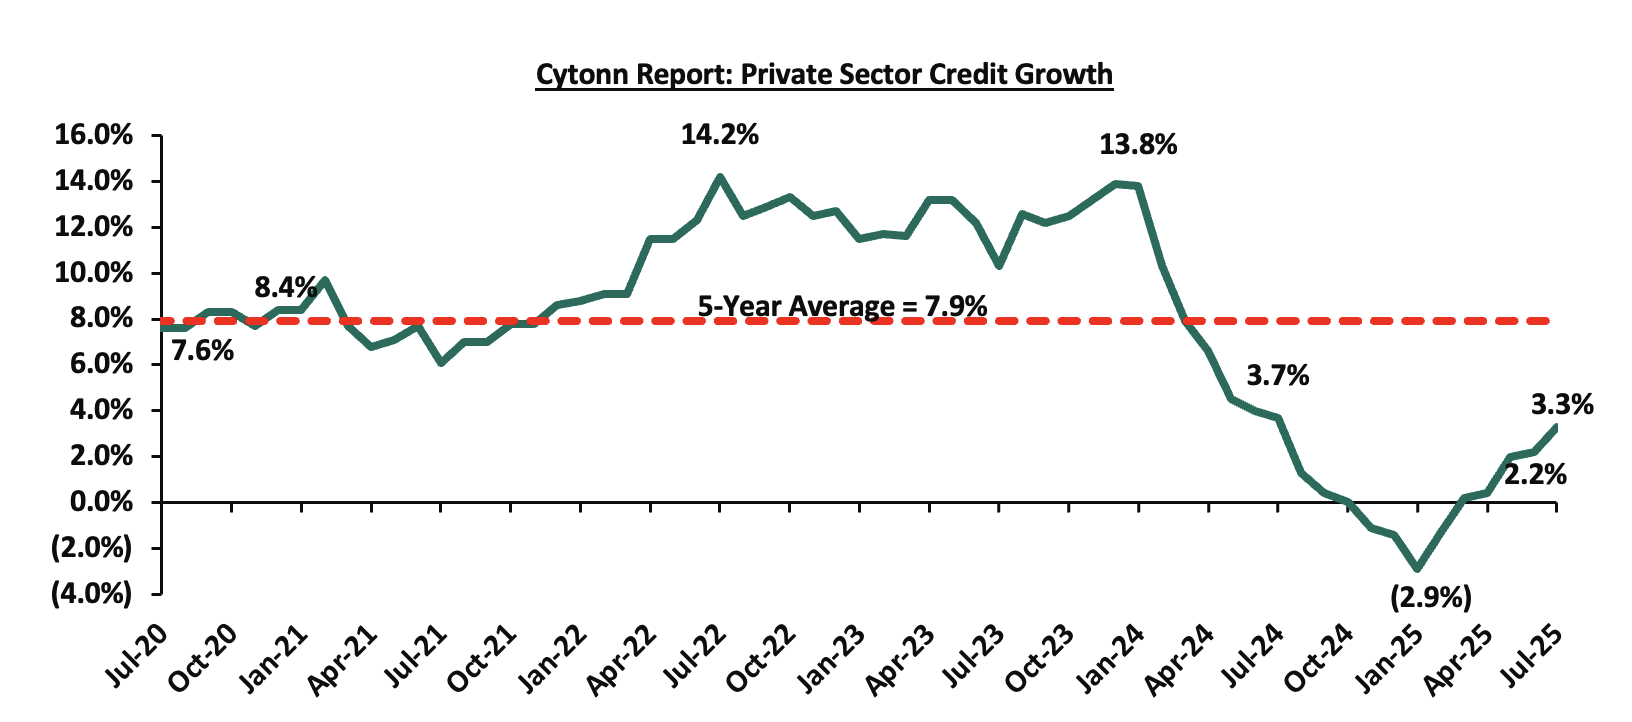
However, the Central Bank of Kenya has lowered the Central Bank Rate (CBR) by a cumulative 350 basis points, from 13.0% in July 2024 to 9.5% in August 2025, signalling a gradual easing of monetary policy following the successful stabilization of the currency and anchoring of inflation. This reduction in CBR is expected to continue to support credit growth and ease financial pressures on borrowers. Notably, growth in private sector credit grew by 3.3% in July 2025 from 2.2% in June 2025 and a contraction of 2.9% in January 2025, mainly attributed to the dissipation of exchange rate valuation effects on foreign currency-denominated loans due to the appreciation of the Shilling and increased demand attributable to declining lending interest rates. Going forward, we expect credit risk to decline gradually but remain at relatively elevated levels compared to previous years, owing to the improving business environment and a stronger and stable Shilling.
The table below highlights the asset quality for the listed banking sector:
|
Cytonn Report: Listed Banks Asset Quality |
||||||
|
|
H1’2025 NPL Ratio* |
H1’2024 NPL Ratio** |
% point change in NPL Ratio |
H1’2025 NPL Coverage* |
H1’2024 NPL Coverage** |
% point change in NPL Coverage |
|
Absa Bank Kenya |
13.2% |
11.5% |
1.7% |
66.6% |
62.3% |
4.3% |
|
Equity Group |
15.3% |
13.9% |
1.4% |
62.4% |
58.8% |
3.6% |
|
Cooperative Bank |
17.3% |
16.7% |
0.6% |
65.8% |
59.5% |
6.3% |
|
Stanbic Holdings |
9.5% |
9.5% |
(0.0%) |
82.7% |
75.0% |
7.7% |
|
NCBA Bank |
12.2% |
12.2% |
(0.1%) |
65.5% |
59.8% |
5.7% |
|
HF Group |
24.0% |
24.2% |
(0.1%) |
75.4% |
75.6% |
(0.2%) |
|
KCB Group |
17.9% |
18.1% |
(0.2%) |
64.3% |
59.5% |
4.8% |
|
I&M Group |
11.0% |
11.4% |
(0.5%) |
65.4% |
57.9% |
7.5% |
|
Diamond Trust Bank |
12.9% |
13.5% |
(0.6%) |
45.9% |
44.4% |
1.5% |
|
Standard Chartered Bank |
6.0% |
8.4% |
(2.5%) |
81.4% |
85.1% |
(3.7%) |
|
Mkt Weighted Average* |
13.6% |
13.4% |
0.2% |
67.2% |
63.1% |
4.1% |
|
*Market cap weighted as at 19/09/2025 |
||||||
|
**Market cap weighted as at 13/09/2024 |
||||||
Key take-outs from the table include;
- Asset quality for the listed banks deteriorated in H1’2025, with market weighted average NPL increasing by 0.2% points to 13.6% from a 13.4% in H1’2024. The worsening of asset quality was mainly driven by a deterioration in Absa Group, Equity Group and Co-operative bank’s asset quality with their NPL ratio increasing by 1.7%, 1.4%, and 0.6% points respectively,
- Absa Group and Equity Group had the highest NPL ratio jumps by 1.7% and 1.4% points respectively to 13.2% and 15.3%, from 11.5% and 13.9% respectively in H1’2024. Absa Group’s asset quality worsened due to a 12.3% rise in Gross Non-Performing Loans to Kshs 44.2 bn in H1’2025 from Kshs 39.4 bn in H1’2024, coupled with the 2.5% decline in gross loans to Kshs 334.4 bn from Kshs 343.0 bn in H1’2024. Similarly, Equity Group’s asset quality worsened due to a 16.2% rise in Gross non-performing loans to Kshs 139.4 bn in H1’2025 from Kshs 119.9 bn in H1’2024, outpacing a 5.9% increase in gross loans to Kshs 912.0bn from Kshs 861.6 bn in H1’2024, and,
- Market weighted average NPL Coverage for the listed banks increased by 4.1% points to 67.2% in H1’2025, from 63.1% recorded in H1’2024, majorly on the back of increased NPL coverage recorded by Stanbic Bank, I&M Group, Co-operative Bank, NCBA Bank, KCB Group, Absa Group, Equity Group and Diamond Trust Bank Kenya by 7.7%, 7.5%, 6.3%, 5.7%, 4.8%, 4.3%, and 3.6% points respectively in H1’2025. However, the NPL coverage ratio of Standard Chartered Bank Kenya and HF Group decreased by 3.7% and 0.2% points respectively in H1’2025.
Section II: Summary of the Performance of the Listed Banking Sector in H1’2025:
The table below highlights the performance of the banking sector, showing the performance using several metrics, and the key take-outs of the performance;
|
Cytonn Report: Kenyan Listed Banks Performance H1’2025 |
|||||||||||||||
|
Bank |
Core EPS Growth |
Interest Income Growth |
Interest Expense Growth |
Net Interest Income Growth |
Net Interest Margin |
Non-Funded Income Growth |
NFI to Total Operating Income |
Growth in Total Fees & Commissions |
Deposit Growth |
Growth in Government Securities |
Loan to Deposit Ratio |
Loan Growth |
Return on Average Equity |
COF |
YIEA |
|
I&M Group |
37.9% |
3.1% |
(20.3%) |
23.7% |
8.4% |
12.9% |
25.4% |
14.8% |
2.4% |
47.8% |
67.6% |
2.1% |
19.6% |
6.0% |
14.0% |
|
Diamond Trust Bank |
23.6% |
0.1% |
(10.8%) |
11.7% |
6.0% |
(5.0%) |
27.7% |
8.9% |
11.9% |
17.1% |
59.7% |
7.7% |
11.3% |
6.1% |
11.8% |
|
Equity Group |
16.8% |
(0.6%) |
(18.0%) |
9.1% |
7.5% |
(4.4%) |
40.8% |
3.1% |
1.6% |
21.6% |
62.5% |
4.3% |
22.8% |
3.9% |
11.1% |
|
NCBA Group |
12.6% |
(10.7%) |
(39.3%) |
26.7% |
6.7% |
(2.9%) |
41.0% |
(0.3%) |
(6.0%) |
(1.3%) |
58.0% |
(7.0%) |
21.0% |
6.1% |
12.4% |
|
Absa Bank Kenya |
9.1% |
(8.3%) |
(21.3%) |
(2.9%) |
9.8% |
3.3% |
29.0% |
13.8% |
2.3% |
70.3% |
84.4% |
(3.6%) |
27.0% |
4.1% |
13.4% |
|
Co-operative Bank |
8.4% |
12.6% |
(3.3%) |
23.1% |
8.6% |
(8.2%) |
32.5% |
(3.4%) |
7.9% |
25.5% |
71.4% |
4.2% |
18.8% |
5.7% |
13.7% |
|
KCB Group |
8.0% |
3.2% |
(13.1%) |
12.7% |
8.4% |
(11.3%) |
29.9% |
1.8% |
(0.3%) |
(2.7%) |
73.7% |
6.1% |
23.4% |
4.5% |
12.5% |
|
Stanbic Group |
(9.3%) |
(10.5%) |
(35.3%) |
(5.8%) |
5.4% |
0.8% |
39.2% |
12.7% |
(2.5%) |
47.1% |
67.2% |
(2.2%) |
18.2% |
5.5% |
11.4% |
|
Standard Chartered Bank |
(21.4%) |
(10.5%) |
(29.4%) |
(7.4%) |
9.4% |
(29.1%) |
30.7% |
(2.0%) |
5.1% |
51.1% |
52.4% |
1.9% |
27.5% |
1.7% |
10.8% |
|
HF Group |
(52.2%) |
19.6% |
(6.7%) |
53.3% |
5.9% |
17.9% |
29.2% |
19.6% |
16.6% |
96.0% |
74.2% |
2.7% |
6.8% |
6.8% |
12.3% |
|
H1'2025 Mkt Weighted Average* |
8.4% |
(1.9%) |
(20.6%) |
10.4% |
8.0% |
(5.9%) |
33.9% |
4.2% |
1.7% |
27.9% |
67.0% |
1.6% |
22.3% |
4.6% |
12.3% |
|
H1’2024 Mkt Weighted Average** |
28.9% |
29.7% |
58.6% |
17.6% |
7.2% |
13.6% |
38.0% |
10.8% |
16.1% |
(9.3%) |
66.5% |
0.4% |
22.7% |
4.7% |
11.8% |
|
*Market cap weighted as at 19/09/2025 |
|||||||||||||||
|
**Market cap weighted as at 13/09/2024 |
|||||||||||||||
Key takeaways from the table include:
- The listed banks recorded a 8.4% growth in core Earnings per Share (EPS) in H1’2025, compared to the weighted average growth of 28.9% in H1’2024, an an indication of weaker performance on the back of a 9% decline in non-funded income in H1’2025, compared to a growth of 13.6% in H1’2024.This was majorly attributable to a decline in foreign exchange income due to reduced dollar demand and lower transaction volumes weighing down on fees and commissions income. The performance during the period was mainly weighed down by a 5.9% weighted average decline in non-funded income, but however supported by a 10.4% weighted average growth in net interest income,
- Investments in government securities investments by listed banks increased significantly in H1’2025, having recorded a market-weighted average growth of 27.9%, from the 9.3% decrease recorded in H1’2024, with 8 of the 10 listed banks recording increases in government securities investments. HF Group and Absa Bank Kenya recorded the largest increases of 96.0% and 70.3% respectively. KCB Group and NCBA Group however recorded decreases in government securities investments of 2.7% and 1.3% respectively.
- The listed banks’ Net loans and advances to customers recorded a weighted average growth of 1.6% in H1’2025, an increase from the 0.4% growth recorded in H1’2024, an indicating Increased lending activity supported by easing borrowing costs even as credit risk remained relatively elevated.
- Interest income recorded a weighted average decline of 1.9% in H1’2025, compared to 29.7% in H1’2024. However, interest expenses recorded a market-weighted average decline of 20.7% in H1’2025 compared to a growth of 58.6% in H1’2024. Consequently, net interest income recorded a weighted average growth of 10.4% in H1’2025, albeit lower than the 17.6% growth recorded in H1’2024, on the back of easing monetary policy leading to lower lending and deposit rates,
- Notably, non-funded income growth softened during the year, as evidenced by non-funded income weighted average decline of 5.9% in H1’2025 compared to a weighted average growth of 13.6% in H1’2024. The performance was largely attributable to the decrease in foreign exchange income recorded by the banks during the period as a result of decreased dollar demand in the country. Additionally, listed banks recorded a weighted average growth of 4.2% in total fees and commissions income in H1’2025 compared to a weighted growth of 10.8% in H1’2024, and,
- The listed banks recorded a 22.3% weighted average growth on return on average equity (RoaE), 0.4% points lower than the 22.7% growth registered in H1’2024. However, the entire banking sector’s Return On Equity (ROE) stood at 23.0% as of June 2025, a 0.1% points decrease from the 23.1% recorded in March 2025. On a global level, the Kenyan banking sector continues to record high profitability compared to other economies in the world, as highlighted in the chart below:
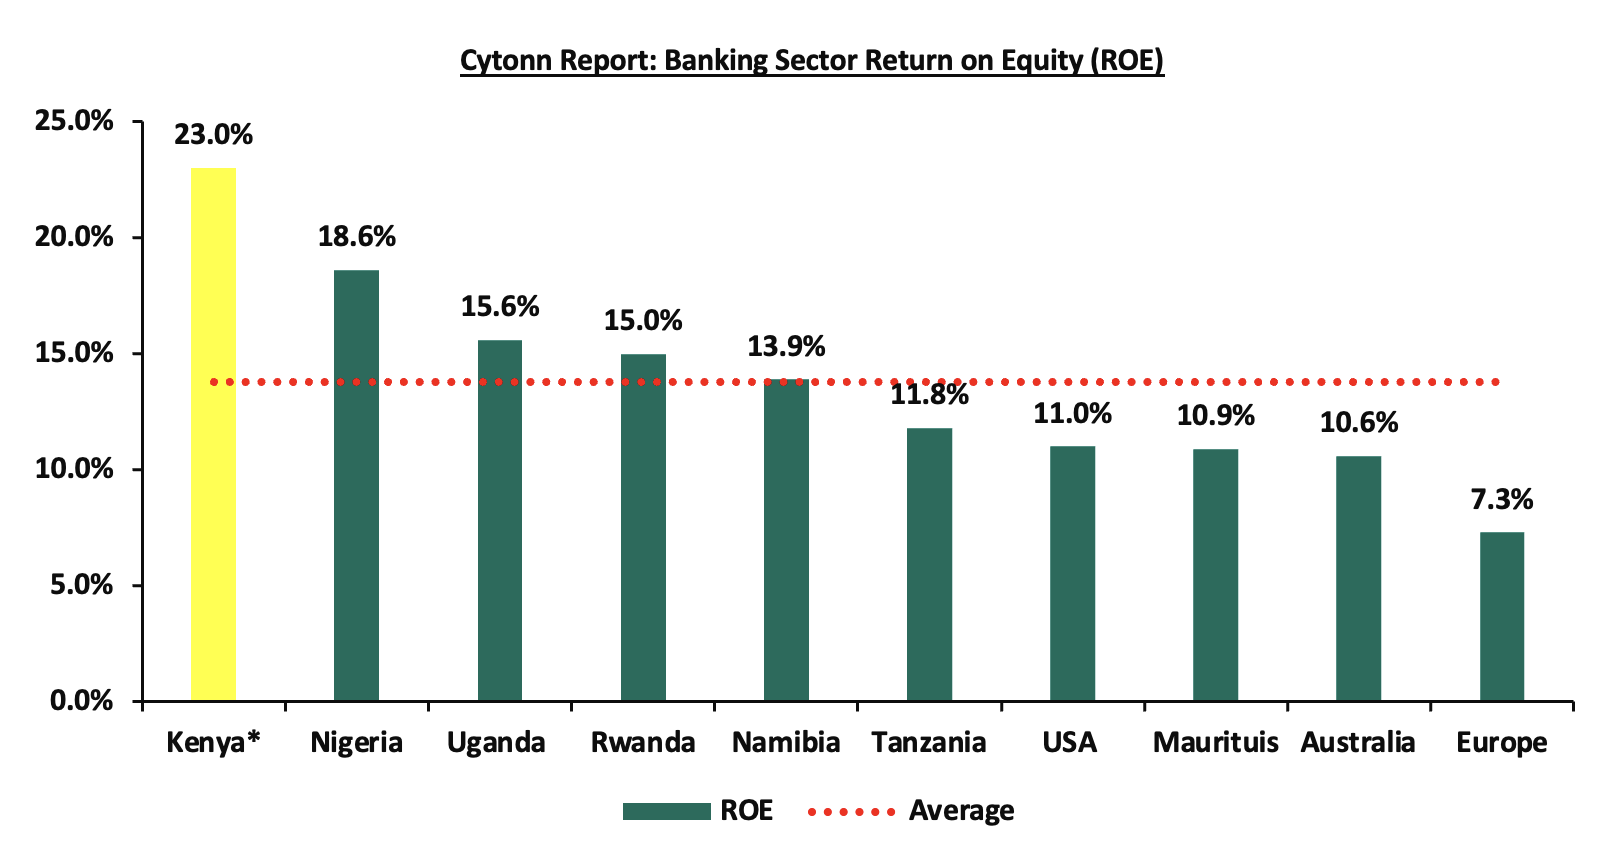
Source: Cytonn research
* Figure as of June 2025
Section III: The Focus Areas of the Banking Sector Players Going Forward:
The banking sector witnessed a slowdown in profitability during the period under review, with the Core Earnings Per Share (EPS) increasing by 8.4% compared to the 28.9% growth registered last year in a similar period, this is primarily due to a 5.9% decline in non-funded income in H1’2025, compared to a growth of 10.9% in H1’2024.This was majorly attributable to a decline in foreign exchange income due to reduced dollar demand and lower transaction volumes weighing down on fees and commissions income. Notably, all 6 of the 10 listed banks recorded a decline in their Non-funded income in H1’2025. However, while there were expectations of an improved business environment following the continued monetary policy easing as evidenced by a lower Central Bank Rate (CBR), standing at 9.50% as of August 2025 and a stronger and stable Shilling, the broader economic performance has not shown significant improvement. As such, it remains uncertain whether banks will reduce their provisioning levels in the near term. Any changes in provisioning will largely depend on sustained economic performance and ease in credit risk. To note, growth in general provisions for the listed banks recorded a reduced weighted growth of 5.1% in H1’2025, compared to a growth of 19.1% in H1’2024. Based on the current operating environment, we believe the future performance of the banking sector will be shaped by the following key factors:
- Growth in Interest income: Going forward, we expect interest income growth to remain a key driver in the banking industry. With the recent easing of monetary policy by the Central Bank of Kenya, which lowered the Central Bank Rate (CBR) by 25 basis points to 9.50% in August 2025, signals a gradual reduction in borrowing costs. This is likely to support an increase in credit uptake, expanding banks' loan books and consequently boosting interest income. Additionally, the continued use of banks' risk-based lending models will enable banks to effectively price their risk, further contributing to the growth of interest income.,
- Revenue Diversification: In H1’2025, non-funded income (NFI) recorded a 5.9% weighted average decline, a reversal from the 13.6% weighted growth in H1’2024, majorly attributable to a decline in foreign exchange income resulting from reduced demand for the USD following the appreciation and the relative stability of the currency. In addition, the slowdown in fees and commissions income, one of the key components of NFI, also contributed to the weaker performance, with growth moderating to 4.2% in H1’2025 from 10.8% in H1’2024, reflecting softer transactional volumes and a potential tapering in digital revenue momentum. Notably, this deceleration occurred with 6 of the 10 listed Banks recording a decrease in their non-funded income. As a result of the decline in non-funded income (NFI) the weighted average contribution of NFI to total operating income came in at 33.9% in H1’2025,4.1% points lower than the 38.0% weighted average growth contribution recorded in H1’2024 and as such, there still exists an opportunity for the sector to further increase NFI contributions to revenue given the continuous adoption of digitization,
- Growth in Loans and Advances: While 7 of the listed banks experienced modest positive loan growth, 3 out of the 10 listed banks recorded larger negative growth in loans and advances to customers, resulting in a weighted average growth in loans of 1.6% relative to the 0.4% loan growth recorded in a similar period in 2024. However, with the consistent ease in the Central Bank Rate (CBR) recently, borrowing costs are expected to decline. This reduction is anticipated to support credit growth by encouraging increased borrowing by the private sector and easing financial pressures on borrowers. To drive further loan growth, banks must leverage opportunities such as risk-based lending models, improved customer segmentation, and expanding access to credit in underserved sectors, and,
- Regional Expansion and Further Consolidation: Consolidation remains a key theme going forward with the current environment offering opportunities for larger banks with a sufficient capital base to expand and take advantage of the market's low valuations, as well as further consolidate out smaller and weaker banks. Notably, the majority of the bigger banks have continued to cushion over unsystematic risks specific to the local market by expanding their operations into other African nations. Banks such as KCB and Equity Group have been leveraging on expansion and consolidation, which has largely contributed to their increased asset base as well as earnings growth. Additionally, we expect the increased capital requirements imposed on banks to further accelerated consolidation, as only well-capitalized banks are able to meet these thresholds while pursuing expansion opportunities. As such, we expect to see a continued expansion trend aimed at revenue optimization.
Section IV: Brief Summary and Ranking of the Listed Banks:
As per our analysis of the banking sector from a franchise value and a future growth opportunity perspective, we carried out a comprehensive ranking of the listed banks. For the franchise value ranking, we included the earnings and growth metrics as well as the operating metrics shown in the table below in order to carry out a comprehensive review of the banks:
|
Cytonn Report: Listed Banks Earnings, Growth and Operating Metrics H1’2025 |
||||||||
|
Bank |
Loan to Deposit Ratio |
Cost to Income (With LLP) |
Return on Average Capital Employed |
Deposits/ Branch (bn) |
Gross NPL Ratio |
NPL Coverage |
Tangible Common Ratio |
Non-Funded Income/Revenue |
|
Absa Bank |
84.4% |
46.6% |
27.0% |
4.2 |
13.2% |
66.6% |
16.5% |
29.0% |
|
HF Group |
74.2% |
75.7% |
6.8% |
2.4 |
24.0% |
75.4% |
21.4% |
29.2% |
|
Coop Bank |
71.4% |
55.3% |
18.8% |
2.6 |
17.3% |
65.8% |
18.7% |
32.5% |
|
Stanbic Bank |
67.2% |
55.7% |
18.2% |
11.6 |
9.5% |
82.7% |
15.5% |
39.2% |
|
I&M Holdings |
67.6% |
58.7% |
19.6% |
3.9 |
11.0% |
65.4% |
17.0% |
25.4% |
|
KCB Group |
73.7% |
58.6% |
23.4% |
3.3 |
17.9% |
64.3% |
14.9% |
29.9% |
|
DTBK |
59.7% |
67.3% |
11.3% |
3.1 |
12.9% |
45.9% |
14.5% |
27.7% |
|
Equity Bank |
62.5% |
58.5% |
22.8% |
3.3 |
15.3% |
62.4% |
13.9% |
40.8% |
|
NCBA Group |
58.0% |
61.6% |
21.0% |
3.1 |
12.2% |
65.5% |
16.9% |
41.0% |
|
SCBK |
52.4% |
50.6% |
27.5% |
13.2 |
6.0% |
81.4% |
16.3% |
30.7% |
|
Weighted Average H1'2025 |
67.0% |
56.4% |
22.3% |
5.0 |
13.6% |
67.2% |
15.9% |
33.9% |
|
Market cap weighted as at 19/09/2025 |
||||||||
The overall ranking was based on a weighted average ranking of Franchise value (accounting for 60.0%) and intrinsic value (accounting for 40.0%). The Intrinsic Valuation is computed through a combination of valuation techniques, with a weighting of 40.0% on Discounted Cash-flow Methods, 35.0% on Residual Income, and 25.0% on Relative Valuation, while the Franchise ranking is based on a bank’s operating metrics, meant to assess efficiency, asset quality, diversification, and profitability, among other metrics. The overall H1’2025 ranking is as shown in the table below:
|
Cytonn Report: Listed Banks H1’2025 Rankings |
|||||
|
Bank |
Franchise Value Rank |
Intrinsic Value Rank |
Weighted Rank Score |
H1'2024 Rank |
H1'2025 Rank |
|
SCBK |
2 |
2 |
2.0 |
3 |
1 |
|
Absa Bank |
1 |
5 |
2.6 |
1 |
2 |
|
KCB Group |
5 |
3 |
4.2 |
9 |
3 |
|
I&M Holdings |
3 |
7 |
4.6 |
8 |
4 |
|
NCBA Group |
7 |
4 |
5.8 |
5 |
5 |
|
DTBK |
10 |
1 |
6.4 |
7 |
6 |
|
Coop Bank |
4 |
10 |
6.4 |
4 |
6 |
|
Stanbic Bank |
6 |
8 |
6.8 |
2 |
8 |
|
Equity Bank |
8 |
6 |
7.2 |
6 |
9 |
|
HF Group |
9 |
9 |
9.0 |
10 |
10 |
Major Take-outs from the H1’2025 Ranking are:
- Standard Chartered Bank rose to position 1 in H1’2025, from a rank of position 3 in H1’2024, mainly supported by strong franchise value score and intrinsic value score, attributable to increase in the tangible common equity ratio by 0.6% points to 16.4% in H1’2025, from 15.8% in H1’2024 coupled with a decrease in the bank’s Gross NPL ratio by 2.5% points to 6.0% in H1’2025 from 8.4% in H1’2024,
- KCB Bank climbed up 6 places to rank at position 3 in H1’2025, up from position 9 in H1’2024 supported by significant improvement in intrinsic value score. Its performance attributable to the increase in its return on average equity by 0.7% points to 23.4% in H1’2025 from 22.7% in H1’2024 coupled with a decrease in the bank’s Gross NPL ratio by 0.2% points to 17.9% in H1’2025, from 18.1% in H1’2024. Notably, the bank’s Net Interest Margin increased by 1.3% points to 8.4% in H1’2025 from 7.1% in H1’2024,
- Stanbic Bank slid 6 places to rank at position 8 in H1’2025, down from position 2 in H1’2024, attributable a decline in franchise value score mainly on the back of 0.3% points decline in Return on average equity to 18.2% in H1’2025 from the 18.5% recorded in H1’2024, coupled with the 7.8% points increase in its cost to income without LLPs to 48.3% in H1’2025, from 40.4% in H1’2024.
For more information, see our Cytonn H1’2025 Listed Banking Sector Review full report.
Disclaimer: The views expressed in this publication are those of the writers where particulars are not warranted. This publication, which is in compliance with Section 2 of the Capital Markets Authority Act Cap 485A, is meant for general information only and is not a warranty, representation, advice, or solicitation of any nature. Readers are advised in all circumstances to seek the advice of a registered investment advisor.

- Talk to us
- Kenya
- P.O Box 20695 - 00200, Nairobi, Kenya
- Cell +254709101200
- Tel +254709101200
- WhatsApp +254741676635
- United States
- +254709101200
- DOWNLOAD OUR APP
-


- Kenya
- 8th Floor, Pinetree Plaza, Kaburu Drive, Ngong Road, Nairobi, Kenya
- USA
- Suite 1150, 1775 Eye Street NW, USA, Washington DC 20006, USA
- Investments
- High Yield
- Private Equity
- Real Estate
- Real Estate
- RiverRun Estates
- Cytonn Towers
- The Ridge
- Taraji Heights
- The Alma