Nairobi Metropolitan Area (NMA) Infrastructure Report 2024, and Cytonn Weekly #51/2024
By Investments Team, Dec 22, 2024
Executive Summary
Fixed Income
During the week, T-bills were undersubscribed for the second consecutive week, with the overall undersubscription rate coming in at 54.5%, albeit lower than the undersubscription rate of 69.2% recorded the previous week. Investors’ preference for the shorter 91-day paper persisted, with the paper receiving bids worth Kshs 6.3 bn against the offered Kshs 4.0 bn, translating to an oversubscription rate of 157.9%, higher than the oversubscription rate of 146.2% recorded the previous week. The subscription rates for the 182-day and 364-day papers decreased to 30.4% and 37.3% respectively, from 30.8% and 76.7% recorded the previous week. The government accepted a total of Kshs 13.0 bn worth of bids out of Kshs 13.1 bn bids received, translating to an acceptance rate of 99.7%. The yields on the government papers recorded a mixed performance, with the yields on the 182-day increasing marginally by 2.0 bps to 10.02% from the 10.00% recorded the previous week, while the yields on the 364-day and 91-day papers decreased by 22.0 bps and 7.7 bps to 11.54% and 9.95% respectively from 11.76% and 10.03% respectively recorded the previous week;
In the primary bond market, the government is looking to raise Kshs 30.0 bn through the reopened fifteen year and twenty-five-year fixed coupon bonds; FXD1/2018/15 and FXD1/2022/25 with tenors to maturity of 8.3 years and 22.8 years respectively. The bonds will be offered at fixed coupon rates of 12.7% and 14.2% respectively. Our bidding range for the reopened bonds are 13.45%-13.85% and 15.65%-16.00% for the FXD1/2018/15 and FXD1/2022/25 respectively;
Also, during the week, the National Treasury gazetted the revenue and net expenditures for the fifth month of FY’2024/2025 , highlighting that the total revenue collected as at the end of November 2024 amounted to Kshs 940.9 bn, equivalent to 35.8% of the revised estimates of Kshs 2,631.4 bn for FY’2024/2025 and is 85.8% of the prorated estimates of Kshs 1,096.4 bn;
Equities
During the week, the equities market was on an upward trajectory, with NASI gaining the most by 2.2%, while NSE 20, NSE 25 and NSE 10 gained by 1.5%, 1.5% and 1.3% respectively, taking the YTD performance to gains of 39.2%, 37.9%, 32.3% and 26.5% for NSE 10, NSE 25, NASI and NSE 20 respectively. The equities market performance was mainly driven by gains recorded by large-cap stocks such as Bamburi, Absa and DTBK of 11.5%, 9.4%, and 9.1% respectively. The gains were however weighed down by losses recorded by large-cap stocks such as Equity Group and EABL which lost by 4.3%, and 2.8% respectively; During the week, HF Group released the results of its earlier approved rights issue, announcing that the rights were oversubscribed, with the oversubscription rate coming in at 138.3% having received offers worth Ksh 6.4 bn against the offered Ksh 4.6 bn. Notably, the Group accepted 474,201,310 shares under the entitlement option, representing a take-up rate of 61.7% of the 769,228,336 shares offered. This indicates that investors subscribed to fewer entitlement shares than were available, resulting in an undersubscription for this category;
Real Estate
During the week, the Kenya National Bureau of Statistics (KNBS) released the Leading Economic Indicators (LEI) October 2024 Report, which highlighted the performance of major economic indicators.
Also, during the week, the Kenyan government has introduced a Kshs 10.0 bn low-cost mortgage scheme aimed at facilitating rural home construction. This initiative, funded by the Housing Levy, offers single-digit interest loans repayable over ten years, with individual applicants eligible for up to Kshs 5.0 mn and multiple-family dwellings up to Kshs 10.0 mn;
During the week, Shelter Afrique Development Bank (ShafDB) and the African Union (AU) signed a Memorandum of Understanding (MOU) to address Africa's significant housing deficit, estimated at 53.0 mn units with a financing gap of USD 1.4 tn.
Additionally, during the week, the Kenyan Cabinet approved the implementation of a city bus project aimed at enhancing urban mobility and reducing traffic congestion in Nairobi. The project involves the introduction of a fleet of modern buses to operate within the city, providing residents with a reliable and efficient public transportation option.
On the Unquoted Securities Platform, Acorn D-REIT and I-REIT traded at Kshs 25.4 and Kshs 22.2 per unit, respectively, as per the last updated data on 31st October 2024. The performance represented a 27.0% and 11.0% gain for the D-REIT and I-REIT, respectively, from the Kshs 20.0 inception price. Additionally, ILAM Fahari I-REIT traded at Kshs 11.0 per share as of 31st October 2024, representing a 45.0% loss from the Kshs 20.0 inception price;
Focus of the Week
Infrastructure refers to the fundamental systems required for the proper functioning of utility services such as water, transport, energy, internet, sewer and drainage networks, among others. These systems are essential for any region to realize economic growth and social development, specifically these networks support economic activities and improve the quality of life. In Kenya, the government continues to actively support infrastructure development through several financial strategies including Public Private Partnerships (PPPs), the issuance of infrastructure bonds, debt financing, and substantial budgetary allocations with its main focus being on road networks;
Investment Updates:
- Weekly Rates: Cytonn Money Market Fund closed the week at a yield of 17.1 % p.a. To invest, dial *809# or download the Cytonn App from Google Play store here or from the Appstore here;
- We continue to offer Wealth Management Training every Monday, from 10:00 am to 12:00 pm. The training aims to grow financial literacy among the general public. To register for any of our Wealth Management Trainings, click here;
- If interested in our Private Wealth Management Training for your employees or investment group, please get in touch with us through wmt@cytonn.com;
- Cytonn Insurance Agency acts as an intermediary for those looking to secure their assets and loved ones’ future through insurance namely; Motor, Medical, Life, Property, WIBA, Credit and Fire and Burglary insurance covers. For assistance, get in touch with us through insuranceagency@cytonn.com;
- Cytonn Asset Managers Limited (CAML) continues to offer pension products to meet the needs of both individual clients who want to save for their retirement during their working years and Institutional clients that want to contribute on behalf of their employees to help them build their retirement pot. To more about our pension schemes, kindly get in touch with us through pensions@cytonn.com;
Hospitality Updates:
- We currently have promotions for Staycations. Visit cysuites.com/offers for details or email us at sales@cysuites.com;
Money Markets, T-Bills Primary Auction:
During the week, T-bills were undersubscribed for the second consecutive week, with the overall subscription rate coming in at 54.5%, albeit lower than the subscription rate of 69.2% recorded the previous week. Investors’ preference for the shorter 91-day paper persisted, with the paper receiving bids worth Kshs 6.3 bn against the offered Kshs 4.0 bn, translating to an oversubscription rate of 157.9%, higher than the oversubscription rate of 146.2% recorded the previous week. The subscription rates for the 182-day and 364-day papers decreased to 30.4% and 37.3% respectively, from 30.8% and 76.7% recorded the previous week. The government accepted a total of Kshs 13.0 bn worth of bids out of Kshs 13.1 bn bids received, translating to an acceptance rate of 99.7%. The yields on the government papers recorded a mixed performance, with the yields on the 182-day increasing marginally by 2.0 bps to 10.02% from the 10.00% recorded the previous week, while the yields on the 364-day and 91-day papers decreased by 22.0 bps and 7.7 bps to 11.54% and 9.95% respectively from 11.76% and 10.03% respectively recorded the previous week;
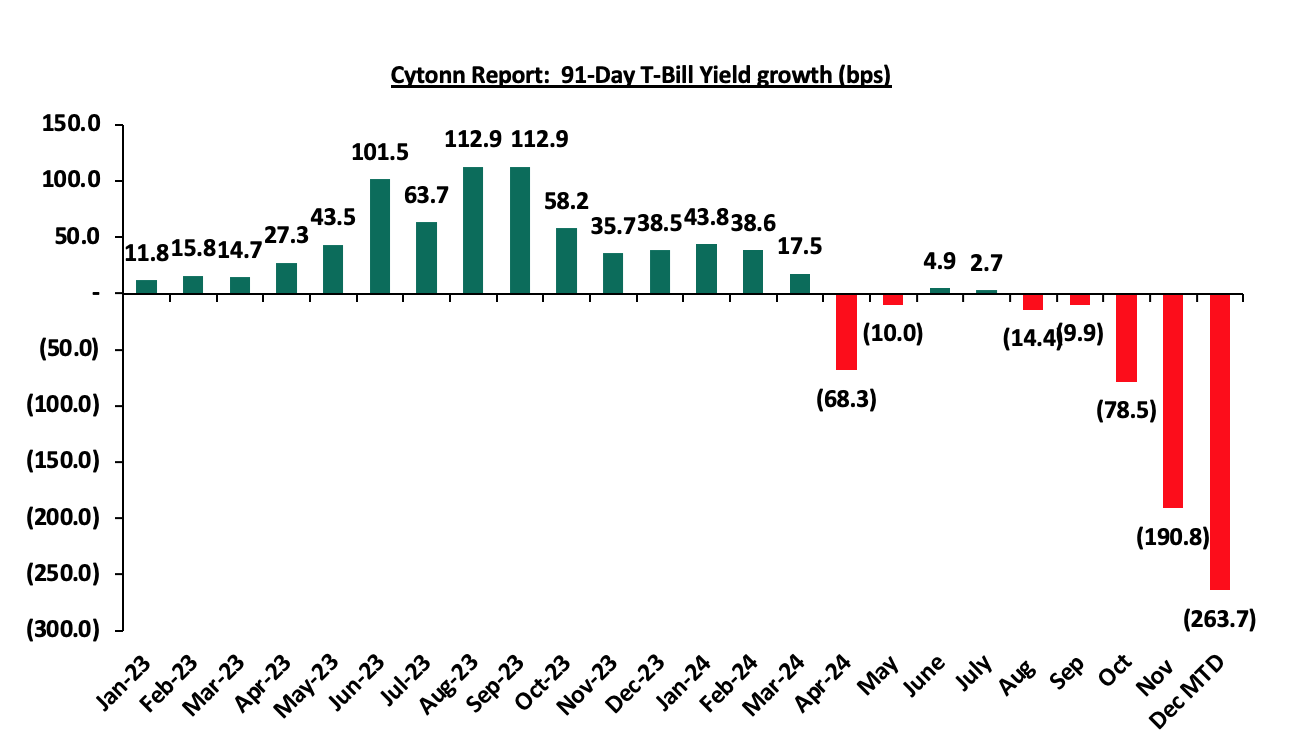
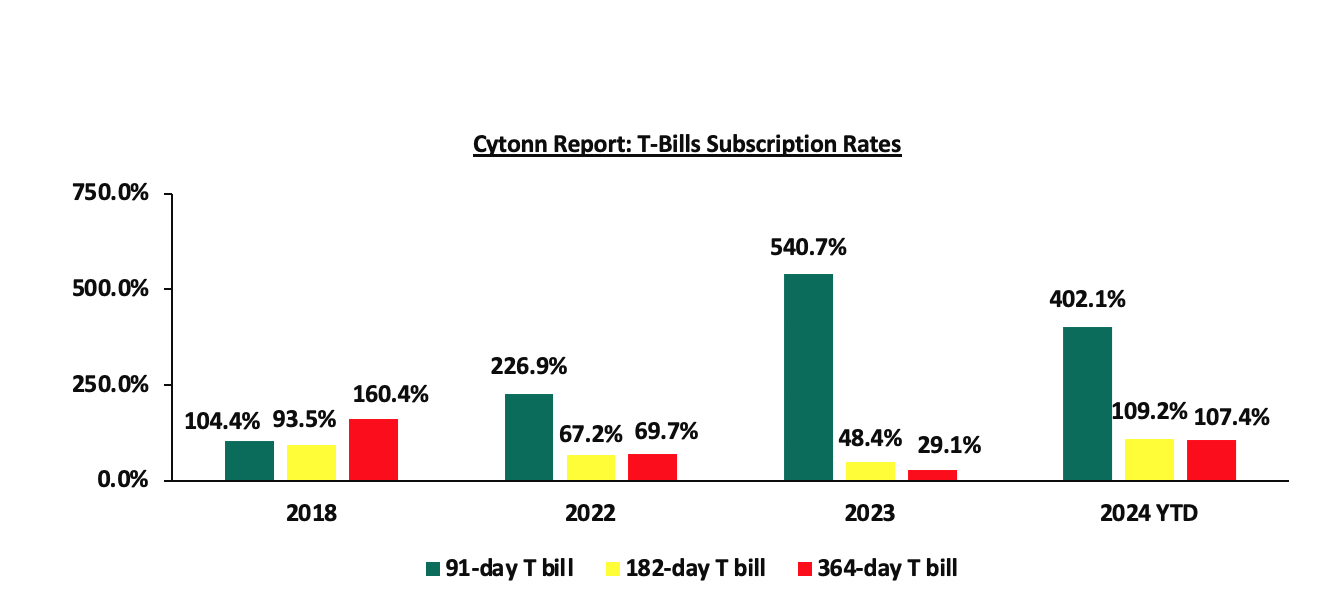
The chart below compares the overall average T-bill subscription rates obtained in 2018, 2022, 2023, and 2024 Year-to-date (YTD):
In the primary bond market, the government is looking to raise Kshs 30.0 bn through the reopened fifteen year and twenty-five-year fixed coupon bonds; FXD1/2018/15 and FXD1/2022/25 with tenors to maturity of 8.3 years and 22.8 years respectively. The bonds will be offered at fixed coupon rates of 12.7% and 14.2% respectively. Our bidding range for the reopened bonds are 13.45%-13.85% and 15.65%-16.00% for the FXD1/2018/15 and FXD1/2022/25 respectively;
Money Market Performance:
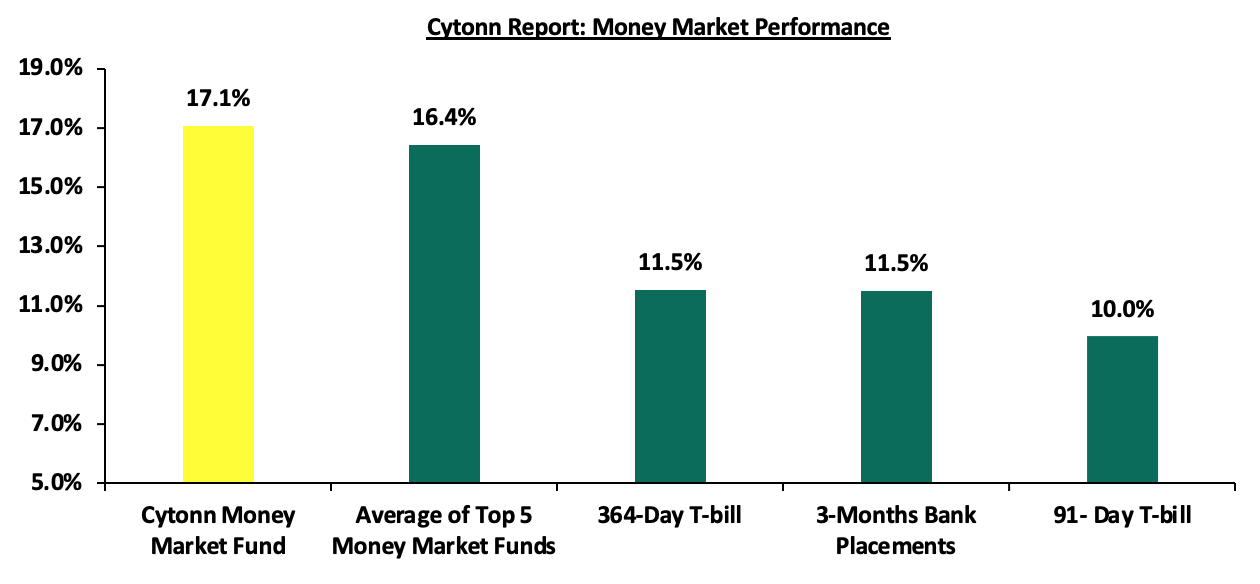
In the money markets, 3-month bank placements ended the week at 11.5% (based on what we have been offered by various banks), and yields on the government papers recorded mixed performance, with the yields on the 364-day and 91-day papers decreasing by 22.0 bps and 7.7 bps to 11.5% and 10.0% respectively, from 11.8% and 10.0% respectively recorded the previous week.The yield on the Cytonn Money Market Fund decreased by 14.0 bps to close the week at 17.1% from 17.2% recorded the previous week, while the average yields on the Top 5 Money Market Funds decreased by 1.8 bps to close the week at 16.4%, from 16.5% recorded the previous week.
The table below shows the Money Market Fund Yields for Kenyan Fund Managers as published on 20th November 2024:
|
Cytonn Report: Money Market Fund Yield for Fund Managers as published on 20th December 2024 |
||
|
Rank |
Fund Manager |
Effective Annual Rate |
|
1 |
Cytonn Money Market Fund (Dial *809# or download the Cytonn app) |
17.1% |
|
2 |
Lofty-Corban Money Market Fund |
16.6% |
|
3 |
Gulfcap Money Market Fund |
16.3% |
|
4 |
Orient Kasha Money Market Fund |
16.2% |
|
5 |
Etica Money Market Fund |
16.1% |
|
6 |
Kuza Money Market fund |
16.0% |
|
7 |
Ndovu Money Market Fund |
15.5% |
|
8 |
Arvocap Money Market Fund |
15.4% |
|
9 |
Mali Money Market Fund |
15.2% |
|
10 |
Jubilee Money Market Fund |
14.9% |
|
11 |
Faulu Money Market Fund |
14.2% |
|
12 |
Sanlam Money Market Fund |
14.1% |
|
13 |
Genghis Money Market Fund |
14.0% |
|
14 |
Enwealth Money Market Fund |
13.9% |
|
15 |
Madison Money Market Fund |
13.9% |
|
16 |
Dry Associates Money Market Fund |
13.9% |
|
17 |
Nabo Africa Money Market Fund |
13.8% |
|
18 |
Apollo Money Market Fund |
13.4% |
|
19 |
Co-op Money Market Fund |
13.3% |
|
20 |
KCB Money Market Fund |
13.3% |
|
21 |
British-American Money Market Fund |
13.3% |
|
22 |
GenAfrica Money Market Fund |
13.2% |
|
23 |
Old Mutual Money Market Fund |
13.1% |
|
24 |
ICEA Lion Money Market Fund |
13.0% |
|
25 |
CIC Money Market Fund |
12.7% |
|
26 |
Absa Shilling Money Market Fund |
12.7% |
|
27 |
Mayfair Money Market Fund |
12.5% |
|
28 |
AA Kenya Shillings Fund |
12.2% |
|
29 |
Ziidi Money Market Fund |
12.2% |
|
30 |
Stanbic Money Market Fund |
11.8% |
|
31 |
Equity Money Market Fund |
8.5% |
Source: Business Daily
Liquidity:
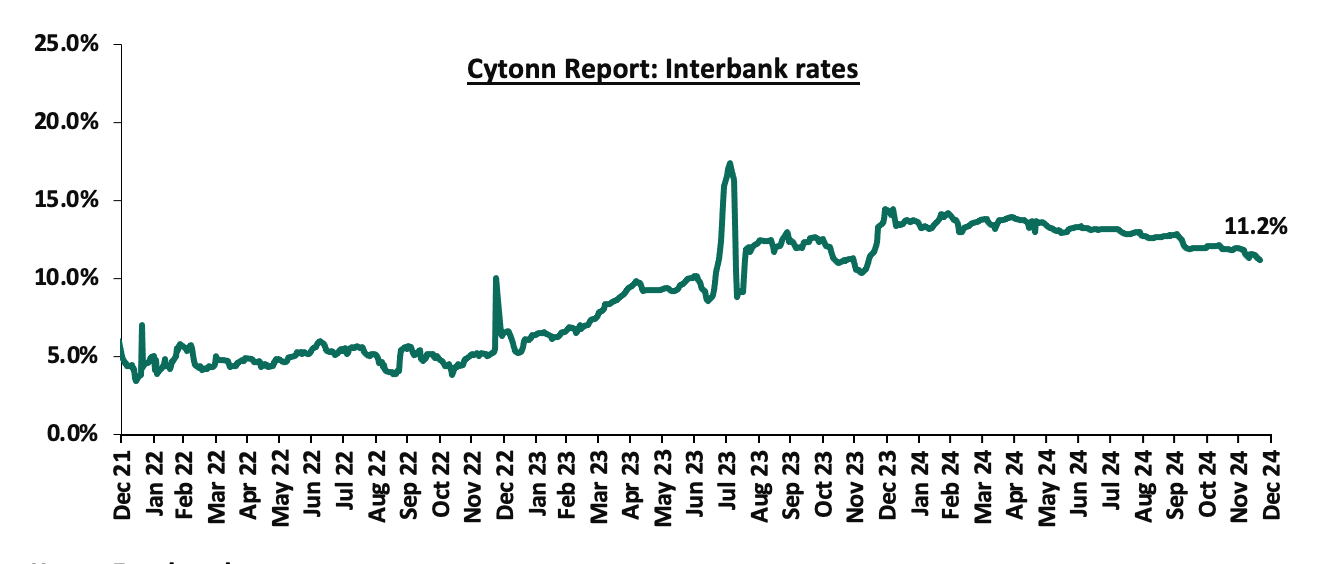
During the week, liquidity in the money markets marginally eased, with the average interbank rate decreasing by 11.4 bps, to 11.3% from the 11.5% recorded the previous week, partly attributable to government payments that offset tax remittances. The average interbank volumes traded decreased by 38.2% to Kshs 33.6 bn from Kshs 54.4 bn recorded the previous week. The chart below shows the interbank rates in the market over the years:
Kenya Eurobonds:
During the week, the yields on Kenya’s Eurobonds were on an upward trajectory, with the yield on the 7-year Eurobond issued in 2024 increasing the most by 53.4 bps to 9.9% from 9.4% recorded the previous week. The table below shows the summary performance of the Kenyan Eurobonds as of 19th December 2024;
|
Cytonn Report: Kenya Eurobonds Performance |
||||||
|
|
2018 |
2019 |
2021 |
2024 |
||
|
Tenor |
10-year issue |
30-year issue |
7-year issue |
12-year issue |
13-year issue |
7-year issue |
|
Amount Issued (USD) |
1.0 bn |
1.0 bn |
0.9 bn |
1.2 bn |
1.0 bn |
1.5 bn |
|
Years to Maturity |
3.2 |
23.2 |
2.4 |
7.4 |
9.5 |
6.2 |
|
Yields at Issue |
7.3% |
8.3% |
7.0% |
7.9% |
6.2% |
10.4% |
|
1-Jan-24 |
9.8% |
10.2% |
10.1% |
9.9% |
9.5% |
|
|
2-Dec-24 |
8.6% |
8.6% |
7.9% |
9.7% |
10.1% |
9.8% |
|
12-Dec-24 |
8.4% |
9.8% |
7.7% |
9.4% |
9.4% |
9.4% |
|
13-Dec-24 |
8.5% |
9.9% |
7.7% |
9.5% |
9.4% |
9.5% |
|
16-Dec-24 |
8.4% |
9.9% |
7.7% |
9.5% |
9.4% |
9.5% |
|
17-Dec-24 |
8.5% |
9.9% |
7.9% |
9.6% |
9.6% |
9.6% |
|
18-Dec-24 |
8.5% |
9.9% |
7.9% |
9.6% |
9.6% |
9.6% |
|
19-Dec-24 |
8.9% |
10.2% |
8.2% |
9.9% |
9.9% |
9.9% |
|
Weekly Change |
0.5% |
0.4% |
0.5% |
0.5% |
0.5% |
0.5% |
|
MTD Change |
0.2% |
1.6% |
0.2% |
0.2% |
(0.2%) |
0.2% |
|
YTD Change |
(1.0%) |
0.0% |
(1.9%) |
0.0% |
0.4% |
- |
Source: Central Bank of Kenya (CBK) and National Treasury
Kenya Shilling:
During the week, the Kenya Shilling appreciated marginally against the US Dollar by 0.4 bps, to close the week at Kshs 129.3, relatively unchanged from the previous week. On a year-to-date basis, the shilling has appreciated by 17.6% against the dollar, a contrast to the 26.8% depreciation recorded in 2023.
We expect the shilling to be supported by:
- Diaspora remittances standing at a cumulative USD 4,872.0 mn in the 12 months to November 2024, 16.7% higher than the USD 4,175.0 mn recorded over the same period in 2023. In the November 2024 diaspora remittances figures, North America remained the largest source of remittances to Kenya accounting for 53.4% in the period, and,
- The tourism inflow receipts which came in at USD 352.5 bn in 2023, a 31.5% increase from USD 268.1 bn inflow receipts recorded in 2022, and owing to tourist arrivals that improved by 14.9% in the 12 months to October 2024, compared to a similar period in 2023.
- Improved forex reserves currently at USD 9.0 bn (equivalent to 4.6-months of import cover), which is above the statutory requirement of maintaining at least 4.0-months of import cover and the EAC region’s convergence criteria of 4.5-months of import cover.
The shilling is however expected to remain under pressure in 2025 as a result of:
- An ever-present current account deficit which came at 3.8% of GDP in Q2’2024 from 3.7% recorded in Q2’2023, and,
- The need for government debt servicing, continues to put pressure on forex reserves given that 67.2% of Kenya’s external debt is US Dollar-denominated as of June 2024.
Key to note, Kenya’s forex reserves decreased marginally by 0.2% during the week, remaining relatively unchanged from the USD 9.0 bn recorded in the previous week, equivalent to 4.6 months of import cover, and above to the statutory requirement of maintaining at least 4.0-months of import cover. The recent increase in forex reserves is primarily attributed to the disbursement from the International Monetary Fund (IMF). On October 30, 2024, the IMF approved a combined disbursement of around USD 606.1 mn following the successful completion of Kenya’s seventh and eighth reviews under the Extended Fund Facility (EFF), Extended Credit Facility (ECF), and Resilience and Sustainability Facility (RSF) arrangements. The chart below summarizes the evolution of Kenya's months of import cover over the years:

Weekly Highlights:
- November 2024 Exchequer Release
During the week, the National Treasury gazetted the revenue and net expenditures for the fifth month of FY’2024/2025, ending 30th November 2024. Below is a summary of the performance:
|
FY'2024/2025 Budget Outturn - As at 30th November 2024 |
||||||
|
Amounts in Kshs Billions unless stated otherwise |
||||||
|
Item |
12-months Original Estimates |
Revised Estimates |
Actual Receipts/Release |
Percentage Achieved of the Revised Estimates |
Prorated |
% achieved of the Prorated |
|
Opening Balance |
1.2 |
|||||
|
Tax Revenue |
2,745.2 |
2,475.1 |
857.0 |
34.6% |
1,031.3 |
83.1% |
|
Non-Tax Revenue |
172.0 |
156.4 |
82.8 |
52.9% |
65.1 |
127.1% |
|
Total Revenue |
2,917.2 |
2,631.4 |
940.9 |
35.8% |
1,096.4 |
85.8% |
|
External Loans & Grants |
571.2 |
593.5 |
90.3 |
15.2% |
247.3 |
36.5% |
|
Domestic Borrowings |
828.4 |
978.3 |
359.1 |
36.7% |
407.6 |
88.1% |
|
Other Domestic Financing |
4.7 |
4.7 |
4.4 |
94.8% |
2.0 |
227.5% |
|
Total Financing |
1,404.3 |
1,576.5 |
453.8 |
28.8% |
656.9 |
69.1% |
|
Recurrent Exchequer issues |
1,348.4 |
1,307.9 |
518.4 |
39.6% |
545.0 |
95.1% |
|
CFS Exchequer Issues |
2,114.1 |
2,137.8 |
602.3 |
28.2% |
890.8 |
67.6% |
|
Development Expenditure & Net Lending |
458.9 |
351.3 |
105.6 |
30.0% |
146.4 |
72.1% |
|
County Governments + Contingencies |
400.1 |
410.8 |
158.0 |
38.5% |
171.2 |
92.3% |
|
Total Expenditure |
4,321.5 |
4,207.9 |
1,384.2 |
32.9% |
1,753.3 |
78.9% |
|
Fiscal Deficit excluding Grants |
1,404.3 |
1,576.5 |
443.3 |
28.1% |
656.9 |
67.5% |
|
Total Borrowing |
1,399.6 |
1,571.8 |
449.4 |
28.6% |
654.9 |
68.6% |
Amounts in Kshs bn unless stated otherwise
The Key take-outs from the release include;
- Total revenue collected as at the end of November 2024 amounted to Kshs 940.9 bn, equivalent to 35.8% of the revised estimates of Kshs 2,631.4 bn for FY’2024/2025 and is 85.8% of the prorated estimates of Kshs 1,096.4 bn. Cumulatively, tax revenues amounted to Kshs 857.0 bn, equivalent to 34.6% of the revised estimates of Kshs 2,475.1 bn and 83.1% of the prorated estimates of Kshs 1,031.3 bn,
- Total financing amounted to Kshs 453.8 bn, equivalent to 28.8% of the revised estimates of Kshs 1,576.5 bn and is equivalent to 69.1% of the prorated estimates of Kshs 656.9 bn. Additionally, domestic borrowing amounted to Kshs 359.1 bn, equivalent to 36.7% of the revised estimates of Kshs 978.3 bn and is 88.1% of the prorated estimates of Kshs 407.6 bn,
- The total expenditure amounted to Kshs 1,384.2 bn, equivalent to 32.9% of the revised estimates of Kshs 4,207.9 bn, and is 78.9% of the prorated target expenditure estimates of Kshs 1,753.3 bn. Additionally, the net disbursements to recurrent expenditures came in at Kshs 518.4 bn, equivalent to 39.6% of the revised estimates of Kshs 1,307.9 and 95.1% of the prorated estimates of Kshs 545.0 bn,
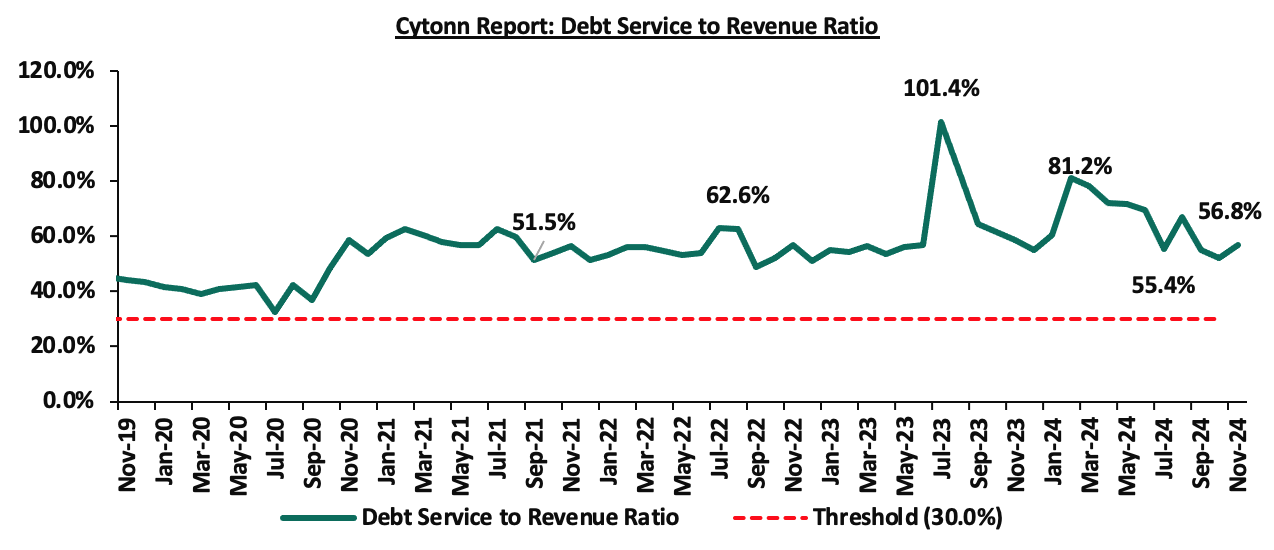
- Consolidated Fund Services (CFS) Exchequer issues came in at Kshs 602.3 bn, equivalent to 28.2% of the revised estimates of Kshs 2,137.8 bn, and are 67.6% of the prorated amount of Kshs 890.8 bn. The cumulative public debt servicing cost amounted to Kshs 534.2 bn which is 28.0% of the revised estimates of Kshs 1,910.5 bn, and is 67.1% of the prorated estimates of Kshs 796.0 bn. Additionally, the Kshs 534.0 bn debt servicing cost is equivalent to 56.8% of the actual cumulative revenues collected as at the end of November 2024. The chart below shows the debt servicing cost to revenue ratio over the period;
- Total new Borrowings as at the end of November 2024 amounted to Kshs 449.4 bn, equivalent to 28.6% of the revised estimates of Kshs 1,571.8 bn for FY’2024/2025 and are 68.6% of the prorated estimates of Kshs 654.9 bn. The cumulative domestic borrowing of Kshs 978.3 bn comprises of Net Domestic Borrowing Kshs 408.4 bn and Internal Debt Redemptions (Rollovers) Kshs 569.9 bn.
The government missed its prorated revenue targets for the fifth consecutive month in FY’2024/2025, achieving only 85.8% of the revenue targets in November 2024. This shortfall is largely due to the challenging economic environment, exacerbated by high taxes and the elevated cost of living, despite easing inflationary pressures, with the year-on-year inflation for November 2024 rising marginally by 0.1% points to 2.8%, up from 2.7% in October 2024. However, the cost of living remains high, negatively impacting revenue collection despite the improving business environment, with the PMI increasing to 50.9 in November from 50.4 in October 2024. Despite efforts to enhance revenue collection, such as broadening the tax base, curbing tax evasion, and suspending tax relief payments, the government has yet to fully benefit from these strategies. Future revenue collection will largely depend on the stabilization of the country’s business climate, which is expected to be supported by a stable Shilling, continued easing of inflation, and a reduction in the cost of credit. This is in line with the Monetary Policy Committee’s (MPC) recent decision to lower the Central Bank Rate (CBR) by 75.0 basis points to 11.25%, down from 12.00%, following their meeting on December 5th, 2024.
Rates in the Fixed Income market have been on a downward trend given the continued low demand for cash by the government and the improved liquidity in the money market. The government is 187.9% ahead of its prorated net domestic borrowing target of Kshs 196.3 bn, and 38.4% ahead of the total FY’2024/25 net domestic borrowing target of Kshs 408.4 bn, having a net borrowing position of Kshs 565.4 bn. However, we expect a continued downward readjustment of the yield curve in the short and medium term, with the government looking to increase its external borrowing to maintain the fiscal surplus, hence alleviating pressure in the domestic market. As such, we expect the yield curve to normalize in the medium-term and hence investors are expected to shift towards the long-term papers to lock in the high returns.
Market Performance:
During the week, the equities market was on an upward trajectory, with NASI gaining the most by 2.2%, while NSE 20, NSE 25 and NSE 10 gained by 1.5%, 1.5% and 1.3% respectively, taking the YTD performance to gains of 39.2%, 37.9%, 32.3% and 26.5% for NSE 10, NSE 25, NASI and NSE 20 respectively. The equities market performance was mainly driven by gains recorded by large-cap stocks such as Bamburi, Absa and DTBK of 11.5%, 9.4%, and 9.1% respectively. The gains were however weighed down by losses recorded by large-cap stocks such as Equity Group and EABL of 4.3%, and 2.8% respectively.
During the week, equities turnover increased significantly by 1,168.6% to USD 190.2 mn from USD 15.0 mn recorded the previous week, taking the YTD turnover to USD 788.7 mn. Foreign investors became net sellers, a reversal from the previous week, with a net selling position of USD 2.4 mn, from a net buying position of USD 1.7 mn recorded the previous week, taking the YTD net selling position to USD 16.0 mn.
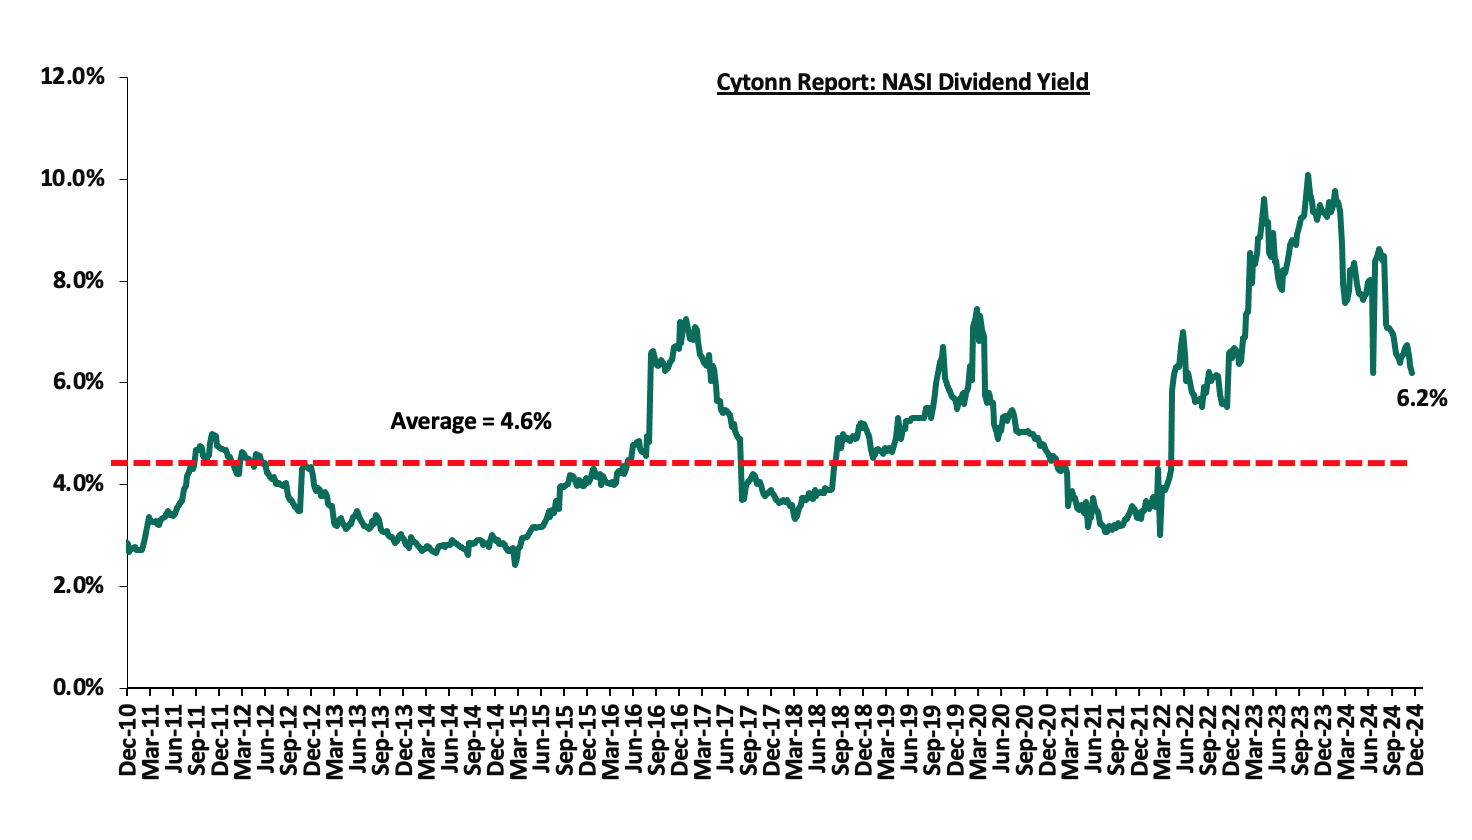
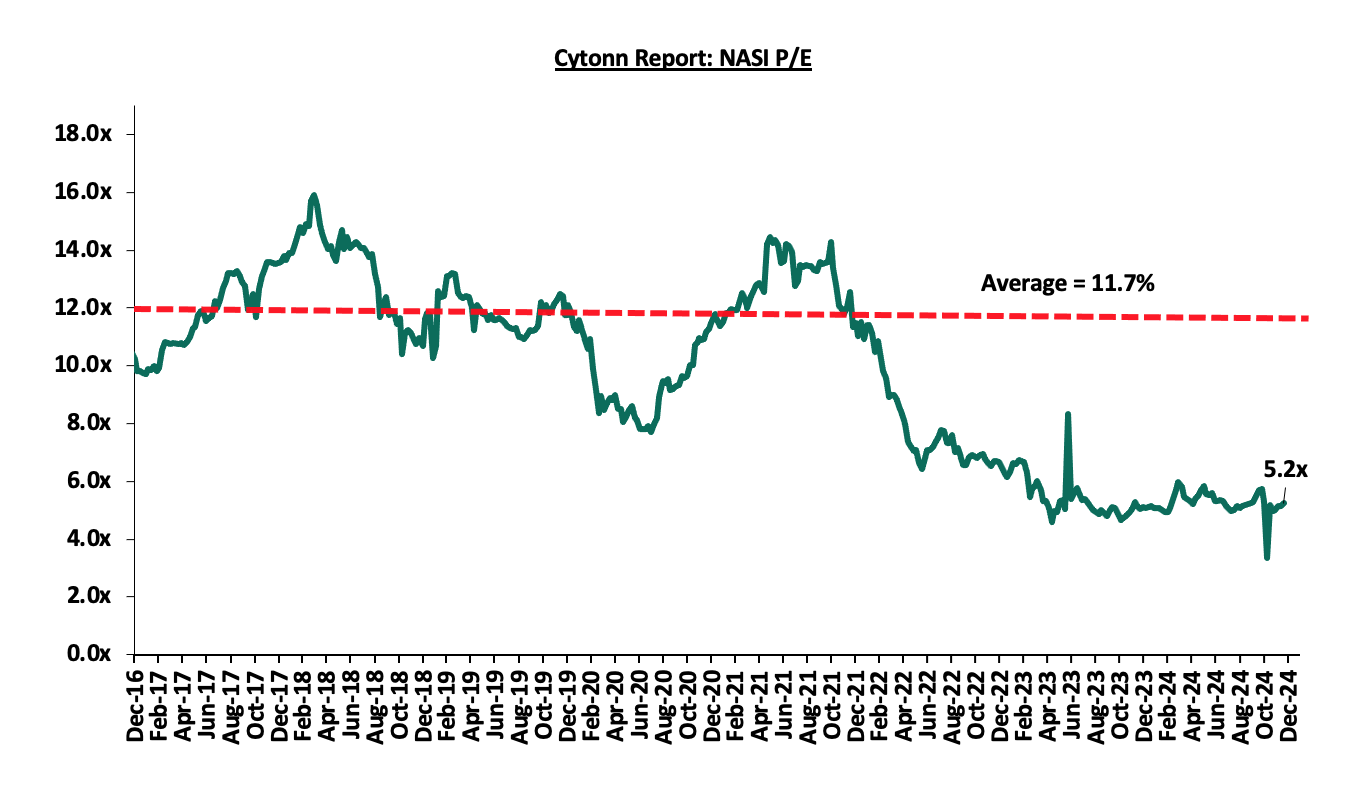
The market is currently trading at a price-to-earnings ratio (P/E) of 5.2x, 55.1% below the historical average of 11.7x, and a dividend yield of 6.2%, 1.6% points above the historical average of 4.6%. Key to note, NASI’s PEG ratio currently stands at 5.2x, an indication that the market is undervalued relative to its future growth. A PEG ratio greater than 1.0x indicates the market may be overvalued while a PEG ratio less than 1.0x indicates that the market is undervalued.
|
Cytonn Report: Equities Universe of Coverage |
||||||||||
|
Company |
Price as at 13/12/2024 |
Price as at 20/12/2024 |
w/w change |
YTD Change |
Year Open 2024 |
Target Price* |
Dividend Yield*** |
Upside/ Downside** |
P/TBv Multiple |
Average |
|
Jubilee Holdings |
172.0 |
168.3 |
(2.2%) |
(9.1%) |
185.0 |
260.7 |
8.3% |
59.9% |
0.3x |
Buy |
|
CIC Group |
2.1 |
2.1 |
1.5% |
(8.7%) |
2.3 |
2.8 |
6.3% |
42.2% |
0.7x |
Buy |
|
Co-op Bank |
14.6 |
15.6 |
6.5% |
37.0% |
11.4 |
18.8 |
10.3% |
39.0% |
0.7x |
Buy |
|
ABSA Bank |
15.4 |
16.9 |
9.4% |
45.9% |
11.6 |
19.1 |
10.1% |
34.1% |
1.2x |
Buy |
|
Equity Group |
48.0 |
46.0 |
(4.3%) |
34.4% |
34.2 |
60.2 |
8.3% |
33.8% |
0.9x |
Buy |
|
NCBA |
44.6 |
46.9 |
5.2% |
20.7% |
38.9 |
53.2 |
10.7% |
29.9% |
0.8x |
Buy |
|
Britam |
5.8 |
5.8 |
0.0% |
12.5% |
5.1 |
7.5 |
0.0% |
29.8% |
0.8x |
Buy |
|
KCB Group |
39.5 |
39.7 |
0.4% |
80.6% |
22.0 |
50.3 |
0.0% |
27.3% |
0.6x |
Buy |
|
Standard Chartered Bank |
254.5 |
272.8 |
7.2% |
70.2% |
160.3 |
291.2 |
11.4% |
25.8% |
1.7x |
Buy |
|
Diamond Trust Bank |
58.0 |
63.3 |
9.1% |
41.3% |
44.8 |
65.2 |
8.6% |
21.0% |
0.2x |
Buy |
|
Stanbic Holdings |
134.0 |
135.3 |
0.9% |
27.6% |
106.0 |
145.3 |
11.5% |
19.9% |
0.9x |
Accumulate |
|
I&M Group |
31.9 |
31.8 |
(0.5%) |
81.9% |
17.5 |
32.3 |
8.0% |
9.2% |
0.7x |
Hold |
|
*Target Price as per Cytonn Analyst estimates **Upside/ (Downside) is adjusted for Dividend Yield ***Dividend Yield is calculated using FY’2023 Dividends |
||||||||||
Weekly Highlights
- HF Group Announces Rights Issue Results
During the week, HF Group released the results of its earlier approved rights issue, announcing that the rights were oversubscribed, with the oversubscription rate coming in at 138.3% having received offers worth Ksh 6.4 bn against the offered Ksh 4.6 bn. Notably, the Group accepted 474,201,310 shares under the entitlement option against the offered 769,228,336 million, translating to an acceptance rate of 61.7%.
The rights issue offered a total of 1,499,995,255 new shares at an offer price of Ksh 4.0 per share, including 769,228,336 entitlement shares, 384,614,168 additional shares, and 346,152,751 Green Shoe Option shares. The entitlement ratio was two shares for every one ordinary share held, with a minimum success rate of 40.0%. If fully subscribed, the rights issue was expected to raise gross proceeds of Ksh 4.6 bn, increasing to Ksh 6.0 bn with a 100.0% uptake of the Green Shoe Option.
The results revealed that a total of 474,201,310 shares were accepted under entitlement, representing a take-up rate of 61.7%, with a total value of Ksh 1.9 bn. Additionally, 1,121,794,656 shares were applied for under additional shares, valued at KES 4.5 billion. This represents a subscription rate of 291.6% for the 384,614,168 additional shares initially offered. To cater for the oversubscription, the Green Shoe Option, which allows for an additional 346,152,751 shares, was exercised. The additional shares were allocated from a combined pool of 295,027,026 untaken shares, 384,614,168 additional shares, and 346,152,751 Green Shoe Option shares. Combined, the grand total number of new shares applied for under the rights issue stood at 1,595,995,966, valued at Ksh 6.4 bn. The table below summarizes the rights issue results statistics;
|
Cytonn Report: HF Group Rights Issue Results Summary |
|
|
Data |
Statistic |
|
Total number of new shares accepted under entitlement |
474,201,310 |
|
Total value of new shares accepted under entitlement |
Kshs 1,896,805,240 |
|
Take up percentage under entitlement |
61.7% |
|
Total number of additional new shares applied for under additional shares |
1,121,794,646 |
|
Total value of additional new shares applied for under additional shares |
Kshs 4,487,178,624 |
|
Grand total number of new shares applied for under the rights issue (entitlement shares + additional shares) |
1,595,995,966 |
|
Grand total value of new shares applied for under the rights issue (Entitlement shares + additional shares) |
Kshs 6,383,983,864 |
|
Overall subscription performance rate |
138.3% |
Source: HF Group
The proceeds from the rights issue will be directed towards several key areas aligned with HF Group’s long-term strategy. Primarily, the Group aims to use this capital to reinforce its investment in HFC Limited’s expanded business segments, which cover a wide range of financial services tailored to both retail and corporate clients. Before the rights issue, HF Group's capital adequacy ratios were significantly below the statutory requirements set by the Central Bank of Kenya in Q3’2024, with both Core Capital to Total Liabilities and Core Capital to Total Risk-Weighted Assets ratios in deficit. Post-rights issue, HF Group’s capital adequacy position will improve significantly, and will be above the statutory minimums. The table below shows the capital adequacy ratios before and after the rights issue;
|
Capital Adequacy Ratios |
Before the rights issue |
After the rights issue |
Change |
|
Core Capital/Total Deposit Liabilities |
3.7% |
20.6% |
16.9% |
|
Minimum Statutory ratio |
8.0% |
8.0% |
0.0% |
|
Excess |
(4.3%) |
12.6% |
16.9% |
|
Core Capital/Total Risk Weighted Assets |
4.3% |
18.0% |
13.7% |
|
Minimum Statutory ratio |
10.5% |
10.5% |
0.0% |
|
Excess |
(6.2%) |
7.5% |
13.7% |
Compared to peer banks in Kenya, HF Group will become sufficiently capitalized after accounting for the rights issue. The tables before show HF Group’s capital adequacy ratios compared to its peers;
|
Cytonn Report: Q3’2024 Capital adequacy to Risk Weighted Assets |
|||
|
Bank |
Ratio |
Minimum statutory ratio |
Excess/(Deficit) |
|
Standard Chartered |
20.9% |
10.5% |
10.4% |
|
Cooperative Bank |
19.1% |
10.5% |
8.6% |
|
DTB-K |
18.6% |
10.5% |
8.1% |
|
HF Group* |
18.0% |
10.5% |
7.5% |
|
NCBA Group |
17.2% |
10.5% |
6.7% |
|
Equity Group |
15.9% |
10.5% |
5.4% |
|
Absa Group |
15.6% |
10.5% |
5.1% |
|
Stanbic Holdings |
14.7% |
10.5% |
4.2% |
|
I&M Group |
14.6% |
10.5% |
4.1% |
|
KCB Group |
14.5% |
10.5% |
4.0% |
|
HF Group** |
4.3% |
10.5% |
(6.2%) |
*After the rights issue
**Before the rights issue
|
Cytonn Report: Q3’2024 Capital adequacy to Risk Weighted Liabilities |
|||
|
Bank |
Ratio |
Minimum statutory ratio |
Excess/(Deficit) |
|
HF Group* |
20.6% |
8.0% |
12.6% |
|
Standard Chartered |
20.2% |
8.0% |
12.2% |
|
DTB-K |
19.7% |
8.0% |
11.7% |
|
Absa Group |
19.1% |
8.0% |
11.1% |
|
Cooperative Bank |
18.0% |
8.0% |
10.0% |
|
I&M Group |
17.4% |
8.0% |
9.4% |
|
Equity Group |
16.9% |
8.0% |
8.9% |
|
Stanbic Holdings |
16.5% |
8.0% |
8.5% |
|
NCBA Group |
15.6% |
8.0% |
7.6% |
|
KCB Group |
13.0% |
8.0% |
5.0% |
|
HF Group** |
3.7% |
8.0% |
(4.3%) |
*After the rights issue
**Before the rights issue
Going forward, it is our expectation that HF Group’s success will hinge on its ability to effectively deploy the new capital to fuel growth and deliver on its strategic goals. As it strengthens its capital base and enhances digital capabilities, HF Group is positioned to expand its customer base and diversify revenue streams, critical for competing in Kenya’s increasingly digitalized financial services sector. Shareholders will be looking for tangible outcomes from these initiatives, particularly in increased profitability and market share.
We are “Neutral” on the Equities markets in the short term due to the current tough operating environment and huge foreign investor outflows, and, “Bullish” in the long term due to current cheap valuations and expected global and local economic recovery. With the market currently being undervalued for its future growth (PEG Ratio at 5.2x), we believe that investors should reposition towards value stocks with strong earnings growth and that are trading at discounts to their intrinsic value. We expect the current foreign investors’ sell-offs to continue weighing down the equities outlook in the short term.
- Industry Report
During the week, the Kenya National Bureau of Statistics (KNBS) released the Leading Economic Indicators (LEI) October 2024 Report, which highlighted the performance of major economic indicators. Key highlights related to the Real Estate sector from the report include;
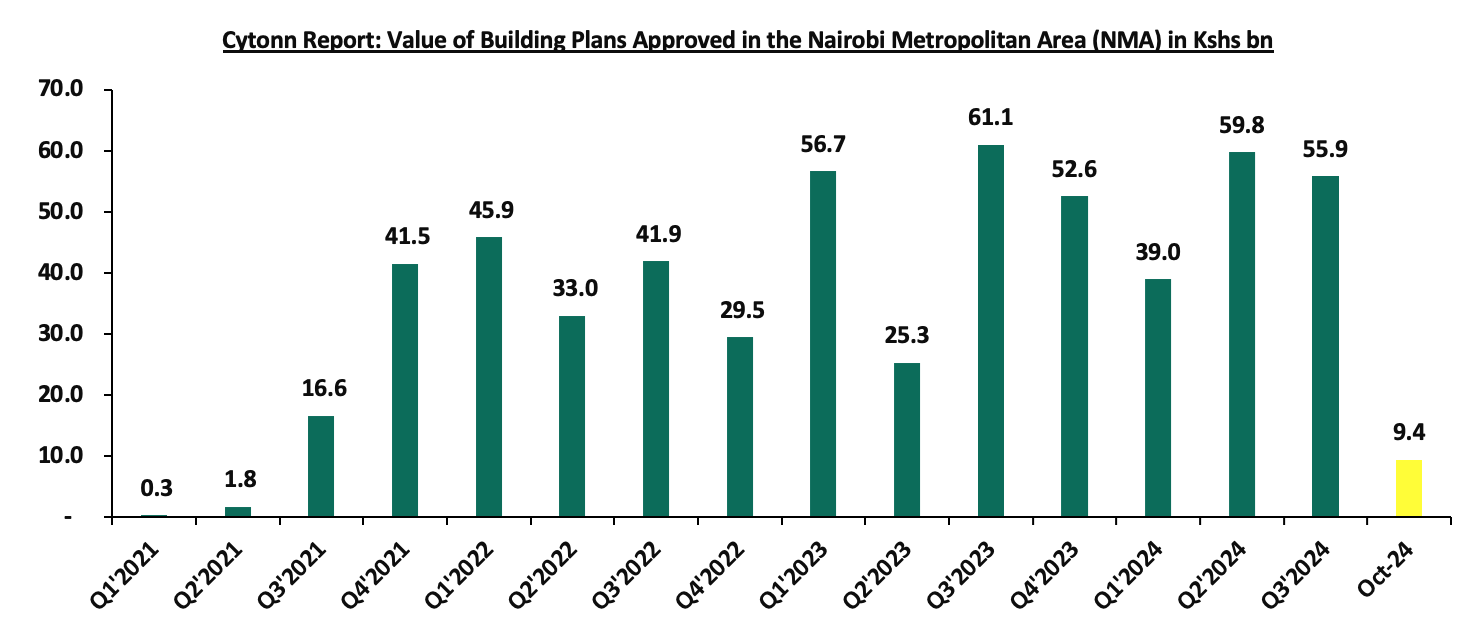
- The total value of building plans approved in the Nairobi Metropolitan Area (NMA) decreased y/y basis by 41.3 % to Kshs 9.4 bn in October 2024, from Kshs 16.1 bn recorded in October 2023. In addition, on a m/m basis, the performance represented a 61.1% decrease from Kshs 24.3 bn recorded in September ’2024. The decrease in performance was attributable to; i)increased prices of construction materials such as reinforced steel and cement, ii) tough operating environment, which led lenders to tighten lending to the real estate sector due to the rising number of non-performing loans.iii) political demonstrations disrupted construction and business activities, negatively affecting investor confidence and decision-making regarding new projects, and,iv) developers and investors shifted strategies, emphasizing operational efficiency and sustainability rather than embarking on new large-scale developments. The chart below shows the value of building plans approved in the Nairobi Metropolitan Area (NMA) between Q1’2021 and October 2024;
Source: Kenya National Bureau of Statistics (KNBS)
- Residential Sector
- Government’s Kshs 10.0 bn low-cost mortgage scheme funded by the Housing Levy
During the week, the Kenyan government introduced a Kshs 10.0 bn low-cost mortgage scheme aimed at facilitating rural home construction. This initiative, funded by the Housing Levy, offers single-digit interest loans repayable over ten years, with individual applicants eligible for up to Kshs 5.0 mn and multiple-family dwellings up to Kshs 10.0 mn.
The program is designed to address the challenges faced by workers in securing affordable financing for building homes in their villages, a market segment traditionally overlooked by commercial banks due to low property valuations in rural areas. By extending affordable housing benefits beyond urban centers, the government aims to stimulate economic growth in rural regions and improve living conditions. To ensure the program's focus on affordability, regulations are being developed to prevent the construction of extravagant homes using these funds. The National Housing cooperation emphasized that the loans are intended for modest housing, aligning with the program's objectives.
This initiative is part of a broader affordable housing strategy, which includes the establishment of the County Rural and Urban Affordable Housing Committee. This committee is tasked with developing frameworks and investment programs tailored to the housing needs of each county.
Despite the ambitious plans, the program has faced challenges in disbursement. In the financial year ending June 2024, no rural housing loans were disbursed, highlighting the need for effective implementation strategies to meet the government's targets. Overall, the Kshs 10.0 bn rural housing mortgage scheme represents a significant step towards enhancing housing affordability in Kenya's rural areas, aiming to improve living standards and stimulate economic development outside urban centers.
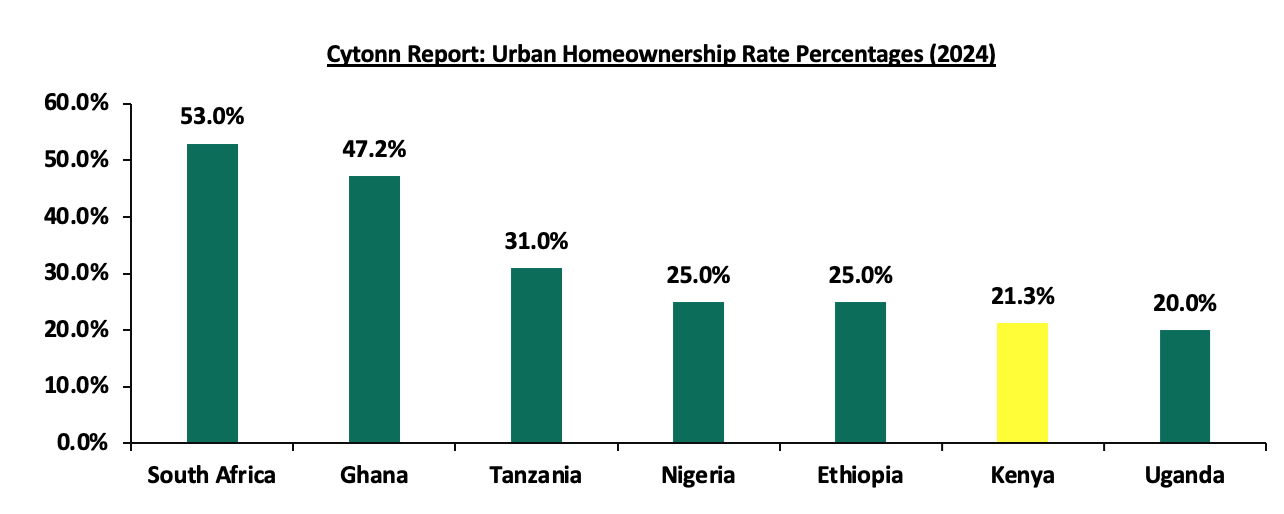
We expect this step to greatly boost home ownership, through government’s affordable housing plan, which targets constructing 250,000 housing units annually. The initiative will be contributing to increased homeownership rates across the country which currently stands at 21.3% in urban areas, which remains significantly low compared to other countries like South Africa (53.0%) and Ghana (47.2%) as shown in the chart below.
Source: Cytonn Research
This figure highlights the need for more affordable housing initiatives, as the country continues to face a housing deficit of approximately 2.0 mn units. The low homeownership rate is attributed to factors such as high property prices and limited access to affordable financing. Programs like the government's Affordable Housing initiative are working to address this deficit and improve homeownership rates by offering subsidized housing options to lower-middle and middle-income earners and now the introduced mortgage financing from the housing levy collected from Kenyans monthly
- Shelter Afrique Bank MOU with African Union
During the week, Shelter Afrique Development Bank (ShafDB) and the African Union (AU) signed a Memorandum of Understanding (MOU) to address Africa's significant housing deficit, estimated at 53.0 mn units with a financing gap of USD 1.4 tn.
This partnership focuses on several key areas:
- Sustainable Housing and Urban Development: Initiatives aimed at creating environmentally sustainable and climate-resilient communities.
- Capacity Building: Training programs for policymakers and stakeholders in housing and urban development.
- Resource Mobilization: Efforts to secure financial and technical resources through partnerships with regional and international financial institutions.
- Policy Development and Advocacy: Crafting policies to elevate housing and urban development issues on various agendas.
- Research and Technological Innovation: Collaboration on research and the integration of innovative technologies in housing and urban planning.
- Environmental Sustainability: Initiatives to improve climate resilience in housing and urban infrastructure.
The MOU also includes provisions for cooperation with AU sub-organizations to ensure coordinated efforts across the continent.
To implement the MOU effectively, ShafDB and the AU will develop a Joint Action Plan detailing specific activities, timelines, and review mechanisms. This collaboration may include staff secondment arrangements and additional agreements to address emerging areas of mutual interest.
We expect that this strategic partnership will represent a significant step toward bridging Africa's housing gap, promoting sustainable urban development, and enhancing the well-being of African citizens.
- Infrastructure Sector
During the week, the Kenyan Cabinet approved the implementation of a city bus project aimed at enhancing urban mobility and reducing traffic congestion in Nairobi. The project involves the introduction of a fleet of modern buses to operate within the city, providing residents with a reliable and efficient public transportation option. The initiative is expected to cost Kshs 43.4 bn and the first route will be a 12.4 Km from Kenyatta National Hospital to Dandora with future extensions to Ngong’ town and Tala. The Bus Rapid Transit (BRT) system will be managed by the Nairobi Metropolitan Area Transport Authority (NaMATA)
The initiative is part of the government's broader strategy to improve urban infrastructure and address the challenges posed by rapid urbanization. By offering an alternative to private car usage, the project seeks to alleviate traffic jams, lower carbon emissions, and contribute to a more sustainable urban environment. The buses are expected to be equipped with modern amenities to ensure passenger comfort and safety. Additionally, the project includes the development of supporting infrastructure such as dedicated bus lanes and modern bus stops to facilitate smooth operations and minimize delays.
The implementation of the city bus project is anticipated to create employment opportunities, both directly and indirectly, thereby contributing to the local economy. Furthermore, it aligns with the government's commitment to promoting sustainable urban development and improving the quality of life for city residents. While the exact timeline for the rollout has not been specified, the Cabinet's approval marks a significant milestone in the project's progression. The next steps are expected to involve detailed planning, procurement processes, and stakeholder engagement to ensure the successful execution of the project.
We expect that the city bus project represents a strategic effort by the Kenyan government to modernize urban transportation, reduce environmental impact, and enhance the livability of Nairobi. This goes in line with the government efforts to increase infrastructure and ensure smooth movement within the NMA
- Real Estate Investments Trusts (REITs)
On the Unquoted Securities Platform, Acorn D-REIT and I-REIT traded at Kshs 25.4 and Kshs 22.2 per unit, respectively, as per the last updated data on 31st October 2024. The performance represented a 27.0% and 11.0% gain for the D-REIT and I-REIT, respectively, from the Kshs s 20.0 inception price. The volumes traded for the D-REIT and I-REIT came in at Kshs s 12.3 mn and Kshs s 31.6 mn shares, respectively, with a turnover of Kshs 311.5 mn and Kshs 702.7 mn, respectively, since inception in February 2021. Additionally, ILAM Fahari I-REIT traded at Kshs 11.0 per share as of 31st October 2024, representing a 45.0% loss from the Kshs 20.0 inception price. The volume traded to date came in at 138,600 for the I-REIT, with a turnover of Kshs 1.5 mn since inception in November 2015.
REITs offer various benefits, such as tax exemptions, diversified portfolios, and stable long-term profits. However, the ongoing decline in the performance of Kenyan REITs and the restructuring of their business portfolios are hindering significant previous investments. Additional general challenges include:
- Insufficient understanding of the investment instrument among investors leading to a slower uptake of REIT products,
- Lengthy approval processes for REIT creation,
- High minimum capital requirements of Kshs 100.0 mn for REIT trustees compared to Kshs 10.0 mn for pension funds Trustees, essentially limiting the licensed REIT Trustee to banks only
- The rigidity of choice between either a D-REIT or and I-REIT forces managers to form two REITs, rather than having one Hybrid REIT that can allocate between development and income earning properties
- Limiting the type of legal entity that can form a REIT to only a trust company, as opposed to allowing other entities such as partnerships, and companies,
- We need to give time before REITS are required to list – they would be allowed to stay private for a few years before the requirement to list given that not all companies maybe comfortable with listing on day one, and,
- Minimum subscription amounts or offer parcels set at Kshs 0.1 mn for D-REITs and Kshs 5.0 mn for restricted I-REITs. The significant capital requirements still make REITs relatively inaccessible to smaller retail investors compared to other investment vehicles like unit trusts or government bonds, all of which continue to limit the performance of Kenyan REITs.
We expect Kenya’s Real Estate sector to remain on a growth trend, supported by: i) demand for housing sustained by positive demographics, such as urbanization and population growth rates of 3.7% p.a and 2.0% p.a, respectively, against the global average of 1.7% p.a and 0.9% p.a, respectively, as at 2023, ii) activities by the government under the Affordable Housing Agenda (AHP) which has boosted land prices within the NMA area, iii) heightened activities by private players in the residential sector. However, challenges such as rising construction costs, strain on infrastructure development (including drainage systems), high capital requirements for REITs, and existing oversupply in select Real Estate sectors will continue to hinder the sector’s optimal performance by limiting developments and investments.
In 2023, we released the Nairobi Metropolitan Area (NMA) Infrastructure Report 2023, which highlighted the Nairobi Metropolitan Area (NMA) boasts of 1,131.6 Km of ongoing construction and rehabilitation projects valued at Kshs 86.3 bn. This represented a significant increase from the 940.5 Km projects worth 97.3 bn that was recorded in 2022. NMA’s average water coverage declined by 4.0% to 51.8% in 2021 from 55.8% in 2020. This week, we update our report using 2024 market research data and by focusing on;
- Introduction,
- Infrastructure Trends in Kenya,
- State of Infrastructure within the NMA,
- Importance of Roads, Water, and Sewer Network Availability to the Real Estate Sector, and
- Conclusion and Recommendations
Section I: Introduction
Infrastructure constitutes the fundamental systems required for the proper functioning of utility services such as water, transport, energy, internet, sewer and drainage networks, among others. These systems are essential for any region to realize economic growth and social development, specifically these networks support economic activities and improve the quality of life. In Kenya, the government continues to actively support infrastructure development through several financial strategies including Public Private Partnerships (PPPs), the issuance of infrastructure bonds, debt financing, and substantial budgetary allocations with its main focus on road networks.
According to the Kenya National Highways Authority (KeNHA) 2023-2027 Strategic Plan the Authority targets to construct 2,349 km of roads, comprising 1,183 km new road construction, capacity enhancement of 674 km and rehabilitation of 492 km. Additionally, the authority aims to cumulatively maintain 75,891 km of the national trunk road network and design 5,575 km of the road network during this period. The implementation of the Strategic Plan requires Kshs 708.7 Bn of which Ksh 99.3 Bn will be funded through PPPs, Kshs. 1.7 Bn through climate funding, and Kshs 8.2 Bn through own source revenue.
Section II: Infrastructure Trends in Kenya
- Government continued launch and completion of infrastructure projects
The Kenyan government’s commitment to infrastructure has led to the launch and progression of several key projects across the nation, with a special focus on road networks. These road projects continue to enhance connectivity that supports trading activities, draws investments in various sectors and promotes economic growth. Additionally, better infrastructure boosts productivity, spurs innovation and improves the quality of life of Kenyan citizens. Some of the notable projects this year include: 25-kilometre Rukuriri-Kathageri Kanyaumbora road in Embu County, Dongo Kundu Bypass was officially opened to the public, ground breaking for the tarmacking of 65.0km -long link roads in Sombogo, Kitutu Chache, and tarmacking of Metembe-Ngenyi/Bobaracho-Ititi/RiomaNyaore/Marani-Nyakoe Roads in Marani, Kisii County, the proposed dualling of Nairobi-Nakuru highway, rehabilitation of Savannah 17 Bridge Road, Jogoo road and Ladhies Road in Nairobi, aimed at improving traffic flow and safety.
- Inclusive infrastructure planning
There has been a shift towards inclusive infrastructure planning to ensure communities benefit from infrastructural developments while addressing environmental protection, social sustainability, stakeholder engagement, economic empowerment and road safety. KenNHA 2023-2027 strategy includes compliance with environmental and social safeguards, mainstreaming cross-cutting issues like gender and disability, improving customer and stakeholder relations, integrating road safety and local content in projects, linking road construction with socio-economic development, advocating for responsive legislation, building climate-resilient structures, and preserving the environment. This holistic strategy aims to enhance the sustainability of Kenya's national trunk road network.
- Enhanced infrastructure development in affordable housing and settlement areas
The government continues to direct considerable efforts towards enhancing road networks connecting previously remote areas, thereby facilitating the expansion of housing and settlement. KenNHA 2023-2027 strategy aims to enhance the Outer Ring Junction-Kamulu-Komarock, Isinya-Konza, and Bomas-Ongata Rongai-Kiserian-Kona Baridi roads to increase accessibility to new affordable housing zones. Additionally, the authority is committed to maintaining essential connections to County Headquarters to support the connectivity required for the affordable housing initiatives under the BETA program.
- Financing Strategies
- Public-Private Partnerships (PPPs)
The Kenyan government continues to actively pursue Public-Private Partnerships (PPPs) to improve infrastructure development in the country. Notable projects being the Mombasa-Nairobi Expressway, which entails a USD 3.6 bn investment agreement with Everstrong Capital and the upgrading to Bitumen standards and maintenance of the 90.0km Kiambu-Raini, Junction, Kaspat Road, Nduota-Gathanga-Kiguaro, and other roads funded by the Chinese African Development Bank. This significant partnership highlights the government's strategy to utilize substantial private capital for major infrastructure projects, aiming to enhance connectivity, stimulate economic growth, and ensure sustainable development. Partnerships between the public sector and private entities facilitates improved efficiency, drives innovation, and provides the necessary funding for project delivery.
- Budgetary Allocations
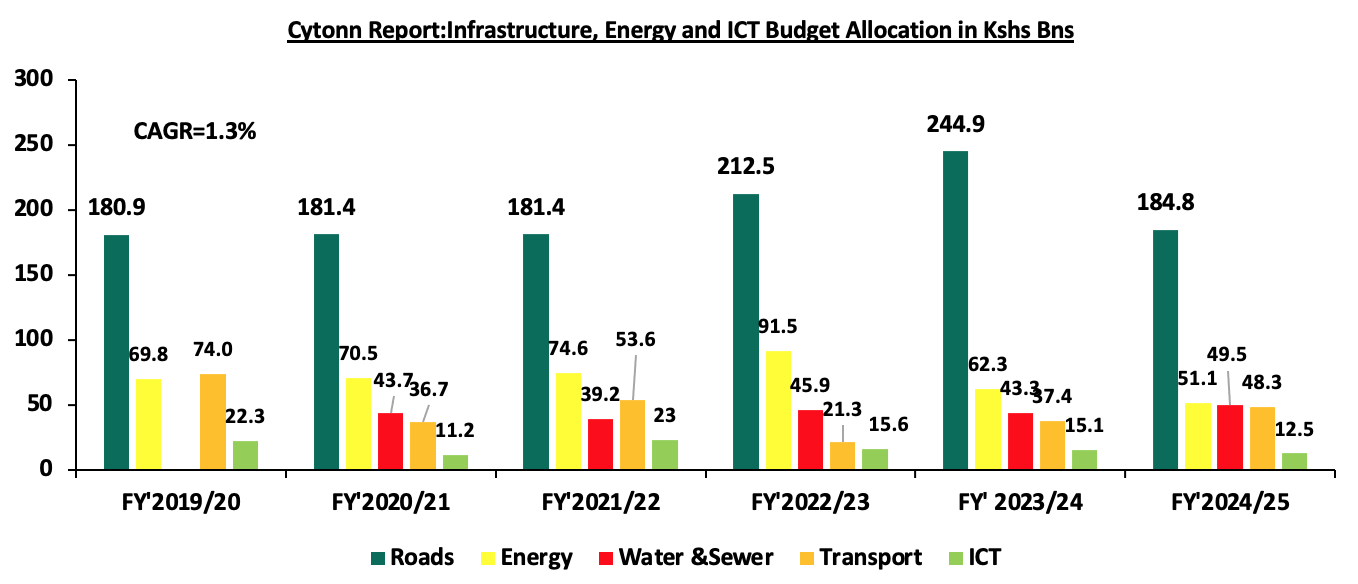
The government’s year-on-year budgetary allocations continue to play a pivotal role in steering Kenya's infrastructure development. In the FY’2024/25, the total budget allocation for infrastructure, energy and ICT stands at a substantial Kshs 477.2bn, recording a 1.9% increase from the Kshs 468.2 bn recorded in the preceding FY’2023/24. This highlights the recognition of the capital-intensive nature of infrastructure projects and their direct impact on job creation and regional economic growth. The chart below illustrates the growth in budgetary allocations for infrastructure, energy and ICT over the last five fiscal years:
Source: National Treasury of Kenya
- Issuance of infrastructure bonds
Issuing of infrastructure bonds has emerged as an important financial strategy for the government in a bid to raise additional resources for infrastructure projects beyond the limits of annual budgets. In September 2024, the Central Bank of Kenya released the auction results for the IFB1/2023/017 tap sale with a tenor to maturity of 15.7 years. The bond was oversubscribed with the overall subscription rate coming in at 234.6%, receiving bids worth Kshs 35.2 bn against the offered Kshs 15.0 bn. The government accepted bids worth Kshs 32.0 bn, translating to an acceptance rate of 91.0%. The weighted average rate of accepted Bids was 17.7%. The growing interest from investors in these bonds is largely driven by their tax-exempt coupon feature, which enhances their appeal and offers an effective option for portfolio diversification. These infrastructure bonds serve as both a dependable financing mechanism and a testament to investors' trust in the government's dedication to infrastructure advancement. The capital raised through these bonds plays a crucial role in supporting ongoing and future infrastructure projects, thereby promoting economic growth and development.
- Credits and Grants from development partners
The government of Kenya continues to rely on credits and grants from international development partners as a crucial funding source for its infrastructure initiatives. These collaborations provide not only financial support but also technical expertise and knowledge sharing. Key contributors include the World Bank, which, through programs like the Kenya Urban Support Program (KUSP), has played a significant role in advancing urban infrastructure development. Other notable financiers include the African Development Bank (AfDB), the European Union (EU) with special focus on energy, roads and water, and bilateral partners such as China, Japan, and the United States. The government’s ability to negotiate favorable financing terms with these partners facilitates the implementation of projects that might otherwise be cost-prohibitive.
Section III: State of Infrastructure in the Nairobi Metropolitan Area (NMA)
For our analysis, we covered the current supply of infrastructure in the Nairobi Metropolitan Area and projects that are currently underway with a focus on roads, water supply, and sewerage systems. The counties of focus within the NMA include Nairobi, Kiambu, Machakos, and Kajiado Counties. Below is the analysis of the infrastructure provision in the Nairobi Metropolitan Area;
- Roads
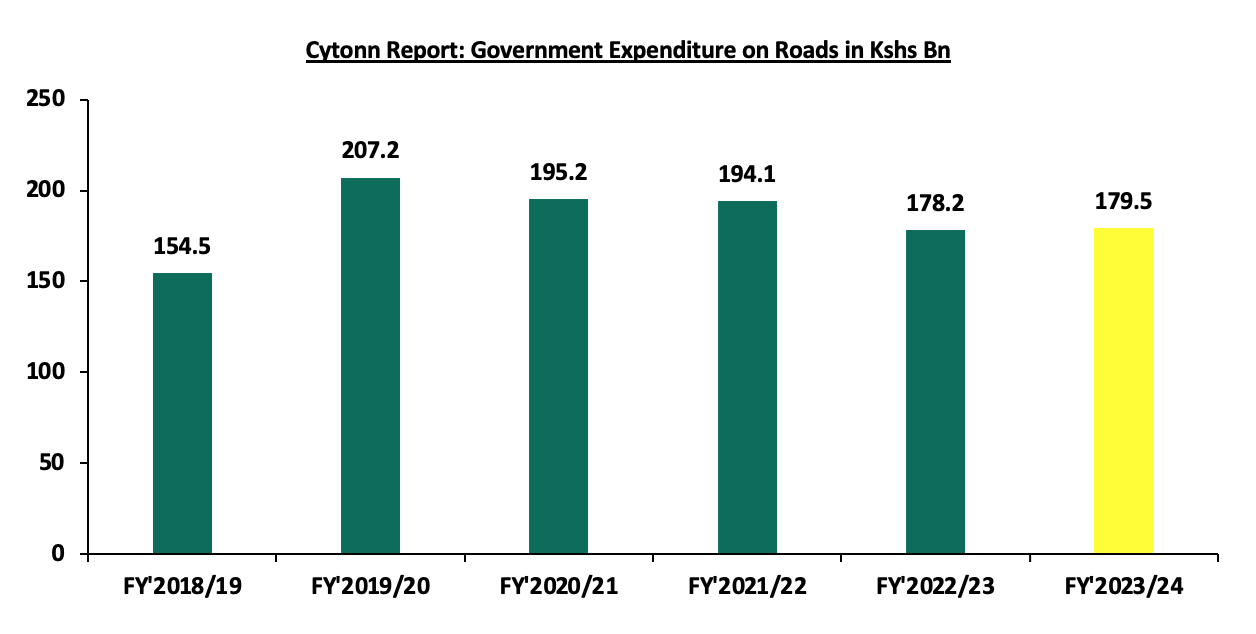
According to the KNBS Economic Survey 2024, road transport was the leading contributor to the value output of the transport and storage sector, accounting for 75.8% of the sector’s value output at Kshs 2.6 tn which stood in contrast to the overall value output of the entire transport and storage sector amounting to ksh 3.3 tn. This highlights that road transport is the primary mode of transport in the country. In line with the its Bottom-Up Economic Transformation Agenda (BETA), the government remains keen on improving the livelihoods and welfare of Kenyans through rehabilitation and upgrading of major trunk roads and regional transport corridors. According to the survey report the governments expenditure on roads is expected to increase by 0.7% to ksh 179.5bn in FY’ 2023/24 from ksh 178.2bn in FY’2022/23 which is within the current budgetary allocation to construction and rehabilitation of roads at ksh 193.2bn. Due to the governments continued efforts to improve infrastructure it is estimated that currently the road network in the country stands at 246,757 Kms out of which 162,055 Kms are classified as one of the country’s largest investment. The graph below shows the Kenyan government’s expenditure on roads during the last five years;
Source: Kenya National Bureau Statistics (KNBS)
However, recent developments relating to the expenditure as revealed by the National Treasury, highlight a shift in government spending priorities, indicating a reduced expenditure in FY’2024/25, as result of budgetary cuts. According to the supplementary budget FY’2024/25, allocation to the state department of roads was reduced by 4.4% to ksh 184.8 bn from the ksh 193.4 bn set in the FY’2024/25 budget. This was attributed to a strategy by the government to cut expenditure in response to pressure from anti-finance bill 2024 protests and to restore calm in the country. We anticipate the government continued efforts to improve infrastructure in the country more so in road and transport sector in line with its BETA agenda and economic stimulation. However, this may be weighed down by the recent budgetary cuts therefore reducing the number of successfully completed projects.
The State Department of Roads is responsible for the development, maintenance, and management of road infrastructure in the country, a mandate carried out through several state agencies. The Kenya Roads Board (KRB) oversees the national road network and coordinates maintenance, rehabilitation, and development using the Roads Maintenance Levy Fund (RMLF). The Kenya National Highways Authority (KeNHA) manages, develops, and maintains National Trunk Roads in Classes S, A, and B, while the Kenya Rural Roads Authority (KeRRA) is tasked with Class C roads. The Kenya Urban Roads Authority (KURA) focuses on urban roads within cities and municipalities, and the Kenya Wildlife Service (KWS) manages roads within National Parks and Game Reserves.
|
Cytonn Report: Road Classification in Kenya |
|||
|
# |
Road Class |
Definition |
Overseeing Body |
|
1 |
Superhighway (S) |
Highway connecting two or more cities/towns meant to carry safely a large volume of traffic at the highest legal speed of operation. |
KeNHA |
|
2 |
International Trunk Road (A) |
Roads forming strategic routes and corridors, connecting international boundaries at identified immigration entry and exit points and international terminals such as international air or sea ports |
KeNHA |
|
3 |
National Trunk Road (B) |
Roads forming important national routes linking national trading or economic hubs, county headquarters and other nationally important centres to each other and to the national capital or to Class A roads |
KeNHA |
|
4 |
Primary Road (C) |
Roads forming important regional routes, linking County headquarters or other regionally important centres, to each other and to class A or B roads |
KeRRA |
|
5 |
Secondary Road (D) |
Roads linking constituency headquarters, municipal or town council centres and other towns to each other and to higher class roads |
KURA |
Source: Kenya Roads Board
In terms of performance, in the Nairobi Metropolitan Area (NMA), a total of 97.4 Km road networks constructions valued at Kshs 23.6 bn have been completed between 2023/2024 an increase of 6.0 km from 2022/ 2023. Some of the notable projects completed during the period include Nairobi construction of missing Link roads in Nairobi, improvement of Nairobi outering road and Rehabilitation and upgrading of Eastland’s Roads (Phase 11). Below is a summary of completed road network coverage in the Nairobi Metropolitan Area (NMA) between 2023 and November 2024;
|
Cytonn Report: Summary of completed road network coverage in the NMA 2023/2024 |
||
|
County |
Completed Roads (Km) |
Cost |
|
(All Values in Kshs Bns Unless Stated otherwise) |
||
|
Kajiado |
7.4 |
0.5 |
|
Nairobi |
65.8 |
20.8 |
|
Kiambu |
23.0 |
2.3 |
|
Machakos |
8.6 |
0.5 |
|
Average |
104.8 |
24.1 |
Source KeRRA and KURA
In addition to the aforementioned completed road networks projects, the Nairobi Metropolitan Area (NMA) boasts of 926.7kms of ongoing construction and rehabilitation projects valued at Kshs 68.2 bn. This represents a significant decrease from the 1131.6 kms projects worth 86.3 bn in 2023. Some of the notable ongoing projects include;
- Kenol - Ngoleni - Kaani / Mutituni - Kaseve,
- U-G29664 Kamunyu A/ U-G29671 Kamunyu B/UG29572 Gathiaka - Gathuya/ Marigi Gategi/ Cununuki - Gacharage/ Gitwe Kiganjo/ Kahata - Munyuini/ Karinga - Kimaruri/Kuri - Cununuki - Gacharage/Ruburi - Wanugu - Flyover,
- Rehabilitation of Innercore Estate Roads,
- Rehabilitation of Kasarani - Mwiki Road,
- Improvement of access to Kibera housing project,
- Construction of Ngong-Suswa road.
Below is a summary of the ongoing road network coverage in the NMA;
|
Cytonn Report: Summary of Nairobi Metropolitan Area Ongoing Road Projects |
|||
|
County |
Total Coverage (KM) |
Status |
Cost (Kshs) |
|
Kajiado |
142.4 |
73.3% |
7.3 |
|
Nairobi |
60.3 |
65.3% |
7.7 |
|
Kiambu |
516.0 |
59.1% |
37.2 |
|
Machakos |
208.0 |
62.3% |
16.0 |
|
Total |
926.7 |
65.0% |
68.2 |
Source: KeRRA and KURA
- Water Supply
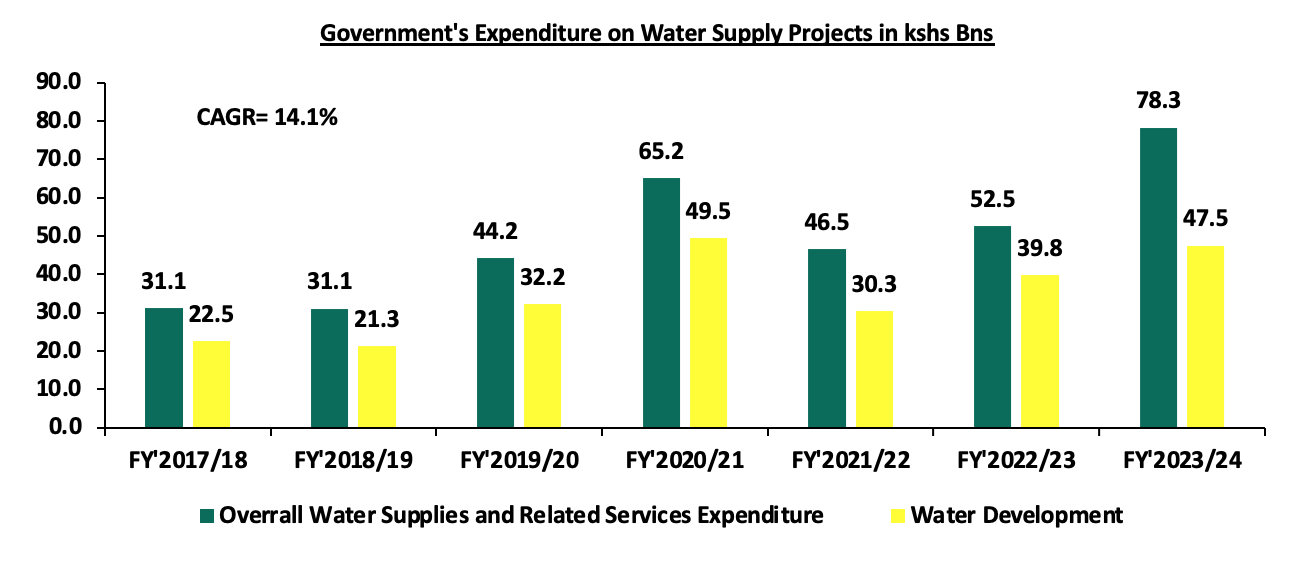
According to the Economic Survey 2024 report, water supply accounted for 12.1% of the environment and natural resources sector value output at Kshs 65.0 bn. This was in comparison to the overall environment and natural resources sector which recorded a value output of Kshs 534.5 bn, a 3.5% share contribution to the country’s Gross Domestic Product (GDP) as at 2023. In terms of expenditure, the report highlights that the government’s expenditure on water supplies and related services is projected to rise by 49.3% to KSh 78.4 bn in 2023/24 from Ksh 52.5 bn in 2022/2023. Notable projects ongoing during the period under review include rehabilitation of 400 water supply projects in Mandera, Garissa, Wajir, Turkana and Marsabit counties, Karimenu II, Siyoi-Muruny dam in West, Bura Irrigation Rehabilitation Phase II and
Lower Nzoia irrigation infrastructure Project Phase I. However, Expenditure on water Development is expected to rise by 19.3% to KSh 47.5 bn in FY’2023/24 from ksh 39.8bn in FY’2022/23, highlights the government’s ongoing commitment to enhancing the availability and accessibility of safe and sufficient water in various regions by drilling boreholes and maintaining water purification facilities. The graph below shows government’s expenditure on water supply projects and related services in the last five years;
Source: Kenya National Bureau of Statistics
In the Nairobi Metropolitan Area (NMA) government piped water systems and boreholes are the primary sources of water. In terms of water coverage performance, the Water Services Regulatory Board (WASREB’s) Impact Issue Report No.16 highlights NMA’s average water coverage in NMA stands at 53.5% between 2022/23, a 1.7% increase from 51.8% recorded in FY’2021/22. This slow improvement in coverage can be attributed to relatively high urbanization and population growth rates of 3.7% p.a and 2.0% p.a, respectively, against the global average of 1.7% p.a and 0.9% p.a, respectively, as at 2023 sustaining demand for water supply and related services. Some of the completed water projects include: i) Laying 25km water pipelines in Embakasi Central, ii) Westlands bulk water transfer system project, iii) Embakasi West water project, iv) Nairobi Northern collector tunnel water project iv) 19.5km Kiamumbi water line extensions in Kiambu among others.
In terms of coverage per county, Nairobi registered the highest water coverage at 83.0% compared to NMA’s average of 53.5%, as at 2022/23, due to presence of adequate water supply systems and networks. On the other hand, Machakos recorded the least water coverage at 28.0%, attributable to inadequate water supply. WASREB defines water coverage as the number of people served with drinking water expressed as a percentage of the total population within the service area of a utility. The table below show the Nairobi Metropolitan Area water coverage as at 2022/23:
|
Cytonn Report: Nairobi Metropolitan Area Water Coverage |
||
|
County |
2022/23 |
2021/22 |
|
Nairobi |
83.0% |
86.0% |
|
Kiambu |
71.0% |
70.0% |
|
Machakos |
28.0% |
28.0% |
|
Kajiado |
32.0% |
23.0% |
|
Average |
53.5% |
51.8% |
Source: Water Services Regulatory Board (WASREB)
Below is a list of some of the water and sewer system companies within the Nairobi Metropolitan Area;
|
Cytonn Report: Nairobi Metropolitan Area Water and Sewer Service Providers |
|||
|
Company |
County |
Company |
County |
|
Kiambu Water and Sewerage Company |
Kiambu |
Nairobi City Water & Sewerage Company |
Nairobi |
|
Thika Water and Sewerage Company |
Kiambu |
Runda Water Services Provider |
Nairobi |
|
Ruiru-Juja Water and Sanitation |
Kiambu |
Machakos Water and Sewerage Company |
Machakos |
|
Limuru Water and Sewerage Company |
Kiambu |
Mavoko Water and Sewerage Company |
Machakos |
|
Kikuyu Water and Sewerage company |
Kiambu |
Kangundo–Matungulu Water and Sewerage Company |
Machakos |
|
Gatundu Water and Sanitation Company |
Kiambu |
Mwala Water and Sanitation Company |
Machakos |
|
Karimenu Water and Sanitation Company |
Kiambu |
Oloolaiser Water and Sewerage Company |
Kajiado |
|
Kikuyu Water and Sewerage company |
Kiambu |
Nol-Turesh Loitokitok Water & Sanitation Company |
Kajiado |
|
Karuri Water and Sewerage Company |
Kiambu |
Olkejuado Water and Sewerage Company |
Kajiado |
|
Athi Water Works Development Agency |
Nairobi |
Tanathi Water Works Development Agency |
Machakos |
Source: Water Services Regulatory Board
In efforts to bridge the gap of inadequate water and sewer systems within the Nairobi Metropolitan Area, the government has initiated several projects to achieve its goals including;
- Utawala, Mihango Area water supply project in Nairobi county,
- Ruiru water treatment plant project in Kiambu county,
- Limuru, Loroho and Gitiha Areas water supply project in Kiambu county,
- Kiambaa Water Supply Project in Kiambu county,
- Gatundu Water Supply project in Kiambu County,
- Oloitoktok water supply and sanitation project in Kajiado county,
- Namanga mega water project in Kajiado county,
- Mwala Cluster and Matungulu Water Supply and Sanitation project in Machakos County, and,
- Machakos water supply project, among others.
- Sewer Systems
Sewer systems in the Nairobi Metropolitan Area recorded an average network coverage of 24.8% in 2022/23, a slight increase of 2.3% from 22.5% recorded in 2021/22, according to the Impact Report Issue No. 16 published by the Water Services Regulator Board (WASREB). This can be attributed to the completion of numerous projects during the period such as i) Njiru sewer line extension, ii) Gatundu, Karimenu and Karure sewer systems, iii) Donholm - Savannah Sewer Rehabilitation and Upgrade, iv) Kiamaiko sewer rehabilitation, v) Riruta sewer extension works, and vi) Athi River sewer lines construction and upgrade projects among others.
Notably, Nairobi County led with the highest coverage at 49.0%, while counties like Kajiado had minimal connectivity with majority of the population still relying on alternative systems such pit latrines, septic tanks, and bio digesters. The table below shows the water and sewer coverage of various counties within the NMA as at 2022/23;
|
Cytonn Report: Nairobi Metropolitan Area Sewer Systems Coverage |
||
|
County |
Sewer Coverage 2021/22 |
Sewer Coverage 2022/23 |
|
Nairobi |
50.0% |
49.0% |
|
Kiambu |
24.0% |
30.0% |
|
Machakos |
16.0% |
20.0% |
|
Kajiado |
0.0% |
0.0% |
|
Average |
22.5% |
24.8% |
Source: Water Services Regulatory Board (WASREB)
Despite slight improvements in coverage, there remains a significant need for adequate sewer systems in the Nairobi Metropolitan Area. The government is addressing this through ongoing sewer line improvement and rehabilitation projects including;
- Riruta Sewer Extension Works in Nairobi city,
- Donholm and Savannah Sewer Rehabilitation and Upgrade Project in Nairobi County,
- Njiru Sewer Line Extension Project in Nairobi County,
- Construction of Machakos Sewerage Project in Machakos County,
- Kiambu Ruaka Sewerage Project in Kiambu County,
- Mavoko National Housing Corporation Sewerage Project in Machakos County,
- Machakos Sewerage Project, among many others.
The table below presents a summary of infrastructure coverage in the Nairobi Metropolitan Area;
|
Cytonn Report: Summary of Infrastructure Coverage in the Nairobi Metropolitan Area |
|||||
|
# |
County |
Ongoing Road Projects Coverage in Km (2022/23) |
Completed Road Projects in Km (2022 /23) |
Water Coverage (2022/23) |
Sewer Coverage (2022/23) |
|
1 |
Nairobi |
60.3 |
65.8 |
83.0% |
49.0% |
|
2 |
Kiambu |
516.0 |
23.0 |
71.0% |
30.0% |
|
3 |
Machakos |
208.0 |
8.6 |
28.0% |
20.0% |
|
4 |
Kajiado |
142.4 |
7.4 |
32.0% |
0.0% |
|
|
Total |
926.7 |
104.8 |
|
|
|
|
Average |
|
|
53.5% |
24.8% |
Source: KeRRA, KURA, KeNHA, WASREB
Section IV: Importance of Roads, Water, and, Sewer Network Availability to the Real Estate Sector
The connection between infrastructure and Real Estate is a critical one, the development of infrastructural systems is essential for economic progress and has a direct impact on the real estate sector. Strong infrastructure not only supports the growth of residential, commercial, and industrial properties but also drives investment and may lead to improvement in demand for properties in areas that are well covered.
- Improved Price of properties: Good infrastructure directly boosts property prices by improving accessibility, convenience, and overall liveability. Well-developed roads, public transportation, and essential utilities make areas more desirable, attracting buyers and renters. For real estate developers, areas with existing infrastructure more often reduces construction costs making it more attractive for the developers to build in such areas,
- Opening Up Areas for Investments: Improvement of existing infrastructure such as roads networks opens up areas for investment by improving accessibility and connectivity, making these areas more attractive to developers and businesses. Some of notable developments launched around major roads include the Global Trade Centre (GTC), Crystal Rivers Mall, and Imaara Mall, all located along the Nairobi Expressway project, Mi Vida Homes and Garden City Business park along the Thika Superhighway, and Two rivers mall along Limuru road,
- Reduction of Development Costs: Infrastructure reduces development costs by providing essential services like roads, water, electricity, and sewerage systems which developers would have incurred a cost to install. The Center for Affordable Housing Finance Africa (CAHF), estimates that infrastructure costs accounts for averagely 11.1% of total developmental costs,
- Enhancing Trade and commercial activities: The development of infrastructure, particularly transport networks and utilities, enhances trade operations by improving the efficiency and speed of moving goods and services thus attracting both local and international trade.
- Enhance the Quality of Housing Stock: Presence of adequate infrastructural amenities such as roads, water supply and sanitation services including sewerage systems significantly enhances the quality of delivered housing stock. Subsequently, adequate infrastructure improves the living standards of citizens through access to clean water, sanitation and good roads
- Promoting Tourism and Attracting Foreign Investments: A well-developed infrastructure framework not only encourages domestic investment but also attracts international capital. Kenya’s ongoing infrastructure improvements have positioned the country as an important regional hub. As result, the country has experienced an influx of foreign investments with notable ones in 2024 including JPMorgan Chase & Co, Bill and Melinda Gates Foundation and Genesis.
Section V: Conclusion and Recommendation
To gauge Real Estate investment opportunities based on infrastructure, we looked at the key infrastructural sectors and ranked them in terms of performance and availability as follows;
The points are 1-4, with 4 awarded to the Best Performing Area Based on Infrastructure Availability
|
Cytonn Report: County Ranking based on the State of Infrastructure Development 2023/24 |
||||||
|
County |
Completed Roads |
Roads in Pipeline |
Water Connectivity |
Sewer Connectivity |
Average Points |
Rank |
|
Nairobi |
4 |
2 |
4 |
4 |
3.5 |
1 |
|
Kiambu |
3 |
4 |
3 |
3 |
3.3 |
2 |
|
Machakos |
1 |
3 |
2 |
2 |
2.0 |
3 |
|
Kajiado |
1 |
2 |
1 |
1 |
1.3 |
4 |
Source: Cytonn Research
Based on the above infrastructure services, Nairobi and Kiambu emerge as the best Counties for Real Estate developments such as residential and commercial units, due to the presence of adequate completed road networks, and, adequate water and sewer connectivity. Some of the areas to invest in Nairobi County that are at least endowed with some infrastructure infrastructure include; Westlands, Gigiri, Ridgeways, Karen, Runda, Kilimani, Upperhill, Parklands, Upperhill, Spring Valley, Kileleshwa, Syokimau among many others. Some of the best areas to implement Real Estate investments in Kiambu county include; Thika, Kiambu town, Ruiru, and Juja among others. Kajiado ranks at the bottom of all four counties, due to absence of adequate infrastructural amenities such as sewered sanitation services, water connectivity and low volume of road networks.
We anticipate the government continued efforts to improve infrastructure in the country more so in road and transport sector in line with its BETA agenda and economic stimulation goal. However, this may be slowed down by the reduction in allocation to state department of roads by 4.4% in the supplementary budget FY’2024/25,to ksh 184.8 bn from the ksh193.4 bn set in the FY’2024/25 budget. Consequently, we anticipate that going forward, there will be a decline in the number of infrastructure projects completed, while the number of stalled infrastructure projects across the country is expected to continue rising due financial constraints. Although the government acknowledges the importance of Public-Private Partnerships (PPPs) in tackling financing challenges, we believe that prioritizing PPPs is fundamental in addressing funding shortfalls. By leveraging the resources and expertise of the private sector, PPPs can support sustainable infrastructure development and stimulate economic growth.
Please note that we shall have an extra ordinary general meeting (EGM) on 9th January 2025 at 9.00AM via online link: https://shorturl.at/6sBgr
The agenda for the EGM is to:
1. update on your investments,
2. Appoint counsel to act for investors in matters relating to your investments
Disclaimer: The views expressed in this publication are those of the writers where particulars are not warranted. This publication, which is in compliance with Section 2 of the Capital Markets Authority Act Cap 485A, is meant for general information only and is not a warranty, representation, advice or solicitation of any nature. Readers are advised in all circumstances to seek the advice of a registered investment advisor.

