Nairobi Metropolitan Area Commercial Office Report 2023, & Cytonn Weekly #11/2023
By Research, Mar 19, 2023
Executive Summary
Fixed Income
During the week, T-bills remained oversubscribed, with the overall subscription rate coming in at 121.6%, albeit lower than the 148.5% recorded the previous week. Investor’s preference for the shorter 91-day paper persisted as they sought to avoid duration risk, with the paper receiving bids worth Kshs 7.3 bn against the offered Kshs 4.0 bn, translating to an oversubscription rate of 182.3%, although significantly lower than the 501.0% recorded the previous week. Similarly, the 182-day paper recorded an oversubscription rate of 174.7%, a shift from the undersubscription rate of 79.1% recorded the previous week. On the other hand, the subscription rates for the 364-day paper declined to 44.3% from 76.8% recorded the previous week. The government accepted bids worth Kshs 28.8 bn out of the Kshs 29.2 bn total bids received, translating to an acceptance rate of 98.6%. The yields on the government papers were on an upward trajectory, with the yields on the 364-day paper, 182-day and 91-day papers increasing by 3.0 bps, 6.9 bps and 3.8 bps to 10.8%, 10.3% and 9.8%, respectively;
In the primary market the government was seeking to raise an additional Kshs 20.0 bn for infrastructural development by offering a tap sale of bond issue no. IFB1/2023/017 with tenor to maturity of 17.0 years. The government received bids worth Kshs 12.7 bn translating to an undersubscription rate of 63.6% with the government accepting bids worth Kshs 12.7 bn translating to an acceptance rate of 100.0%. The average rate for the accepted bids and coupon rate for the bond is 14.4%;
Additionally, the government re-opened three bonds FXD2/2018/10, FXD1/2022/03 and FXD1/2019/15 seeking to raise additional Kshs 50.0 bn for budgetary support. The government seeks to raise Kshs 20.0 bn through the FXD2/2018/10, with closure date for bidding set on 4th April, 2023 and Kshs 30.0 bn through the FXD1/2022/03 and FXD1/2019/15, with closure date for bidding set on 18th April, 2023. The bonds have tenors to maturity of 2.1 years, 5.8 years and 10.9 years for the FXD1/2022/03, FXD2/2018/10 and FXD1/2019/15 respectively, and coupon rates of 11.8%, 12.5% and 12.9% for the FXD1/2022/03, FXD2/2018/10 and FXD1/2019/15 respectively. We anticipate the bonds to be undersubscribed as investors seek to avoid duration risk, as well as concerns on the government’s ability to sustain the current debt servicing costs. Our recommended bidding range for the bonds are; 12.6%-13.1% for FXD1/2022/03, 13.7%-14.2% for the FXD2/2018/10 and 13.9%-14.4% for the FXD1/2019/15 based on bonds of similar tenor trading range;
During the week, the National Treasury gazetted the revenue and net expenditures for the eight months of FY’2022/2023, ending 28th February 2023;
During the week, the Energy and Petroleum Regulatory Authority (EPRA) released their monthly statement on the maximum retail fuel prices in Kenya effective 15th March 2023 to 14th April 2023. Notably, prices of Super Petrol increased by Kshs 2.0 per litre to Kshs 179.3, while prices of Diesel and Kerosene remained unchanged for the fourth consecutive month at Kshs 162.0 and Kshs 145.9 per litres, respectively;
Equities
During the week, the equities market remained on a downward trajectory, with NASI, NSE 20 and NSE 25 declining by 12.3%, 4.9% and 9.7%, respectively, taking the YTD performance to losses of 18.8%, 8.7%, and 13.8% for NASI, NSE 20, and NSE 25, respectively. The equities market performance was mainly driven by losses recorded by large cap stocks such as Safaricom of 20.6%, whose market cap is 41.0% of the entire bourse, and banking stocks such as KCB Group, Equity Group and NCBA of 17.2%, 11.3%, and 7.5%, respectively. The equities market performance was mainly attributable to massive capital flight as foreign investors moved to developed markets with the European Central Bank raising the European Interest Base Rate (ECB) by 50.0 bps to 3.50% from 3.00% on 16th March 2023. Further, the U.S. Federal Reserve Board is expected to hike their interest from the range of 4.50%-4.75% in the next sitting scheduled for 22nd March 2023. The losses in the equities market were however marginally mitigated by gains recorded by other large cap stocks such as Stanbic Holdings and EABL of 1.6% and 0.4%, respectively;
During the week, four listed banks released their FY’2022 financial results all recording an increase in their Core earnings per share. ABSA Bank Kenya, Standard Chartered Bank Kenya, Co-operative Bank and KCB Group recorded an increase in their Core earnings per share of 34.2%, 34.0%, 33.2% and 19.5%, respectively;
Also, during the week, the Central Bank of Kenya (CBK) announced that Premier Bank Limited Somalia (PBLS) had completed acquisition of 62.5% shareholding of First Community Bank Limited (FCB) effective 27th March 2023;
Real Estate
During the week, the Kenya Roads Board (KRB), released the Annual Public Roads Programme 2022/2023 report highlighting that Kshs 67.2 bn has been allocated in FY’2022/2023 to various road agencies. The amount represents a 22.2% increase in the funds allocated for the maintenance of roads from the Kshs 55.0 bn spent in the FY’2021/22, an indication that the government continued priority on improving road developments across the country. In the hospitality sector, Dusit International, a Bangkok based Thai Hotel and property development company announced plans to open a hotel-serviced apartment in Westlands Nairobi in 2023 dubbed ‘Dusit Princes Hotel Residences’, along Mimosa Lane off Church Road. The upper-middle class property will consist of a hybrid of 56 one bedroom and 30 studio apartments and 14 deluxe hotel rooms, an Italian inspire restaurant, a rooftop bar, heated swimming pool, rooftop gym, and a 150 guest capacity theatre-styled meeting room. In the Real Estate Investment Trusts (REITs) segment, Fahari I-REIT closed the week trading at an average price of Kshs 6.3 per share on the Nairobi Securities Exchange, a 3.6% gain from Kshs 6.1 per share recorded the previous week. On the Unquoted Securities Platform as at 17th March 2023, Acorn D-REIT and I-REIT closed the week trading at Kshs 23.9 and Kshs 20.9 per unit, respectively, a 19.4% and 4.4% gain for the D-REIT and I-REIT, respectively, from the Kshs 20.0 inception price;
Focus of the Week
In 2022, we published the Nairobi Metropolitan Area Commercial Office Report 2022 themed ‘Changing Working Patterns Driving the Market’, in which we highlighted the performance of the sector in 2021, as well as giving insights on the outlook and areas best fit for investment opportunities. According to the report, the sector witnessed improved performance, with the average rental yields coming in at 7.3% in 2021, 0.3% points higher than the 7.0% recorded in 2020, attributed to continued post COVID-19 pandemic recovery, an improved business environment and expansion in activities by various firms. The average occupancy rates declined slightly by 0.1% points to 77.6% in 2021, from 77.7% recorded in 2020, this is as some firms still embraced a work from home policy. Asking rents and prices stabilized to an average of Kshs 94 and Kshs 12,108 per SQFT respectively in 2021, from Kshs 93 and Kshs 12,280 per SQFT, respectively, recorded in 2020. In addition, there was an oversupply of 6.7 mn SQFT in office spaces in the market, which continued to subdue the sector’s optimum performance. In 2023, we update our previous research with the Commercial Office Report 2023 themed ‘Persisting Tenant’s Market’, in order to determine the market’s performance and analyse the ongoing trends;
Investment Updates:
- Weekly Rates:
- Cytonn Money Market Fund closed the week at a yield of 11.03%. To invest, dial *809# or download the Cytonn App from Google Playstore here or from the Appstore here;
- Cytonn High Yield Fund closed the week at a yield of 13.90% p.a. To invest, email us at sales@cytonn.com and to withdraw the interest, dial *809# or download the Cytonn App from Google Playstore here or from the Appstore here;
- Lee Mathenge, a Product Development, Service Design & Innovation Analyst at Cytonn Investments, was on a twitter space hosted by Sharp Daily, moderated by Fossie Adhiambo, a Product Development, Service Design & Innovation Assistant at Cytonn Investments. Listen to the conversation here;
- We continue to offer Wealth Management Training every Wednesday and every third Saturday of the month, from 9:00 am to 11:00 am, through our Cytonn Foundation. The training aims to grow financial literacy among the general public. To register for any of our Wealth Management Trainings, click here;
- If interested in our Private Wealth Management Training for your employees or investment group, please get in touch with us through wmt@cytonn.com;
- Cytonn Insurance Agency acts as an intermediary for those looking to secure their assets and loved ones’ future through insurance namely; Motor, Medical, Life, Property, WIBA, Credit and Fire and Burglary insurance covers. For assistance, get in touch with us through insuranceagency@cytonn.com;
- Cytonn Asset Managers Limited (CAML) continues to offer pension products to meet the needs of both individual clients who want to save for their retirement during their working years and Institutional clients that want to contribute on behalf of their employees to help them build their retirement pot. To more about our pension schemes, kindly get in touch with us through pensions@cytonn.com;
Real Estate Updates:
- For an exclusive tour of Cytonn’s real estate developments, visit: Sharp Investor's Tour, and for more information, email us at sales@cytonn.com;
- Phase 3 of The Alma is now ready for occupation and the show house is open daily. To join the waiting list to rent, please email properties@cytonn.com;
- For Third Party Real Estate Consultancy Services, email us at rdo@cytonn.com;
- For recent news about the group, see our news section here;
Hospitality Updates:
- We currently have promotions for Staycations. Visit cysuites.com/offers for details or email us at sales@cysuites.com;
Money Markets, T-Bills Primary Auction:
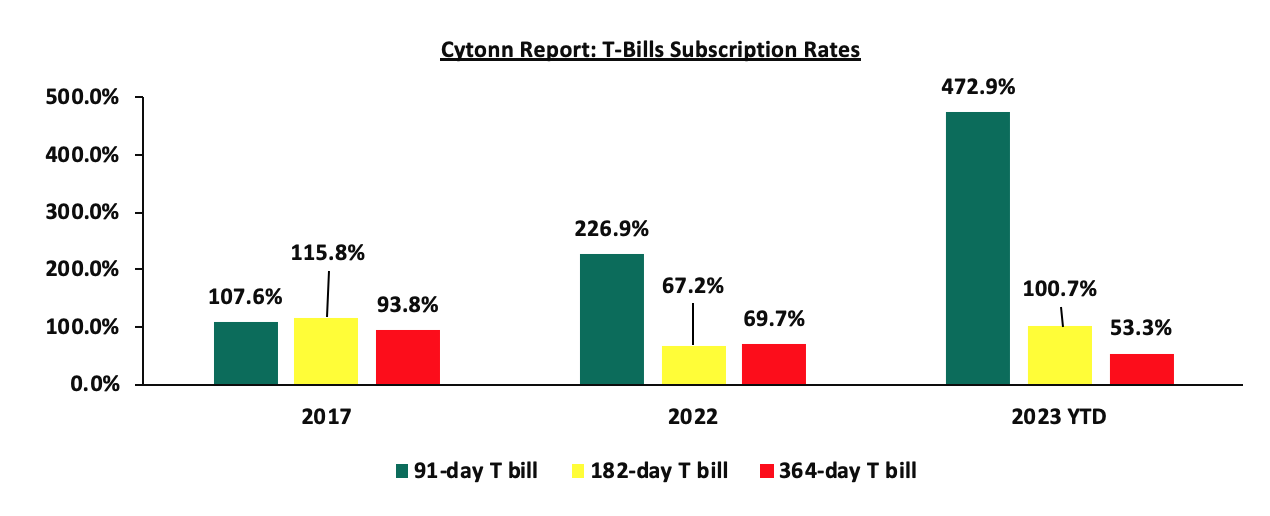
During the week, T-bills remained oversubscribed, with the overall subscription rate coming in at 121.6%, albeit lower than the 148.5% recorded the previous week. Investor’s preference for the shorter 91-day paper persisted as they sought to avoid duration risk, with the paper receiving bids worth Kshs 7.3 bn against the offered Kshs 4.0 bn, translating to an oversubscription rate of 182.3%, although significantly lower than the 501.0% recorded the previous week. Similarly, the 182-day paper recorded an oversubscription rate of 174.7%, a shift from the undersubscription rate of 79.1% recorded the previous week. On the other hand, the subscription rates for the 364-day paper declined to 44.3% from 76.8% recorded the previous week. The government accepted bids worth Kshs 28.8 bn out of the Kshs 29.2 bn total bids received, translating to an acceptance rate of 98.6%. The yields on the government papers were on an upward trajectory, with the yields on the 364-day paper, 182-day and 91-day papers increasing by 3.0 bps, 6.9 bps and 3.8 bps to 10.8%, 10.3% and 9.8%, respectively. The chart below compares the overall average T- bills subscription rates obtained in 2017, 2022 and 2023 Year to Date (YTD):
In the primary market the government was seeking to raise an additional Kshs 20.0 bn for infrastructural development by offering a tap sale of bond issue no. IFB1/2023/017 with tenor to maturity of 17.0 years. The bond received bids worth Kshs 12.7 bn translating to an undersubscription rate of 63.6% with the government accepting bids worth Kshs 12.7 bn translating to an acceptance rate of 100.0%. The average rate for the accepted bids and coupon rate for the bond is 14.4%. Additionally, the government re-opened three bonds FXD2/2018/10, FXD1/2022/03 and FXD1/2019/15 seeking to raise additional Kshs 50.0 bn for budgetary support. The government seeks to raise Kshs 20.0 bn through the FXD2/2018/10, with closure date for bidding set on 4th April, 2023 and Kshs 30.0 bn through the FXD1/2022/03 and FXD1/2019/15, with closure date for bidding set on 18th April, 2023. The bonds have tenors to maturity of 2.1 years, 5.8 years and 10.9 years for the FXD1/2022/03, FXD2/2018/10 and FXD1/2019/15 respectively, and coupon rates of 11.8%, 12.5% and 12.9% for the FXD1/2022/03, FXD2/2018/10 and FXD1/2019/15 respectively. We anticipate the bonds to be undersubscribed as investors seek to avoid duration risk, as well as concerns on the government’s ability to sustain the current debt servicing costs. Our recommended bidding range for the bonds are; 12.6%-13.1% for FXD1/2022/03, 13.7%-14.2% for the FXD2/2018/10 and 13.9%-14.4% for the FXD1/2019/15 based on bonds of similar tenor trading range.
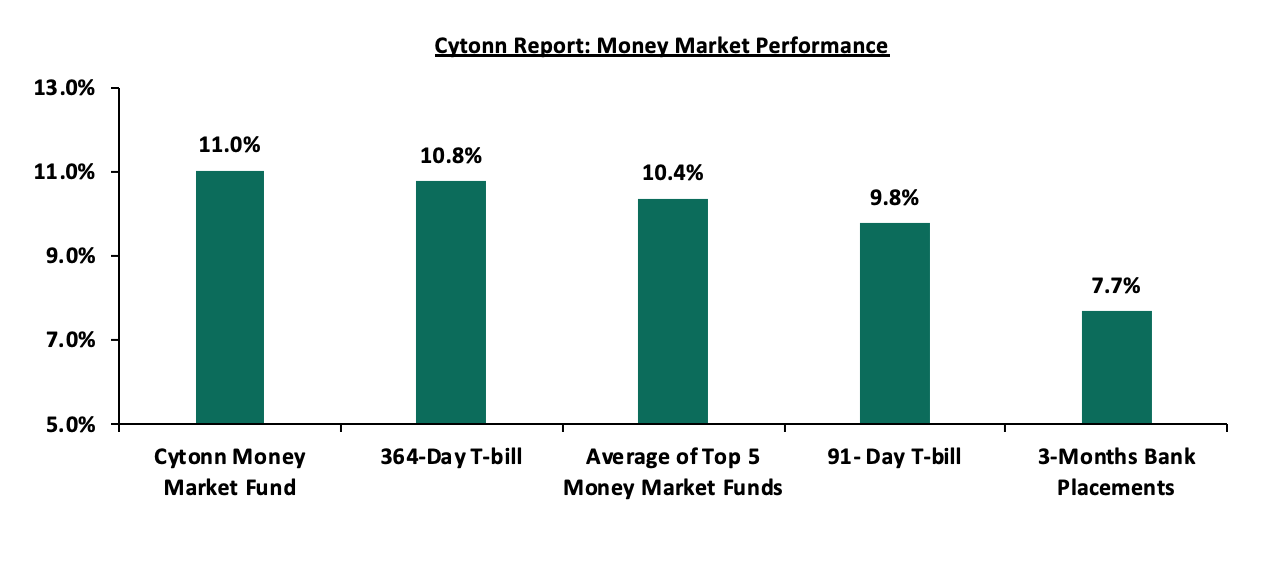
In the money markets, 3-month bank placements ended the week at 7.7% (based on what we have been offered by various banks), while the yield on the 364-day and 91-day T-bill increased by 3.0 bps and 3.8 bps to 10.8% and 9.8% from 10.7% and 9.7% respectively, recorded the previous week. Similarly, the average yields of the Top 5 Money Market Funds increased by 5.4 bps to close the week at 10.4%, from 10.3% recorded the previous week. The yield on Cytonn Money Market Fund remained relatively unchanged at 11.0%, from what was recorded the previous week.
The table below shows the Money Market Fund Yields for Kenyan Fund Managers as published on 17th March 2023:
|
Cytonn Report: Money Market Fund Yield for Fund Managers as published on 17th March 2023 |
||
|
Rank |
Fund Manager |
Effective Annual Rate |
|
1 |
Cytonn Money Market Fund (dial *809# or download Cytonn App) |
11.0% |
|
2 |
Dry Associates Money Market Fund |
10.3% |
|
3 |
Apollo Money Market Fund |
10.2% |
|
4 |
Madison Money Market Fund |
10.2% |
|
5 |
NCBA Money Market Fund |
10.1% |
|
6 |
Kuza Money Market fund |
10.1% |
|
7 |
Nabo Africa Money Market Fund |
10.0% |
|
8 |
Zimele Money Market Fund |
9.9% |
|
9 |
Sanlam Money Market Fund |
9.9% |
|
10 |
Old Mutual Money Market Fund |
9.9% |
|
11 |
KCB Money Market Fund |
9.6% |
|
12 |
Co-op Money Market Fund |
9.6% |
|
13 |
AA Kenya Shillings Fund |
9.6% |
|
14 |
GenCap Hela Imara Money Market Fund |
9.5% |
|
15 |
Jubilee Money Market Fund |
9.4% |
|
16 |
CIC Money Market Fund |
9.3% |
|
17 |
GenAfrica Money Market Fund |
9.3% |
|
18 |
British-American Money Market Fund |
9.3% |
|
19 |
ICEA Lion Money Market Fund |
8.8% |
|
20 |
Orient Kasha Money Market Fund |
8.8% |
|
21 |
Absa Shilling Money Market Fund |
8.2% |
|
22 |
Mali Money Market Fund |
8.2% |
|
23 |
Equity Money Market Fund |
6.6% |
Source: Business Daily
Liquidity:
During the week, liquidity in the money markets tightened, with the average interbank rate increasing to 6.9% from 6.7% recorded the previous week, partly attributable to tax remittances that offset government payments. The average interbank volumes traded declined by 17.6% to Kshs 17.5 bn from Kshs 21.3 bn recorded the previous week.
Kenya Eurobonds:
During the week, the yields on Eurobonds were on an upward trajectory with the yield on the 7-year Eurobond issued in 2019 increasing the most, having gained by 2.3% points to 13.4% from 11.1% recorded the previous week. The rise in the country’s Eurobond yields is mainly on the back of increased concerns about the United States dollar shortages currently experienced in the economy, coupled with increased debt servicing concerns and S&P Global Ratings downgrading of Kenya’s outlook to negative from stable last month, citing a weakening liquidity position. The table below shows the summary of the performance of the Kenyan Eurobonds as of 16th March 2023;
|
Cytonn Report: Kenya Eurobonds Performance |
||||||
|
|
2014 |
2018 |
2019 |
2021 |
||
|
Date |
10-year issue |
10-year issue |
30-year issue |
7-year issue |
12-year issue |
12-year issue |
|
Amount Issued (USD bn) |
2.0 |
1.0 |
1.0 |
0.9 |
1.2 |
1.0 |
|
Years to Maturity |
1.3 |
5.0 |
25.0 |
4.2 |
9.2 |
11.3 |
|
Yields at Issue |
6.6% |
7.3% |
8.3% |
7.0% |
7.9% |
6.2% |
|
2-Jan-23 |
12.9% |
10.5% |
10.9% |
10.9% |
10.8% |
9.9% |
|
1-Mar-23 |
12.1% |
10.7% |
11.0% |
10.9% |
10.8% |
10.2% |
|
9-Mar-23 |
11.8% |
11.2% |
11.3% |
11.1% |
11.3% |
10.5% |
|
10-Mar-23 |
11.9% |
11.4% |
11.4% |
11.5% |
11.4% |
10.6% |
|
13-Mar-23 |
12.4% |
11.5% |
11.5% |
11.8% |
11.6% |
10.9% |
|
14-Mar-23 |
12.9% |
11.9% |
11.7% |
12.5% |
11.8% |
11.1% |
|
15-Mar-23 |
13.2% |
12.2% |
11.9% |
12.8% |
12.1% |
11.3% |
|
16-Mar-23 |
14.0% |
12.8% |
12.3% |
13.4% |
12.5% |
11.6% |
|
Weekly Change |
2.2% |
1.6% |
1.0% |
2.3% |
1.2% |
1.1% |
|
MTD Change |
1.9% |
2.1% |
1.3% |
2.5% |
1.7% |
1.4% |
|
YTD Change |
1.1% |
2.3% |
1.4% |
2.5% |
1.7% |
1.7% |
Source: Central Bank of Kenya (CBK) and National Treasury
Kenya Shilling:
During the week, the Kenya Shilling depreciated by 0.8% against the US dollar to close the week at Kshs 129.9, from Kshs 128.9 recorded the previous week, partly attributable to increased dollar demand from manufacturers and importers, especially oil and energy sectors against a slower supply of hard currency. On a year to date basis, the shilling has depreciated by 5.2% against the dollar, adding to the 9.0% depreciation recorded in 2022. We expect the shilling to remain under pressure in 2023 as a result of:
- High global crude oil prices on the back of persistent supply chain bottlenecks coupled with high demand. The high crude oil prices have inflated Kenya’s import bill and as a result, petroleum products imports have continued to weigh heavily on the country’s import bill, and accounted for 27.6% of the total import bill in Q3’2022, up from 25.6% in Q2’2022 and much higher than 15.2% recorded in Q3’2021,
- An ever-present current account deficit estimated at 4.9% of GDP in 2022, despite improving by 0.3% points from 5.2% recorded in 2021,
- The need for Government debt servicing which continues to put pressure on forex reserves given that 69.3% of Kenya’s External debt was US Dollar denominated as of October 2022, and,
The shilling is however expected to be supported by:
- Diaspora remittances standing at a cumulative USD 658.6 mn in 2023 as of February 2023, albeit 0.3% lower than the USD 660.3 mn recorded over the same period in 2022.
Key to note, Kenya’s forex reserves remained relatively unchanged at USD 6.6 bn as at 16th March 2023, similar to what was recorded the previous week. As such, the country’s months of import cover also remained unchanged at 3.7 months, similar to what was recorded the previous week, and below the statutory requirement of maintaining at least 4.0-months of import. The chart below summarizes the evolution of Kenya months of import cover over the last 10 years:
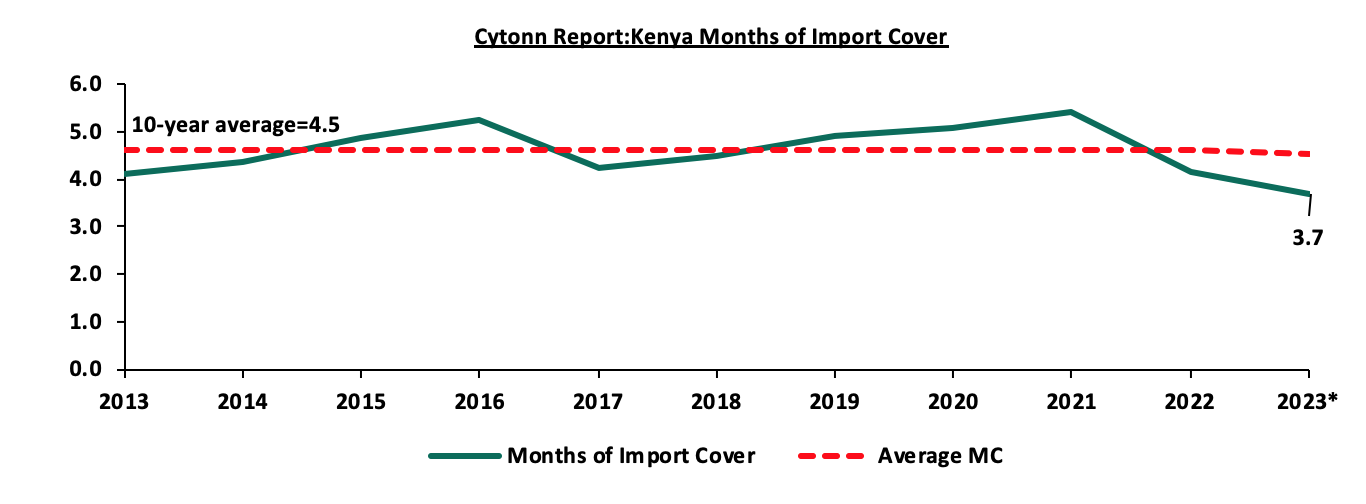
*Figure as at 16th March 2023
Weekly Highlights:
- Revenue and Net Exchequer for FY’2022/23
During the week, the National Treasury gazetted the revenue and net expenditures for the eight months of FY’2022/2023, ending 28th February 2023. Below is a summary of the performance:
|
Cytonn Report: FY'2022/2023 Budget Outturn - As at 28th February 2023 |
|||||
|
Amounts in Kshs billions unless stated otherwise |
|||||
|
Item |
12-months Original Estimates |
Actual Receipts/Release |
Percentage Achieved |
Prorated |
% achieved of prorated |
|
Opening Balance |
|
0.6 |
|
|
|
|
Tax Revenue |
2,071.9 |
1,236.2 |
59.7% |
1,381.3 |
89.5% |
|
Non-Tax Revenue |
69.7 |
44.5 |
63.9% |
46.4 |
95.9% |
|
Total Revenue |
2,141.6 |
1,281.3 |
59.8% |
1,427.7 |
89.7% |
|
External Loans & Grants |
349.3 |
201.0 |
57.5% |
232.9 |
86.3% |
|
Domestic Borrowings |
1,040.5 |
333.3 |
32.0% |
693.6 |
48.0% |
|
Other Domestic Financing |
13.2 |
15.5 |
117.4% |
8.8 |
176.1% |
|
Total Financing |
1,403.0 |
549.8 |
39.2% |
935.3 |
58.8% |
|
Recurrent Exchequer issues |
1,178.4 |
726.9 |
61.7% |
785.6 |
92.5% |
|
CFS Exchequer Issues |
1,571.8 |
756.5 |
48.1% |
1,047.9 |
72.2% |
|
Development Expenditure & Net Lending |
424.4 |
162.6 |
38.3% |
282.9 |
57.5% |
|
County Governments + Contingencies |
370.0 |
183.2 |
49.5% |
246.7 |
74.3% |
|
Total Expenditure |
3,544.6 |
1,829.1 |
51.6% |
2,363.1 |
77.4% |
|
Fiscal Deficit excluding Grants |
1,403.0 |
547.8 |
39.0% |
935.3 |
58.6% |
|
Total Borrowing |
1,389.8 |
534.3 |
38.4% |
926.5 |
57.7% |
Source: National Treasury and Kenya Gazette
Key takeouts from the release include;
- Total revenue collected as at the end of February 2023 amounted to Kshs 1,281.3 bn, equivalent to 59.8% of the original estimates of Kshs 2,141.6 bn for FY’2022/2023 and is 89.7% of the prorated estimates of Kshs 1,427.7 bn. We note that the government has not been able to meet its prorated revenue targets eight months into the FY’2022/2023 partly attributable to the tough macroeconomic environment in the country as a result of elevated inflationary pressures with February 2023 coming in at 9.2%, above the CBK ceiling of 7.5%. Cumulatively, tax revenues amounted to Kshs 1,236.2 bn, equivalent to 59.7% of the original estimates of Kshs 2,071.9 bn and 89.5% of the prorated estimates of Kshs 1,381.3 bn,
- Total financing amounted to Kshs 549.8 bn, equivalent to 39.2% of the original estimates of Kshs 1,403.0 bn and is equivalent to 58.8% of the prorated estimates of Kshs 935.3 bn. Additionally, domestic borrowing amounted to Kshs 333.3 bn, equivalent to 32.0% of the original estimates of Kshs 1,040.5 bn and is 48.0% of the prorated estimates of Kshs 693.6 bn,
- The total expenditure amounted to Kshs 1,829.1 bn, equivalent to 51.6% of the original estimates of Kshs 3,544.6 bn, and is 77.4% of the prorated target expenditure estimates of Kshs 2,363.1 bn. Additionally, the net disbursements to recurrent expenditure came in at Kshs 726.9 bn, equivalent to 61.7% of the original estimates of Kshs 1,178.4 bn and 92.5% of the prorated estimates of Kshs 785.6 bn,
- Consolidated Fund Services (CFS) Exchequer issues (refers to the Consolidated Fund established in the Kenya’s constitution into which development partners deposit funds before disbursing to the Exchequer accounts for projects such as servicing of public debt, payment of pensions and gratuities, salaries and allowances and subscription to International Organizations) came in at Kshs 756.5 bn, equivalent to 48.1% of the original estimates of Kshs 1,571.8 bn, and 72.2% of the prorated amount of Kshs 1,047.9 bn. The cumulative public debt servicing cost amounted to Kshs 694.0 bn which is 49.8% of the original estimates of Kshs 1,393.1 bn, and is 74.7% of the prorated estimates of Kshs 926.5 bn. Notably, the Kshs 694.0 bn debt servicing cost is equivalent to 54.2% of the actual revenues collected as at the end of February 2023, further emphasizing on how much public debt servicing weighs on the country’s expenditure. Additionally, Recurrent Exchequer issues came in at Kshs 726.9 bn equivalent to 61.7% of the original estimates of Kshs 1,178.4 bn and are 92.5% of the prorated estimates of Kshs 785.6, and,
- Total Borrowings as at the end of February 2023 amounted to Kshs 534.3 bn, equivalent to 38.4% of the original estimates of Kshs 1,389.8 bn for FY’2022/2023 and are 57.7% of the prorated estimates of Kshs 926.5 bn. The cumulative domestic borrowing target of Kshs 1,040.5 bn comprises of adjusted Net domestic borrowings of Kshs 579.1 bn and Internal Debt Redemptions (Roll-overs) of Kshs 461.4 bn.
The government has been unable to meet its revenue prorated targets for the eight months of the FY’2022/2023 on the back of the tough economic situation exacerbated by the elevated inflationary pressures that have remained above the CBK ceiling of 7.5%, with the year on year inflation rate in February 2023 coming in at 9.2%. Notably, the situation is further aggravated by the US dollar shortage that is currently experienced in the economy, resulting in high consumer prices as companies pass the high cost of import and production to consumers by hike in commodities prices. The February Purchasing Managers Index (PMI) also pointed towards a solid deterioration in operating condition with the index registering at 46.6, the first time in six months the index came below the 50.0 no change threshold. In a bid to expand its revenue base and seal tax leakage, the government through the Kenya Revenue Authority recently suspended all tax relief payments. The agency also disclosed that in the past five years it had granted total tax reliefs and incentives amounting to Kshs 610.0 bn, translating to an average of Kshs 122.0 per year which had continued to weigh down the government’s tax collections. We still hold the view that the government revenue targets are relatively ambitious, owing to the current tough economic situation which is expected to continue to impede revenue collection efforts as firms’ records low commodities demand as consumers cut back on spending.
- Fuel Prices
During the week, the Energy and Petroleum Regulatory Authority (EPRA) released their monthly statement on the maximum retail fuel prices in Kenya effective 15th March 2023 to 14th April 2023. Notably, prices of Super Petrol increased by Kshs 2.0 per litre to Kshs 179.3, while prices of Diesel and Kerosene remained unchanged for the fourth consecutive month at Kshs 162.0 and Kshs 145.9 per litres, respectively. Other key take-outs from the performance include;
- The average landed costs of super-petrol, diesel and kerosene by 0.1%, 2.5% and 1.5% to USD 659.5 per cubic metre, USD 759.9 per cubic metre and USD 763.3 per cubic metre in February 2023, from USD 659.9 per cubic metre, USD 779.5 per cubic metre and USD 775.0 per cubic metre in January 2023, respectively,
- The Free On Board (FOB) price of Murban crude oil declined by 11.9% to USD 80.1 per barrel in February 2023 from USD 90.9 per barrel recorded in January 2023,
- The Kenyan Shilling depreciated against the US Dollar by 2.6% to Kshs 134.0 in February 2023 from 130.6 in January 2023, and,
- The price of diesel has been cross subsidized with that of super-petrol, while maintaining a subsidy of Kshs 23.5 per litre on Kerosene in order to cushion consumers from the otherwise high prices.
Key to note, EPRA maintained the Kshs 12.4 per litre margin to Oil Marketing Companies for Super Petrol and increased Diesel margins by 16.0% to Kshs 2.9 per litre from 2.5 per litre, while Kerosene margins remained withheld. This is attributable to super-petrol recording a price stabilization surplus of Kshs 9.0 per litre, diesel remaining balanced, while kerosene recorded a deficit of Kshs 9.4 per litre.
Notably, despite the global fuel prices dropping by 37.3% to USD 73.8 per barrel as of 16th March 2023, from a peak of USD 117.7 per barrel recorded on 1st June 2022, and the average landed costs declining during the month, the prices of super-petrol in the country increased while prices of diesel and kerosene remain elevated based on historical levels. This is mainly attributable to the decision by the government to scale down fuel subsidies coupled with the US dollar shortage being experienced in the economy driven by elevated cost of fuel import. In a bid to alleviate the high demand of US dollar by petroleum importers which consequently leads to high cost of fuel importation, the government signed a deal with foreign government-owned fuel producers’ entities, the Saudi Aramco (ARAMCO), Abu Dhabi National Oil Company (ADNOC) and Emirates National Oil Company (ENOC) to supply Kenya with diesel and super petrol for the next six months on credit. In our view, it is only a temporary fix, and unless the government expedites measures to buffer foreign reserves and resuscitate the currently frail interbank forex market, the economy will once again be hit by elevated US dollar demand 6 months down the line. Furthermore, we still hold the view that, as a measure of fiscal consolidation, the government should eliminate the fuel subsidies, which continue to weigh on its expenditure.
Rates in the Fixed Income market have remained relatively stable due to the relatively ample liquidity in the money market. The government is 6.6% behind its prorated borrowing target of Kshs 418.7 bn having borrowed Kshs 391.2 bn of the Kshs 581.7 bn borrowing target for the FY’2022/2023. We believe that the projected budget deficit of 5.7% is relatively ambitious given the downside risks and deteriorating business environment occasioned by high inflationary pressures. Further, revenue collections are lagging behind, with total revenue as at February 2023 coming in at Kshs 1.3 tn in the FY’2022/2023, equivalent to 59.8% of its target of Kshs 2.1 tn and 89.7% of the prorated target of Kshs 1.4 tn. Therefore, we expect a continued upward readjustment of the yield curve in the short and medium term, with the government looking to bridge the fiscal deficit through the domestic market. Owing to this, our view is that investors should be biased towards short-term fixed-income securities to reduce duration risk.
Market Performance:
During the week, the equities market remained on a downward trajectory, with NASI, NSE 20 and NSE 25 declining by 12.3%, 4.9% and 9.7%, respectively, taking the YTD performance to losses of 18.8%, 8.7%, and 13.8% for NASI, NSE 20, and NSE 25, respectively. The equities market performance was mainly driven by losses recorded by large cap stocks such as Safaricom of 20.6%, whose market cap is 41.0% of the entire bourse, and banking stocks such as KCB Group, Equity Group and NCBA of 17.2%, 11.3%, and 7.5%, respectively. The equities market performance was mainly attributable to massive capital flight as foreign investors moved to developed markets with the European Central Bank raising the European Interest Base Rate (ECB) by 50.0 bps to 3.50% from 3.00% on 16th March 2023. Further, the U.S. Federal Reserve Board is expected to hike their interest from the range of 4.50%-4.75% in the next sitting scheduled for 22nd March 2023. The losses in the equities market were however marginally mitigated by gains recorded by other large cap stocks such as Stanbic Holdings and EABL of 1.6% and 0.4%, respectively.
During the week, equities turnover increased by 90.6% to USD 22.5 mn from USD 11.8 mn recorded the previous week taking the YTD turnover to USD 138.1 mn. Foreign investors remained net sellers, recording a significant net selling position of USD 8.0 mn, from a net selling position of USD 2.9 mn recorded the previous week, taking the YTD net selling position to USD 36.0 mn.
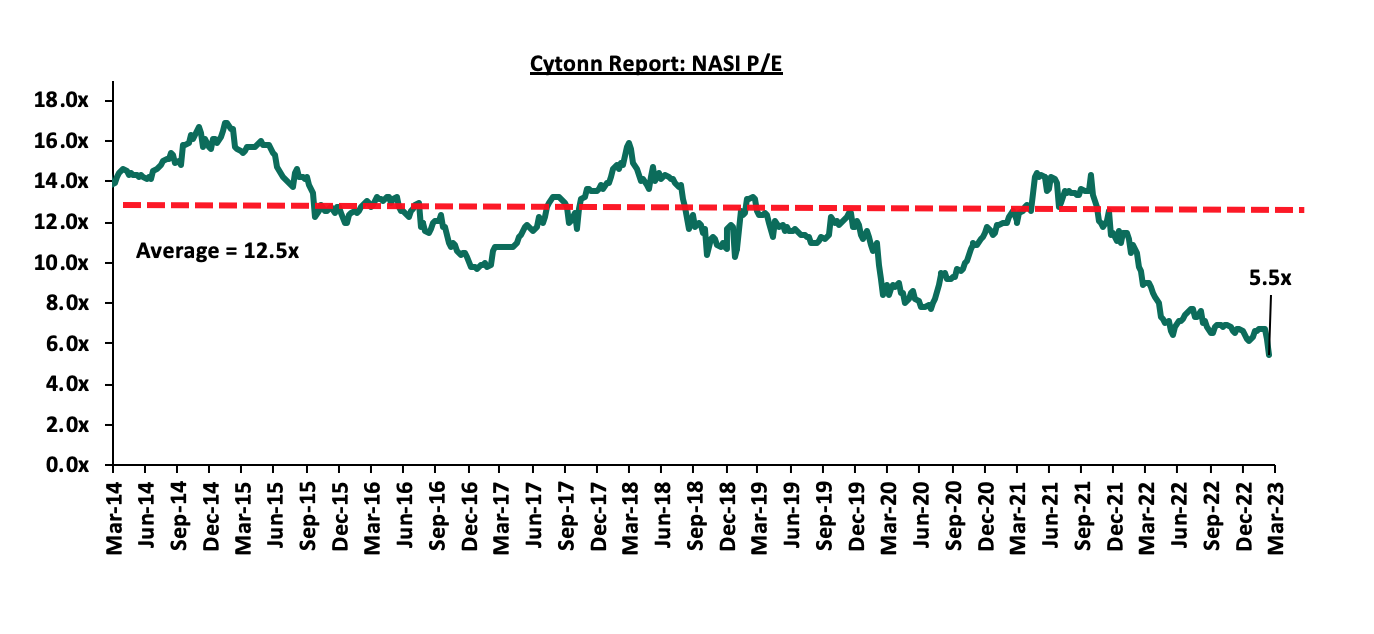
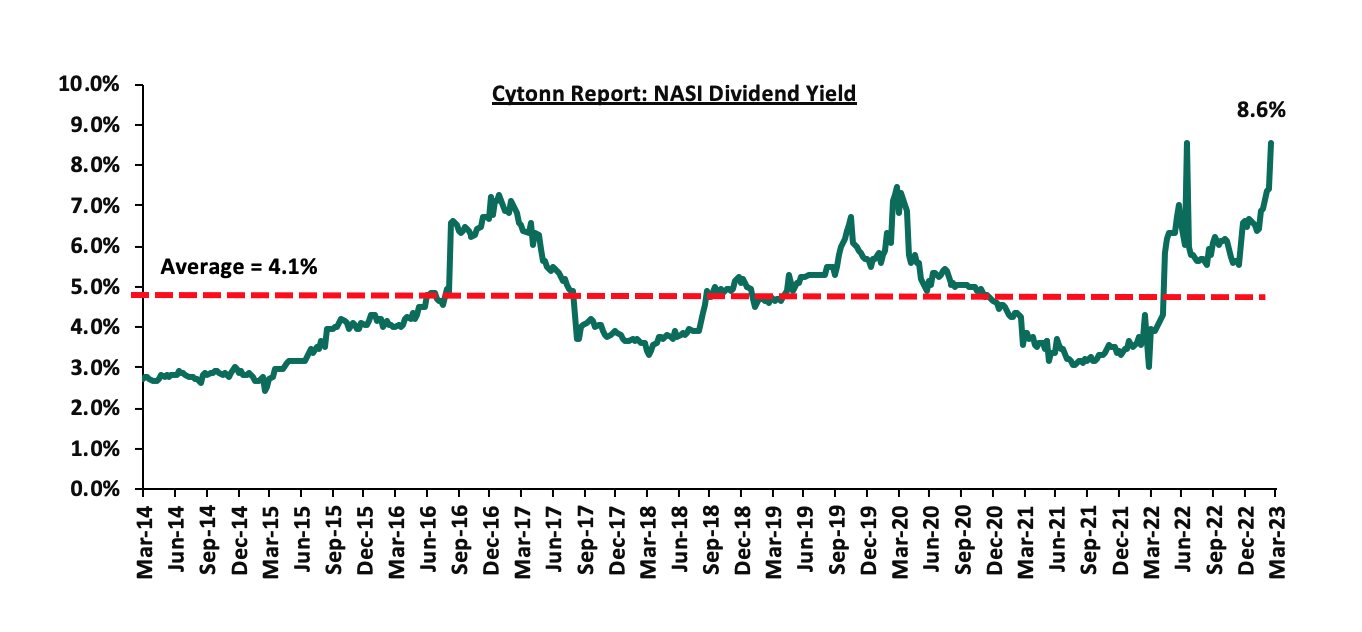
The market is currently trading at a price to earnings ratio (P/E) of 5.5x, 56.2% below the historical average of 12.5x and marks a new trough valuation. The dividend yield stands at 8.6%, 4.5% points above the historical average of 4.1%. Key to note, NASI’s PEG ratio currently stands at 0.8x, an indication that the market is undervalued relative to its future growth. A PEG ratio greater than 1.0x indicates the market is overvalued while a PEG ratio less than 1.0x indicates that the market is undervalued. The charts below indicate the historical P/E and dividend yields of the market;
Weekly highlight
- First Community Bank Limited (FCB) Acquisition by Premier Bank Limited-Somalia (PBLS)
During the week, the Central Bank of Kenya (CBK) announced that Premier Bank Limited Somalia (PBLS) had completed acquisition of 62.5% shareholding of First Community Bank Limited (FCB) effective 27th March 2023. This comes after receiving regulatory approvals from the CBK and the Cabinet Secretary for the National Treasury. FCB, which has been in operation since June 2008, is classified as a tier 3 bank in Kenya with 18 branches and a market share of 0.3% as at December 2022. The acquisition by Premier Bank Limited Somalia (PBLS), comes at a time when FCB has been struggling to meet regulatory Capital adequacy requirements.
FCB’s asset base stood at Kshs 22.1 bn in Q3’2022 with net loans coming in at Kshs 18.2 bn. Customer deposits came in at Kshs 18.2 bn as well, translating to a loan to deposit ratio of 100.0% reflecting the bank’s current inability to amass deposits. Profits after tax came in at Kshs 205.7 mn in Q3’2022, a 8.2% y/y decline from Kshs 224.1 mn in Q3’2021, driven by a faster 15.9% increase in operating expenses to Kshs 1.1 bn from Kshs 1.0 bn in Q3’2021 which outpaced the 6.9% increase in operating income to Kshs 1.4 bn from Kshs 1.3 bn in Q3’2021. Key capital ratios such as the Core capital to deposit liabilities ratio came in at 9.1% in Q3’2022, only 1.1% points above the regulatory limit of 8.0%. The core capital to risk weighted assets came in at 7.1% in Q3’2022, 3.4% points below the regulatory limit of 10.5%. Similarly, the Capital adequacy ratio came in at 11.0% in Q3’2022, 3.5% points below the regulatory requirement of 14.5%, and 8.0% below the sector average of 19.0% in Q3’2022. The liquidity ratio came in 14.5%, 5.5% points below the regulatory requirement of 20.0%. Further, other ratios have also been adverse, such as the asset quality, with the bank’s Non-Performing loan (NPL) ratio coming in at 26.1% in Q3’2022, 12.4% points above the banking sector average of 13.7% during the same period. The table below summarizes FCB’s financials and ratios;
|
Cytonn report: Summary of First Community Bank (FCB) Financials |
|||||
|
FY’2018 |
FY’2019 |
FY’2020 |
FY’2021 |
Q3'2022 |
|
|
Balance Sheet Summary (Kshs bn) |
|||||
|
Net Loans |
9.0 |
9.9 |
12.6 |
17.2 |
18.2 |
|
Total Assets |
17.9 |
18.8 |
21.9 |
24.7 |
22.1 |
|
Customer Deposits |
14.6 |
16.1 |
18.8 |
21.5 |
18.2 |
|
Total Liabilities |
16.6 |
17.3 |
19.9 |
22.2 |
18.9 |
|
Shareholders' Funds |
1.3 |
1.5 |
2.1 |
2.5 |
3.2 |
|
Income Statement Summary (Kshs bn) |
|||||
|
Total Operating income |
1.2 |
1.2 |
1.3 |
2.2 |
1.4 |
|
Total Operating expenses |
(1.5) |
(1.0) |
(1.1) |
(1.6) |
(1.1) |
|
Profit After Tax (PAT) |
(0.3) |
0.2 |
0.2 |
0.6 |
0.3 |
|
Balance Sheet Ratios |
|||||
|
Loan to Deposit |
61.8% |
61.5% |
67.1% |
80.1% |
99.9% |
|
ROaE |
(14.2%) |
14.0% |
10.6% |
17.1% |
13.5% |
|
ROaA |
(1.2%) |
1.0% |
0.9% |
1.7% |
1.7% |
|
Income Statement Ratios: |
|||||
|
Yield on Interest Earning Assets |
7.2% |
7.4% |
6.5% |
9.1% |
10.9% |
|
Net Interest Margin |
5.2% |
5.6% |
5.6% |
8.7% |
10.2% |
|
Cost to Income Ratio |
98.1% |
55.6% |
79.0% |
49.1% |
75.2% |
|
Capital Adequacy Ratios: |
|||||
|
Core Capital liabilities ratio |
5.3% |
3.8% |
4.4% |
5.2% |
9.1% |
|
Minimum Statutory requirement |
8.0% |
8.0% |
8.0% |
8.0% |
8.0% |
|
Excess/Deficit |
(2.7%) |
(4.2%) |
(3.6%) |
(2.8%) |
1.1% |
|
Core Capital risk weighted assets ratio |
6.5% |
4.4% |
4.8% |
5.2% |
7.1% |
|
Minimum Statutory requirement |
10.5% |
10.5% |
10.5% |
10.5% |
10.5% |
|
Excess/Deficit |
(4.0%) |
(6.1%) |
(5.7%) |
(5.3%) |
(3.4%) |
|
Total Capital risk weighted ratio |
9.1% |
8.1% |
9.3% |
8.9% |
11.0% |
|
Minimum Statutory requirement |
14.5% |
14.5% |
14.5% |
14.5% |
14.5% |
|
Excess/Deficit |
(5.4%) |
(6.4%) |
(5.2%) |
(5.6%) |
(3.5%) |
|
Liquidity ratios: |
|||||
|
Cash Reserve Ratio |
15.5% |
19.5% |
8.6% |
7.1% |
6.6% |
|
Minimum Statutory requirement |
5.3% |
5.3% |
4.3% |
4.3% |
4.3% |
|
Excess/Deficit |
10.2% |
14.2% |
4.3% |
3.8% |
2.3% |
|
Liquidity ratio |
41.1% |
42.3% |
37.2% |
21.0% |
14.5% |
|
Minimum Statutory requirement |
20.0% |
20.0% |
20.0% |
20.0% |
20.0% |
|
Excess/Deficit |
21.1% |
22.3% |
17.2% |
1.0% |
(5.5%) |
|
Asset quality ratios: |
|||||
|
Gross Non-Performing Loan Ratio |
46.2% |
39.7% |
34.8% |
27.4% |
26.1% |
|
NPL Coverage Ratio |
33.7% |
40.9% |
47.5% |
51.7% |
55.0% |
We expect the completed acquisition to boost FCB’s capital adequacy and liquidity ratios to above the minimum statutory requirements and positively impact the bank’s operations. The acquisition is also a welcome move as it ensures that the bank’s customer deposits are protected and will bring stability to the bank. Going forward, we expect to see more consolidation activities in the Kenya’s banking sector as larger banks with a sufficient capital base take over smaller and weaker banks.
Below is a summary of the deals in the last 10 years that have either happened, been announced or expected to be concluded:
|
Acquirer |
Bank Acquired |
Book Value at Acquisition (Kshs bn) |
Transaction Stake |
Transaction Value (Kshs bn) |
P/Bv Multiple |
Date |
|
Premier Bank Limited |
First Community Bank Limited |
3.2 |
62.5% |
Undisclosed |
N/A |
Mar-23 |
|
Commercial International Bank |
Mayfair Bank Limited |
4.3 |
49.0% |
5.0 |
2.3x |
Jan-23 |
|
Equity Group |
Spire Bank |
0.01 |
Undisclosed |
Undisclosed |
N/A |
Sep-22 |
|
KCB Group |
Trust Merchant Bank |
12.4 |
85.0% |
15.7 |
1.5x |
Aug-22 |
|
Access Bank PLC |
Sidian Bank |
4.1 |
83.4% |
4.3 |
1.1x |
June-22* |
|
KCB Group |
Banque Populaire du Rwanda |
5.3 |
100.0% |
5.6 |
1.1x |
Aug-21 |
|
I&M Holdings PLC |
Orient Bank Limited Uganda |
3.3 |
90.0% |
3.6 |
1.1x |
Apr-21 |
|
KCB Group** |
ABC Tanzania |
Unknown |
100.0% |
0.8 |
0.4x |
Nov-20* |
|
Co-operative Bank |
Jamii Bora Bank |
3.4 |
90.0% |
1 |
0.3x |
Aug-20 |
|
Commercial International Bank |
Mayfair Bank Limited |
1.0 |
51.0% |
3.8 |
7.1x |
Apr-20 |
|
Access Bank PLC (Nigeria) |
Transnational Bank PLC. |
1.9 |
100.0% |
1.4 |
0.7x |
Feb-20* |
|
Equity Group ** |
Banque Commerciale Du Congo |
8.9 |
66.5% |
10.3 |
1.2x |
Nov-19* |
|
KCB Group |
National Bank of Kenya |
7.0 |
100.0% |
6.6 |
0.9x |
Sep-19 |
|
CBA Group |
NIC Group |
33.5 |
53% : 47% |
23 |
0.7x |
Sep-19 |
|
Oiko Credit |
Credit Bank |
3.0 |
22.8% |
1 |
1.5x |
Aug-19 |
|
CBA Group** |
Jamii Bora Bank |
3.4 |
100.0% |
1.4 |
0.4x |
Jan-19 |
|
AfricInvest Azure |
Prime Bank |
21.2 |
24.2% |
5.1 |
1.0x |
Jan-18 |
|
KCB Group |
Imperial Bank |
Unknown |
Undisclosed |
Undisclosed |
N/A |
Dec-18 |
|
SBM Bank Kenya |
Chase Bank Ltd |
Unknown |
75.0% |
Undisclosed |
N/A |
Aug-18 |
|
DTBK |
Habib Bank Kenya |
2.4 |
100.0% |
1.8 |
0.8x |
Mar-17 |
|
SBM Holdings |
Fidelity Commercial Bank |
1.8 |
100.0% |
2.8 |
1.6x |
Nov-16 |
|
M Bank |
Oriental Commercial Bank |
1.8 |
51.0% |
1.3 |
1.4x |
Jun-16 |
|
I&M Holdings |
Giro Commercial Bank |
3.0 |
100.0% |
5 |
1.7x |
Jun-16 |
|
Mwalimu SACCO |
Equatorial Commercial Bank |
1.2 |
75.0% |
2.6 |
2.3x |
Mar-15 |
|
Centum |
K-Rep Bank |
2.1 |
66.0% |
2.5 |
1.8x |
Jul-14 |
|
GT Bank |
Fina Bank Group |
3.9 |
70.0% |
8.6 |
3.2x |
Nov-13 |
|
Average |
|
|
77.2% |
|
1.6x |
|
|
* Announcement Date ** Deals that were dropped |
||||||
- Earnings Release
- Co-operative Bank of Kenya FY’2022 Performance
During the week, Co-operative Bank of Kenya released their FY’2022 financial results. Below is a summary of the performance:
|
Balance Sheet Items (Kshs bn) |
FY’2021 |
FY’2022 |
y/y change |
|
Government Securities |
184.1 |
173.3 |
(5.9%) |
|
Net Loans and Advances |
310.2 |
339.4 |
9.4% |
|
Total Assets |
579.8 |
607.2 |
4.7% |
|
Customer Deposits |
407.7 |
423.8 |
3.9% |
|
Deposits per Branch |
2.29 |
2.34 |
2.2% |
|
Total Liabilities |
479.0 |
499.3 |
4.2% |
|
Shareholders’ Funds |
100.2 |
107.7 |
7.4% |
|
Balance Sheet Ratios |
FY’2021 |
FY’2022 |
y/y change |
|
Loan to Deposit Ratio |
76.1% |
80.1% |
4.0% |
|
Return on average equity |
17.3% |
21.2% |
3.9% |
|
Return on average assets |
3.0% |
3.7% |
0.7% |
|
Income Statement (Kshs bn) |
FY’2021 |
FY’2022 |
y/y change |
|
Net Interest Income |
41.0 |
45.5 |
10.9% |
|
Non-Interest Income |
19.4 |
25.7 |
32.7% |
|
Total Operating income |
60.4 |
71.3 |
17.9% |
|
Loan Loss provision |
(7.9) |
(8.7) |
9.4% |
|
Total Operating expenses |
(38.1) |
(42.2) |
10.9% |
|
Profit before tax |
22.6 |
29.4 |
29.9% |
|
Profit after tax |
16.5 |
22.0 |
33.2% |
|
Earnings per share (Kshs) |
2.4 |
3.2 |
33.2% |
|
Income Statement Ratios |
FY’2021 |
FY’2022 |
Y/Y Change |
|
Yield from interest-earning assets |
11.5% |
12.0% |
0.5% |
|
Cost of funding |
3.3% |
3.5% |
0.2% |
|
Net Interest Spread |
8.2% |
8.5% |
0.3% |
|
Net Interest Income as % of Total Income |
67.9% |
63.9% |
(4.0%) |
|
Non-Funded Income as a % of Total Income |
32.1% |
36.1% |
4.0% |
|
Cost to Income |
63.0% |
59.3% |
(3.7%) |
|
Cost to Income Ratio without provisions |
49.9% |
47.1% |
(2.8%) |
|
Cost to Assets |
5.2% |
5.5% |
0.3% |
|
Net Interest Margin |
8.5% |
8.9% |
0.4% |
|
Capital Adequacy Ratios |
FY’2021 |
FY’2022 |
% points change |
|
Core Capital/Total deposit Liabilities |
19.6% |
21.9% |
2.3% |
|
Minimum Statutory ratio |
8.0% |
8.0% |
|
|
Excess |
11.6% |
13.9% |
2.3% |
|
Core Capital/Total Risk Weighted Assets |
15.6% |
16.9% |
1.3% |
|
Minimum Statutory ratio |
10.5% |
10.5% |
|
|
Excess |
5.1% |
6.4% |
1.3% |
|
Total Capital/Total Risk Weighted Assets |
17.2% |
18.0% |
0.8% |
|
Minimum Statutory ratio |
14.5% |
14.5% |
|
|
Excess |
2.7% |
3.5% |
0.8% |
|
Liquidity Ratio |
53.8% |
48.3% |
(5.5%) |
|
Minimum Statutory ratio |
20.0% |
20.0% |
|
|
Excess |
33.8% |
28.3% |
(5.5%) |
|
Adjusted Core Capital/Total Deposit Liabilities |
16.0% |
21.9% |
5.9% |
|
Adjusted Core Capital/Total Risk Weighted Assets |
12.8% |
16.9% |
4.1% |
|
Adjusted Total Capital/Total Risk Weighted Assets |
14.3% |
18.0% |
3.7% |
Key Take outs
Earnings Growth- Core earnings per share rose by 33.2% to Kshs 3.2 from Kshs 2.4 in FY’2021, higher than our expectations of a 19.0% increase to Kshs 2.9, with the variance stemming from the 17.9% increase in total operating income, which was higher than our projection of an 11.5% increase. The performance was driven by a 17.9% increase in total operating income to Kshs 71.3 bn in FY’2022, from Kshs 60.4 bn in FY’2021, which outpaced the 10.9% increase in the total operating expenses to Kshs 42.2 bn in FY’2022, from Kshs 38.1 bn in FY’2021,
The Group’s directors recommended a first and final dividend per share of Kshs 1.5 in FY’2022, representing a dividend yield of 12.2% as of 17th March, 2023. This is a 50.0% increase from the dividend per share of Kshs 1.0 issued in FY’2021. Similarly, the dividend payout ratio increased to 39.9% in FY’2022, from 35.5% in FY’2021,
Increased Lending compared to a decline in Government Security – The Group’s net loans and advances increased by 9.4% to Kshs 339.4 bn in FY’2022, from Kshs 310.2 bn in FY’2021. On the other hand, government securities declined by 5.9% to Kshs 173.3 bn, from Kshs 184.1 bn recorded in FY’2021, indicating a management shift to increased lending as compared to allocation to government securities following the improvement in business environment towards the end of the year,
Improvement in Asset Quality – The group’s asset quality improved, with the NPL ratio reducing to 14.0% in FY’2022, from 14.6% in FY’2021, owing to the 9.4% growth in gross loans to Kshs 373.5 bn, from Kshs 341.3 bn in FY’2021, which outpaced the 5.2% increase in gross non-performing loans. The improved asset quality was attributable to the proactive credit management strategies that have seen increased loan repayments as well as the robust increase in lending, and,
Improved Efficiency - The group enhanced their efficiency levels evidenced by an improvement in Cost to Income Ratio (CIR) improving to 59.3% in FY’2022, from 63.0% in FY’2021 owing to the 17.9% increase in the total operating income which outpaced the 10.9% increase in the total operating expenses. Without LLP, the Cost to Income ratio improved as well to 47.1%, from 49.9% in FY’2021.
For a comprehensive analysis, please see our Co-operative Bank of Kenya FY’2022 Earnings Note
- ABSA Bank Kenya’s FY’2022 Performance
During the week, ABSA Bank Kenya released their FY’2022 financial results. Below is a summary of the performance;
|
Balance Sheet Items |
FY’2021 |
FY’2022 |
y/y change |
|
Government Securities |
132.6 |
133.5 |
0.7% |
|
Net Loans and Advances |
234.2 |
283.6 |
21.1% |
|
Total Assets |
428.7 |
477.2 |
11.3% |
|
Customer Deposits |
268.7 |
303.8 |
13.0% |
|
Deposits per Branch |
3.2 |
3.7 |
14.4% |
|
Total Liabilities |
372.2 |
413.6 |
11.1% |
|
Shareholder's Funds |
56.4 |
63.6 |
12.7% |
|
Balance sheet ratios |
FY’2021 |
FY’2022 |
% point change |
|
Loan to Deposit Ratio |
87.2% |
93.4% |
6.2% |
|
Return on average equity |
21.1% |
24.3% |
3.2% |
|
Return on average assets |
2.7% |
3.2% |
0.5% |
|
Income Statement Items |
FY’2021 |
FY’2022 |
y/y change |
|
Net Interest Income |
25.3 |
32.3 |
27.9% |
|
Net non-Interest Income |
11.7 |
13.7 |
17.2% |
|
Total Operating income |
36.9 |
46.0 |
24.6% |
|
Loan Loss provision |
(4.7) |
(6.5) |
37.6% |
|
Total Operating expenses |
(21.4) |
(25.1) |
17.6% |
|
Profit before tax |
15.5 |
20.8 |
34.1% |
|
Profit after tax |
10.9 |
14.6 |
34.2% |
|
Core EPS |
2.0 |
2.7 |
34.2% |
|
Income statement ratios |
FY’2021 |
FY’2022 |
% point change |
|
Yield from interest-earning assets |
9.0% |
10.3% |
1.3% |
|
Cost of funding |
2.6% |
2.9% |
0.3% |
|
Net Interest Spread |
2.5% |
2.8% |
0.3% |
|
Cost of risk |
12.8% |
14.1% |
1.3% |
|
Net Interest Margin |
7.1% |
8.2% |
1.1% |
|
Cost to Income |
57.9% |
54.7% |
(3.2%) |
|
Cost to income (Without LLPs) |
45.1% |
40.6% |
(4.5%) |
|
Cost to Assets |
3.9% |
3.9% |
0.0% |
|
Net Interest Income as % of operating income |
68.4% |
70.3% |
1.9% |
|
Non-Funded Income as a % of operating income |
31.6% |
29.7% |
(1.9%) |
|
Capital Adequacy Ratios |
FY’2021 |
FY’2022 |
% Points change |
|
Core Capital/Total Liabilities |
17.9% |
18.4% |
0.5% |
|
Minimum Statutory ratio |
8.0% |
8.0% |
- |
|
Excess |
9.9% |
10.4% |
0.5% |
|
Core Capital/Total Risk Weighted Assets |
14.6% |
14.6% |
0.0% |
|
Minimum Statutory ratio |
10.5% |
10.5% |
- |
|
Excess |
4.1% |
4.1% |
0.0% |
|
Total Capital/Total Risk Weighted Assets |
17.1% |
18.6% |
1.5% |
|
Minimum Statutory ratio |
14.5% |
14.5% |
- |
|
Excess |
2.6% |
4.1% |
1.5% |
|
Liquidity Ratio |
38.3% |
33.6% |
(4.7%) |
|
Minimum Statutory ratio |
20.0% |
20.0% |
- |
|
Excess |
18.3% |
13.6% |
(4.7%) |
|
Adjusted Core Capital/Total Liabilities |
18.0% |
18.4% |
0.4% |
|
Adjusted Core Capital/Total RWA |
14.7% |
14.6% |
(0.1%) |
|
Adjusted Total Capital/Total RWA |
17.2% |
18.6% |
1.4% |
Key Take-Outs:
Earnings Growth- Core earnings per share increased by 34.2% to Kshs 2.7 in FY’2022, from Kshs 2.0 in FY’2021, slightly higher than our projections of a 28.7% growth to Kshs 2.6. The performance was driven by a 24.6% increase in total operating income to Kshs 46.0 bn, from Kshs 36.9 bn recorded in FY’2021. However, the growth was weighed down by the 17.6% increase in total operating expenses, to Kshs 25.1 bn, from Kshs 21.4 bn recorded in FY’2021,
The Group’s directors recommended a final dividend per share of Kshs 1.15 in FY’2022, adding to the interim dividend per share of Kshs 0.20 issued in Q3’2022. The total dividend of Kshs 1.35 per share represents a dividend yield of 11.3% as of 17th March, 2023. This is a 22.7% increase from the dividend per share of Kshs 1.10 issued in FY’2021. Notably, the dividend payout ratio declined to 50.3% in FY’2022, from 55.0% in FY’2021,
Improved deposit gathering capacity – The Bank recorded double digit growth in deposits at 13.0% y/y growth in FY’2022 as compared to the 5.9% growth recorded in FY’2021. Consequently, the increased deposits have helped to bring down the loan to deposit to 93.4% in FY’2022, from a high of 103.0% in Q3’2022,
Improved Lending – The Bank increased its lending in FY’2022 with Loans and advances recording a 21.1% growth, highlighting the Bank’s aggressive lending despite the tough operating business environment,
Improvement in Asset Quality - The bank’s asset quality improved, with the NPL ratio declining by 0.4% points to 7.5% in FY’2022, from 7.9% in FY’2021, owing to the faster 20.9% growth in Gross Loans, as compared to the 13.6% increase in Gross Non-Performing Loans (NPLs). However, on q/q, the asset quality deteriorated as evidenced by the NPL ratio which rose by 0.9% points from 6.6% recorded in Q3’2022, mainly attributable to 12.4% increase in Gross Non-Performing Loans, coupled with 1.2% decline in Gross Loans,
Improved efficiency levels – The Banks’s cost to income ratio without LLP improved, declining by 4.5% to 40.6%, from 45.1% in FY’2021, an indication of improved efficiency.
For a comprehensive analysis, please see our ABSA Bank Kenya FY’2022 Earnings Note
- KCB Group’s FY’2022 Performance
During the Week, KCB Group released their FY’2022 financial results. Below is a summary of the performance:
|
Balance Sheet Items |
FY’2021 |
FY’2022 |
y/y change |
|
Net Loans and Advances |
675.5 |
863.3 |
27.8% |
|
Government Securities |
270.8 |
278.0 |
2.7% |
|
Total Assets |
1,139.7 |
1,554.0 |
36.4% |
|
Customer Deposits |
837.1 |
1,135.4 |
35.6% |
|
Deposits per branch |
2.36 |
2.29 |
(3.0%) |
|
Total Liabilities |
966.2 |
1,347.8 |
39.5% |
|
Shareholders’ Funds |
171.7 |
200.2 |
16.6% |
|
Balance Sheet Ratios |
FY’2021 |
FY’2022 |
% y/y change |
|
Loan to Deposit Ratio |
80.7% |
81.3% |
0.6% |
|
Return on average equity |
21.8% |
22.0% |
0.2% |
|
Return on average assets |
3.2% |
3.0% |
(0.2%) |
|
Income Statement |
FY’2021 |
FY’2022 |
y/y change |
|
Net Interest Income |
77.7 |
86.7 |
11.5% |
|
Net non-Interest Income |
30.9 |
43.3 |
39.8% |
|
Total Operating income |
108.6 |
129.9 |
19.6% |
|
Loan Loss provision |
(13.0) |
(13.2) |
1.7% |
|
Total Operating expenses |
(60.8) |
(72.6) |
19.3% |
|
Profit before tax |
47.8 |
57.3 |
19.9% |
|
Profit after tax |
34.2 |
40.8 |
19.5% |
|
Core EPS |
10.63 |
12.7 |
19.5% |
|
Income Statement Ratios |
FY’2021 |
FY’2022 |
y/y change |
|
Yield from interest-earning assets |
11.1% |
10.1% |
(1.0%) |
|
Cost of funding |
2.8% |
2.9% |
0.1% |
|
Net Interest Spread |
8.3% |
7.3% |
(1.0%) |
|
Net Interest Margin |
8.4% |
7.5% |
(0.9%) |
|
Cost of Risk |
12.0% |
10.2% |
(1.8%) |
|
Net Interest Income as % of operating income |
71.5% |
66.7% |
(4.8%) |
|
Non-Funded Income as a % of operating income |
28.5% |
33.3% |
4.8% |
|
Cost to Income Ratio |
56.0% |
55.9% |
(0.1%) |
|
Capital Adequacy Ratios |
FY’2021 |
FY’2022 |
% points change |
|
Core Capital/Total Liabilities |
18.7% |
15.3% |
(3.4%) |
|
Minimum Statutory ratio |
8.0% |
8.0% |
|
|
Excess |
10.7% |
7.3% |
(3.4%) |
|
Core Capital/Total Risk Weighted Assets |
18.0% |
13.9% |
(4.1%) |
|
Minimum Statutory ratio |
10.5% |
10.5% |
|
|
Excess |
7.5% |
3.4% |
(4.1%) |
|
Total Capital/Total Risk Weighted Assets |
21.7% |
17.1% |
(4.6%) |
|
Minimum Statutory ratio |
14.5% |
14.5% |
|
|
Excess |
7.2% |
2.6% |
(4.6%) |
|
Liquidity Ratio |
39.1% |
40.9% |
1.8% |
|
Minimum Statutory ratio |
20.0% |
20.0% |
|
|
Excess |
19.1% |
20.9% |
1.8% |
Key Take-Outs
Earnings Growth – Core earnings per share rose by 19.5% to Kshs 12.7 from Kshs 10.6 in FY’2021, higher than our expectations of a 16.2% increase to Kshs 12.4, with the variance stemming from the 19.6% increase in total operating income, which was slightly higher than our projection of a 17.7% increase. The performance was driven by the 19.6% growth in total operating income to Kshs 129.9 bn, from Kshs 108.6 bn in FY’2021, which outpaced the 19.3% growth in total operating expenses to Kshs 72.6 bn, from Kshs 60.8 bn in FY’2021,
The Group’s directors recommended a final dividend per share of Kshs 1.0 in FY’2022, adding to the interim dividend per share of Kshs 1.0 issued in Q3’2022. The total dividend of Kshs 2.0 per share represents a dividend yield of 6.5% as of 17th March, 2023. This is a 33.3% decline from the dividend per share of Kshs 3.0 issued in FY’2021. Additionally, the dividend payout ratio declined to 15.7% in FY’2022, from 28.2% in FY’2021,
Key to note, the decline in recommended dividends for FY’2022 drove a decline in KCB’s share price to Kshs 31.0 per share as at 17th March 2023, a 17.2% from Kshs 37.5 per share the previous week,
Increased Customer Deposit – KCB Group’s customer deposits base increased significantly by 35.6% to Kshs 1,135.4 bn from Kshs 837.1 bn in FY’2021 and is the second banking group in Kenya after Equity Group to cross the Kshs 1.0 tn mark, mainly attributable to the completion of the acquisition of TMB Bank and the organic growth in the existing business,
Deteriorated Asset Quality – KCB group’s asset quality deteriorated y/y to 17.0% from 16.6% in FY’2021 driven by a 31.2% increase in gross non-performing loans to Kshs 161.2 bn, from Kshs 122.9 bn in FY’2021, which outpaced the 28.0% growth in gross loans. The increase in gross non-performing loans was driven by a 40.0% increase in KCB-Kenya’s gross NPLs to Kshs 129.1 bn from Kshs 92.2 bn in FY’2021 following an increase in NPL stock and reclassifications in sectors such as building and construction, manufacturing, and Transport and communication during the year. As such KCB-Kenya’s NPL ratio deteriorated to 19.1% in FY’2022 from 16.0% in FY’2021, 5.8% points higher than the Kenya’s banking sector NPL ratio which came in at 13.3% in FY’2022. Similarly, National Bank of Kenya’s NPL ratio continued to weigh down the group, coming in at 22.1%, despite being an improvement from 31.9% from FY’2021. However, on a q/q basis, the asset quality improved, with the NPL ratio improving to 17.0% in FY’2022 from 17.8% in Q3’2022,
Impaired Yield on Interest Earning Assets ratio – The group recorded a 1.0% decline in its Yield on Interest Earning Ratio to 10.1% from 11.1% driven by the faster 26.3% growth in Average Interest Earning Assets (AIEA) following the acquisition of TMB Bank in DRC which outpaced the 15.1% growth in trailing interest income with the group yet to optimize the TMB Balance sheet to generate interest income.
For a comprehensive analysis, please see our KCB Group FY’2022 Earnings Note
- Standard Chartered Bank Kenya FY’2022 Performance
Below is a summary of Standard Chartered Bank Kenya FY’2022 performance:
|
Balance Sheet Items |
FY'2021 |
FY'2022 |
y/y change |
|
Net loans |
126.0 |
139.4 |
10.7% |
|
Government Securities |
95.6 |
105.7 |
10.6% |
|
Total Assets |
334.9 |
381.3 |
13.9% |
|
Customer Deposits |
265.5 |
278.9 |
5.1% |
|
Deposits per Branch |
7.4 |
8.7 |
18.2% |
|
Total Liabilities |
281.7 |
325.1 |
15.4% |
|
Balance Sheet Ratios |
FY'2021 |
FY'2022 |
y/y change |
|
Loan to deposit ratio |
47.5% |
50.0% |
2.5% |
|
Return on Average Equity |
17.4% |
22.1% |
4.7% |
|
Return on Average Assets |
2.7% |
3.4% |
0.6% |
|
Income Statement |
FY'2021 |
FY'2022 |
y/y change |
|
Net Interest Income |
18.8 |
22.2 |
18.1% |
|
Net non-Interest Income |
10.4 |
11.8 |
13.5% |
|
Total Operating income |
29.2 |
34.0 |
16.5% |
|
Loan Loss provision |
2.1 |
1.3 |
(36.2%) |
|
Total Operating expenses |
16.6 |
16.9 |
1.9% |
|
Profit before tax |
12.6 |
17.1 |
35.8% |
|
Profit after tax |
9.0 |
12.1 |
33.3% |
|
Core EPS |
23.5 |
31.5 |
34.0% |
|
Income Statement Ratios |
FY'2021 |
FY'2022 |
y/y change |
|
Yield from interest-earning assets |
7.6% |
8.0% |
0.4% |
|
Cost of funding |
1.3% |
1.2% |
(0.1%) |
|
Net Interest Spread |
6.2% |
6.8% |
0.6% |
|
Net Interest Margin |
6.4% |
7.0% |
0.6% |
|
Cost of Risk |
7.1% |
3.9% |
(3.2%) |
|
Net Interest Income as % of operating income |
64.5% |
65.4% |
0.9% |
|
Non-Funded Income as a % of operating income |
35.5% |
34.6% |
(0.9%) |
|
Cost to Income Ratio |
56.8% |
49.7% |
(7.1%) |
|
Cost to Income Ratio without LLP |
49.7% |
45.8% |
(3.9%) |
|
Cost to Assets |
4.4% |
4.3% |
(0.1%) |
|
Capital Adequacy Ratios |
FY'2021 |
FY'2022 |
% Change |
|
Core Capital/Total Liabilities |
15.4% |
15.1% |
(0.3%) |
|
Minimum Statutory ratio |
8.0% |
8.0% |
0.0% |
|
Excess |
7.4% |
7.1% |
(0.3%) |
|
Core Capital/Total Risk Weighted Assets |
15.5% |
15.4% |
(0.2%) |
|
Minimum Statutory ratio |
10.5% |
10.5% |
0.0% |
|
Excess |
5.0% |
4.9% |
(0.2%) |
|
Total Capital/Total Risk Weighted Assets |
17.8% |
17.3% |
(0.5%) |
|
Minimum Statutory ratio |
14.5% |
14.5% |
0.0% |
|
Excess |
3.3% |
2.8% |
(0.5%) |
|
Liquidity Ratio |
70.7% |
73.0% |
2.3% |
|
Minimum Statutory ratio |
20.0% |
20.0% |
0.0% |
|
Excess |
50.7% |
53.0% |
2.3% |
|
Adjusted core capital/ total deposit liabilities |
15.4% |
15.1% |
(0.3%) |
|
Adjusted core capital/ total risk weighted assets |
15.6% |
15.4% |
(0.2%) |
|
Adjusted total capital/ total risk weighted assets |
17.8% |
17.3% |
(0.5%) |
Key Take-Outs
Earnings Growth - Core earnings per share rose by 34.0% to Kshs 31.5, from Kshs 23.5 registered in FY’2021, higher than our expectations of a 20.9% increase to Kshs 28.4, with the variance stemming from the 1.9% decline in total operating expense to Kshs 16.9, which was lower than our projection of a 19.1% increase to Kshs 19.7 bn in FY2022. The performance was driven by the 16.5% growth in total operating income to Kshs 34.0 bn, from Kshs 29.2 bn in FY’2021, against the relatively lower 1.9% growth in total operating expenses to Kshs 16.9 bn from Kshs 16.6 bn in FY’2021,
The Group’s directors recommended a final dividend per share of Kshs 16.0 in FY’2022, adding to the interim dividend per share of Kshs 6.0 issued in Q3’2022. The total dividend of Kshs 22.0 per share represents a dividend yield of 13.2% as of 17th March, 2023. This is a 15.8% increase from the dividend per share of Kshs 19.0 issued in FY’2021. Key to note, the dividend payout ratio declined to 69.9% in FY’2022, from 80.9% in FY’2021,
Improvement in Asset Quality - The group’s asset quality improved significantly, with the NPL ratio improving to 14.2% in FY’2022, from 16.0% recorded in FY’2021. The improvement in asset quality was attributable to the 3.0% decline in gross non-performing loans, coupled with a 9.2% increase in gross loans. Key to note, on a q/q basis, Standard Chartered Bank’s Asset quality improved by 1.2% points to 14.2% as end of FY’2022, from 15.4% recorded in Q3’2022,
Sustained operating efficiency levels – The bank’s operating efficiency has recorded sustained improvement with cost to income ratio without LLP improving to 45.8% from 49.7% in FY’2021, similar to the trend witnessed in Q3’2022 financial performance where cost to income LLP improved by 0.6% points to 47.4% in Q3’2022 from 48.0% in Q3’2021, and,
Cautious Lending – FY’2022 was characterized by cautious lending to the public attributable to the high credit risks brought about by the deteriorated business environment mainly as a result of the elevated inflationary pressures during the year. As such, the bank turned to lending to the government resulting in government securities registering a 10.6% growth to Kshs 105.7 bn, from 95.6 bn in FY’2021.
For a comprehensive analysis, please see our Standard Chartered Bank Kenya FY’2022 Earnings Note
Asset Quality
The table below is a summary of the listed banks that have released their FY’2022 results:
|
|
FY'2022 NPL Ratio* |
FY'2021 NPL Ratio** |
% point change in NPL Ratio |
FY'2022 NPL Coverage* |
FY'2021 NPL Coverage** |
% point change in NPL Coverage |
|
ABSA Bank Kenya |
7.5% |
7.9% |
(0.4%) |
80.5% |
77.7% |
2.8% |
|
Stanbic Holdings |
10.0% |
9.3% |
0.7% |
63.1% |
58.1% |
5.0% |
|
Co-operative Bank |
14.0% |
14.6% |
(0.6%) |
69.3% |
62.6% |
6.7% |
|
SCBK |
14.2% |
16.0% |
(1.8%) |
87.1% |
84.4% |
2.7% |
|
KCB Group |
17.0% |
16.6% |
0.4% |
52.4% |
52.9% |
(0.5%) |
|
Mkt Weighted Average |
13.2% |
12.3% |
0.9% |
69.0% |
65.5% |
3.5% |
|
*Market cap weighted as at 17/03/2023 |
||||||
|
**Market cap weighted as at 14/04/2022 |
||||||
Key take-outs from the table include;
- Asset quality for the listed banks that have released deteriorated during the year, with market weighted average NPL increasing by 0.9% points to 13.2%, from a 12.3% in FY’2021. The deterioration was driven by a deterioration in Stanbic holdings’ and KCB Group’s asset quality with their NPL ratios increasing by 0.7% and 0.4% points to 10.0% and 17.0%, respectively in FY’2022, and,
- Market weighted average NPL Coverage for the listed banks increased by 3.5% points to 69.0% in FY’2022, from 65.5% recorded in FY’2021. However, KCB Group’s NPL coverage declined by 0.5% points to 52.4% in FY’2022 from 52.9% in FY’2021, attributable to a 31.2% increase in gross non-performing loans to Kshs 161.2 bn, from Kshs 122.9 bn in FY’2021, despite a 35.0% increase in provision to Kshs 70.6 bn from Kshs 52.3 bn in FY’2021, coupled with a marginal growth in interest suspense to Kshs 14.0 bn, up from Kshs 13.0 bn in Fy’2021.
Summary performance
The table below highlights the performance listed banks, showing the performance using several metrics:
|
Bank |
Core EPS Growth |
Interest Income Growth |
Interest Expense Growth |
Net Interest Income Growth |
Net Interest Margin |
Non-Funded Income Growth |
NFI to Total Operating Income |
Growth in Total Fees & Commissions |
Deposit Growth |
Growth in Government Securities |
Loan to Deposit Ratio |
Loan Growth |
Return on Average Equity |
|
ABSA |
34.2% |
27.5% |
25.9% |
27.9% |
8.2% |
17.2% |
29.7% |
0.3% |
13.0% |
0.7% |
93.4% |
21.1% |
24.3% |
|
SCBK |
34.0% |
14.3% |
6.5% |
18.1% |
7.0% |
13.5% |
34.6% |
(17.7%) |
5.1% |
10.6% |
50.0% |
10.7% |
22.1% |
|
Co-op |
33.2% |
11.0% |
11.0% |
10.9% |
8.9% |
32.7% |
36.1% |
31.8% |
3.9% |
(5.9%) |
80.1% |
9.4% |
21.2% |
|
Stanbic |
25.7% |
31.8% |
15.2% |
31.8% |
5.9% |
23.7% |
40.9% |
(0.5%) |
19.5% |
42.9% |
87.8% |
16.4% |
15.3% |
|
KCB |
19.5% |
15.3% |
27.1% |
11.5% |
7.5% |
11.5% |
33.3% |
18.6% |
35.6% |
2.7% |
81.3% |
27.8% |
22.0% |
|
FY'22 Mkt Weighted Average* |
28.5% |
18.9% |
18.4% |
18.5% |
7.6% |
18.5% |
34.4% |
8.2% |
17.5% |
7.5% |
78.4% |
18.4% |
21.4% |
|
FY'21 Mkt Weighted Average** |
82.9% |
13.8% |
11.5% |
15.2% |
7.1% |
10.9% |
34.7% |
16.6% |
13.5% |
18.1% |
69.7% |
13.5% |
20.2% |
|
*Market cap weighted as at 17/03/2023 |
|||||||||||||
|
**Market cap weighted as at 14/04/2022 |
|||||||||||||
Key take-outs from the table include;
- The listed banks recorded a 28.5% growth in core Earnings per Share (EPS) in FY’2022, compared to the weighted average growth of 82.9% in FY’2021, an indication of sustained performance despite the tough operating environment experienced in FY’2022,
- The listed Banks’ Interest income grew by 18.9% compared to the market weighted average growth of 13.8% in FY’2021. The growth in interest income is attributable to the 18.4% weighted average growth in the loan book in FY’2022 which was higher than the 13.5% growth in FY’2021. The higher loan book growth took the loan to deposit ratio to 78.4% from the 69.7% market weighted average loan to deposit ratio in FY’2021.
- Non-Funded Income grew by 18.5% compared to market weighted average growth of 10.9% in FY’2021, pointing to increased revenue diversification efforts by the banking sector, and,
- The Banks recorded a deposit growth of 17.5%, higher than the market weighted average deposit growth of 13.5% in FY’2021, highlighting increased investment risk in the business environment.
Universe of coverage:
|
Company |
Price as at 10/03/2024 |
Price as at 17/03/2024 |
w/w change |
YTD Change |
Year Open 2023 |
Target Price* |
Current Dividend Yield |
Upside/ Downside** |
P/TBv Multiple |
Recommendation |
|
Jubilee Holdings |
175.8 |
151.5 |
(13.8%) |
(23.8%) |
198.8 |
305.9 |
9.2% |
111.2% |
0.3x |
Buy |
|
KCB Group*** |
37.5 |
31.0 |
(17.2%) |
(19.2%) |
38.4 |
52.5 |
6.5% |
75.8% |
0.5x |
Buy |
|
Kenya Reinsurance |
1.7 |
1.6 |
(6.5%) |
(15.0%) |
1.9 |
2.5 |
6.3% |
64.2% |
0.1x |
Buy |
|
Equity Group*** |
43.0 |
38.2 |
(11.3%) |
(15.3%) |
45.1 |
58.4 |
7.9% |
60.8% |
0.9x |
Buy |
|
Britam |
4.9 |
4.6 |
(7.5%) |
(12.5%) |
5.2 |
7.1 |
0.0% |
56.5% |
0.8x |
Buy |
|
Liberty Holdings |
4.5 |
4.8 |
6.4% |
(4.8%) |
5.0 |
6.8 |
0.0% |
40.6% |
0.4x |
Buy |
|
ABSA Bank*** |
12.6 |
12.0 |
(4.4%) |
(1.6%) |
12.2 |
15.5 |
11.3% |
40.0% |
1.0x |
Buy |
|
Co-op Bank*** |
12.5 |
12.3 |
(1.6%) |
1.7% |
12.1 |
15.5 |
12.2% |
38.0% |
0.6x |
Buy |
|
Sanlam |
8.7 |
8.7 |
0.0% |
(9.0%) |
9.6 |
11.9 |
0.0% |
36.6% |
0.9x |
Buy |
|
NCBA*** |
36.8 |
34.1 |
(7.5%) |
(12.6%) |
39.0 |
43.4 |
8.8% |
36.2% |
0.8x |
Buy |
|
I&M Group*** |
18.0 |
17.1 |
(5.3%) |
0.0% |
17.1 |
20.8 |
8.8% |
30.9% |
0.4x |
Buy |
|
Diamond Trust Bank*** |
49.7 |
48.5 |
(2.5%) |
(2.8%) |
49.9 |
57.1 |
6.2% |
24.1% |
0.2x |
Buy |
|
CIC Group |
2.0 |
1.9 |
(3.6%) |
(0.5%) |
1.9 |
2.3 |
0.0% |
22.1% |
0.7x |
Buy |
|
Stanbic Holdings |
108.8 |
110.5 |
1.6% |
8.3% |
102.0 |
112.0 |
11.4% |
12.8% |
1.0x |
Accumulate |
|
Standard Chartered*** |
167.0 |
167.0 |
0.0% |
15.2% |
145.0 |
166.3 |
13.2% |
12.7% |
1.1x |
Accumulate |
|
HF Group |
3.5 |
3.5 |
(0.3%) |
10.8% |
3.2 |
3.4 |
0.0% |
(1.7%) |
0.2x |
Sell |
|
*Target Price as per Cytonn Analyst estimates **Upside/ (Downside) is adjusted for Dividend Yield ***For Disclosure, these are stocks in which Cytonn and/or its affiliates are invested in |
||||||||||
We are “Neutral” on the Equities markets in the short term due to the current adverse operating environment and huge foreign investor outflows, and, “Bullish” in the long term due to current cheap valuations and expected global and local economic recovery.
With the market currently trading at a discount to its future growth (PEG Ratio at 0.8x), we believe that investors should reposition towards value stocks with strong earnings growth and that are trading at discounts to their intrinsic value. We expect the current high foreign investors sell-offs to continue weighing down the equities outlook in the short term.
- Industry Report
During the week, the Kenya Roads Board (KRB), the agency overseeing development and maintenance of roads in Kenya, released the Annual Public Roads Programme 2022/2023 report and the following were the key take outs;
- Kenya’s good roads network increased to 18.2% in 2018 from 9.9% in 2009, while the poor road networks declined to 37.0% in 2018, from the 58.9% recorded in 2009. Both instances signify the government’s efforts to better the infrastructure and roads sector in Kenya through implementation and development of various major road projects such as the completed Nairobi Expressway, Western Bypass, Northern Bypass, Eldoret Bypass, Makupa Bridge, Jomvu-Miritini-Changamwe dual carriage, Kibarani Bridge in Mombasa, and expansion and maintenance of major highways such ongoing expansion of Eastern Bypass and Kenol-Marua highways, ongoing construction of Dongo-Kundu dual carriageway, and many more,
- A total of Kshs 67.2 bn has been allocated in FY’2022/2023 to various agencies namely; Kenya National Highway Authority (KeNHA), Kenya Urban Roads Authority (KURA), Kenya Rural Roads Authority (KeRRA), Kenya Wildlife Service (KWS), and Roads Sector Investment Programme Gaps (RSIPG), for the purpose of maintenance and restoration of public roads. This represents a 22.2% increase in the funds allocated for the maintenance of roads for the FY’2022/23 compared to the Kshs 55.0 bn spent in the FY’2021/22, an indication that the government continues to prioritize on improved road developments across the country. However, a negative 4-year Compounded Annual Growth Rate (CAGR) of 3.6% in roadwork budget allocation is attributed to significant reduction in allocation of funds for roadworks by 42.0% to 45.1 bn in FY’2020/2021 from Kshs 77.7 bn in FY’2019/2020. The budget reduction was occasioned by the emergence of Covid-19 pandemic in 2020 as the government consolidated more finances from other sectors of the economy like the infrastructural sector to support the country’s healthcare sector in containing the spread and prevalence of the pandemic in the country. Nonetheless, a gradual increase of finances from FY’2019/2020 to the current fiscal year signifies the government’s bigger investment programs aligned on road infrastructure to not only sustain the upgrade and maintenance of roads but also launching and commissioning new mega projects in different parts of the country as the economy gears towards pre-COVID-19 period. The graph below shows roadworks budgets allocation in Kenya from 2019 to 2020;
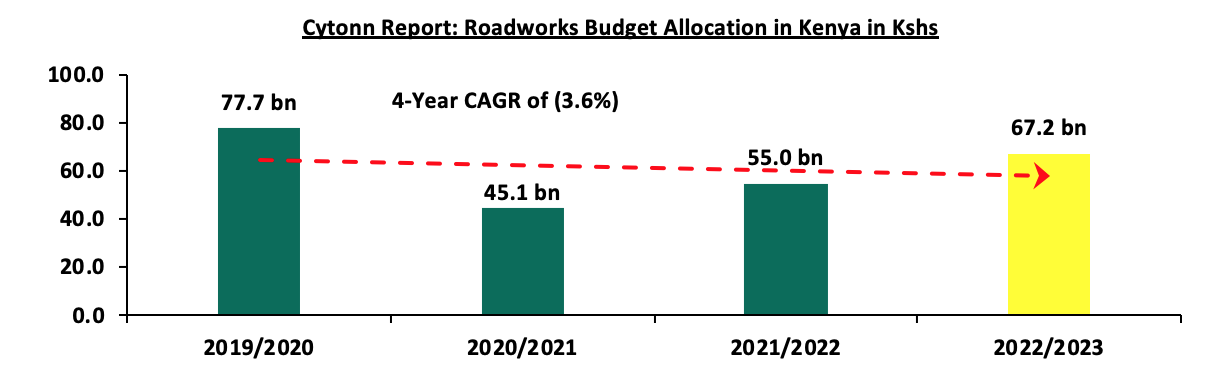
Source: Kenya Roads Board (KRB)
- KeNHA is set to receive the largest share of the budget totalling to Kshs 27.7 bn with KURA, KeRRA, KWS, and RSIPG each set to receive Kshs 10.1 bn, Kshs 21.6 bn, Kshs 0.6 bn, and Kshs 7.1 bn, respectively, for revamping and maintaining their respective road projects. Furthermore, the total road network to be covered under the Annual Public Roads Programme (APRP) increased by 5.3% to 50,978 km in FY’2022/2023 from 48,418 km in FY’2021/2022. This represents 31.5% of the total Classified National Trunk Road Network which is at 162,055 km and 20.7% of the total national road network which is currently at 246,757 km. The graph below shows percentage share of budget allocation to various road agencies in Kenya in FY’2022/2023;
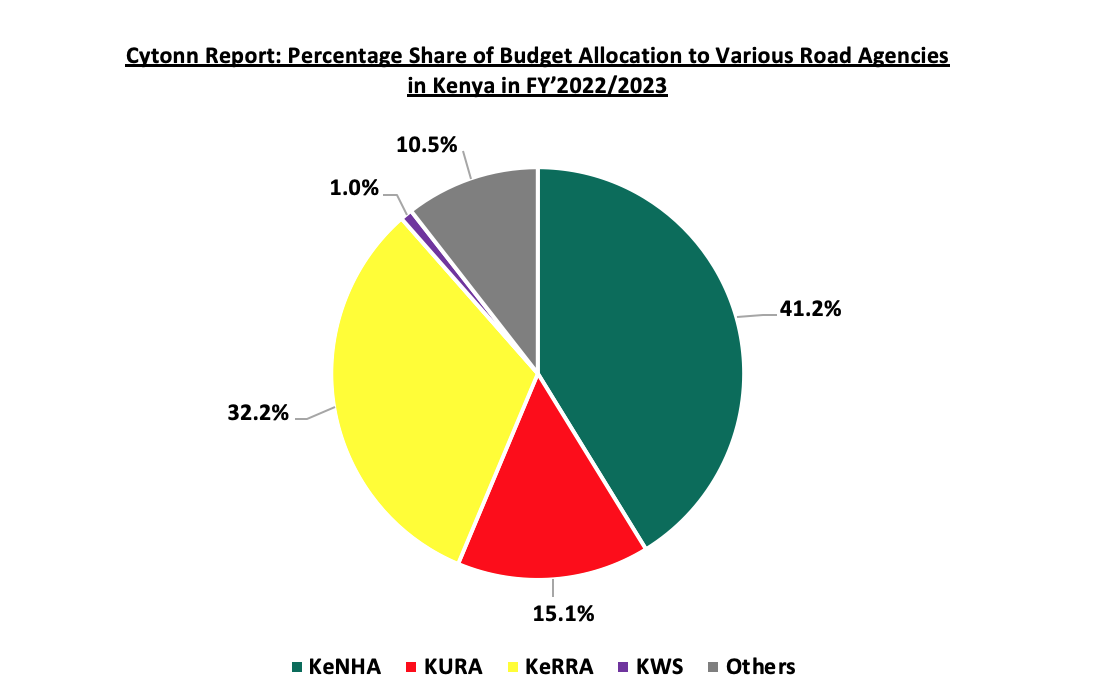
Source: Kenya Roads Board (KRB)
We expect to continue seeing the progress, execution, and completion of more road developments in FY’2022/2023 mainly supported by the current government's aggressiveness to; i) fast-track the accomplishment of key projects that stalled during the previous regime, and, ii) step up on competition for attracting regional and international investors against other countries in Eastern Africa like Tanzania through improved and quality road networks across the country.
Upon completion, the select projects are expected to open up more areas for penetration of Real estate investments across all select sub-sectors, opening up new opportunities and demand for properties, goods and services. Nevertheless, the government is still experiencing financial shortfall in its expenditure budget and therefore financing some of these projects will be costly and at higher risks of overburdening the budget. This has led to an expected reduction of the Government’s allocation for Infrastructure, Energy, and Information and Technology (ICT) by 4.4% for the fiscal year 2023/2024 to Kshs 398.2 bn, from Kshs 416.4 bn in FY’2022/2023 according to Draft 2023 Budget Policy Statement. Additionally, the government has been running out of the fiscal space and cannot impose more taxes on Kenyans given that there is an existing Fuel Maintenance Levy for the maintenance of road currently imposed on motorists. Therefore, the government will have to continue adopting various sources of financing the road developments such as; Public-Private Partnerships (PPPs), issuing of Infrastructure bonds, concessional loans from multilateral organizations, grants and loans from foreign countries, and Joint Ventures (JVs) with several parastatals and agencies. The graph below illustrates infrastructure budget allocation from FY’2013/2014 to FY’2022/2023;
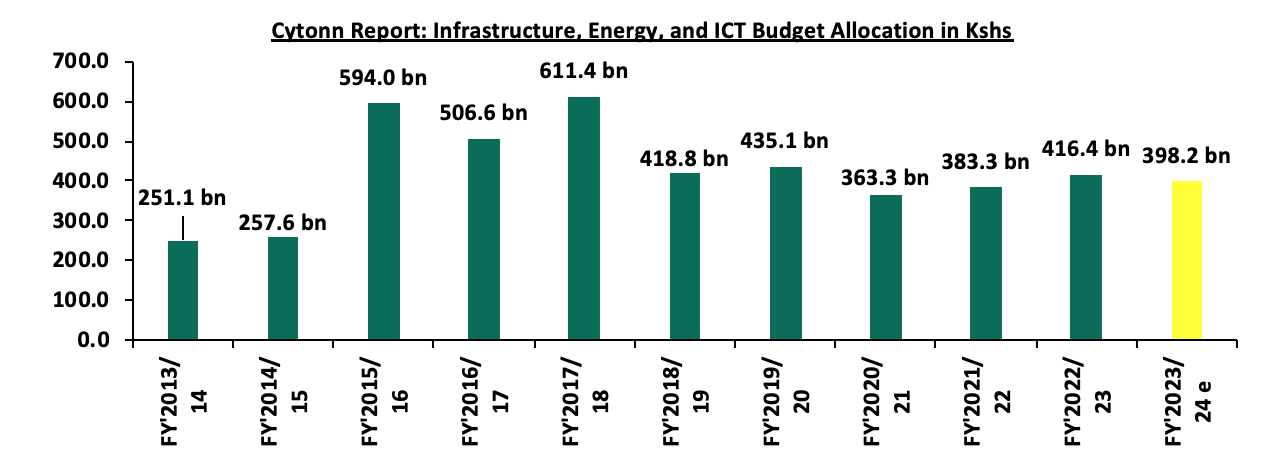
Source: National Treasury
- Hospitality Sector
During the week, Dusit International, a Bangkok based Thai Hotel and property development company announced plans to open a hotel-serviced apartment in Westlands Nairobi in 2023 dubbed ‘Dusit Princes Hotel Residences’, along Mimosa Lane off Church Road. The upper-middle class property will consist of a hybrid of 56 one bedroom and 30 studio apartments and 14 deluxe hotel rooms. Other facilities at the property will include; an Italian inspire restaurant dubbed ‘The Olive Restaurant’, a rooftop bar dubbed ‘The Aviary Lounge’, heated swimming pool, rooftop gym, and a 150 guest capacity theatre-styled meeting room. The opening of ‘Dusit Princes Hotel Residences’ comes after closure of ‘DusitD2 Nairobi’ in 2021, a luxury hotel branch of Dusit International which was located at 14 Riverside Complex in Westlands. The closure of the hotel which was opened in 2014 was occasioned by a terror attack the 14 Riverside Complex in January 2019 and a prevailing COVID-19 pandemic in 2020 and 2021, greatly hampering its business operations in the hospitality sector. The decision is also part of an aggressive expansion move by the international hotel chain with plans to open 14 new hotels in the next three to four years, with a total estimation of 1,700 new rooms across seven countries worldwide. Westlands continues to attract more international hospitality brands in Kenya evidenced by the new entry of Kwetu Residences by Hilton Hotel in February 2023 and JW Marriot in Global Trade Centre (GTC) which will be opened in 2023. According to our Nairobi Metropolitan Area (NMA) Serviced Apartments Report 2022, Westlands still holds the largest market share of serviced apartments in NMA region as shown in the table below:
|
Cytonn Report: Nairobi Metropolitan Area (NMA) Serviced Apartments Market Share 2022 |
|
|
Area Percentage |
Market Share |
|
Westlands |
33.7% |
|
Kilimani |
29.2% |
|
Kileleshwa & Lavinton |
12.4% |
|
UpperHill |
7.9% |
|
Limuru Road |
7.8% |
|
Nairobi Central Business District (CBD) |
4.5% |
|
Thika Road |
4.5% |
|
Total |
100% |
Source: Cytonn Research
The investment attraction in Westlands has been attributed to;
- Its close proximity to Nairobi’s Central Business District (CBD) and other business nodes such as Kilimani and Upperhill,
- Direct accessibility to and from Kenya’s main international airport, the Jomo Kenyatta International Airport (JKIA), via the Nairobi Expressway,
- Its strategic location within a vibrant commercial zone thus suitable for hospitality activities such as conferences and meetings,
- Adequate infrastructure and social amenities such as the upgraded Waiyaki Way, Westgate Mall, Global Trade Centre and Kitisuru Road,
- Presence of numerous international embassies and multinational organizations which attract international visitors and expatriates and are key markets for the hospitality sector, with others being the German Embassy, United Nations regional offices, Microsoft, Google regional offices, PwC, Deloitte, Netherlands Embassy, and, HD Centre for Humanitarian Dialogue, and,
- Presence of prime serviced apartments fetching higher rents and rental yields thus increasing investors’ confidence for the region. This is according to our Nairobi Metropolitan Area (NMA) Serviced Apartments Report 2022, which highlighted that Westlands was the best performing node in terms of serviced apartments in NMA in 2022, fetching the highest monthly charges and rental yields at Kshs 3,916 and 9.3% respectively. The table below highlights the performance of the various nodes within the NMA;
|
Cytonn Report: NMA Serviced Apartments Performance per Node - 2022 |
||||||||
|
Node |
Studio |
1 Bed |
2 Bed |
3 bed |
Monthly Charge/ SQM (Kshs) |
Occupancy |
Devt Cost/SQM (Kshs) |
Rental Yield |
|
Westlands |
193,633 |
284,376 |
343,828 |
353,350 |
3,916 |
70.7% |
209,902 |
9.3% |
|
Kilimani |
173,062 |
248,122 |
287,174 |
449,987 |
2,937 |
69.3% |
202,662 |
7.2% |
|
Kileleshwa & Lavington |
150,000 |
250,000 |
417,593 |
498,803 |
2,811 |
66.3% |
206,132 |
6.6% |
|
Limuru Road |
145,713 |
308,725 |
327,424 |
344,500 |
2,976 |
60.6% |
231,715 |
5.8% |
|
Nairobi CBD |
171,000 |
162,680 |
271,707 |
268,620 |
2,348 |
66.2% |
224,571 |
5.2% |
|
Upperhill |
201,533 |
347,950 |
554,800 |
2,225 |
65.4% |
209,902 |
5.0% |
|
|
Thika Road |
82,381 |
208,088 |
295,000 |
1,800 |
62.1% |
200,757 |
4.2% |
|
|
Average |
166,682 |
219,688 |
314,823 |
395,008 |
2,716 |
65.8% |
212,234 |
6.2% |
Source: Cytonn Research 2022
Kenya’s hospitality sector continues to showcase positive growth in its performance, development, and expansion activities. This has mainly boosted by the increased international tourism arrivals into the country, conferences, leisure, and, sport activities, following continuous reopening of the country in the post-COVID period with the sector’s performance gearing towards pre-COVID levels. According to Kenya Tourism Research Institute’s Annual Tourism Sector Performance Report - 2022, Kenya registered a 70.5% increase in the number of international arrivals to 1,483,752 persons in 2022 compared to 870,465 persons in 2021. The performance in 2022, represented a 72.4% recovery level compared to pre COVID-19 levels of 2,048,834 persons in 2019, 7.4% points higher than the average global recovery rate compared against the same period. The graph below shows the number of international arrivals from 2017 to 2022;
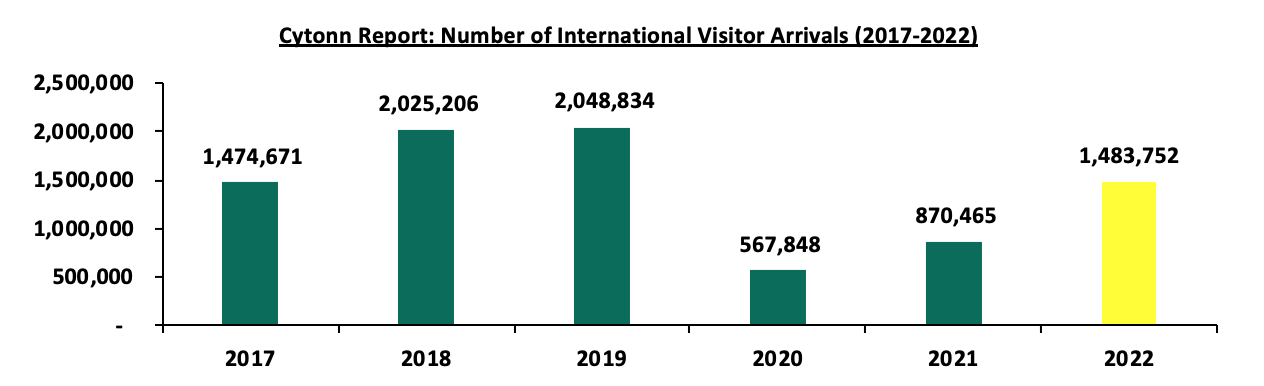
Source: Kenya Tourism Research Institute (KTRI)
Additionally, the number of both international and domestic bed occupancies grew by 38.4% to 5,726,609 beds in the period January to September 2022 from 4,138,821 beds the same period in 2021. This represented an 89.2% recovery rate against 2019 which recorded 6,416,730 occupied beds. On the other hand, rooms occupancy increased by 19.5% to 3,687,365 in 2022 from January to September from 3,084,957 in the same period in 2021, achieving a recovery rate of 89.9% against 2019 pre-COVID levels which recorded 4,101,150 rooms occupied. The graph below shows the overall number of bed and room occupancies in Kenya between January and September, from 2019 to 2022;
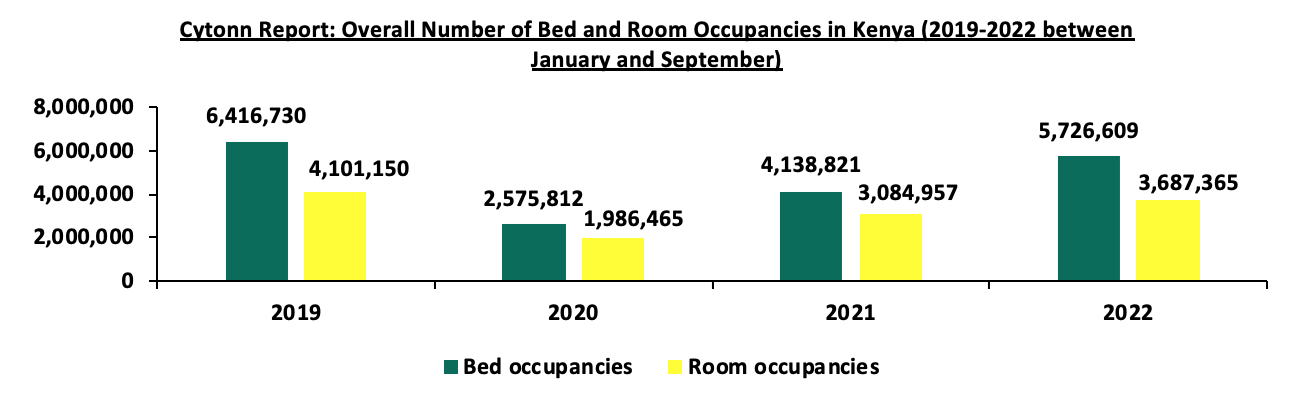
Source: Kenya Tourism Research Institute (KTRI)
With renewed optimism on the sector and strong indications of recovery and resilience from the pandemic's effects, the W Hospitality Group's Hotel Chain Development Pipelines in Africa 2022 reveals that 24 global hotel brands are exploring opportunities to develop new hospitality facilities in Kenya. This will result in the addition of 3,155 new hotel rooms in the country, placing Kenya among the top ten hotspot countries for new luxury hotels on the African continent, as demonstrated below. The graph below shows number of hotel rooms in the pipeline in several African countries;
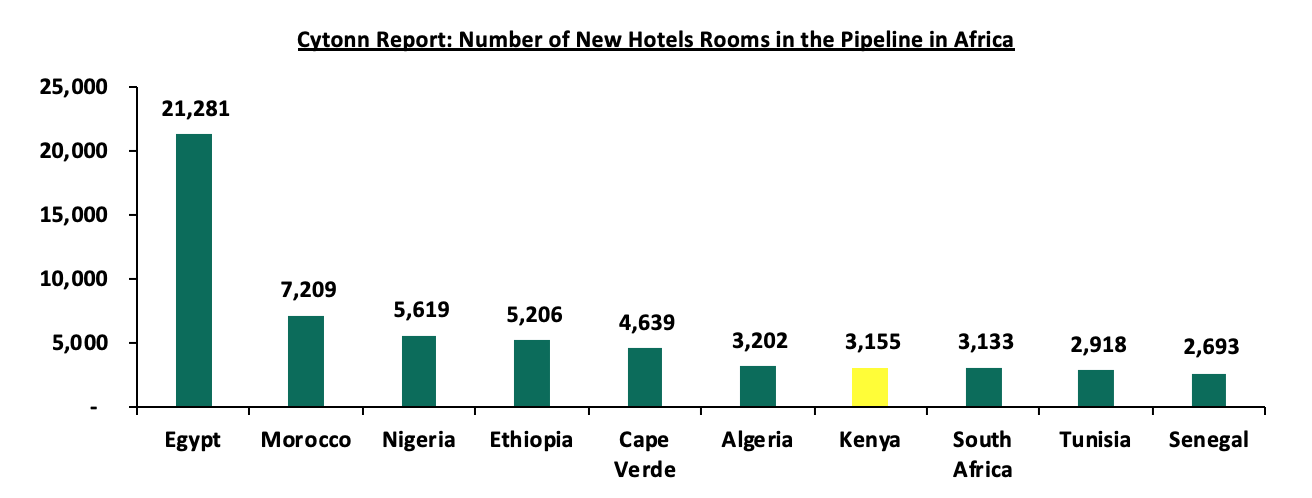
Source: Hotel Chain Development Pipelines in Africa 2022
We expect the hospitality sector’s performance to continue being resilient, fuelled by factors such as: i), increased business events, conferences, and meetings from the public and private sectors owning to revamp of the economy in the post-COVID-19 and electioneering periods, ii) continued recognition of Kenya’s hospitality industry through positive accolades awarded to several local and foreign hotel brands based in Kenya which have boosted investors’ confidence in the sector such as the World Travel Awards 2022, MICE Awards, Fodor Finest Hotels, among others, iii) increased sporting activities and leisure such as the 2023 Annual World Safari Rally, and, iv) intensive marketing of Kenya’s tourism market through platforms such as the Magical Kenya and Kenya Tourism Board to local and international tourists. However, the recent issuance of travel advisories regarding insecurity in certain regions of the country by the United Kingdom (UK), United States of America (USA), Irish, and Canadian governments in February 2023 and the current government’s austerity measures to indefinitely suspend hotel meetings, conferences and trainings by Ministries, Agencies and State Departments (MADs) will further weigh down the optimum performance of the hospitality sector.
- Real Estate Investments Trusts (REITs)
In the Nairobi Securities Exchange, ILAM Fahari I-REIT closed the week trading at an average price of Kshs 6.3 per share. The performance represented a 3.6% gain from Kshs 6.1 per share recorded the previous week, taking it to a 7.4% Year-to-Date (YTD) decline from Kshs 6.8 per share recorded on 3rd January 2023. In addition, the performance represented a 68.6% Inception-to-Date (ITD) loss from the Kshs 20.0 price. The dividend yield currently stands at 8.0%. The graph below shows Fahari I-REIT’s performance from November 2015 to 17th March 2023;
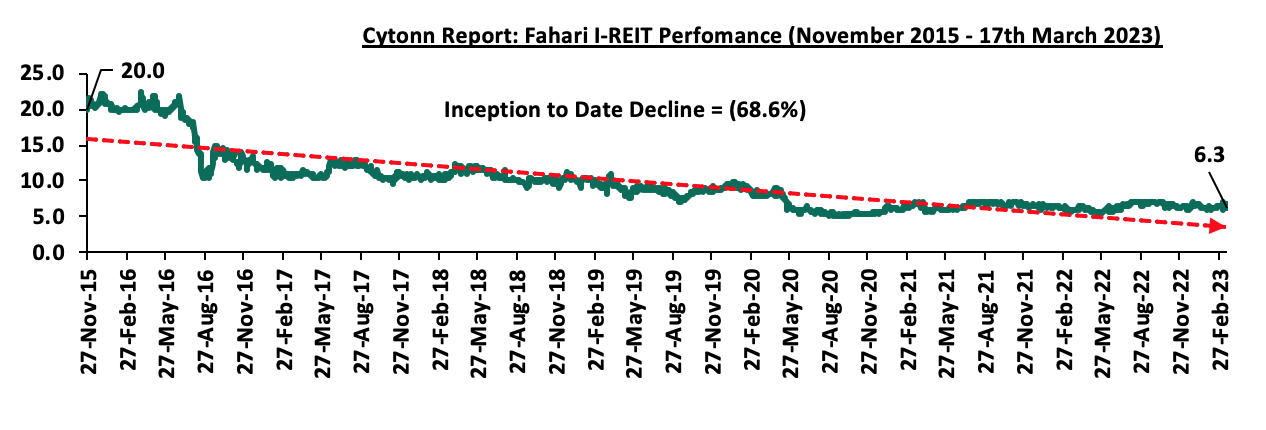
In the Unquoted Securities Platform, Acorn D-REIT and I-REIT traded at Kshs 23.9 and Kshs 20.9 per unit, respectively, as at 17th March 2023. The performance represented a 19.4% and 4.4% gain for the D-REIT and IREIT, respectively, from the Kshs 20.0 inception price. The volumes traded for the D-REIT and I-REIT came in at 12.3 mn and 29.4 mn shares, respectively, with a turnover of Kshs 257.5 mn and Kshs 600.4 mn, respectively, since inception in February 2021.
REITs provide numerous advantages, including consistent and prolonged profits, tax exemptions, and diversified portfolios, among others. Despite these benefits, the performance of the Kenyan REITs market remains limited by several factors such as; i) insufficient investor understanding of the investment instrument, ii) time-consuming approval procedures for REIT creation, iii) high minimum capital requirements of Kshs 100.0 mn for trustees, and, iv) high minimum investment amounts set at Kshs 5.0 mn discouraging investments.
We expect the performance of Kenya’s Real Estate sector to remain on an upward trajectory, supported by factors such as; i) increased investment in road infrastructural developments by the government which will open up more areas for more opportunities in Real Estate across the country, and, ii) increased activities in the hospitality sector as the economy continues on its recovery path. However, the reduction in budget expenditure in the general infrastructure sector, and low investor appetite for REITs are expected to continue subduing the performance of the sector.
In 2022, we published the Nairobi Metropolitan Area Commercial Office Report 2022 themed ‘Changing Working Patterns Driving the Market’, in which we highlighted the performance of the sector in 2021, as well as giving insights on the outlook and areas best fit for investment opportunities. According to the report, the sector witnessed improved performance, with the average rental yields coming in at 7.3% in 2021, 0.3% points higher than the 7.0% recorded in 2020, attributed to continued COVID-19 pandemic recovery, an improved business environment and expansion in activities by various firms. The average occupancy rates slightly reclined by 0.1% points to 77.6% in 2021, from 77.7% recorded in 2020, this is as some firms still embraced a work from home policy. Asking rents and prices stabilized to an average of Kshs 94 and Kshs 12,108 per SQFT respectively in 2021, from Kshs 93 and Kshs 12,280 per SQFT, respectively, recorded in 2020. In addition, there was an oversupply of 6.7 mn SQFT in office spaces in the market, which continued to subdue the sector’s optimum performance.
This week, we update our previous research with the Commercial Office Report 2023 themed ‘Persisting Tenant’s Market’, in order to determine the market’s performance and analyse the ongoing trends, by looking at the following:
- Overview of the Commercial Office Sector,
- Commercial Office Supply in the Nairobi Metropolitan Area,
- Commercial Office Performance, by Location and by Grades, and,
- Office Market Outlook and the Investment Opportunity in the Sector.
Section I: Overview of the Commercial Office Sector
In 2022, the commercial office market in the Nairobi Metropolitan Area (NMA) experienced notable growth in overall sector activities compared to 2021, driven by growth in demand for office space and further expansion activities by developers. In addition, the desire for convenience allowed the co-working office theme to gain more traction, with entry of more developments offering serviced offices. Some of the factors that have been driving the increased performance and activities in the market include;
- Continued business reopening: 2022 was characterized by increased business operations following continued post COVID-19 recovery which drove demand for commercial office spaces. This resulted in a slight increase in overall occupancy rates for the sector and an improvement in rental yields, prompting the construction of new office buildings and the renovation of existing ones to meet the rising demand,
- Serviced Offices/ Co-Working Spaces: Serviced offices and co-working spaces are gaining popularity in Kenya due to their convenience and flexibility, making them attractive to both tenants and investors. These types of spaces offer an affordable and flexible option for entrepreneurs and small businesses that do not want to commit to long-term leases,
- Growing Demand for Grade A and Green Spaces: Growing investor knowledge and the entry of multinational corporations (MNCs) into Kenya have led to a growing demand for high quality, Grade A office space and attention to sustainability in the office market. This is because many MNCs favour developments that provide well-furnished and equipped work environments, which integrate Environmental, Social, and Governance (ESG) features such as green technology,
- Nairobi’s Recognized Position as a Regional Hub: Nairobi remains an attractive investment location within the region for MNCs. For instance, in February 2023, Commonwealth Enterprise and Investment Council (CWEIC), an international business organization, opened its regional office in Nairobi, Kenya, to serve as East Africa’s business hub. This indicates the potential for Nairobi's commercial office sector to attract investments compared to other cities in the region, thereby bolstering performance of the sector, and,
- Positive National Demographics: Kenya has a relatively high urbanization at 3.7%, 2.1% points higher than the global average of 1.6% according to the World Bank as of 2021. This rapid urbanization is driving demand for office spaces as more people move into urban areas, seeking job opportunities and better living conditions. The trend is expected to continue as the government continues to implement policies that promote urbanization and investment in infrastructure.
Conversely, the sector continues to face setbacks such as;
- Oversupply of Office Space: The supply of office space in Nairobi Metropolitan Area exceeds the current demand, resulting in an oversupply of 5.8 mn SQFT in 2022. This oversupply has led to prolonged vacancy rates, prompting developers to halt construction plans for new developments until the excess office space in the market is absorbed,
- Remote/ Hybrid Working Model: The adoption of remote or hybrid working models by some companies has negatively impacted the overall occupancy rates of office spaces and the returns for landlords. However, it is worth noting that a shift from full remote working to a hybrid model by some companies will improve the sector’s office occupancy rates, and,
- Financial Constraints: Developers face financial constraints due to difficulties accessing credit loans as banks have tightened their loan lending terms and request more collateral due to increasing default rates, evidenced by gross Non-Performing Loans (NPLs) in the Real Estate sector increasing by 9.2% to Kshs 75.6 bn in Q3’2022 from Kshs 69.2 bn recorded in Q3’2021. This is further aggravated by the rising costs of construction costs, averaging Kshs 5,210 in 2022, a 5.0% increase from Kshs 4,960 recorded in 2021, attributable to price increase of key construction materials such as cement, steel, paint, aluminium and PVC.
Section II: Commercial Office Supply in the Nairobi Metropolitan Area
The year 2022 saw considerable increase in office supply, with the addition of 6 new office developments that injected up to 0.6 mn SQFT of space into the commercial office market. The developments included; The Piano, Principal Place and The Rock in Westlands, Trade and development Bank (TDB) Tower in Kilimani, The Cube in Riverside, and Karen Green in Lang’ata. On the other hand, 0.3 mn SQFT of space is in the pipeline slated to enter the market in 2023, which includes; Curzon in Lavington and CCI Global’s Headquarters located in Tatu City. The table below shows some of the notable office completions during the review period as well as incoming spaces:
|
Cytonn Report: Nairobi Metropolitan Area Commercial Office Space Supply |
||||||
|
Major Commercial Office Completions in 2022 |
Major Incoming Commercial Office Space Supply in 2023 |
|||||
|
# |
Development |
Location |
Size (SQFT) |
Development |
Location |
Size (SQFT) |
|
1 |
The Piano |
Westlands |
136,167 |
CCI Global HQ |
Tatu City |
233,168 |
|
2 |
Principal Place |
Westlands |
119,000 |
Curzon |
Lavington |
60,000 |
|
3 |
The Rock |
Westlands |
100,000 |
|
|
|
|
4 |
TDB Tower |
Kilimani |
90,000 |
|
|
|
|
5 |
The Cube |
Riverside |
77,876 |
|
|
|
|
6 |
Karen Green |
Lang’ata |
67,700 |
|
|
|
|
Total |
|
|
590,743 |
|
|
293,168 |
Source: Cytonn Research, Knight Frank
The NMA commercial office sector recorded an office space oversupply of 5.8 mn SQFT in 2022, a 13.4% decline from the 6.7 mn SQFT realized in 2021. This was attributed to increased demand of physical office spaces as most businesses reverted back to full office operations while other organisations continued to adopt the hybrid work policy from the work from home policy, as well as continued economic recovery and a peaceful post-electioneering period. This saw the average office vacancy rate come in at 20.6% in 2022, a decline of 1.5% points from 22.1% recorded in 2021, as the demand for office space continued the gradual recovery from the impacts of COVID-19 pandemic in 2020. During 2022, the growth in demand for office space prompted the new developments to be absorbed faster, even as 0.6 mn SQFT of office space was released into the market, 20.0% higher than the 0.5 mn SQFT supplied in 2021. This is anticipated to further cushion the sector as less office developments are expected to be completed in 2023 compared to 2022, further reducing the oversupply of office space in the market. The table below summarizes the commercial office space supply over time;
|
Cytonn Report: Nairobi Metropolitan Area Office Space Analysis |
||||||||||||
|
Year |
2012 |
2013 |
2014 |
2015 |
2016 |
2017 |
2018 |
2019 |
2020 |
2021 |
2022 |
2023 F |
|
Stock (Mn SQFT) |
7.7 |
9.7 |
15.4 |
22.9 |
28.9 |
31.8 |
35.5 |
36.3 |
36.4 |
36.8 |
37.4 |
37.1 |
|
Completions (Mn SQFT) |
1.2 |
2.1 |
5.9 |
7.8 |
6.5 |
3.5 |
4.3 |
1.5 |
0.8 |
0.5 |
0.6 |
0.3 |
|
Vacancy Rate (%) |
9.0% |
10.0% |
10.0% |
11.0% |
12.0% |
16.8% |
16.7% |
19.5% |
22.3% |
22.1% |
20.6% |
19.7% |
|
Vacant Stock (Mn SQFT) |
0.7 |
1.0 |
1.5 |
2.5 |
3.5 |
5.3 |
5.9 |
7.1 |
8.1 |
8.1 |
7.7 |
7.3 |
|
Occupied Stock (Mn SQFT) |
7.1 |
8.8 |
13.9 |
20.3 |
25.4 |
26.5 |
29.6 |
29.2 |
28.3 |
28.7 |
29.7 |
29.8 |
|
Net Absorption |
1.0 |
1.7 |
5.1 |
6.5 |
5.1 |
1.0 |
3.1 |
(0.4) |
(1.0) |
0.4 |
1.0 |
1.1 |
|
Demand |
1.1 |
1.9 |
5.3 |
6.8 |
5.6 |
1.6 |
3.7 |
0.4 |
(0.2) |
1.2 |
1.8 |
1.9 |
|
Available Supply, AS(T) |
1.7 |
2.6 |
6.5 |
8.8 |
8.4 |
6.3 |
9.0 |
6.7 |
7.1 |
7.9 |
7.6 |
7.7 |
|
Gap, GAP(T) |
(0.5) |
(0.8) |
(1.2) |
(2.1) |
(2.9) |
(4.7) |
(5.2) |
(6.3) |
(7.3) |
(6.7) |
(5.8) |
(5.8) |
Source: Cytonn Research/ Building Plan Approvals Data from the Nairobi City County
The chart below highlights the trend for oversupply in the Nairobi Metropolitan Area (NMA) Commercial Office sector from 2012 – 2022;
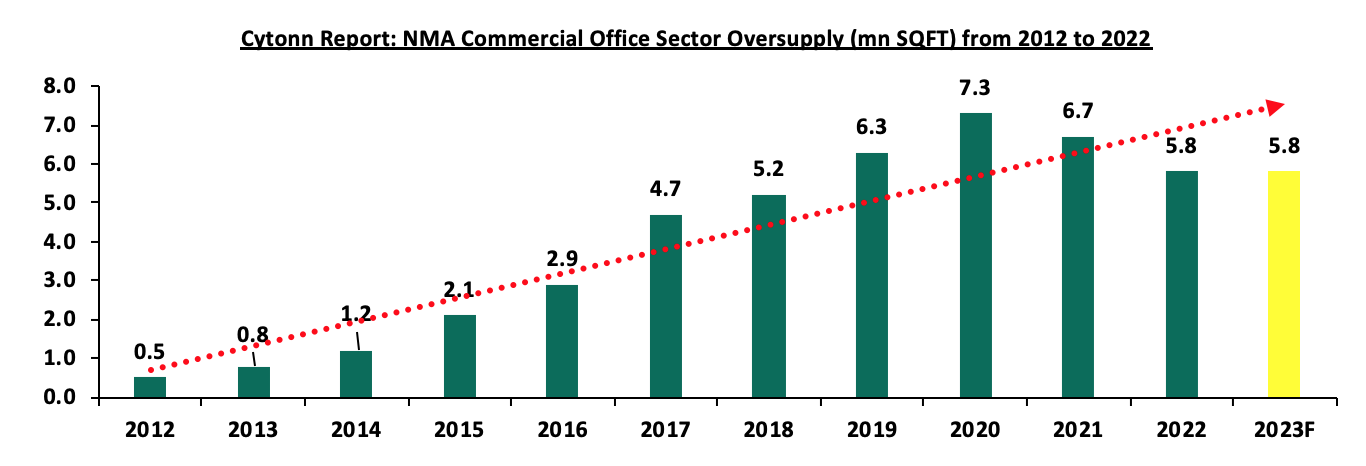
Source: Cytonn Research
Section III: Commercial Office Performance, by Location and by Grades
The Commercial Office sector realized a 0.3% points increase in average rental yields in 2022 to 7.6%, from 7.3% recorded in 2021 attributable to increased occupancy and rental rates. Average asking rents per SQFT in the Nairobi Metropolitan Area (NMA) increased by 2.1% to Kshs 96 per SQFT from Kshs 94 per SQFT in 2021. Additionally, occupancy rates increased by 1.8% points to 79.4%, which is the highest recorded since the start of the COVID-19 pandemic in 2020, surpassing 77.6% achieved in 2021. The improved performance in the Commercial Office space sector can be attributed to several factors, including: i) slow but steady rise in demand for physical spaces as more firms resumed full operations, ii) increased supply of high-quality Grade A office spaces, such as Karen Green and Global Trade Centre (GTC) Office, which attract premium rents, iii) the adoption of expansion strategies by companies such as Call Centre International (CCI) Group boosting occupancy rates, and iv) a stabilizing and improved business environment following the resumption of economic activities after the COVID-19 period and the peaceful conclusion of the August 2022 general elections. The table below summarizes the performance of the commercial office theme over time:
|
(All Values in Kshs Unless Stated Otherwise) |
|||||||||
|
Cytonn Report: Commercial Office Performance Over Time |
|||||||||
|
Year |
2015 |
2016 |
2017 |
2018 |
2019 |
2020 |
2021 |
2022 |
y/y ∆ 2022 |
|
Occupancy (%) |
89.0% |
88.0% |
82.6% |
83.8% |
80.3% |
77.7% |
77.6% |
79.4% |
1.8% |
|
Asking Rents (Kshs/SQFT) |
97 |
97 |
101 |
101 |
96 |
93 |
94 |
96 |
2.1% |
|
Average Prices (Kshs/SQFT) |
12,776 |
12,031 |
12,649 |
12,407 |
12,638 |
12,280 |
12,106 |
12,223 |
1.0% |
|
Node Average Rental Yields (%) |
8.1% |
8.5% |
7.9% |
8.3% |
7.5% |
7.0% |
7.3% |
7.6% |
0.3% |
Source: Cytonn Research
- Commercial Office Performance by Nodes
For the purposes of submarket analysis, we categorized the primary office locations within the Nairobi Metropolitan Area into 9 major nodes; i) Nairobi CBD, ii) Westlands, covering environs including Riverside, iii) Parklands, iv) Mombasa Road, v) Thika Road, vi) Upperhill, vii) Karen, viii) Gigiri, and, ix) Kilimani, which includes offices in Kilimani, Kileleshwa and Lavington.
The table below shows the Nairobi Metropolitan Area (NMA) sub-market performance;
|
(All values in Kshs unless stated otherwise) |
|
|
|
||||||||
|
Cytonn Report: Nairobi Metropolitan Area Commercial Office Market Performance FY’2022 |
|||||||||||
|
Area |
Price/SQFT FY 2021 |
Rent/SQFT FY 2021 |
Occupancy FY 2021(%) |
Rental Yields FY 2021(%) |
Price Kshs/ SQFT FY 2022 |
Rent Kshs/ SQFT FY 2022 |
Occupancy FY 2022(%) |
Rental Yield FY 2022(%) |
∆ in Rent
|
∆ in Occup ancy
|
∆ in Rental Yields |
|
Gigiri |
13,500 |
119 |
81.3% |
8.6% |
13,500 |
118 |
81.6% |
8.7% |
(0.8%) |
0.3% |
0.1% |
|
Westlands |
11,972 |
104 |
75.5% |
8.1% |
12,032 |
108 |
76.4% |
8.3% |
3.8% |
0.9% |
0.2% |
|
Karen |
13,325 |
106 |
83.0% |
7.7% |
13,431 |
111 |
82.9% |
8.3% |
4.7% |
(0.1%) |
0.6% |
|
Kilimani |
12,364 |
91 |
79.8% |
7.1% |
12,260 |
92 |
84.1% |
7.7% |
1.1% |
4.3% |
0.6% |
|
Upperhill |
11,336 |
91 |
80.1% |
7.6% |
11,662 |
91 |
81.5% |
7.7% |
0.0% |
1.4% |
0.1% |
|
Parklands |
11,787 |
82 |
82.8% |
6.8% |
11,971 |
83 |
85.2% |
7.3% |
1.2% |
2.4% |
0.5% |
|
Nairobi CBD |
12,409 |
94 |
78.0% |
7.0% |
12,586 |
96 |
76.5% |
7.1% |
2.1% |
(1.5%) |
0.1% |
|
Thika Road |
12,571 |
79 |
76.3% |
5.7% |
12,571 |
79 |
80.1% |
6.0% |
0.0% |
3.8% |
0.3% |
|
Mombasa Road |
11,250 |
73 |
64.2% |
5.1% |
11,325 |
71 |
66.9% |
5.1% |
(2.7%) |
2.7% |
0.0% |
|
Average |
12,106 |
94 |
77.6% |
7.3% |
12,223 |
96 |
79.4% |
7.6% |
2.1% |
1.8% |
0.3% |
Source: Cytonn Research
Key take-outs from the table above include;
- Gigiri was the best performing node in FY’2022 realizing an average rental yield of 8.7%, 1.1% points above the market average of 7.6%. Westlands and Karen were the second-best performing nodes, both registering average rental yields of 8.3%. The main factors contributing to the high demand for premium office spaces and attractive investment opportunities in these areas include: i) significant concentration of top-quality office buildings commanding premium rental rates and yields, ii) the availability of sufficient infrastructure and amenities that enhance the value of investments, and iii) the presence of multinational corporations, international organizations, and embassies in these locations driving up demand for quality office spaces, and,
- Conversely, Mombasa Road was the least performing node in FY’2022 with an average rental yield of 5.1%, 2.5% points lower than the market average of 7.6% attributed to; i) the predominance of lower quality office buildings that command lower average rental rates at Kshs 73 per SQFT, ii) its reputation as an industrial zone, making it less appealing to office-based businesses, and, iii) stiff competition from other sub-markets.
- Commercial Office Performance by Class/Grade:
Commercial office buildings are categorized into three main classes based on the quality and sizes of office spaces as follows:
- Grade A: These are high quality office buildings characterized by their adequate amenities, facilities, and finishes. They therefore fetch higher rental rates and yields compared to other office types. Also these office building sizes range from 100,001 - 300,000 SQFT,
- Grade B: These office buildings have their sizes ranging between 50,000 to 100,000 SQFT. They have good amenities and services, however not as good as Grade A offices, hence charge moderate rental rates, and,
- Grade C: These buildings are usually old, hence their lack of adequate services and facilities. Usually, they charge rents below the average market rate.
According to our office grade distribution analysis, Grade B offices constituted the majority of office spaces in the Nairobi Metropolitan Area in 2022, accounting for a current market share of 54.1%. However, notwithstanding, this marks a slight drop of 1.9% points from the 56.0% recorded in 2021, which can be attributed to the rise in the completion of Grade A offices, such as Principal Place, The Piano and The Cube in Westlands. Notably, the supply of Grade A office spaces increased by 3.7% to 28.2% from 24.7%.
In the nodal analysis, Gigiri, Karen, and Upperhill had the highest proportion of Grade A offices constituting 60.0%, 53.8% and 34.8% of their total office inventory. In contrast, Kilimani had the highest percentage of Grade B offices at 76.9%. However, this was a 4.9% points decline from 81.8% recorded in 2021. This was attributable to a 6.3% points increase in the overall supply of Grade A offices in Kilimani, brought about by completions such as the TDB Towers which injected an additional 90,000 SQFT of Grade A office space into the Kilimani market. For Grade C offices, Mombasa Road accounted for a majority of the office spaces with a current market share of 50.0%, remaining relatively unchanged from 2021. In terms of concentration, Mombasa Road had the highest mix of office types, having recorded 30.0%, 20.0%, and 50.0% of Grade A, Grade B, and Grade C office spaces respectively. The distribution of various office classes/grades is as summarized in the table below:
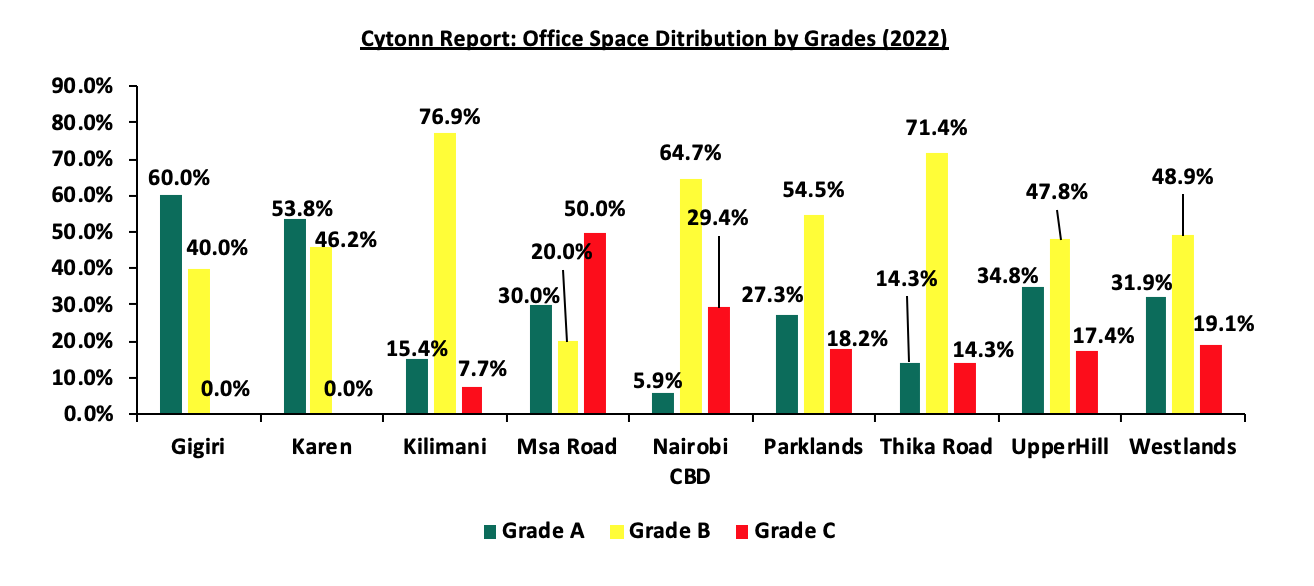
Source: Cytonn Research
In terms of performance;
- Grade B office spaces realized the highest rental yields at 7.8%. This was attributable to their increased preference by tenants evidenced by a 3.4% increase in occupancy rates, which was mainly as a result of their relatively affordable rental rates compared to Grade A offices and better technical services in comparison to Grade C office spaces,
- Grade A offices recorded the highest Year-on-Year (y/y) increase in rental rates by 5.1% in 2022 to Kshs 104 per SQFT from Kshs 99 per SQFT realized in 2021 attributed to their high quality spaces fetching higher rents, and increased demand by multinational firms and organizations, and,
- Grade C offices realized a slight increase in average rental yields by 0.1% points to 6.7% from 6.6% attributable to a 1.2% increase in average rental rates to Kshs 83 per SQFT from Kshs 82 per SQFT recorded in 2021. However, the increase was countered by a 1.1% points decline in average occupancy rates which is attributable to reduced demand by tenants, opting for Grade B offices which offer high quality office space with ample amenities such as parking.
The performance according to grades/class is as summarized in the table below:
|
(All Values in Kshs Unless Stated Otherwise) |
|||||||||||
|
Cytonn Report: Commercial Office Performance Based On Grades 2022 |
|||||||||||
|
Office Grade |
Price 2021 Kshs/SQFT |
Rent 2021 Kshs/SQFT |
Occupancy 2021 |
Rental Yield 2021 |
Price 2022 Kshs/SQFT |
Rent 2022 Kshs/SQFT |
Occupancy 2022 |
Rental Yield 2022 |
∆ Rent y/y |
∆ Occupancy y/y |
∆ Rental Yield y/y |
|
Grade A |
12,674 |
99 |
79.4% |
7.5% |
13,040 |
104 |
79.0% |
7.7% |
5.1% |
(0.4%) |
0.2% |
|
Grade B |
12,340 |
97 |
78.2% |
7.5% |
12,292 |
97 |
81.6% |
7.8% |
(0.0%) |
3.4% |
0.3% |
|
Grade C |
10,839 |
82 |
74.3% |
6.6% |
10,867 |
83 |
73.2% |
6.7% |
1.2% |
(1.1%) |
0.1% |
Source: Cytonn Research
- Commercial Office Performance by Class and Node:
In 2022, Grade A offices in Gigiri and Karen realized the most substantial average rental yields coming in at 8.4% and 8.3% respectively. This was attributable to; i) their strategic locations attracting high-end clientele which has enabled charging premium rates, ii) adequate amenities and infrastructure servicing the areas thus enhancing accessibility, and, iii) serene environment providing great locations for offices away from the bustle of the city centre. Strikingly, despite Grade A offices charging higher rental rates at 104 per SQFT compared to average rental rates of Grade B offices which stood at Kshs 97 per SQFT, Grade B offices in Gigiri had higher yields at 9.2%, compared to 8.4% recorded by Grade A offices. This was attributed to lower average selling prices chargeable per SQM for Grade B offices in Gigiri which came in at Kshs 13,000, compared to Kshs 14,000 per SQM for Grade A offices, since the yield is a factor of average rental rates, occupancies and selling price. As such, higher selling prices for Grade A offices resulted in slightly lower yields in comparison to Grade B offices even though all other factors for Grade A offices were slightly higher than Grade B offices. On the other hand, Grade B offices in Gigiri and Westlands had the highest rental yields of 9.2% and 8.4% respectively. Similarly, Grade C offices in Westlands and Nairobi CBD had the best returns with average rental yields coming in at 8.4% and 7.6%, respectively. The class performance by node is as summarized in the table below with the best performing areas of each grade highlighted in yellow;
|
Cytonn Report: Commercial Office Performance in 2022 by Nodes and Grades |
||||||
|
|
Grade A |
Grade B |
Grade C |
|||
|
Location |
Average of Occupancy (%) |
Average of Rental Yield |
Average of Occupancy (%) |
Average of Rental Yield |
Average of Occupancy (%) |
Average of Rental Yield |
|
Gigiri |
82.0% |
8.4% |
81.0% |
9.2% |
- |
- |
|
Westlands |
74.7% |
7.9% |
77.0% |
8.4% |
77.2% |
8.4% |
|
Karen |
83.1% |
8.3% |
82.7% |
8.2% |
- |
- |
|
Parklands |
83.2% |
7.7% |
83.0% |
8.0% |
72.3% |
6.7% |
|
Kilimani |
73.5% |
6.7% |
86.9% |
8.0% |
70.0% |
5.8% |
|
Nairobi CBD |
- |
- |
85.1% |
7.1% |
85.6% |
7.6% |
|
UpperHill |
79.1% |
7.6% |
80.5% |
7.1% |
65.1% |
6.0% |
|
Msa Road |
73.0% |
5.3% |
67.5% |
6.5% |
63.0% |
4.5% |
|
Thika Road |
90.0% |
7.4% |
80.0% |
5.9% |
71.0% |
5.2% |
Source: Cytonn Research
- Serviced Offices
In 2022, serviced offices realized a 2.0% Year-on-Year (y/y) growth in rental revenues, with average rental rates increasing to Kshs 190 per SQFT, from Kshs 183 per SQFT recorded in 2021. In comparison, unserviced offices revenues increased by 1.1%, with average rental rates increasing to Kshs 94 per SQFT in 2022, from Kshs 93 per SQFT realized in 2021. Notably, serviced offices in Westlands and Karen recorded the highest rent appreciations of 3.8% and 3.5%, respectively, significantly higher than the market average of 2.0%. The improvement in performance in these locations is due to; i) the presence of quality infrastructure enhancing accessibility, ii) higher demand for serviced offices supported by the presence of a high-end clientele and international firms with changing preferences, diversified themes and articulate designs which demand world-class standards, iii) high quality facilities attracting prime rents, and, iv) serene office locations which appeal to clients moving away from the city hustle. The table below gives a comparison of the performance of the NMA serviced office sector;
|
(All values in Kshs Unless Stated Otherwise) |
||||||
|
Cytonn Report: Nairobi Metropolitan Area Serviced Office Performance |
||||||
|
Location |
Revenue Per SQFT 2021 |
Revenue Per SQFT 2022 |
Serviced Offices Revenue growth (%) |
Unserviced Offices Revenue growth (%) |
||
|
Serviced Offices |
Un-serviced Offices |
Serviced Offices |
Un-serviced Offices |
|||
|
Westlands |
212 |
104 |
220 |
108 |
3.8% |
3.5% |
|
Karen |
192 |
106 |
199 |
111 |
3.5% |
4.3% |
|
Parklands |
169 |
91 |
171 |
91 |
1.3% |
(0.2%) |
|
Gigiri |
- |
119 |
210 |
118 |
- |
(0.8%) |
|
Upperhill |
235 |
94 |
243 |
97 |
3.1% |
3.1% |
|
Kilimani |
194 |
91 |
199 |
92 |
2.4% |
1.1% |
|
Nairobi CBD |
164 |
82 |
168 |
83 |
2.1% |
1.7% |
|
Msa Rd |
- |
73 |
- |
71 |
- |
(2.4%) |
|
Thika Rd |
112 |
79 |
110 |
79 |
(2.3%) |
(0.5%) |
|
Average |
183 |
93 |
190 |
94 |
2.0% |
1.1% |
Source: Cytonn Research
Notably, in 2022, there was a growing trend in the establishment of niche centric office spaces in Kenya, most especially co-working spaces. In support of this, Nairobi Garage, a leading provider of flexible working spaces in Nairobi opened a 12,000 SQFT outlet in the Central Business District (CBD) along Mama Ngina street. This move by the co-working space provider increased its number of outlets to five, with locations in Westlands, Spring Valley, Kilimani and Karen. Furthermore, Kofisi Africa, a leading pan African provider of flexible and bespoke workplaces, opened a new branch dubbed ‘Kofisi Square’ located in Riverside, Nairobi. The new 50,000 SQFT outlet is its sixth branch in Nairobi, with branches in Karen, Riverside and Westlands. In addition to the Nairobi locations, Kofisi Africa also has branches in Nigeria, Ghana, Dar-es-Salaam, Johannesburg and Cairo. We expect to see an increase in the development of more co-working spaces, as the sector currently only constitutes less than 3.0% of the total available office stock. The table below highlights major co-working office spaces released into the market in 2022;
|
Cytonn Report: Notable Co-working Space Office Developments delivered in 2022 |
||||
|
# |
Space provider |
Office Name |
Location |
Size (SQFT) |
|
1 |
Nairobi Garage |
Nairobi Garage CBD |
CBD, Nairobi |
12,000 |
|
2 |
Kofisi Africa |
Kofisi Square |
Riverside |
50,000 |
|
|
Total |
|
|
62,000 |
Source: Cytonn Research, Knight Frank
Section IV: Office Market Outlook and the Investment Opportunity in the Sector
Based on the office market supply, demand, performance, and investor returns, we have a NEUTRAL outlook for the commercial office sector theme in Nairobi Metropolitan Area (NMA) mainly due to the 5.8 mn SQFT oversupply of space with reduction in incoming new supply at 0.3 mn SQFT. However, with most firms and business fully embarking to working from the office amidst the improved economic environment in post COVID-19 and post-electioneering periods, we expect that this will cushion the performance of the sector. The table below summarizes our outlook on the sector based on the various key driving factors.
|
Cytonn Report: Nairobi Metropolitan Area (NMA) Commercial Office Outlook |
||||
|
Measure |
2021 Sentiment |
2022 Sentiment and 2023 Outlook |
2022 Review |
2023 Outlook |
|
Supply |
The sector recorded an oversupply of 6.7 mn SQFT of office space in 2021, an 8.3% decrease from the 7.3 mn SQFT realized in 2020 in NMA. This was due to increased demand of physical office spaces as some firms resumed full operations and others adjusted to hybrid model of working both in physical offices and at home. The incoming supply in 2021 came at 0.5 mn SQFT 37.5% lower than the 0.8 mn SQFT recorded in 2020. |
The oversupply of commercial office space declined by 13.4% to approximately 5.8 mn SQFT in 2022 from approximately 6.7 mn SQFT in 2021, attributed to increased demand for office spaces which in turn increased the occupancy rates by 1.8% points to 79.4% in 2022 from 77.6% in 2021 at the back of continuous recovery of economy in post-COVID-19 period. This is as most corporate organizations and businesses reverted to full operations and use of physical spaces. The incoming supply in 2022 came at 0.6 mn SQFT 20.0% higher than the 0.5 mn SQFT recorded in 2021. We expect the office space oversupply to remain unchanged at approximately 5.8 mn SQFT in 2023, attributable to an expected reduction in vacancy rates by 0.9% to 19.7% from 20.6% in 2022, and increase in occupied stock by 0.3% to 29.8 mn SQFT from 29.7 mn SQFT in 2022 even though there will be an expected new supply of 0.3 mn SQFT in the market. |
Neutral |
Neutral |
|
Demand |
There was an increased demand for office spaces, evidenced by the 0.1% increase in the average occupancy rates which came in at 77.6% in 2021, from the 77.7% recorded in 2020. This was mainly attributed to full resumptions of operations of corporate organisations and businesses after the lifting of COVID-19 containment measures. Additionally, the absorption of office spaces increased to 0.4 mn SQFT in 2021 from (1.0) mn SQFT recorded in 2020 |
There was an increased demand for office spaces in the NMA, evidenced by the 1.8% increase in the average occupancy rates which came in at 79.4% in 2022 from 77.6% recorded in 2021. This was mainly attributed to as a result of a slow but rising demand for physical space on the back of various firms resuming full operations, coupled with the expansion strategy by various firms such as Call Centre International (CCI) Group and rising trend in serviced office spaces spearheaded by firms like Nairobi Garage, Kofisi, and Regus. In addition to this, the absorption of office spaces increased by 150.0% to 1.0 mn SQFT in 2022 from 0.4 mn SQFT recorded in 2021 attributed to further increase of occupation of physical unserviced and serviced spaces at the back of full operations of businesses and organisations. We expect the occupancy rates to improve mainly attributed to resumption of working from office policies by most companies and reduced developments expected to enter the market in 2023 as compared to 2022. We these factors, we expect will potentially boost absorption rates by 10.0% to 1.1 mn SQFT in 2023, |
Positive |
Positive |
|
Office Market Performance |
The commercial office sector performance realized a slight improvement in its overall performance in FY’2021, with the average rental yields coming in at 7.3%, 0.3% points higher than 2020 which recorded 7.0%. The average occupancy rates also increased by 0.1% to 77.6%, from 77.7% recorded in 2020. The improvement in performance was mainly driven by an improved business environment following the lifting of the COVID-19 containment measures, as well as some businesses resuming full operations hence boosting the occupancy rates. However, the 6.7 mn SQFT oversupply in office spaces weighed down the performance of the sector in 2021 due to uncertainty occasioned by incoming general elections which slowed down business operations by most organisations. |
The average rental yield improved by 0.3% points to 7.6% in FY’2022 from 7.3% recorded in FY’2021, due to improved occupancy and rental rates. Average asking rents per SQFT in the NMA increased by 2.1% to Kshs 96 per SQFT from Kshs 94, owing to increased supply of Grade A offices fetching higher rents such as Karen Green and Global Trade Centre (GTC) Office Tower, among others. The overall occupancy rates increased by 1.8% points to 79.4% from 77.6% as a result of a slow but rising demand for physical space on the back of various firms resuming full operations, coupled with the expansion strategy by various firms such as Nairobi Garage and Call Centre International (CCI) Group. We expect sector performance to slightly record a positive increase in rental yields by 0.1% points to 7.7% in 2023 attributable to: i) increased trend in serviced office spaces, ii) slow but rising expansion in the sector after the peaceful general elections in 2022 and continuous traction of the economy towards pre-COVID-19 levels, and, iii) reduced developments in the pipeline which we expect will help curb the oversupply challenge and improving the absorption rates of available and fewer incoming spaces. We expect that this will boost occupancy rates and asking rents thereby improving average rental yields. However, the expected oversupply of office spaces at 5.8 mn SQFT in the NMA is expected to weigh down optimum performance of the sector by crippling the overall demand for physical space. |
Neutral |
Neutral |
We expect a neutral performance in 2023 unchanged from 2022. The sector will be mainly supported by the full resumption of operations by most firms and businesses at the back of improved economy from a peaceful electioneering period of 2022 and adjusting tractions towards pre-COVID-19 performance in the sector. We also expect increased uptake of the serviced office spaces which will potentially improve occupancy rates in the sector as more co-working space firms enter the market such as Regus, Kofisi, Office.co and many more. The increased evolution in the serviced spaces and competition by firms offering co-working space services have led to more creative ideas and diversification in use of vacant spaces such as niche-centred office spaces which are tailored according to specific genders, professions, mindsets, needs or shared interests of clients. However, the persisting oversupply of office spaces currently at 5.8 mn SQFT is expected to weigh down the overall occupancy rates and yields of the sector. Investment opportunity lies in Gigiri, Westlands and Karen supported by relatively low supply of office spaces, and high returns of 8.7%, 8.3%, and 8.3%, respectively, compared to the market average of 7.6%, as at FY’2022. For the full Commercial Office Report 2023, click here.
Disclaimer: The views expressed in this publication are those of the writers where particulars are not warranted. This publication, which is in compliance with Section 2 of the Capital Markets Authority Act Cap 485A, is meant for general information only and is not a warranty, representation, advice or solicitation of any nature. Readers are advised in all circumstances to seek the advice of a registered investment advisor

- Talk to us
- Kenya
- P.O Box 20695 - 00200, Nairobi, Kenya
- Cell +254709101200
- Tel +254709101200
- WhatsApp +254741676635
- United States
- +254709101200
- DOWNLOAD OUR APP
-


- Kenya
- 8th Floor, Pinetree Plaza, Kaburu Drive, Ngong Road, Nairobi, Kenya
- USA
- Suite 1150, 1775 Eye Street NW, USA, Washington DC 20006, USA
- Investments
- High Yield
- Private Equity
- Real Estate
- Real Estate
- RiverRun Estates
- Cytonn Towers
- The Ridge
- Taraji Heights
- The Alma