Nairobi Metropolitan Area (NMA) Infrastructure Report 2021, & Cytonn Weekly #51/2021
By Research Team, Dec 26, 2021
Executive Summary
Fixed Income
During the week, T-bills remained undersubscribed, with the overall subscription rate coming in at 26.6%, down from 87.4% recorded the previous week, partly attributable to the tightened liquidity in the money market due to tax remittances, with the average interbank rate increasing to 5.5%, from 4.5% recorded the previous week. The 364-day paper recorded the highest subscription rate, receiving bids worth Kshs 3.9 bn against the offered Kshs 10.0 bn, translating to a subscription rate of 40.0%, a decline from the 52.3% recorded the previous week. The yields on the 182-day and 364-day papers increased by 0.5 bps and 10.1 bps to 8.0% and 9.3%, respectively, while the yield on the 91-day paper declined marginally by 0.1 bps to 7.3%;
In the Primary Bond Market, the government reopened three bonds, FXD1/2020/5, FXD2/2018/10 and FXD1/2021/20, with effective tenors of 3.4 years, 7.0 years, and 19.7 years, respectively, in a bid to raise Kshs 30.0 bn for budgetary support. The period of sale for the issue runs from 20th December 2021 to 4th January 2022 for FXD1/2020/5, while the period of sale for FXD2/2018/10 and FXD1/2021/20 runs from 20th December 2021 to 18th January 2022;
We are projecting the y/y inflation rate for December 2021 to fall within the range of 5.7% - 6.1%, compared to 5.8% recorded in November 2021, mainly driven by the recent stabilization of fuel prices which are a major contributor to the headline inflation;
Equities
During the week, the equities market was on an upward trajectory, with NASI, NSE 20 and NSE 25 gaining by 4.8%, 2.5%, and 4.6%, respectively, taking their YTD performance to gains of 12.2%, 1.6% and 10.3% for NASI, NSE 20 and NSE 25, respectively. The equities market performance was driven by gains recorded by large cap stocks such as EABL, Safaricom and Bamburi of 13.3%, 5.4% and 4.4%, respectively. Additionally, the gains recorded in the equities market during the week are attributable to increased buying activity from local institutional investors as they rebalance their portfolios for the end of the year. The gains were however weighed down by a marginal 0.3% loss recorded by Equity group;
Real Estate
During the week, Kenya National Bureau of Statistics (KNBS) released the October 2021 Leading Economic Indicators Report, highlighting that the total number of visitors arriving through Jomo Kenyatta (JKIA) and Moi International Airports (MIA) increased by 3.6% to 72,809 visitors in October 2021, from 70,300 visitors in September 2021. In the Retail sector, Rhapta Square Shopping Mall along Rhapta Road in Westlands began operations. For Mixed-Use Developments, President Uhuru Kenyatta, officially opened the Global Trade Center (GTC) Office Tower located along Waiyaki Way in Westlands. In the hospitality sector, Actis Limited, a Private Equity Firm announced the completion of the acquisition of Fairview Hotel and Town Lodge Hotel both located at Bishop Road Upperhill, and, City Lodge Hotel in Two Rivers, Runda at a cost of Kshs 1.0 bn. In the infrastructure sector, the Japanese Government through the United Nations Development Program (UNDP), announced a Kshs 24.0 mn funding for the reopening of Chesogon Road linking the areas of Sigor and Marakwet, in West Pokot and Elgeyo-Marakwet counties. In the Listed Real Estate, Fahari I-REIT, declined by 2.1% to close at Kshs 6.5 per share, compared to Kshs 6.6 per share recorded the previous week;
Focus of the Week
Given that infrastructure is a vital necessity for a country’s development and growth, the Kenyan Government has been aggressively supporting and implementing the same as part of its efforts towards positioning Kenya as a regional hub in Africa in line with Kenya Vision 2030. Nairobi city and its environs in particular have been experiencing massive infrastructural developments aimed at improving economic productivity. Therefore, this week we update our Nairobi Metropolitan Area (NMA) Infrastructure Report 2019 report by highlighting the state of infrastructure in the Nairobi Metropolitan Area, ongoing infrastructural projects, and as well as identifying the potential areas for Real Estate investment;
Investment Updates:
- Weekly Rates:
- Cytonn Money Market Fund closed the week at a yield of 10.52%. To invest, dial *809#;
- Cytonn High Yield Fund closed the week at a yield of 14.04% p.a. To invest, email us at sales@cytonn.com and to withdraw the interest, dial *809#;
- We shall continue to offer Wealth Management Training Monday through Saturday, from 9:00 am to 11:00 am, through our Cytonn Foundation as from the new year. The training aims to grow financial literacy among the general public. To register for any of our Wealth Management Trainings, click here;
- If interested in our Private Wealth Management Training for your employees or investment group, please get in touch with us through wmt@cytonn.com;
- Any CHYS and CPN investors still looking to convert is welcome to consider one of the five projects currently available for conversion, click here for the latest conversion term sheet;
- Cytonn Insurance Agency acts as an intermediary for those looking to secure their assets and loved ones’ future through insurance namely; Motor, Medical, Life, Property, WIBA, Credit and Fire and Burglary insurance covers. For assistance, get in touch with us through insuranceagency@cytonn.com;
- Cytonnaire Savings and Credit Co-operative Society Limited (SACCO) provides a savings and investments avenue to help you in your financial planning journey. To enjoy competitive investment returns, kindly get in touch with us through clientservices@cytonn.com;
Real Estate Updates:
- For an exclusive tour of Cytonn’s Real Estate developments, visit: Sharp Investor's Tour, and for more information, email us at sales@cytonn.com;
- Phase 3 of The Alma is now ready for occupation. To rent, please email properties@cytonn.com;
- We have 8 investment-ready projects, offering attractive development and buyer targeted returns. See further details here: Summary of Investment-ready Projects;
- For recent news about the group, see our news section here;
Hospitality Updates:
- We currently have promotions for Staycations. Visit cysuites.com/offers for details or email us at sales@cysuites.com;
- Share a meal with a friend during the Sunday Brunch at The Hive Restaurant at Cysuites Hotel and Apartment. Every Sunday from 11.00 AM to 4.00 PM at a price of Kshs 2,500 for Adults and Kshs 1,500 for children under 12 years;
Money Markets, T-Bills Primary Auction:
During the week, T-bills remained undersubscribed, with the overall subscription rate coming in at 26.6%, down from 87.4% recorded the previous week, partly attributable to the tightened liquidity in the money market due to tax remittances, with the average interbank rate increasing to 5.5%, from 4.5% recorded the previous week. The 364-day paper recorded the highest subscription rate, receiving bids worth Kshs 3.9 bn against the offered Kshs 10.0 bn, translating to a subscription rate of 40.0%, a decline from the 52.3% recorded the previous week. The subscription rate for the 91-day and 182-day papers decreased to 39.8% and 8.0%, from 113.3% and 112.2%, respectively. The yields on the 182-day and 364-day papers increased by 0.5 bps and 10.1 bps to 8.0% and 9.3%, respectively, while the yield on the 91-day paper declined marginally by 0.1 bps to 7.3%. The government accepted all the Kshs 6.4 bn worth of bids received, translating to an acceptance rate of 100.0%.
In the Primary Bond Market, the government reopened three bonds, FXD1/2020/5, FXD2/2018/10 and FXD1/2021/20, with effective tenors of 3.4 years, 7.0 years and 19.7 years, respectively, in a bid to raise Kshs 30.0 bn for budgetary support. The period of sale for the issue runs from 20th December 2021 to 4th January 2022 for FXD1/2020/5, while the period of sale for FXD2/2018/10 and FXD1/2021/20 runs from 20th December 2021 to 18th January 2022. The coupon rates are 11.7%, 12.5% and 13.4% for FXD1/2020/5, FXD2/2018/10 and FXD1/2021/20, respectively. We expect investors to prefer the longer dated paper, FXD1/2021/20, as they search for higher yields. The bonds are currently trading in the secondary market at yields of 10.8%, 12.2% and 13.3%, for FXD1/2020/5, FXD2/2018/10 and FXD1/2021/20, respectively, and as such, our recommended bidding range for the three bonds is: 10.6%-11.0% for FXD1/2020/5, 12.0%-12.4% for FXD2/2018/10 and 13.1%-13.5% for FXD1/2021/20 within which bonds of a similar tenor are trading at.
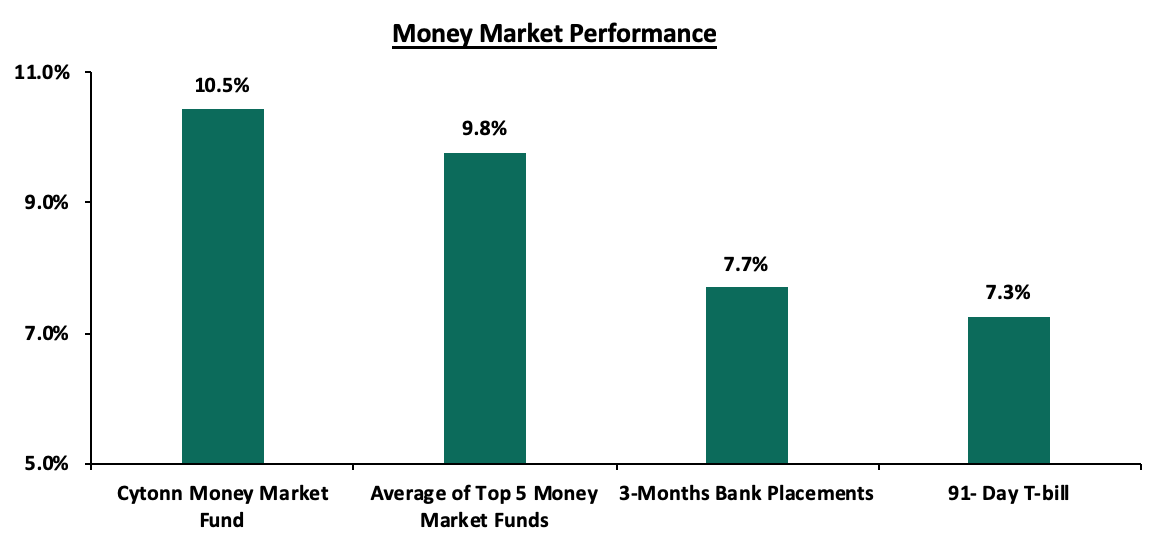
In the money markets, 3-month bank placements ended the week at 7.7% (based on what we have been offered by various banks), while the yield on the 91-day T-bill decreased by 0.1 bps to 7.3%. The average yield of the Top 5 Money Market Funds remained unchanged at 9.8%, while the yield on the Cytonn Money Market Fund increased by 0.1% points to 10.5%, from 10.4% recorded the previous week.
The table below shows the Money Market Fund Yields for Kenyan Fund Managers as published on 24th December:
|
|
Money Market Fund Yield for Fund Managers as published on 24th December 2021 |
|
|
Rank |
Fund Manager |
Effective Annual Rate |
|
1 |
Cytonn Money Market Fund |
10.5% |
|
2 |
Zimele Money Market Fund |
9.9% |
|
3 |
Nabo Africa Money Market Fund |
9.7% |
|
4 |
Sanlam Money Market Fund |
9.5% |
|
5 |
CIC Money Market Fund |
9.3% |
|
6 |
Madison Money Market Fund |
9.1% |
|
7 |
Apollo Money Market Fund |
9.0% |
|
8 |
GenCapHela Imara Money Market Fund |
8.9% |
|
9 |
Co-op Money Market Fund |
8.7% |
|
10 |
Dry Associates Money Market Fund |
8.6% |
|
11 |
British-American Money Market Fund |
8.5% |
|
12 |
Orient Kasha Money Market Fund |
8.4% |
|
13 |
NCBA Money Market Fund |
8.3% |
|
14 |
ICEA Lion Money Market Fund |
8.3% |
|
15 |
AA Kenya Shillings Fund |
7.4% |
|
16 |
Old Mutual Money Market Fund |
7.3% |
Source: Business Daily
Liquidity:
During the week, liquidity in the money markets tightened, with the average interbank rate increasing by 1.0% point to 5.5% from the 4.5% recorded the previous week, partly attributable to banks trading cautiously in the interbank market as they try to meet their end of month obligations especially during this festive period and the tax remittances. The average interbank volumes traded declined by 39.9% to Kshs 11.5 bn, from Kshs 19.2 bn recorded the previous week.
Kenya Eurobonds:
During the week, the yields on the Eurobonds recorded mixed performance, with yields on the 10-year bond issued in 2014 increasing by 0.2% points to 4.6%, from 4.4% recorded the previous week, while the 7-year bond issued in 2019 decreased by 0.1% points to 5.7%, from 5.8% recorded the previous week. The yields on the 10-year bond issued in 2018, 30-year bond issued in 2018, 12-year bond issued in 2019 and the 12-year bond issued in 2021, all remained unchanged at 5.9%, 8.2%, 6.8% and 6.7%, respectively. Below is a summary of the performance:
|
Kenya Eurobond Performance |
||||||
|
|
2014 |
2018 |
2019 |
2021 |
||
|
Date |
10-year issue |
10-year issue |
30-year issue |
7-year issue |
12-year issue |
12-year issue |
|
31-Dec-20 |
3.9% |
5.2% |
7.0% |
4.9% |
5.9% |
- |
|
30-Nov-21 |
4.4% |
6.2% |
8.4% |
6.0% |
7.1% |
7.0% |
|
17-Dec-21 |
4.4% |
5.9% |
8.2% |
5.8% |
6.8% |
6.7% |
|
20-Dec-21 |
4.4% |
6.0% |
8.2% |
5.9% |
6.8% |
6.7% |
|
21-Dec-21 |
4.6% |
6.0% |
8.2% |
5.8% |
6.9% |
6.7% |
|
22-Dec-21 |
4.6% |
6.0% |
8.2% |
5.8% |
6.8% |
6.7% |
|
23-Dec-21 |
4.6% |
5.9% |
8.2% |
5.7% |
6.8% |
6.7% |
|
Weekly Change |
0.2% |
0.0% |
0.0% |
(0.1%) |
0.0% |
0.0% |
|
MTD Change |
0.2% |
(0.2%) |
(0.1%) |
(0.2%) |
(0.3%) |
(0.2%) |
|
YTD Change |
0.7% |
0.7% |
1.2% |
0.8% |
0.9% |
- |
Kenya Shilling:
During the week, the Kenyan shilling depreciated marginally by 0.1% against the US dollar to close the week at Kshs 113.1, from Kshs 113.0 recorded the previous week, mainly attributable to increased dollar demand from the general merchandise importers. Key to note, this is the lowest the Kenyan shilling has ever depreciated against the dollar. On a YTD basis, the shilling has depreciated by 3.6% against the dollar, in comparison to the 7.7% depreciation recorded in 2020. We expect the shilling to remain under pressure for the remainder of 2021 as a result of:
- Rising uncertainties in the global market due to the Coronavirus pandemic, which has seen investors continue to prefer holding their investments in dollars and other hard currencies and commodities,
- Increased demand from merchandise traders as they beef up their hard currency positions in anticipation for more trading partners reopening their economies globally,
- Widening current account deficit which stood at 5.4% of GDP in the 12-months to October 2021 compared to the 4.8% of GDP in the 12 months to October 2020 attributable to a higher import bill which offset increased receipts from agricultural and services exports and remittances, and,
- Rising global crude oil prices on the back of supply constraints at a time when demand is picking up with the easing of COVID-19 restrictions and as economies reopen. Key to note, risks abound this global recovery following the emergence of the new COVID-19 Omicron variant. We are of the view that should the variant continue to spread; most nations will respond swiftly by adopting stringent containment measures to curb the spread.
The shilling is however expected to be supported by:
- High Forex reserves, currently at USD 8.6 bn (equivalent to 5.2-months of import cover), which is above the statutory requirement of maintaining at least 4.0-months of import cover, and the EAC region’s convergence criteria of 4.5-months of import cover. Key to note, the forex reserves have been steadily declining and are currently at a 3-month low. In addition, the reserves were boosted by the USD 1.0 bn proceeds from the Eurobond issued in July, 2021 coupled with the USD 407.0 mn IMF disbursement and the USD 130.0 mn World Bank loan financing received in June 2021, and,
- Improving diaspora remittances evidenced by a 24.2% y/y increase to USD 320.1 mn in November 2021, from USD 257.7 mn recorded over the same period in 2020, which has continued to cushion the shilling against further depreciation.
Weekly Highlight:
- December Inflation projections
We are projecting the y/y inflation rate for December 2021 to fall within the range of 5.7% - 6.1%. The key drivers include:
- Fuel prices for the period 15th December 2021 to 14th January 2022 remained unchanged at Kshs 129.7 per litre for Super Petrol, Kshs 110.6 per litre for Diesel and Kshs 103.5 per litre for Kerosene. With fuel being a major contributor to Kenya's headline inflation, maintaining constant fuel prices is expected to have a muted impact on the inflation basket,
- Food prices have remained relatively stable during the month attributable to improved agricultural output due to the ongoing rains in some parts of the country, and,
- The foreign exchange fluctuation tariff for electricity usage remained relatively unchanged at Kshs 73.1 cents per Kilowatt hour (KWh) in December, from Kshs 73.0 cents per Kilowatt hour (KWh) in November 2021. However, the fuel cost charge on electricity bills increased by 10.0% to Kshs 4.6 per Kilowatt hour (KWh) in December, from Kshs 4.2 per Kilowatt hour (KWh) in November.
Going forward, we expect the inflation rate to remain within the government’s set range of 2.5% - 7.5%. However, concerns remain high on the widening trade deficit as global fuel prices continue to rise due to supply bottlenecks.
Rates in the fixed income market have remained relatively stable due to the tightened but sufficient levels of liquidity in the money markets. The government is 14.1% ahead of its prorated borrowing target of Kshs 329.3 bn having borrowed Kshs 375.7 bn of the Kshs 658.5 bn borrowing target for the FY’2021/2022. We expect a gradual economic recovery going into FY’2021/2022 as evidenced by KRAs collection of Kshs 740.0 bn in revenues during the first five months of the current fiscal year, which is equivalent to 100.0% of the prorated revenue collection target. However, despite the projected high budget deficit of 7.5% and the lower credit rating from S&P Global to 'B' from 'B+', we believe that the support from the IMF and World Bank will mean that the interest rate environment will remain stable since the government is not desperate for cash.
Markets Performance
During the week, the equities market was on an upward trajectory, with NASI, NSE 20 and NSE 25 gaining by 4.8%, 2.5%, and 4.6%, respectively, taking their YTD performance to gains of 12.2%, 1.6% and 10.3% for NASI, NSE 20 and NSE 25, respectively. The equities market performance was driven by gains recorded by large cap stocks such as EABL, Safaricom and Bamburi of 13.3%, 5.4% and 4.4%, respectively. Additionally, the gains recorded in the equities market during the week are attributable to increased buying activity from local institutional investors as they rebalance their portfolios for the end of the year. The gains were however weighed down by a marginal 0.3% loss recorded by Equity group.
During the week, equities turnover declined by 25.4% to USD 15.3 mn, from USD 20.5 mn recorded the previous week, taking the YTD turnover to USD 1.2 bn. Foreign investors remained net sellers, with a net selling position of USD 5.6 mn, from a net selling position of USD 4.3 mn recorded the previous week, taking the YTD net selling position to USD 90.4 mn.
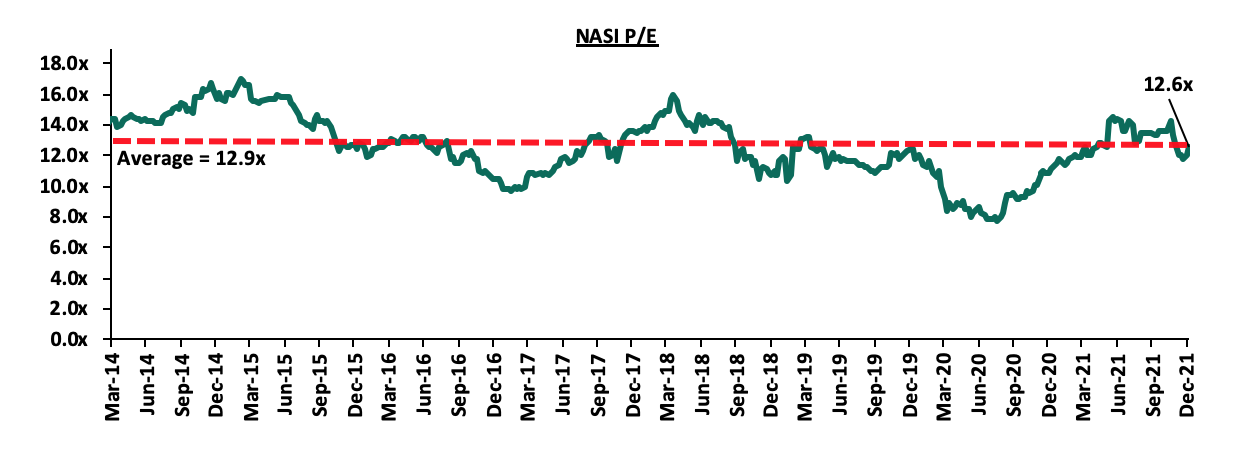
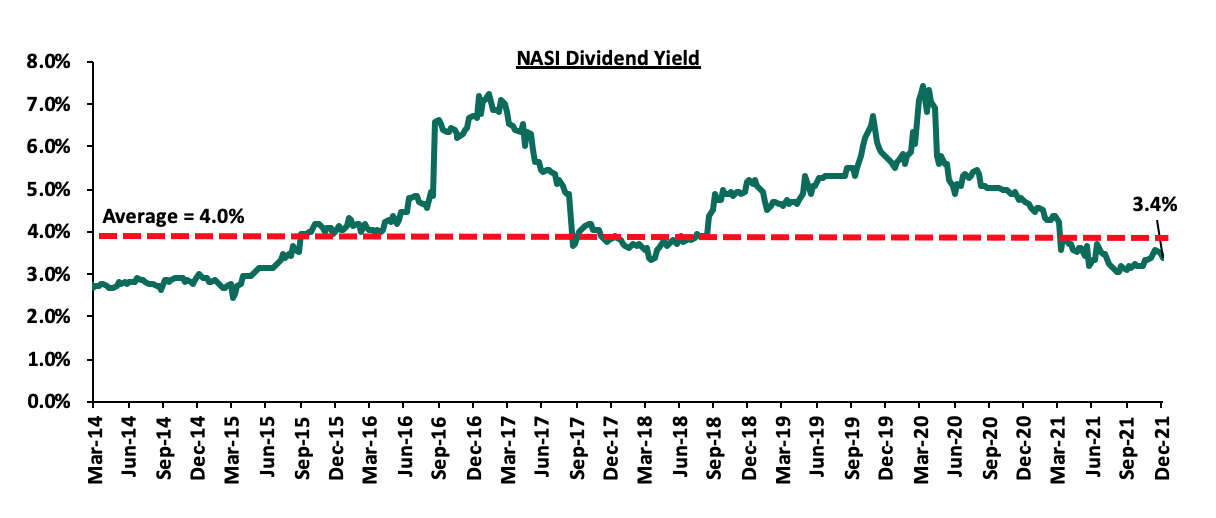
The market is currently trading at a price to earnings ratio (P/E) of 12.6x, 2.9% below the historical average of 12.9x, and a dividend yield of 3.4%, 0.6% points below the historical average of 4.0%. Key to note, NASI’s PEG ratio currently stands at 1.4x, an indication that the market is trading at a premium to its future earnings growth. Basically, a PEG ratio greater than 1.0x indicates the market may be overvalued while a PEG ratio less than 1.0x indicates that the market is undervalued. The current P/E valuation of 12.6x is 63.0% above the most recent trough valuation of 7.7x experienced in the first week of August 2020. The charts below indicate the historical P/E and dividend yields of the market.
Universe of coverage:
|
Company |
Price as at 17/12/2021 |
Price as at 24/12/2021 |
w/w change |
YTD Change |
Year Open 2021 |
Target Price* |
Dividend Yield |
Upside/ Downside** |
P/TBv Multiple |
Recommendation |
|
Kenya Reinsurance |
2.2 |
2.3 |
3.2% |
(0.9%) |
2.3 |
3.3 |
8.7% |
53.6% |
0.2x |
Buy |
|
I&M Group*** |
20.8 |
21.5 |
3.4% |
(52.1%) |
44.9 |
24.4 |
10.5% |
23.9% |
0.6x |
Buy |
|
Jubilee Holdings |
329.8 |
310.3 |
(5.9%) |
12.5% |
275.8 |
371.5 |
2.9% |
22.6% |
0.6x |
Buy |
|
Britam |
7.1 |
7.0 |
(0.8%) |
0.6% |
7.0 |
8.3 |
0.0% |
18.5% |
1.2x |
Accumulate |
|
KCB Group*** |
44.1 |
45.2 |
2.5% |
17.7% |
38.4 |
51.4 |
2.2% |
15.8% |
0.9x |
Accumulate |
|
Standard Chartered*** |
126.5 |
128.0 |
1.2% |
(11.4%) |
144.5 |
137.7 |
8.2% |
15.8% |
1.0x |
Accumulate |
|
Co-op Bank*** |
12.3 |
12.5 |
1.2% |
(0.8%) |
12.6 |
13.1 |
8.0% |
12.9% |
0.9x |
Accumulate |
|
Liberty Holdings |
7.2 |
7.0 |
(2.8%) |
(8.6%) |
7.7 |
7.8 |
0.0% |
10.5% |
0.5x |
Accumulate |
|
Equity Group*** |
48.7 |
48.5 |
(0.3%) |
33.8% |
36.3 |
52.5 |
0.0% |
8.3% |
1.3x |
Hold |
|
NCBA*** |
25.1 |
25.8 |
2.8% |
(3.2%) |
26.6 |
26.4 |
5.8% |
8.3% |
0.6x |
Hold |
|
Stanbic Holdings |
92.5 |
92.0 |
(0.5%) |
8.2% |
85.0 |
94.7 |
4.1% |
7.1% |
0.8x |
Hold |
|
Sanlam |
11.5 |
11.6 |
0.4% |
(11.2%) |
13.0 |
12.1 |
0.0% |
4.8% |
1.2x |
Lighten |
|
Diamond Trust Bank*** |
57.0 |
59.5 |
4.4% |
(22.5%) |
76.8 |
61.8 |
0.0% |
3.8% |
0.3x |
Lighten |
|
ABSA Bank*** |
11.2 |
11.6 |
3.1% |
21.3% |
9.5 |
11.9 |
0.0% |
3.0% |
1.2x |
Lighten |
|
CIC Group |
2.1 |
2.2 |
2.8% |
4.3% |
2.1 |
2.0 |
0.0% |
(7.1%) |
0.8x |
Sell |
|
HF Group |
3.7 |
3.9 |
4.3% |
24.2% |
3.1 |
3.0 |
0.0% |
(24.3%) |
0.2x |
Sell |
|
*Target Price as per Cytonn Analyst estimates **Upside/ (Downside) is adjusted for Dividend Yield ***For Disclosure, these are stocks in which Cytonn and/or its affiliates are invested in Key to note, I&M Holdings YTD share price change is mainly attributable to the counter trading ex-bonus issue |
||||||||||
We are “Neutral” on the Equities markets in the short term. With the market currently trading at a premium to its future growth (PEG Ratio at 1.4x), we believe that investors should reposition towards companies with a strong earnings growth and are trading at discounts to their intrinsic value. We expect the discovery of new COVID-19 variants coupled with slow vaccine rollout in developing economies to continue weighing down the economic outlook. On the upside, we believe that the recent relaxation of lockdown measures in the country will lead to improved investor sentiments in the economy.
- Industry Report
During the week, Kenya National Bureau of Statistics (KNBS) released the October 2021 Leading Economic Indicators Report. The report, which is released monthly, shows the performance of major economic indicators such as international arrivals and cement consumption. The key highlights related to the Real Estate sector include;
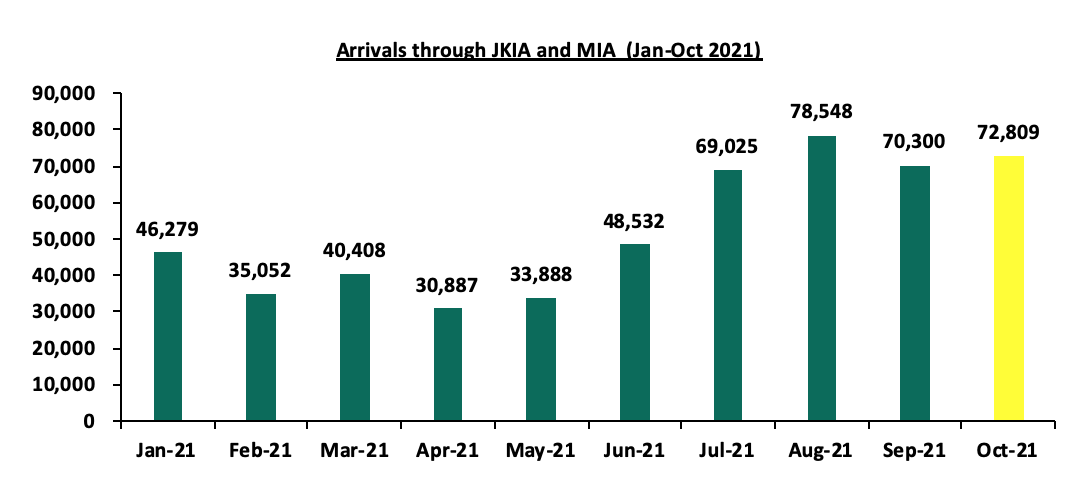
- The total number of visitors arriving through Jomo Kenyatta (JKIA) and Moi International Airports (MIA) increased by 3.6% to 72,809 persons in October, from 70,300 persons in September 2021. Notably, the number of passengers arriving through the two airports has been increasing over the last six months to 72,809, from 30,887 recorded in April 2021, with a 10.5% decline between August and September. The increase was attributable to; i) the massive COVID-19 vaccination in the country, ii) aggressive local and international marketing through price discounts and the Magical Kenya Platform, and, iii) increased number of international flights resulting from the lifting of the COVID-19 restriction measures and travel bans.
The graph below indicates the number of visitors passing through JKIA and MIA between January and October 2021;
Source: Kenya National Bureau of Statistics
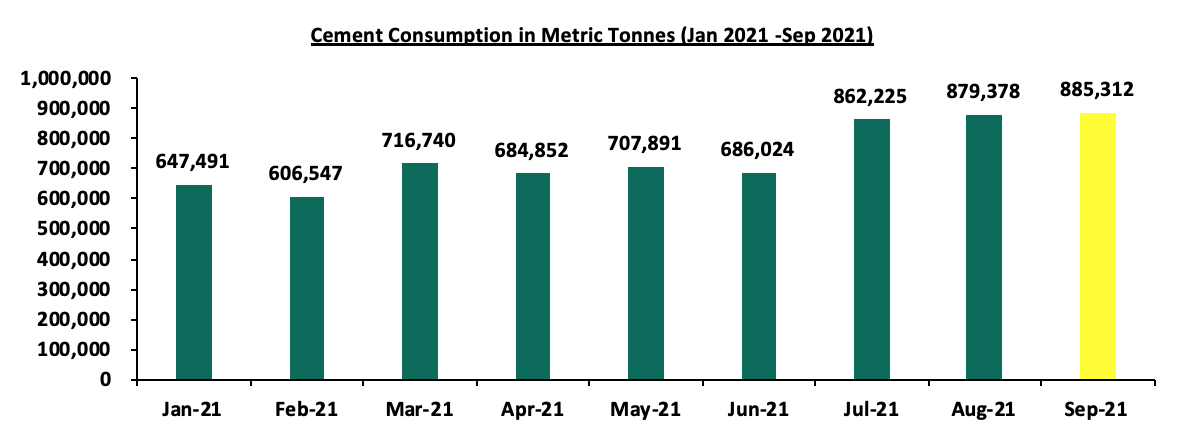
- Cement consumption increased by 0.7% to 885,312 metric tonnes in September 2021 from 879,378 metric tonnes in August 2021. The quantity of cement consumed also increased by 29.1% in the three months to September to 885,312, from 686,024 metric tonnes recorded in June 2021 attributable to the increase in infrastructural and housing developments in the country. Some of the major infrastructure projects in progress during this period include the Nairobi Express Way and the Nairobi Western Bypass which are now about 80.0% complete. For housing projects, some of the major government led still under construction include River Estate, Ngara and Pangani Housing projects.
The graph below shows cement consumption between January and September 2021;
Source: Kenya National Bureau of Statistics
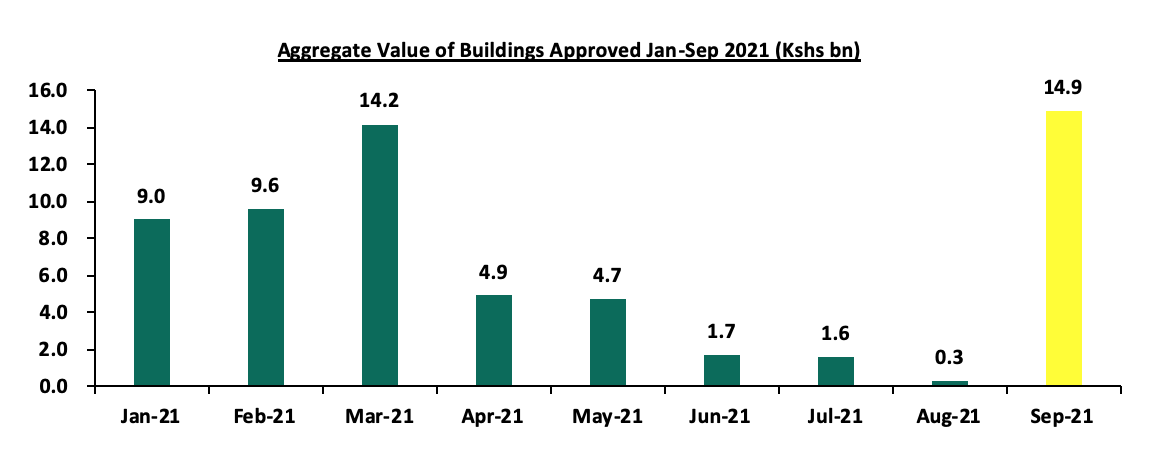
- The aggregate value of building plan approvals in the Nairobi City County increased by 5,125.8% to Kshs 14.9 bn in September, from Kshs 0.3 bn recorded in August 2021. This was majorly attributable to increased investments in the residential sector, whose value improved by 5,787.1% compared to a 4,253.2% increase in the value of non-residential buildings. The County Government has also been making huge efforts to reduce existing backlogs. The decline in aggregate value to Kshs 0.3 bn in August, from Kshs 14.2 bn in March was attributable to the low investments made in the Real Estate market due to sector uncertainties, oversupply in select themes leading to investors adopting a wait and see approach as they await absorption of the current supply and the frequent suspensions of the e-construction system due to hackings.
The graph below shows the aggregate value of buildings approved in Nairobi City County between January and September 2021;
Source: Kenya National Bureau of Statistics
The improvement in the number of visitors through JKIA and MIA is expected to continue being supported by the gradual recovery in the hospitality sector following the lifting of the COVID-19 containment measures. Cement consumption and the number of building approvals are also expected to improve due to increased economic activities supported by investor confidence in the Real Estate market and the ongoing infrastructure and housing developments. However, the emergence of new COVID-19 variants such as the Omicron variant continue to pose a risk on this recovery as stricter measures may be imposed in order to curb its spread.
- Retail Sector
During the week, Rhapta Square Shopping Mall along Rhapta Road in Westlands began operations. Rhapta Square will host key retail chains such as Optica Limited, a local eye wear retailer and Artcaffe’ Market. For Optica Limited, the outlet follows a series of other openings in different parts of the country in the last few months including Golden Life Mall in Nakuru, Corner House along Mama Ngina Street, Karatina Market in Nyeri, I&M branch tower in Kenyatta Avenue, United Mall in Kisumu and Highlands Mall in Eldoret, among others. For ArtCaffe’ this will be the second fully fledged food market, after opening a similar outlet in Kilieleshwa along Oloitoktok Road. The food market will feature a butchery, pantry, fresh produces and a wines and spirits joint occupying 8,000 SQFT in three floors. Artcaffé Market has also announced plans to open in new prime locations along Kiambu Road and in Gigiri. Other tenants also hosted on the Rhapta Square include Peak-a-boo Kids Shop, Goodlife Pharmacy, Diamond Trust Bank (DTB) among others. The retail chains’ decision to strategically invest in the area is attributable to;
- The need to increase geographical footprint and serve more clients in an aim to grow their brand and boost revenues,
- Enhanced accessibility and convenience of service to clients as the area is served by good roads such as Rhapta Road. The location will also have a link to the Nairobi Express Way which is 80.0% complete and expected to be opened in March 2022,
- The need to take on rival chains and compete favourably for market share. For example, Artcaffe’ with 50 outlets is taking on Java who are the leading coffee chain in the region with 70 outlets in Kenya.
In terms of performance, according to Cytonn Q3’2021 Markets Review Report, Westlands recorded a retail occupancy of 80.4%, which is 4.6% points higher than the market average occupancy of 75.8%. Therefore, the retailer has access to many potential clients transiting through the other retail businesses, whom they can reach through branding and marketing.
The table below shows the submarket performance of nodes in the Nairobi Metropolitan Area (NMA) in Q3’2021;
|
Summary NMA Submarket Retail Performance – Q3’2021 |
|||
|
Area |
Rent (Kshs)/SQFT Q3’2021 |
Occupancy % Q3’2021 |
Rental Yield Q3’ 2021 |
|
Westlands |
209 |
80.4% |
9.7% |
|
Karen |
214 |
80.8% |
9.4% |
|
Kilimani |
172 |
83.6% |
9.0% |
|
Ngong Road |
175 |
78.0% |
7.8% |
|
Kiambu road |
178 |
70.4% |
7.2% |
|
Thika Road |
158 |
74.2% |
6.7% |
|
Satellite towns |
138 |
72.2% |
6.1% |
|
Mombasa road |
136 |
70.5% |
6.0% |
|
Eastlands |
135 |
72.5% |
5.9% |
|
Average |
168 |
75.8% |
7.5% |
Source: Cytonn Research 2021
The continued expansions in the retail sector such as those by Optica Limited are expected to support the performance of the sector going forward. However, the performance of the retail sector is expected to be weighed down by the oversupply in the retail market at 3.0 mn SQFT in the Nairobi Metropolitan Area (NMA) and 1.7 mn SQFT in Kenya’s retail market, and, the rise of rival e-commerce shopping platforms which are slowly gaining traction and reducing the mainstream retailers’ market share.
- Mixed-Use Developments (MUDs)
During the week, President Uhuru Kenyatta, officially opened the Global Trade Center (GTC) Office Tower located along Waiyaki Way in Westlands. Global Trade Center is a Kshs 40.0 bn investment comprising of 6 towers has been developed by Avic International Real Estate from 2014. GTC Office Tower is now the tallest office tower in East Africa with a height 184 metres and comprising of 42 floors. The table below indicates a summary of the themes in GTC Mixed-Use Development.
|
Global Trade Centre (GTC) Mixed-Use Development Summary |
||
|
Theme |
Unit Coverage |
Size Range (Smallest-Largest Space Offered) |
|
GTC Residences |
28 Floors |
82-332 SQM |
|
Office Towers |
42 Floors |
239-1,600 SQM |
|
JW Marriot Hotel |
317 Guestrooms |
40-200 SQM |
|
51 Serviced Apartments |
||
|
GTC Boutique Mall |
7 subsectors including banks, catering, healthcare among others. |
11,529 SQM (Total Area) |
Source: GTC
The decision to invest in a mixed-use theme in Westlands was informed by the high average rental yield of 7.8%, 0.6% points higher that the market average of 7.2%, according to our Cytonn NMA MUDs Report 2021. The area is also served by a good road network including Waiyaki way and the now 80.0% complete Nairobi Express Way. Mixed-Use Developments recorded an average rental yield of 7.2% in 2021, 0.7% points higher than the respective single-use themes which recorded an average rental yield of 6.5% in the same period. The relatively better performance by MUDs compared to single-use developments was attributed to the prime locations mostly serving the high and growing middle income class, coupled with the concept’s convenience that incorporates working, shopping and living spaces. The table below shows the performance of Mixed-Use Developments by node in 2021;
(All Values in Kshs Unless Stated Otherwise)
|
Nairobi’s Mixed-Use Developments Market Performance by Nodes 2021 |
|||||||||||||
|
|
Retail Performance |
Commercial Office Performance |
Residential Performance |
|
|||||||||
|
Location |
Price/SQFT |
Rent/SQFT |
Occup. (%) |
Rental Yield (%) |
Price/ SQFT |
Rent/SQFT |
Occup. %) |
Rental Yield (%) |
Price/ SQM |
Rent/ SQM |
Annual Uptake % |
Rental Yield % |
Average MUD yield |
|
Karen |
23,333 |
196 |
86.7% |
8.8% |
13,233 |
117 |
85.0% |
9.0% |
|
|
|
|
8.7% |
|
Westlands |
15,833 |
173 |
70.8% |
9.5% |
12,892 |
110 |
71.7% |
7.3% |
211,525 |
1,226 |
15.6% |
7.0% |
7.8% |
|
Kilimani |
18,500 |
162 |
79.0% |
8.3% |
13,713 |
106 |
79.0% |
6.7% |
|
|
|
|
7.4% |
|
Mombasa Rd |
20,000 |
185 |
70.0% |
8.4% |
13,000 |
100 |
60.0% |
5.5% |
156,079 |
853 |
13.3% |
6.6% |
7.4% |
|
Thika Rd |
23,750 |
215 |
82.5% |
9.2% |
13,250 |
105 |
72.5% |
6.9% |
128,545 |
612 |
17.9% |
6.1% |
7.0% |
|
Upper Hill |
15,485 |
130 |
62.5% |
6.4% |
12,000 |
102 |
70.0% |
7.0% |
|
|
|
|
6.8% |
|
Eastlands |
20,000 |
124 |
75.0% |
5.5% |
12,000 |
80 |
62.5% |
5.0% |
72,072 |
360 |
10.0% |
4.2% |
5.1% |
|
Average |
18,759 |
170 |
75.9% |
8.4% |
12,924 |
106 |
73.6% |
7.1% |
142,055 |
763 |
15.0% |
6.0% |
7.2% |
|
*The average MUDs performance is based on areas where sampled projects exist |
|||||||||||||
Source: Cytonn Research 2021
We expect an increase in Mixed-Use Development investments due to the integration benefits such as easier access to amenities and services, residential and working spaces all in one location. The developments also offer better returns compared to single use themes.
- Hospitality Sector
During the week, Actis Limited, a Private Equity Firm announced the completion of the acquisition of Fairview Hotel and Town Lodge Hotel both located at Bishop Road Upperhill, and, City Lodge Hotel in Two Rivers, Runda at a cost of Kshs 1.0 bn. As highlighted in our Cytonn Weekly #41/2021, the three hotels owned by South Africa’s City Lodge Hotel Group were put up for sale in July 2021, together with Tanzanian City Lodge Hotel in Dar-es-Salaam, marking the exit of the Group portfolio in East African market after seven years of operation, citing losses and the need to boost liquidity in the remaining profitable hotels in South Africa, Botswana, Namibia and Mozambique. The move by Actis Limited to acquire the three hotels is strategic as the hospitality sector performance has been improving in the last few months attributable to an improved business environment, evidenced by increased number of hotels in operations and improved bed occupancy rates as analyzed in our Cytonn Weekly #49/2021.
- Infrastructure Sector
During the week, Japanese Government through the United Nations Development Program (UNDP), announced a Kshs 24.0 mn funding for the reopening of Chesogon Road linking the areas of Sigor and Marakwet, in West Pokot and Elgeyo-Marakwet Counties. The road which was abandoned by users two decades ago due to banditry attacks is expected to be in full operation by July 2022. Once complete, the road is expected to spur Real Estate through;
- Enhancing Accessibility- The road is expected to connect the remote areas of Sigor and Marakwet which will enhance both investor and supplier accessibility,
- Reducing Development Costs-Improving infrastructure relieves the burden of transport costs and delay costs that would have otherwise been incurred by developers or investors, and,
- Improving Returns through Increasing Property Prices – Presence of a good road network will boost economic activities in the two regions which will in turn attract more demand through increased population living and transiting through the areas.
Additionally, the government announced the completion of Berth II and III of the Lamu Port- South Sudan-Ethiopia-Transport (LAPSSET) project. The two berths will begin operations in the first quarter of 2022 after the acquisition of modern equipment such as cranes by the Kenya Ports Authority (KPA). The completion comes after the inauguration of Berth I in May 2021, and puts the total length developed at 1.5 Km. The three complete berths form phase I of the entire construction and they have been done at a cost of Kshs 40.0 bn by China Communication Construction Company (CCC). However, 20 berths are yet to be completed and this therefore translates to a 13.0% level of completion of the entire project. The LAPSSET corridor is a project that targets to link Kenya to South Sudan, Ethiopia and the middle belt of Africa. The 2,500.0 km project worth Kshs 2.5 tn kicked off in March 2012 as a Public-Private Partnership (PPP) project among Kenya, Ethiopia and South Sudan, and Development Bank of South Africa, European Union and African Development Bank.
Once the project is completed, it will enhance easier and faster transport of goods and also open up surrounding areas to trade and tourism activities, as well as boost property prices and investment opportunities such as construction of residential units within Lamu and its environs.
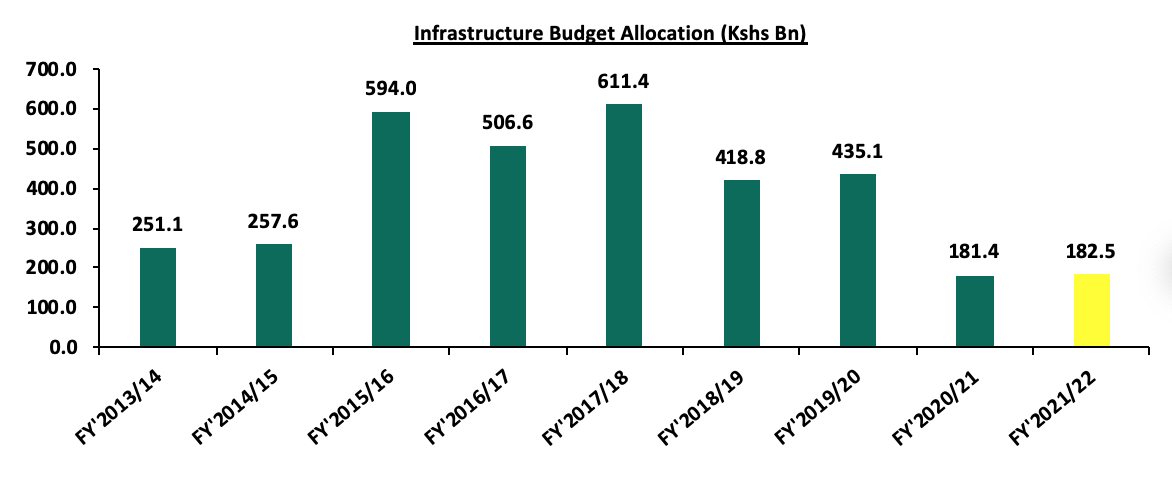
The government has continued to implement major infrastructure projects in the country with other projects such as the Nairobi Express Way and the Western Bypass, linking the towns of Kikuyu and Ruaka, at 80.0% completion. Infrastructure projects were allocated a total of Kshs 182.5 bn in the FY’2021/22 budget which the government has continued to fund through internal and external borrowing from countries such as China and Korea, in order to see all projects to completion.
The graph below shows the budget allocation to the infrastructure sector over last nine financial years;
Source: National Treasury of Kenya
We expect the government’s continued focus on completion of infrastructure developments and partnerships with organizations such as the UNDP to support the realization of the Vision 2030 Agenda on developing quality, safe and adequate roads. This is in an aim to make Kenya an intra-regional hub for trade in East Africa, and support Real Estate investments through accessibility.
- Listed REIT
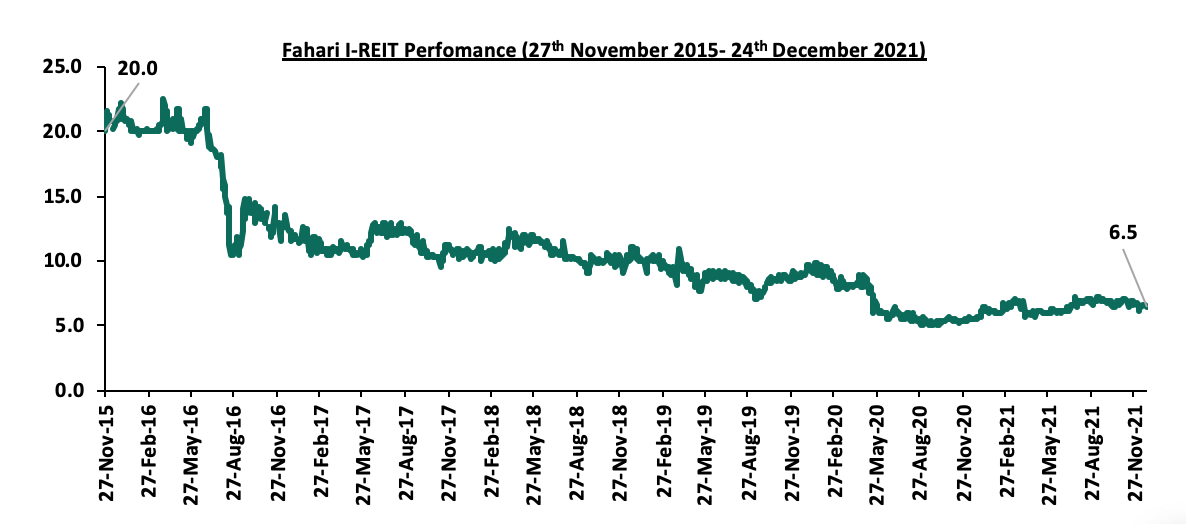
During the week, Fahari I-REIT declined by 2.1% to close at Kshs 6.5 per share compared to Kshs 6.6 per share recorded the previous week. On a YTD basis, the share price has gained by 14.9% from Kshs 5.6 recorded at the beginning of the year. However, on an Inception to Date (ITD) basis, the share price has declined by 67.6% compared to the listing price of Kshs 20.0 per share. The REIT market in Kenya has not picked momentum due to constraining factors such as the lack of general knowledge about the REIT market and products, high minimum investment amounts and the lengthy approval processes.
The graph below shows the performance of the Fahari I-REIT from 27th November 2015 - 24th December 2021;
Other Highlights;
During the week, the Two Rivers Lifestyle Center, the holding company of the Two Rivers Mall, announced the replacement of a Kshs 4.5 bn loan, which is part of the Kshs 10.9 bn existing loan, with a zero-interest equity-linked instrument, which will give investors ownership of the Centre and ease the company’s debt service burden. Key to note, the Two Rivers Lifestyle Centre is co-owned on a 50:50 basis by Old Mutual Properties and the Two Rivers Development Ltd. The Two Rivers Development is owned by the listed Centum Investment (58.0%), AVIC international (38.0%) and Kenya Development Corporation (4.0%). This is a strategy by Two Rivers Lifestyle Center to rebalance their debt and equity in order to ease interest payments. This is in line with the plans by Centum Investment to reduce finance costs and operating expenses to below 50.0% of investment income and have the rest used for dividend distribution and reinvestment. The restructuring of the loan is expected to save the company approximately Kshs 340.0 mn per annum in interest payments as well as increase cash flows in the Center.
Key to note, in FY’2021, Centum’s Two Rivers investment operations recorded a loss of Kshs 1.9 bn which contributed to the Kshs 2.3 bn loss recorded by Centum during the same period. However, in H1’2022, the listed Centum Investment reported a Kshs 425.4 mn operating profit, compared to the Kshs 479.2 mn operating loss recorded in H1’2021, mainly driven by the 206.6% increase in investment income to Kshs 1.0 bn, from Kshs 0.7 bn recorded in H1’2021, coupled with the 4.4% decline in finance costs to Kshs 0.3 bn, from Kshs 0.5 bn recorded in H1’2021. The conversion of the loan into a zero-interest equity-linked instrument will see Centum reduce its financing costs thus strengthening the company’s balance sheet by reducing its debt liability and consequently improving its working capital.
The table below shows the summary of different companies that have restructured their loans with the respective amounts;
|
No. |
Company |
Industry |
Amount under restructure (Kshs bn) |
|
1 |
Cytonn High Yield Solutions, CHYS |
Real Estate |
14.5 |
|
2 |
Centum Investment |
Real Estate |
4.5 |
Source: Online research
The Real Estate sector is expected to be supported by; i) improving business environment for the hospitality sector, ii) increased investments in the Real Estate market evidenced by the increase in cement consumption, iii) continued expansion in the retail sector, iv) preference for mixed-use developments over single themes, and, iv) the government’s continued focus to initiate partnerships and develop adequate infrastructure in the country.
In November 2019, we released the Nairobi Metropolitan Area (NMA) Infrastructure Report, which highlighted that approximately Kshs 717.1 bn was required to finance the construction of 463.4 Km of ongoing road projects in the NMA. Water and sewer coverage realized 0.2% and 0.1% points increase to 61.0% and 18.0% in 2018 from 59.0% and 17.0% in 2017, respectively. Since 2019, NMA’s infrastructure sector has witnessed more development activities. Currently, there are 939.6 Km ongoing construction and rehabilitation of road projects valued at Kshs 162.4 bn, whereas 99.7 Km road projects worth Kshs 4.3 bn have been completed so far in 2021, according to the Kenya Rural Roads Authority. Water and sewer network coverage both recorded 1.0% points increase to 55.8% and 19.0% in 2020, from 54.8% and 18.0%, respectively in 2019.
This week, we update our report by highlighting the state of infrastructure in the Nairobi Metropolitan Area, ongoing infrastructural projects, and as well as identifying the potential areas for Real Estate investment. Therefore, this topical will cover the following:
- Introduction,
- Factors Influencing the Infrastructure Sector in Kenya,
- The State of Infrastructure in the Nairobi Metropolitan Area,
- Impact of Infrastructure on Real Estate, and,
- Conclusion.
Section I: Introduction
Infrastructure refers to fundamental facilities and structures required by a country or an organization in order to function properly. They mainly involve production of public monopolies such as energy, communication systems, transport network, water systems, and, sewer and drainage systems. They are therefore of vital importance to the development and growth of an entity or a country. Additionally, presence of well-developed infrastructure also determines the performance of the Real Estate sector. For instance, the presence of transport systems in an area will facilitate ease of access to properties, rapid investments, as well as boosting prices of existing properties, and vice versa. Other utilities such as electricity and water systems among others are also essential to Real Estate thus their presence or lack of will dictate the performance of an area.
The Kenyan Government has been aggressively supporting and implementing various infrastructural development projects, with a major focus on the transport sector with the key beneficiaries being road construction. This is evident in the country’s road network coverage which is currently at 161,451 Km and valued at over Kshs 3.5 tn as at 2021, signifying heavy investment towards the sector, according to Kenya Roads Board’s Annual Public Roads Programme 2021/2022. In the Nairobi Metropolitan Area (NMA), there are 939.6 Km ongoing construction and rehabilitation projects valued at Kshs 162.4 bn, whereas 99.7 Km road projects worth Kshs 4.3 bn have been completed so far in 2021. Both water and sewer connectivity increased by 1.0% points to 55.8% and 19.0% in 2020 from 54.8% and 18.0% in 2019, respectively in the NMA. Kenya’s electricity coverage also currently stands at 70.0%, which represents a 0.3% points increase from the 69.7% realized in 2019. These instances among many others signifies government’s efforts to better the country through improved infrastructure developments.
Section II: Factors Influencing the Infrastructure Sector in Kenya
Kenya has been witnessing massive infrastructural developments as part of the government’s efforts towards positioning Kenya as a regional hub in Africa. This is evident in the infrastructure sector contribution to Gross Domestic Product (GDP) which came in at 11.8% in Q2’2021, 0.6% points higher than the 11.2% in Q2’2020. Some of the factors that have been supporting the development of Kenyan infrastructure sector include;
- Positive Demographics;
According to the World Bank, Kenya’s urbanization and population growth rates are relatively high at 4.0% p.a and 2.3% p.a, respectively, compared to the world’s 1.8% p.a and 1.0% p.a, respectively, as at 2020. These have necessitated the government to initiate and implement various projects in order to meet the needs of the growing population in the country, `
- Government Support;
The government of Kenya has been aggressively supporting and implementing numerous infrastructure projects in the recent past through various ways;
- Increased Budgetary Allocation - In the FY’2021/22 Budget Statement, infrastructure sector received a total of Kshs 182.5 bn to support construction of roads and bridges as well as the rehabilitation and maintenance of roads, which is a 0.6% increase from the Kshs 181.4 bn allocation in FY’2020/21. This shows government’s efforts in financing projects after having had to drastically cut its expenses in the FY’2020/21 as most funds were shifted towards COVID-19 response. Despite the heavy focus on the sector funding, the budget allocation towards it has been generally declining over the last 6 years due to government increasing priority on other major sectors aiming to actualize the Big 4 Agenda. For instance, in the FY’2021/22 budget, the Housing, Urban Development and Public Works were allocated a total of Kshs 21.8 bn, a 33.9% increase from FY’2020/21. The graph below shows the budget allocation to the infrastructure sector over last nine financial years;
- Issuing of Infrastructure Bonds - In a bid to fund infrastructure projects in the country, the National Government of Kenya through its various entities have issued various bonds in order to realize its objective, which also provides savings and investment opportunities. In August 2021, the government through the National Treasury, floated the IFB1/2021/21 infrastructure bond valued at Kshs 75.0 bn in an aim to complete infrastructure projects in the pipeline. The primary bond recorded an oversubscription of 201.7%, with bids worth Kshs 106.8 bn accepted by CBK. The high subscription signifies investors greater appetite for the bond which was mainly driven by its tax free nature and the high market liquidity,
- Project Partnership Strategies- Partnership strategies such as Public Private Partnership (PPPs) and Joint Ventures (JV) have proven to be cost effective ways of delivering infrastructural projects within the country. In line with this, the Nairobi Expressway project, which is a PPP project between the national government through the Kenya National Highways Authority (KENHA), and the China Road and Bridge Construction Corporation (CRBC), will be Kenya’s first road to be tolled under strategy upon its completion. Other PPP projects include; i) Nairobi Bulk Water Supply Project, ii) Nairobi-Western bypass, iii) Kajiado – Imaroro and Ngong – Kiserian – Isinya roads project, and, iv) Solid Waste Treatment in Nairobi City County Project. Additionally, tarmacking of the Mbaraki-Nyerere Road, and Kipevu Road in Mombasa County commenced in November 2021, with financing being done through the JV strategy inclusive of Mombasa County Government, Kenya Ports Authority, Danish and United Kingdom (UK), and,
- Government’s Aggression towards Development of Roads- The government has initiated and implemented numerous road projects in the past years in a bid to improve the road network in the country. According to the Kenya Roads Boards, the country’s road network coverage is currently at 161,451 Km and valued at Kshs 3.5 tn, which is a sign of heavy investment towards the sector by the government. Some of the major ongoing projects include; i) Nairobi Expressway, ii) Nairobi Western Bypass, iii) Mto Mwagodi-Mbale-Wundanyi-Bura road, and, iv) Eastern Bypass Dualing, among many others.
Despite the above supporting factors, there exists challenges that continue to impede the growth of the infrastructure sector which include;
- Financial Constraints - Infrastructural projects require massive capital in order to plan and execute. If the government decides to rely heavily on borrowing in order to initiate and develop projects, the high capital outlay will lead to Kenya running into debt since the revenues generated are usually over a long period of time and cannot cover the deficits created. The government has come on the limelight due to the ballooning levels of public debt which stood at Kshs 7.7 tn as at 30th June 2021, a 14.9% increase from the Kshs 6.7 tn debt recorded in June 2020. The government has to also play a balancing act in terms of allocations especially in the COVID-19 period where finances are now being shifted to finance medical supplies and other COVID-19 related expenses. Notably, since the first reported case of COVID-19 on 13th March 2020 in Kenya, the total public debt has grown by 22.8% to Kshs 7.7 tn from Kshs 6.3 tn,
- Longer Transaction and Approval Timelines - This mainly originates from government institutions in charge of approvals and in turn leads to longer project timelines. This also discourages investors from taking up the infrastructure projects due to the tedious processes involved,
- Insecurity - Safety challenges such as theft and vandalism of infrastructural equipment like fiber cables, petroleum, and electric cables, have impeded the sector’s growth overtime. Moreover, tribal clashes have also caused various infrastructure road projects to be stalled such as the ongoing Nadapal River Section A1 road project that began in March 2017, and was expected to be completed by 2020, however, construction works stalled due to quarrels among the communities settled along the border, and,
- Site Challenges - In the course of construction, developers have had to halt operations due to challenges such as moving water pipes, power lines and also traders settled along the road. A good case example is the 9.8 Km Ngong Road whose works stalled midway due to such irregularities. The same road also experienced engineering challenges in road markings, landscaping and abrupt end of lanes which caused the Kenya Urban Roads Authority to get back to the drawing board and take time to sort the issues out.
Section III: State of Infrastructure in the Nairobi Metropolitan Area (NMA)
For our analysis, we covered the current supply of infrastructure in the Nairobi Metropolitan Area and projects that are currently underway with a focus on roads, railways, water, sewerage, electricity and airports. The counties of focus within the NMA include Nairobi, Kiambu, Machakos, and Kajiado Counties. Below is the analysis of the infrastructure provision in the Nairobi Metropolitan Area;
- Roads
Roads are the most commonly used mode of transport by citizens within Kenya, evidenced by Kenya National Bureau of Statistics’ Economic Survey 2021 report where they accounted for 78.4% of the total value output of transport sector in the country, as at 2020. In the Nairobi Metropolitan Area, a total of 97.7 Km roads worth Kshs 4.3 bn were completed in 2021 as a result of government’s continued focus towards implementation and completion of projects. The completed projects included; i) Imaroro-Mashru-Isara Road in Kajiado County, ii) Indian Bazaar-Ndumberi-Ting’Ang’A-Riabai Road in Kiambu County, and, iii) Kimutwa - Makaveti - Kwa Mutisya Road in Machakos County.
Below is a summary of completed road network coverage in the Nairobi Metropolitan Area (NMA) in 2021;
|
Roads Completed in Nairobi Metropolitan Area in 2021 |
||
|
County |
Coverage (KM) |
Cost (Kshs bns) |
|
Kajiado |
70.0 |
3.0 |
|
Kiambu |
15.7 |
0.7 |
|
Machakos |
12.0 |
0.6 |
|
Total |
97.7 |
4.3 |
Source: KeRRA
Aside from the completed road projects, there exists construction and rehabilitation projects in the pipeline within the Nairobi Metropolitan Area such as; i) 27.1 Km Nairobi Expressway project, ii) 70 Km Ngong-Suswa road project, and, iii) 92 Km Gatundu Muthaiga project, among many others. Currently, the total ongoing network coverage for the projects are at 939.6 Km valued at Kshs 162.4 bn. Below is a summary of the ongoing road network coverage in the NMA;
|
Summary of Nairobi Metropolitan Area Ongoing Road Projects |
|||
|
County |
Total Coverage (KM) |
Average Completion Status |
Total Cost (Kshs bns) |
|
Nairobi |
141.0 |
43.4% |
113.7 |
|
Kiambu |
475.2 |
54.4% |
26.3 |
|
Machakos |
181.0 |
28.4% |
15.0 |
|
Kajiado |
142.4 |
53.8% |
7.3 |
|
Total/ Average |
939.6 |
45.0% |
162.4 |
|
· Nairobi County has got the highest value of roads due to the presence of high net worth ongoing projects such as the Nairobi Expressway project worth Kshs 63.0 bn |
|||
Source: KENHA, KURA, KeRRA,
- Railways
As per the Economic Survey 2021, rail transport accounted for 0.6% of the total value output of transport sector in the country, a sign of limited use of the mode for transport. This is attributed to the limited network coverage in comparison to road transport network. Below are the main railway routes within the Nairobi Metropolitan Area and their immediate stops;
|
Main Railway Routes in Nairobi Metropolitan Area |
|
|
Railway Routes |
Intermediate Stops |
|
Nairobi Town - JKIA |
Nairobi Town, Embakasi, JKIA |
|
Nairobi - Syokimau |
Nairobi Town, Makadara, Imara Daima, Syokimau |
|
Nairobi - Ruiru |
Nairobi Town, Makadara, Dandora, Mwiki, Githurai, Kahawa West, Ruiru |
|
Nairobi – Kahawa West |
Nairobi Town, Makadara, Dandora, Mwiki, Githurai, Kahawa West |
|
Nairobi – Athi River |
Nairobi Town, Makadara, Imara Daima, Embakasi, Mlolongo, Athi River |
|
Nairobi - Kikuyu |
Nairobi Town, Kibera, Dagoretti, Kikuyu |
Source: Kenya Railways Corporation
In addition to the above services, the government of Kenya has also strived hard to implement and conclude various railway projects in a bid to enhance efficient transport of goods, passengers and services to various parts of the country aside from the NMA. This has been majorly facilitated by prioritizing of the projects in the infrastructure budget allocation, external borrowing, as well as raising funds through infrastructure bonds. In return trade activities, property investments, and tourism activities have been boosted in the surrounding regions. The completed projects include; i) Nairobi – Nanyuki Railway, ii) Nairobi – Mombasa Standard Gauge Railway, and, iii) Nairobi – Naivasha Standard Gauge Railway. Moreover, the government is currently in the process of rehabilitating the Nairobi Commuter Rail Project. Outside the Nairobi Metropolitan Area, the government has completed the rehabilitation of the Nakuru-Kisumu railway from August 2020. The 217.0 Km route leads to the Kisumu Railway Station from the Nakuru Railway Station and has 18 stations such as Njoro and Molo stations, with 46 bridges and 27 viaducts.
- Water and Sewer Systems
Most sources of water in the Nairobi Metropolitan Area’s (NMA) come from piped water systems and boreholes. According to Impact Report Issue No. 13 by the Water Services Regulator Board (WASREB), Nairobi NMA’s average water coverage increased by 1.0% points to 55.8% in 2020 from 54.8% in 2019 due to increased development projects. Nairobi County having the most established developments registered the highest water coverage at 79.0%, whereas Kajiado County recorded the least coverage at 31.0% as result of inadequate water supply surpassed by the high population growth rate at 4.6% compared to Kenya’s 2.1%.
For sewer systems, the average network coverage realized a 1.0% points increase to 19.0% in 2020 from 18.0% in 2019. Nairobi County led with a 51.0% coverage whereas counties such as Kajiado had negligible connectivity, with majority of the population relying on sources such as pit latrines, septic tanks, and bio digesters. The table below shows the water and sewer coverage of various counties within the NMA as at 2020;
|
Nairobi Metropolitan Area Water and Sewer Coverage 2020 |
||||
|
|
Water Coverage |
Sewer Coverage |
||
|
County |
2020 |
2019 |
Sewer Coverage 2020 |
Sewer Coverage 2019 |
|
Nairobi |
79.0% |
77.0% |
51.0% |
51.0% |
|
Kiambu |
67.0% |
67.0% |
11.0% |
10.0% |
|
Machakos |
46.0% |
33.0% |
14.0% |
11.0% |
|
Kajiado |
31.0% |
42.0% |
0.0% |
0.0% |
|
Average |
55.8% |
54.8% |
19.0% |
18.0% |
Source: Water Service Regulatory Board
In a bid to bridge the gap of inadequate water and sewer systems in the Nairobi Metropolitan Area, the government has initiated various projects in order to realize its objectives. Some of the ongoing projects include;
- Nairobi Bulk Water Supply Project, to service Nairobi city,
- Solid Waste Treatment Project to service Nairobi city,
- Rehabilitation of Ndarugu and Thiririka Water Treatment Plant Project in Kiambu County,
- Karimenu and Karure Water Systems Development in Kiambu County,
- Westlands Water and Trunk Sewers Development Project in Nairobi County,
- Kilimani Trunk Sewers Development Project in Nairobi County,
- Kajiado and Kitengela Sewerage System Project,
- Mwala Constituency Water and Sanitation Project Phase 3 in Machakos County, and,
- Machakos Water Supply and Sewerage Project, among many others.
- Electricity Supply
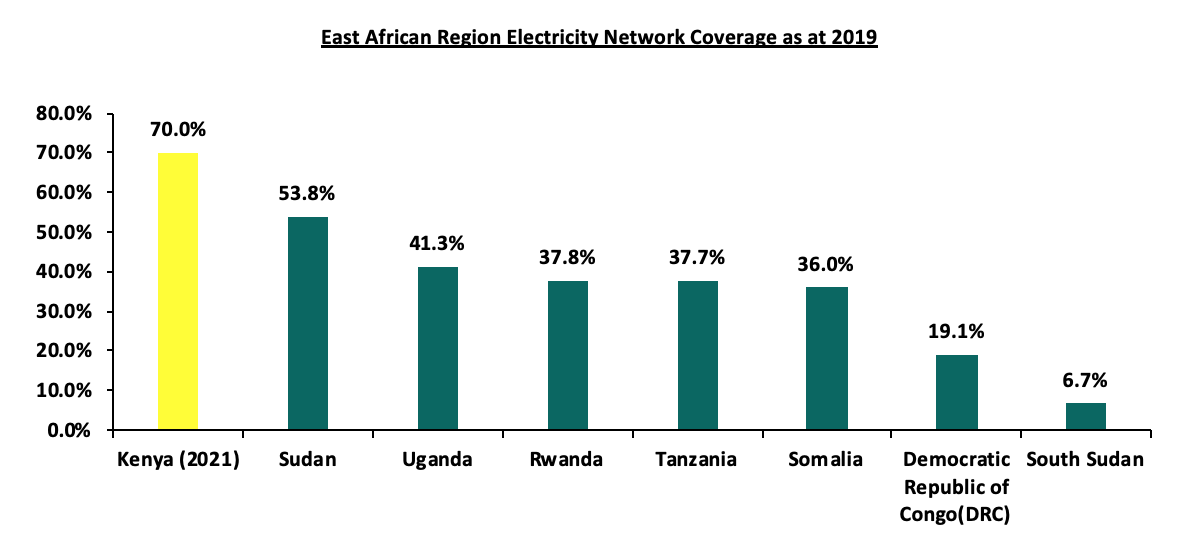
According to 2021 Kenya Power and Lighting's Annual Report, the current electricity coverage in Kenya stands at 70.0% which represents 86,986 Km of connectivity installed in the country. The current coverage represents a 0.3% points increase from the 69.7% realized in 2019. Kenya’s electricity coverage is therefore also the highest in East African region, signifying the government’s remarkable efforts to enable electricity access to Kenyans. The graph below shows the electricity network coverage for various East African Countries as at 2019
Source; World Bank
In order to achieve efficient electricity coverage in the country, the government in collaboration with development partners such as KPLC and African Development Bank, has initiated programs in order to realize its objectives, with some of the programs being;
- The Kenya National Electrification Strategy (KNES) which was launched in December 2018 in partnership with the World Bank, in an aim to achieve universal access to electricity in Kenya, by identifying cost effective solutions for bringing electricity to households and businesses throughout the country,
- Last Mile Connectivity Programme- The program was initiated in October 2016 with an aim of increasing electricity access to low and middle income Kenyans. This will be achieved through expansion of low voltage distribution system to the entire country where electricity access rate is low,
- Kenya Electricity Modernization Project (KEMP)- The program was initiated in 2015 in a bid to scale up Kenya’s electricity access rate, as well as ensuring reliability and quality electricity services to citizens, and,
- Rural Electrification Programme- This is an initiative that was established in 1975 in order to provide electricity to the rural areas of the country.
In the Nairobi Metropolitan Area, some of the ongoing projects aimed at ensuring efficient coverage of electricity include:
|
Nairobi Metropolitan Area Ongoing Electricity Connection Projects |
|||
|
Project |
County |
Length |
Volt |
|
Kamburu – Embu – Kibirigwi – Thika |
Kiambu |
148 Km |
220kV |
|
Machakos – Konza – Isinya – Namanga |
Machakos |
109 Km |
400 kV |
|
Nairobi Ring and associated substation |
Nairobi |
103 Km |
400 kV |
|
System Reinforcement (Isinya substation) |
Machakos |
N/A |
400/220kV |
Source: KETRACO
- Airports
The Economic Survey 2021 by the Kenya National Bureau of Statistics (KNBS) highlights that flight travels accounted for 5.6% of the total value output of transport sector in the country. This makes air transport the second most used mode of transport in the country after road transport. In the Nairobi Metropolitan Area (NMA), the Jomo Kenyatta International Airport (JKIA) is the main airport servicing the area and accounts for 93.2% of the total visitors arriving into the country, as per the October 2021 Leading Economic Indicators Report by KNBS. This is also a sign of NMA being the main point of entry of visitors into the country. The graph below shows the visitor arrivals through JKIA between 2017 and October 2021;
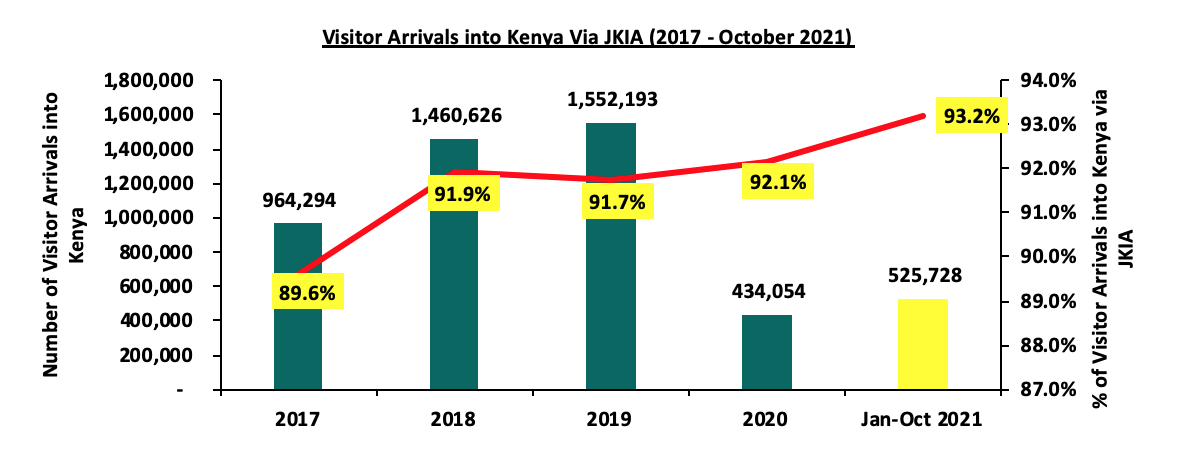
Source: Kenya National Bureau of Statistics
Besides the Jomo Kenyatta International Airport (JKIA), there are other airports serving the Nairobi Metropolitan Area (NMA) such as;
- Wilson Airport which accounted for 0.4% of the total visitor arrivals in the country in H1’2021 according to Tourism Research Institute,
- Amboseli Airport serving the Amboseli National Park in Kajiado County, and,
- Moi Airbase serving the military personnel in Nairobi County.
Section IV: Impact of Infrastructure on Real Estate
Infrastructure plays a vital role in the development and performance of the Real Estate sector in Kenya. This is mainly achieved through developing roads, airports and railways, as well as establishment of adequate electricity, water, and sewer connection systems. Some of the impact that infrastructure development has includes;
- Opening up Areas for Investments: Establishment of infrastructure such as roads and railway transport network opens up surrounding areas to property investments by promoting ease of accessibility. Some of the developments launched around major roads include the Crystal Rivers Mall, and Imaara Mall, both located along the ongoing Nairobi Expressway project,
- Boosting of Property Prices: The presence of infrastructure amenities such as water, sewer and electricity have proven to boost property prices such as land. For instance, according to Cytonn Q3’2021 Markets Review, serviced land in the satellite towns of the Nairobi Metropolitan Area (NMA) recorded higher average selling prices at Kshs 15.5 mn, compared to the average selling prices of the unserviced land in the satellite towns of the NMA which came in at Kshs 13.3 mn. Moreover, the presence of transport networks such as the Nairobi-Thika Super Highway, Waiyaki Way, and the ongoing construction of the Nairobi Expressway among others have contributed to various property prices appreciating,
- Reducing Development Costs: According to the Centre for Affordable Housing Finance in Africa, infrastructure accounts for approximately 14.0% of construction costs in Kenya, hence their presence eases the burden of construction to developers by reducing the costs which could otherwise be incurred by them, and,
- Boosting Tourism Activities and Serviced Apartments Performance: This has been facilitated by the presence of air transport networks, and roads, as they enable accessibility into the country as well as to tourist destinations. In return, the presence of both local and international tourists within the NMA benefits Real Estate sector through improved performance of the serviced apartments and hotels.
Section V: Conclusion
To gauge investment opportunities based on infrastructure, we looked at the key infrastructural sectors ranking them in terms of 2021 performance as follows;
- Roads; Accessibility of an area is the most important factor for property owners and users hence the county with the highest ongoing roads got the highest rank, and vice versa,
- Water and Sewer; Their availability is one of the key factors that buyers look for when investing in a property thus also vital, and the more connected an area has been, the more reliable hence given the higher rank,
- Number of railway stations; plays a significant role in pulling real estate clients as it provides an alternative means of transport to the commonly used roads. However, an area has to have a railway station for this to be effective, thus, the region with the highest number of railway stations got the highest rank, and,
- Proximity to airports; This is especially crucial for commercial real estate. The proximity to the Jomo Kenyatta Airport, therefore, gave highest ranking compared to regions that are farther away from the airport.
|
County Ranking based on the State of Infrastructure Development 2021 |
|||||||
|
County |
Roads |
Water Connectivity |
Sewer Connectivity |
Railway Stations |
Airport Proximity |
Average Points |
Rank |
|
Nairobi |
1 |
4 |
4 |
4 |
4 |
3.4 |
1 |
|
Kiambu |
4 |
3 |
2 |
2 |
3 |
2.8 |
2 |
|
Machakos |
2 |
2 |
3 |
3 |
2 |
2.4 |
3 |
|
Kajiado |
3 |
1 |
1 |
1 |
1 |
1.4 |
4 |
|
* Ranking for roads was based on the ongoing and complete road network coverage within the various counties * Ranking for water and sewer was based on the current network coverage, * Ranking for airports was based on proximity of the various counties to JKIA * Ranking for railways was based on the number of railway stations available within the various NMA counties |
|||||||
Nairobi County presents the best investment opportunity supported by the availability of infrastructure amenities such as; i) efficient water supply and sewer connection, ii) adequate road networks with paved sidewalks, and iii) closest proximity to airports and train stations compared to other counties within the Nairobi Metropolitan Area (NMA). Some of the best areas for investments within Nairobi due to adequate infrastructure include Karen, Westlands, Kilimani, and Upper Hill.
Kiambu County follows with most road networks in the NMA which support real estate investment opportunities. This is in addition to adequate supply of water in the region with a current coverage of 67.0% thus being second best after Nairobi County Some of the best investment opportunity within Kiambu County include; Ruiru, Kikuyu, Kahawa Sukari, and Thika, due to the presence of most projects within them.
We expect the infrastructure sector of Nairobi Metropolitan Area (NMA) to continue recording more developments mainly supported by government’s aggressiveness to initiate and implement projects. However, financial constraints continue to remain a major factor impeding the progress of the projects as they require massive funds to establish.
Disclaimer: The views expressed in this publication are those of the writers where particulars are not warranted. This publication, which is in compliance with Section 2 of the Capital Markets Authority Act Cap 485A, is meant for general information only and is not a warranty, representation, advice or solicitation of any nature. Readers are advised in all circumstances to seek the advice of a registered investment advisor.

- Talk to us
- Kenya
- P.O Box 20695 - 00200, Nairobi, Kenya
- Cell +254709101200
- Tel +254709101200
- WhatsApp +254741676635
- United States
- +254709101200
- DOWNLOAD OUR APP
-


- Kenya
- 8th Floor, Pinetree Plaza, Kaburu Drive, Ngong Road, Nairobi, Kenya
- USA
- Suite 1150, 1775 Eye Street NW, USA, Washington DC 20006, USA
- Investments
- High Yield
- Private Equity
- Real Estate
- Real Estate
- RiverRun Estates
- Cytonn Towers
- The Ridge
- Taraji Heights
- The Alma