Nairobi Metropolitan Area (NMA) Land Report 2021, & Cytonn Weekly #29/2021
By Research Team, Jul 25, 2021
Executive Summary
Fixed Income
During the week, T-bills remained undersubscribed, with the overall subscription rate coming in at 69.6%, a decline from the 80.3% recorded the previous week due to investors’ anticipation of a tap sale in the primary bond market in the coming week. The 91-day paper recorded the highest subscription rate, receiving bids worth Kshs 10.1 bn against the offered Kshs 4.0 bn, translating to a subscription rate of 252.1%, an increase from the 113.3% recorded the previous week. The investors’ interest in the shorter dated 91-day paper is mainly attributable to a higher return on a risk adjusted basis. The yields on all the three papers declined; with the 91-day, 182-day and 364-day paper declining by 4.3 bps, 2.9 bps and 7.4 bps, to 6.5%, 7.0% and 7.4%, respectively. The government accepted all the bids received worth Kshs 16.7 bn, translating to an acceptance rate of 100.0%;
The Monetary Policy Committee (MPC) is set to meet on Wednesday, 28th July 2021 to review the outcome of its previous policy decisions and recent economic developments, and to decide on the direction of the Central Bank Rate (CBR) and any other policy measure like the Cash Reserve Ratio. We expect the MPC to maintain the Central Bank Rate (CBR) at 7.00% as discussed in our July MPC Note. We are projecting the y/y inflation rate for July 2021 to remain within the range of 6.2% - 6.6%, compared to 6.3% recorded in June 2021;
Equities
During the week, the equities market recorded mixed performance, with NASI and NSE 20 gaining by 0.2% and 0.5%, respectively, while NSE 25 declined by 0.2%, taking their YTD performance to gains of 17.7%, 5.8% and 14.2% for NASI, NSE 20 and NSE 25, respectively. The equities market performance was mainly driven by gains recorded by stocks such as BAT Kenya and Bamburi of 4.3% and 2.1%, respectively. The gains were however weighted down by losses recorded by banking stocks such as Co-operative Bank and Diamond Trust Bank Kenya (DTB-K) which declined by 3.0% and 1.9%, respectively. During the week, Atlas Mara Limited revealed that Rwandese Authorities had approved the sale of Banque Populaire du Rwanda (BPR) to KCB Group, with the parties now in the process of finalizing the pre-completion conditions. Also during the week, the Central Bank of Kenya (CBK) released the Quarterly Economic Review for the period ending 31st March 2021, highlighting that the sector’s total assets increased by 2.0% to Kshs 5.5 tn in March 2021, from Kshs 5.4 tn in December 2020;
Real Estate
During the week, the Central Bank of Kenya (CBK) released the Quarterly Economic Review Report January- March 2021 highlighting an increase in both loan advances and non-performing loans for the real estate sector in Q1’2021. In the residential sector, Acorn Holdings, a student hostels developer, announced that it had raised Kshs 2.1 bn from a corporate bond, to develop 2 new hostels expected to avail 2,654 beds in addition to the 4,695 bed capacity currently being developed under the bond funding. Additionally, Standard Chartered Bank of Kenya announced that it had cut the interest on new mortgages and waived legal and valuation fees for clients moving existing facilities from other banks, in a bid to grow home loans. In the retail sector, Naivas Supermarket, a local retailer, opened a new store in Githurai 44, along Kamiti Road, taking up 28,000 SQFT of space previously occupied by Tuskys Supermarket, which shut down due to cash flow setbacks. In the hospitality sector, the British government announced that the United Kingdom has retained Kenya in its ‘Red List’ of countries whose nationals are barred from entering the United Kingdom (UK) due to concerns of the Covid-19 Delta variant;
Focus of the Week
This week, we will focus on the Nairobi Metropolitan Area (NMA) land sector where we highlight the market performance based on the current selling prices. We shall look at the annual capital appreciation, thereby also identifying investment opportunities and providing our outlook for the sector. The NMA land sector on overall recorded an average annual capital appreciation of 1.8% in 2020/2021, 0.3% points increase when compared to the 1.5% realized in 2019/2020, with asking prices averaging at Kshs 127.8 mn thereby realizing a 9-year CAGR of 12.2%. The improvement in performance was mainly attributed to the increased demand for land in low rise areas which recorded the highest annualized capital appreciation of 4.6% compared to a market average of 1.8%. However, land prices in the commercial areas of the NMA registered the highest price correction of 3.6% attributed to unaffordability with their current average prices coming in at Kshs 404.4 mn compared to a market average of Kshs 127.8 mn, coupled with the limited development activities in the real estate commercial office sector and an oversupply of 7.3mn SQFT as at 2020.
Investment Updates:
- Weekly Rates:
- Cytonn Money Market Fund closed the week at a yield of 10.58 %. To invest, just dial *809#;
- Cytonn High Yield Fund closed the week at a yield of 15.97% p.a. To invest, email us at sales@cytonn.com and to withdraw the interest you just dial *809#;
- We continue to offer Wealth Management Training daily, from 9:00 am to 11:00 am, through our Cytonn Foundation. The training aims to grow financial literacy among the general public. To register for any of our Wealth Management Trainings, click here;
- If interested in our Private Wealth Management Training for your employees or investment group, please get in touch with us through wmt@cytonn.com;
- Cytonn Insurance Agency acts as an intermediary for those looking to secure their assets and loved ones’ future through insurance namely; Motor, Medical, Life, Property, WIBA, Credit and Fire and Burglary insurance covers. For assistance, get in touch with us through insuranceagency@cytonn.com;
- Cytonnaire Savings and Credit Co-operative Society Limited (SACCO) provides a savings and investments avenue to help you in your financial planning journey. To enjoy competitive investment returns, kindly get in touch with us through clientservices@cytonn.com;
Real Estate Updates:
- For an exclusive tour of Cytonn’s real estate developments, visit: Sharp Investor's Tour, and for more information, email us at sales@cytonn.com;
- Phase 3 of The Alma is now ready for occupation. To rent please email properties@cytonn.com;
- We have 10 investment-ready projects, offering attractive development and buyer targeted returns. See further details here: Summary of Investment-ready Projects;
- For recent news about the group, see our news section here.
Hospitality Updates:
- We currently have promotions for Staycations, visit cysuites.com/offers for details or email us at sales@cysuites.com;
- Share a meal with a friend during the Sunday Brunch at The Hive Restaurant at Cysuites Hotel and Apartment. Every Sunday from 11.00 AM to 4.00 PM at a price of Kshs 2,500 for Adults and Kshs 1,500 for children under 12 years;
Money Markets, T-Bills & T-Bonds Primary Auction:
During the week, T-bills remained undersubscribed, with the overall subscription rate coming in at 69.6%, a decline from the 80.3% recorded the previous week due to investors’ anticipation of a Tap sale in the primary bond market in the coming week. The 91-day paper recorded the highest subscription rate, receiving bids worth Kshs 10.1 bn against the offered amount of Kshs 4.0 bn, translating to a subscription rate of 252.1%, an increase from the 113.3% recorded the previous week. The investors’ interest in the shorter dated 91-day paper is mainly attributable to a higher return on a risk adjusted basis. The subscription rate for the 364-day and 182-day papers declined to 34.0% and 32.1%, from 52.7% and 113.3% recorded the previous week, respectively. The yields on all the three papers declined; with the 91-day, 182-day and 364-day paper declining by 4.3 bps, 2.9 bps and 7.4 bps, to 6.5%, 7.0% and 7.4%, respectively. The government accepted all the bids received which were worth Kshs 16.7 bn, translating to an acceptance rate of 100.0% which was attributable to the government taking advantage of the low yields and the high liquidity in the market.
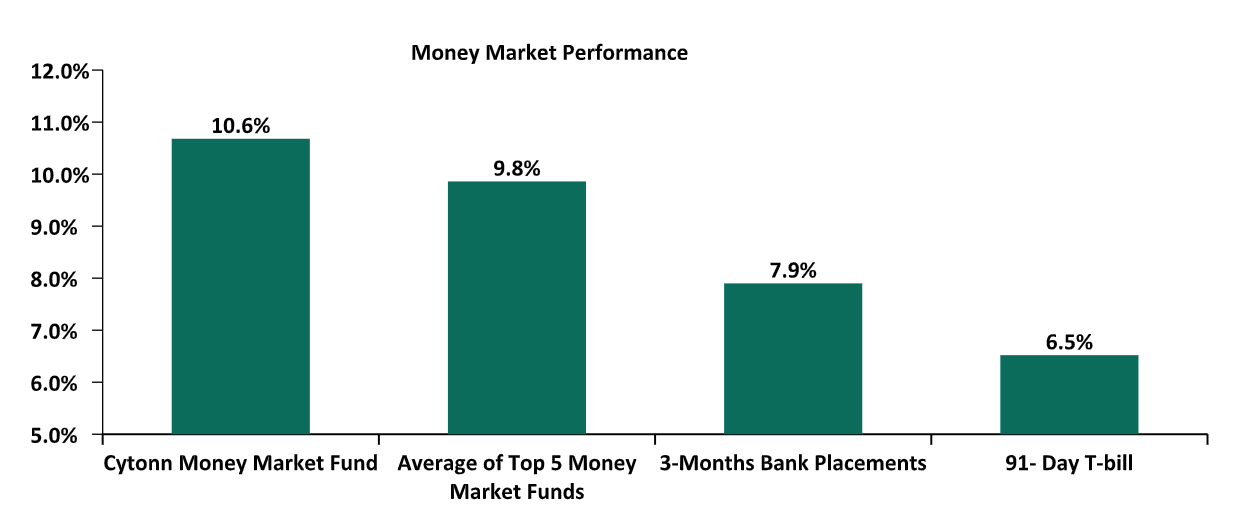
In the money markets, 3-month bank placements ended at 7.9% (based on what we have been offered by various banks), while the 91-day T-bill declined by 4.3 bps to 6.5%. The average yield of the Top 5 Money Market Funds declined marginally by 0.1% points to 9.8% from 9.9%, recorded the previous week, while the yield on the Cytonn Money Market (CMMF) declined marginally by 0.1% points to 10.6% from 10.7%, recorded the previous week.
The table below shows the Money Market Fund Yields for Kenyan Fund Managers as published on 23rd July 2021:
|
Money Market Fund Yield for Fund Managers as published on 23rd July 2021 |
|||
|
Rank |
Fund Manager |
Daily Yield |
Effective Annual Rate |
|
1 |
Cytonn Money Market Fund |
10.06% |
10.58% |
|
2 |
Nabo Africa Money Market Fund |
9.52% |
9.95% |
|
3 |
Zimele Money Market Fund |
9.56% |
9.91% |
|
4 |
Madison Money Market Fund |
8.97% |
9.39% |
|
5 |
CIC Money Market Fund |
9.03% |
9.36% |
|
6 |
Sanlam Money Market Fund |
8.91% |
9.34% |
|
7 |
Orient Kasha Money Market Fund |
8.70% |
9.06% |
|
8 |
Co-op Money Market Fund |
8.55% |
8.92% |
|
9 |
GenCap Hela Imara Money Market Fund |
8.48% |
8.85% |
|
10 |
Dry Associates Money Market Fund |
8.31% |
8.64% |
|
11 |
ICEA Lion Money Market Fund |
8.18% |
8.53% |
|
12 |
British-American Money Market Fund |
8.16% |
8.47% |
|
13 |
NCBA Money Market Fund |
8.01% |
8.31% |
|
14 |
Apollo Money Market Fund |
8.40% |
8.27% |
|
15 |
Old Mutual Money Market Fund |
7.16% |
7.40% |
|
16 |
AA Kenya Shillings Fund |
6.73% |
6.94% |
Source: Business Daily
Liquidity:
During the week, liquidity in the money market eased, with the average interbank rate declining to 3.6% from 4.2% recorded the previous week, due to increased liquidity from government payments, Term Auction Deposits (TADs) maturities of Kshs 104.6 bn which offset the settlements of government securities and tax remittances. The average interbank volumes traded declined by 4.6% to Kshs 4.4 bn, from Kshs 4.6 bn recorded the previous week.
Kenya Eurobonds:
During the week, the yields on the Eurobonds recorded mixed performance. The yields on the 10-year bond issued in 2018 increased by 0.1% points to 5.4% from 5.3%, while the yields on 10-year bond issued in 2014 declined by 0.1% points to 3.2% from 3.3%, recorded the previous week. On the other hand, the yields on the 30-year bond issued in 2018, 7- year bond issued in 2019, 12- year bond issued in 2019 and the 12- year bond issued in 2021 remained unchanged at 7.3%, 4.8%, 6.2% and 6.2%, respectively. Below is a summary of the performance:
|
Kenya Eurobond Performance |
||||||
|
|
2014 |
2018 |
2019 |
2021 |
||
|
Date |
10-year issue |
10-year issue |
30-year issue |
7-year issue |
12-year issue |
12-year issue |
|
31-Dec-20 |
3.9% |
5.2% |
7.0% |
4.9% |
5.9% |
- |
|
30-Jun-21 |
3.3% |
5.4% |
7.4% |
4.8% |
6.3% |
6.3% |
|
16-Jul-21 |
3.3% |
5.3% |
7.3% |
4.8% |
6.2% |
6.2% |
|
19-Jul-21 |
3.3% |
5.3% |
7.3% |
4.8% |
6.2% |
6.2% |
|
20-Jul-21 |
3.3% |
5.4% |
7.4% |
4.8% |
6.3% |
6.2% |
|
21-Jul-21 |
3.3% |
5.4% |
7.4% |
4.9% |
6.3% |
6.2% |
|
22-Jul-21 |
3.2% |
5.4% |
7.3% |
4.9% |
6.2% |
6.2% |
|
23-Jul-21 |
3.2% |
5.4% |
7.3% |
4.8% |
6.2% |
6.2% |
|
Weekly Change |
(0.1%) |
0.1% |
0.0% |
0.0% |
0.0% |
0.0% |
|
MTD Change |
(0.1%) |
0.0% |
(0.1%) |
0.0% |
0.0% |
(0.1%) |
|
YTD Change |
(0.7%) |
0.2% |
0.3% |
(0.1%) |
0.3% |
- |
Source: Reuters
Kenya Shilling:
During the week, the Kenyan shilling remained stable against the US dollar closing at Kshs 108.2 as was recorded the previous week. On a YTD basis, the shilling has appreciated by 0.9% against the dollar, in comparison to the 7.7% depreciation recorded in 2020. Despite the recent appreciation of the shilling, we expect the shilling to remain under pressure in 2021 as a result of:
- Rising uncertainties in the global market due to the Coronavirus pandemic, which has seen investors continue to prefer holding their investments in dollars and other hard currencies and commodities,
- The widened current account position which increased by 0.3% points to 5.5% of GDP in the 12 months to May 2021 from 5.2% of GDP for a similar period in 2020, and,
- Demand from merchandise traders as they beef up their hard currency positions in anticipation for more trading partners reopening their economies globally.
The shilling is however expected to be supported by:
- The Forex reserves, currently at USD 9.4 bn (equivalent to 5.7 months of import cover), which is above the statutory requirement of maintaining at least 4.0-months of import cover, and the EAC region’s convergence criteria of 4.5-months of import cover, and,
- Improving diaspora remittances evidenced by a 6.0% y/y increase to USD 305.9 mn in June 2021, from USD 288.5 mn recorded over the same period in 2020, which has continued to cushion the shilling against further depreciation.
Weekly Highlights:
- July MPC Meeting
The Monetary Policy Committee (MPC) is set to meet on Wednesday, 28th July 2021 to review the outcome of its previous policy decisions and recent economic developments, and to decide on the direction of the Central Bank Rate (CBR) and any other policy measure like the Cash Reserve Ratio. In their previous meeting held on 26th May 2021, the committee maintained the CBR at 7.00%, in line with our expectations, citing that the accommodative policy stance adopted in March 2020, and all the other sittings since, which saw a cumulative 125 bps cut, was having the intended effects on the economy. We expect the MPC to maintain the Central Bank Rate (CBR) at 7.00%, with their decision mainly being supported by:
- Stable inflation which is projected to remain within the 2.5%-7.5% target range despite the recent increases in fuel prices. Key to note, June’s inflation rate of 6.3% was a 16 month high and is above the midpoint of the government’s target range. We note that the IMF recently raised a concern on the country’s rising inflation rates noting that should the country’s three-month average inflation rate breach the CBK’s target range, IMF would pause the USD 2.3 bn (Kshs 248.9 bn) three-year financing package under the EFF/ECF program. We believe that the MPC might come under pressure in the short term to maintain price stability should the inflation rates continue rising, and,
- The need to support the economy by maintaining an accommodative monetary policy stance to strengthen the ongoing recovery. The current macro and business environment fundamentals might constrain the transmission of further easing, despite the need to stimulate economic growth. Therefore, we believe that any additional rate cuts will not lead to a rise in private sector credit growth as elevated credit risks persist in the current environment. However, the speed of vaccine inoculation will determine how fast normalcy will return in key sectors such as tourism and wholesale/retail trade.
For a more detailed analysis, please see our MPC Note here.
- July Inflation Projections
We are projecting the y/y inflation rate for July 2021 to remain within the range of 6.2% - 6.6%. The key drivers include:
- Fuel prices remained unchanged for the period mid-July to mid-August 2021,
- Food prices have remained relatively stable during the month given the favorable weather and an improvement in agricultural output,
- Upward readjustment of the foreign exchange fluctuation tariff for electricity usage to 116.1 cents per Kilowatt hour (KWh) in July from 77.0 cents per Kilowatt hour (KWh) in June. The readjustment will increase the cost of electricity consumption for households, and,
- Introduction of the 16.0% VAT on Liquefied Petroleum Gas and 20.0% excise duty on telecommunication and banking products which was effected on 1st July, 2021. The taxes imposed are expected to have a negative effect on the overall inflation.
Going forward, we expect the inflation rate to remain within the government set range of 2.5% - 7.5%. However, our concern on the impact of the increase in tariffs and taxes persists, as we foresee a concurrent contribution to the increase in the headline inflation, despite the government interventions through tariff reliefs. Similarly, the IMF, in its Credit facility agreement with the government in February 2021, gave conditions for a target inflation which should be maintained so as to continue accessing the loan facility. Given that the next IMF evaluation test date is in December 2021, the government has a sufficient period to readjust in the event of the spike in the inflation rate in the months in between.
Rates in the fixed income market have remained relatively stable due the sufficient levels of liquidity in the money market, coupled with the discipline by the Central Bank to reject expensive bids. The government is 23.7% behind its prorated borrowing target of Kshs 50.7 bn having borrowed Kshs 38.6 bn in FY’2021/2022. We expect a gradual economic recovery going into FY’2021/2022 as evidenced by KRA collecting Kshs 1.7 tn in FY’2020/2021, a 3.9% increase from Kshs 1.6 tn collected in the prior fiscal year. However, despite the projected high budget deficit of 7.5% and the lower credit rating from S&P Global to 'B' from 'B+', we believe that the monetary support from the IMF and World Bank will mean that the interest rate environment may stabilize since the government will not be desperate for cash.
During the week, the equities market recorded mixed performance, with NASI and NSE 20 gaining by 0.2% and 0.5%, respectively, while NSE 25 declined by 0.2%, taking their YTD performance to gains of 17.7%, 5.8% and 14.2% for NASI, NSE 20 and NSE 25, respectively. The equities market performance was mainly driven by gains recorded by stocks such as BAT Kenya and Bamburi of 4.3% and 2.1%, respectively. The gains were however weighted down by losses recorded by banking stocks such as Co-operative Bank and Diamond Trust Bank Kenya (DTB-K) which declined by 3.0% and 1.9%, respectively.
During the week, equities turnover increased by 0.2% to USD 17.0 mn, from USD 16.9 mn recorded the previous week, taking the YTD turnover to USD 711.4 mn. Foreign investors remained net buyers, with a net buying position of USD 0.4 mn, from a net buying position of USD 1.0 mn recorded the previous week, taking the YTD net selling position to USD 24.8 mn.
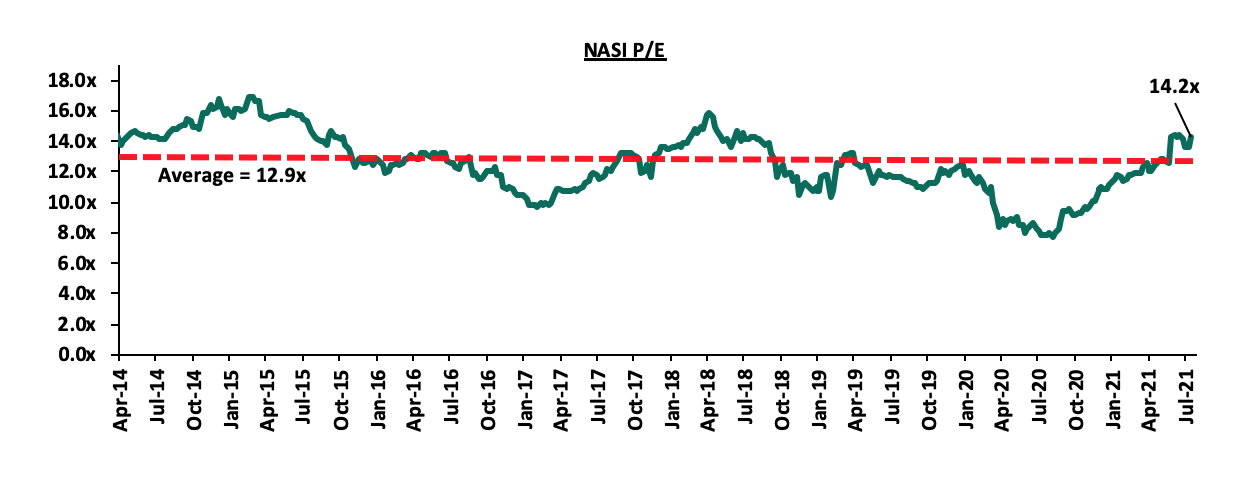
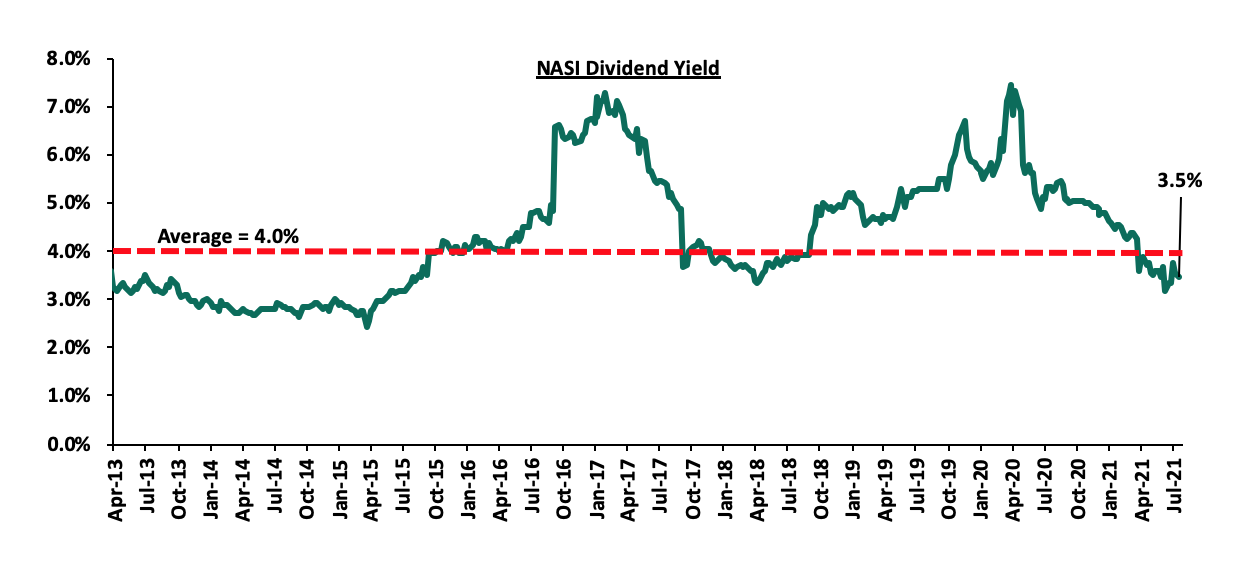
The market is currently trading at a price to earnings ratio (P/E) of 14.2x, 9.6% above the historical average of 12.9x, and a dividend yield of 3.5%, 0.5% points below the historical average of 4.0%. Key to note, NASI’s PEG ratio currently stands at 1.6x, an indication that the market is trading at a premium to its future earnings growth. Basically, a PEG ratio greater than 1.0x indicates the market may be overvalued while a PEG ratio less than 1.0x indicates that the market is undervalued. Excluding Safaricom, the market is trading at a P/E ratio of 12.7x and a PEG ratio of 1.4x. The current P/E valuation of 14.2x is 83.9% above the most recent trough valuation of 7.7x experienced in the first week of August 2020. The charts below indicate the historical P/E and dividend yields of the market.
Weekly Highlights:
- KCB Group’s acquisition of Banque Populaire du Rwanda (BPR)
During the week, Atlas Mara Limited disclosed that the Rwandese Authorities had approved the sale of Banque Populaire du Rwanda (BPR) to KCB Group, and that the parties are now in the process of finalizing the pre-completion conditions. KCB Group and Atlas Mara Limited had signed a definitive agreement in November 2020 for KCB’s acquisition of a 62.1% stake in BPR and a 100.0% stake in Africa Banking Corporation Tanzania Limited (BancABC), subject to shareholder approval and regulatory approval in the respective countries. In May 2021, KCB Group disclosed that it made an offer to the remaining BPR shareholders to raise its acquisition stake in the bank to 100.0% from 62.1% and received shareholders’ approval for the acquisitions, with only regulatory approval pending for the finalization of the transactions. Regulatory approval is however still pending with respect to the KCB’s acquisition of BancABC from Atlas Mara. For more information on the acquisition, see our Cytonn Weekly #19/2021.
The acquisition will enhance KCB’s footprint in the region, which is in line with the group’s ‘Beyond Banking Strategy’ which is aimed at tapping into new growth opportunities regionally. Rwanda presents an ideal growth opportunity for KCB, with only about 36.0% of adults in Rwanda using banking services according to Finscope Rwanda 2020, compared to 41.0% in Kenya. Furthermore, Rwanda's banking sector's asset quality is superior to Kenya's, with an average NPL ratio of 6.2% over the last five years and 4.5% in FY'2020, compared to the average NPL ratio of 14.1% recorded by Kenya's banking sector and 14.8% recorded by KCB Group in FY'2020. Since loans typically constitute the majority of a bank's assets, the superior asset quality in Rwanda can help KCB reduce the level of risk exposure of its loan book to the Kenyan market while increasing profits due to more performing loans. Additionally, according to World Bank data, Rwanda and Tanzania recorded interest rate spreads of 8.7% and 10.0% in 2020, respectively, both higher than Kenya’s 5.0% and KCB Group's 7.8% net interest spread over the same period; which means that the acquisitions could help boost the Group's funded income.
Below is a summary of the deals in the last 7 years that have either happened, been announced or expected to be concluded:
|
Acquirer |
Bank Acquired |
Book Value at Acquisition (Kshs bn) |
Transaction Stake |
Transaction Value (Kshs bn) |
P/Bv Multiple |
Date |
|
I&M Holdings PLC |
Orient Bank Limited Uganda |
3.3 |
90.0% |
3.6 |
1.1x |
April-21 |
|
KCB Group |
Banque Populaire du Rwanda, and, ABC Tanzania |
5.3 (Banque Populaire du Rwanda, only. ABC Tanzania financials unknown) |
100.0% |
6.3 |
N/D |
Nov-20* |
|
Co-operative Bank |
Jamii Bora Bank |
3.4 |
90.0% |
1 |
0.3x |
Aug-20 |
|
Commercial International Bank |
Mayfair Bank Limited |
1 |
51.0% |
Undisclosed |
N/D |
May-20* |
|
Access Bank PLC (Nigeria) |
Transnational Bank PLC. |
1.9 |
100.0% |
1.4 |
0.7x |
Feb-20* |
|
Equity Group ** |
Banque Commerciale Du Congo |
8.9 |
66.5% |
10.3 |
1.2x |
Nov-19* |
|
KCB Group |
National Bank of Kenya |
7 |
100.0% |
6.6 |
0.9x |
Sep-19 |
|
CBA Group |
NIC Group |
33.5 |
53%:47% |
23 |
0.7x |
Sep-19 |
|
Oiko Credit |
Credit Bank |
3 |
22.8% |
1 |
1.5x |
Aug-19 |
|
CBA Group** |
Jamii Bora Bank |
3.4 |
100.0% |
1.4 |
0.4x |
Jan-19 |
|
AfricInvest Azure |
Prime Bank |
21.2 |
24.2% |
5.1 |
1.0x |
Jan-18 |
|
KCB Group |
Imperial Bank |
Unknown |
Undisclosed |
Undisclosed |
N/A |
Dec-18 |
|
SBM Bank Kenya |
Chase Bank Ltd |
Unknown |
75.0% |
Undisclosed |
N/A |
Aug-18 |
|
DTBK |
Habib Bank Kenya |
2.4 |
100.0% |
1.8 |
0.8x |
Mar-17 |
|
SBM Holdings |
Fidelity Commercial Bank |
1.8 |
100.0% |
2.8 |
1.6x |
Nov-16 |
|
M Bank |
Oriental Commercial Bank |
1.8 |
51.0% |
1.3 |
1.4x |
Jun-16 |
|
I&M Holdings |
Giro Commercial Bank |
3 |
100.0% |
5 |
1.7x |
Jun-16 |
|
Mwalimu SACCO |
Equatorial Commercial Bank |
1.2 |
75.0% |
2.6 |
2.3x |
Mar-15 |
|
Centum |
K-Rep Bank |
2.1 |
66.0% |
2.5 |
1.8x |
Jul-14 |
|
GT Bank |
Fina Bank Group |
3.9 |
70.0% |
8.6 |
3.2x |
Nov-13 |
|
Average |
|
|
76.7% |
|
1.2x |
|
|
* Announcement Date ** Deals that were dropped |
||||||
- Q1’2021 Quarterly Economic Review
During the week, the Central Bank of Kenya (CBK) released the Quarterly Economic Review for the period ending 31st March 2021, highlighting that the banking sector remained stable and resilient in the midst of a pandemic during the period. According to the report, the sector’s total assets increased by 2.0% to Kshs 5.5 tn in March 2021, from Kshs 5.4 tn in December 2020. The increase was mainly attributable to an 8.1% increase in placements coupled with a 5.2% increase in loans and advances in March 2021. Notably, loans and advances accounted for 49.8% of total assets in Q1’2021, which was a 0.5% points increase from 49.3% of total assets in FY’2020.
Other key take-outs from the report include:
- The banking sector recorded a 94.7% increase in Profit before Tax (PBT) to Kshs 45.9 bn in Q1’2021, from Kshs 23.6 bn in Q4’2020, with the increase in profitability mainly attributable to a 22.8% decline in expenses in Q1’2021. Consequently, the sector’s Return on Assets (ROA) recorded a 1.0% points increase to come in at 2.6% in Q1’2021, from 1.6% recorded in Q4’2020, while Return On Equity (ROE) recorded an 8.2% points increase to 22.0% in March 2021, from 13.8% in December 2020,
- Lending increased by 0.7% to Kshs 3.04 tn in Q1’2021, from Kshs 3.00 tn in FY’2020, attributable to an increase in loans and advances to Financial Services, Manufacturing, and Personal and Household sectors, which increased by 4.2%, 3.4% and, 1.2%, respectively,
- Deposits recorded a 2.8% increase to Kshs 4.1 tn in March 2021, from Kshs 4.0 tn in December 2020, attributable to a 10.1% increase in foreign currency deposits which increased to Kshs 998.4 bn in Q1’2021, from Kshs 907.0 bn in FY’2020, coupled with a 0.6% increase in local currency deposits, which increased to Kshs 3.13 tn in March 2021, from Kshs 3.11 tn in December 2020. Key to note, customer deposits remain the main source of funding for banks, accounting for 74.8% of the sector’s total liabilities and shareholders’ funds as at Q1’2021, which was a 0.7% points increase from 74.1% of total liabilities and shareholders’ funds in FY’2020,
- Credit risk remained elevated in the sector, with the gross Non-Performing Loans (NPLs) ratio increasing to 14.6% in Q1’2021, from 14.1% in FY’2020 with Trade, Personal and Household and Manufacturing sectors contributing 22.5%, 16.2% and 15.5% of Gross Non-Performing Loans to the banking sector, respectively. The Real Estate sector registered the highest increase in NPLs by 14.9% in Q1’2021 as a result of the disruptions caused by the COVID-19 pandemic. The sector’s NPL coverage ratio increased to 53.1% in Q1’2021, from 51.9% in FY’2020, an indication that the banks continued to increase their provisioning levels to proactively manage risks given the tough economic conditions,
- The banking sector remained adequately capitalized, with the aggregate Core Capital to Total Risk-Weighted Assets ratio coming in at 16.5% in Q1’2021, a 0.2% points decline from 16.7% recorded in FY’2020 and 6.0% points above the CBK’s minimum statutory ratio of 10.5%. Total Capital to Total Risk-Weighted Assets ratio also declined, decreasing by 0.4% points to 18.8% in Q1’2021 from 19.2% in FY’2020, but 4.3% points above the CBK’s minimum statutory ratio of 14.5%, and,
- The sector remained liquid during the period under review, with the liquidity ratio rising to 56.3% in Q1’2021, from 54.6% in FY’2020. This was 36.3% points above the minimum statutory level of 20.0%. The increase in the banking sector’s liquidity is attributable to a 5.7% increase in total liquid assets, which outpaced the 2.0% increase in short term liabilities during the quarter.
The increasing profitability in Q1’2021 indicates that the banking sector remains on the path to recovery in 2021. Although the capital adequacy ratios declined in Q1’2021, they still remain above the minimum statutory ratios and as such, the sector remains sufficiently capitalized while still maintaining adequate liquidity buffers. On the flipside, credit risk remains elevated in the industry, as evidenced by the rising NPL ratio and as such, we expect lending to the private sector to remain constrained in the short-medium term. Key to note, the latest data from CBK indicates that private sector credit growth recorded a 6.8% growth in the 12 months to April 2021, the lowest it has been since October 2019 when the private sector credit growth stood at 6.6%, reflecting the persistent uncertainty in the economy on account of the toll of the COVID-19 pandemic on the business environment. The fact that banks are still reluctant to lend to businesses despite the high liquidity currently in the market also indicates private sector lending is expected to record slow growth in the short-medium term. We however expect the banking sector to remain resilient boosted by the CBK’s efforts to improve their liquidity positions by maintaining the Cash Reserve Ratio at 4.25%, proactive monitoring of the loan book by commercial banks and improved capital adequacy across the sector.
Universe of Coverage:
Below is a summary of our universe of coverage and the recommendations:
|
Company |
Price as at 16/07/2021 |
Price as at 23/07/2021 |
w/w change |
YTD Change |
Year Open 2021 |
Target Price* |
Dividend Yield |
Upside/ Downside** |
P/TBv Multiple |
Recommendation |
|
I&M Group*** |
21.5 |
22.2 |
3.0% |
(50.6%) |
44.9 |
29.8 |
10.2% |
44.7% |
0.3x |
Buy |
|
Kenya Reinsurance |
2.5 |
2.5 |
0.4% |
9.1% |
2.3 |
3.1 |
4.0% |
27.0% |
0.3x |
Buy |
|
NCBA*** |
26.0 |
26.2 |
0.8% |
(1.7%) |
26.6 |
29.5 |
5.7% |
18.5% |
0.7x |
Accumulate |
|
Standard Chartered*** |
129.8 |
129.5 |
(0.2%) |
(10.4%) |
144.5 |
134.5 |
8.1% |
12.0% |
0.9x |
Accumulate |
|
KCB Group*** |
44.9 |
44.6 |
(0.7%) |
16.0% |
38.4 |
48.6 |
2.2% |
11.3% |
1.0x |
Accumulate |
|
Co-op Bank*** |
13.5 |
13.1 |
(3.0%) |
4.4% |
12.6 |
13.8 |
7.6% |
13.0% |
0.9x |
Accumulate |
|
ABSA Bank*** |
10.0 |
9.9 |
(1.4%) |
3.6% |
9.5 |
10.7 |
0.0% |
8.5% |
1.1x |
Hold |
|
Stanbic Holdings |
82.8 |
87.5 |
5.7% |
2.9% |
85.0 |
90.5 |
4.3% |
7.8% |
0.8x |
Hold |
|
Diamond Trust Bank*** |
66.3 |
65.0 |
(1.9%) |
(15.3%) |
76.8 |
70.0 |
0.0% |
7.7% |
0.3x |
Hold |
|
Equity Group*** |
48.6 |
47.9 |
(1.4%) |
32.0% |
36.3 |
51.2 |
0.0% |
7.0% |
1.4x |
Hold |
|
Sanlam |
11.0 |
11.6 |
5.5% |
(10.8%) |
13.0 |
12.4 |
0.0% |
6.9% |
1.0x |
Hold |
|
Jubilee Holdings |
385.0 |
370.0 |
(3.9%) |
34.2% |
275.8 |
330.9 |
2.4% |
(8.1%) |
0.8x |
Sell |
|
Britam |
7.5 |
7.7 |
2.4% |
10.0% |
7.0 |
6.7 |
0.0% |
(13.0%) |
1.4x |
Sell |
|
HF Group |
3.7 |
3.9 |
4.1% |
22.6% |
3.1 |
3.2 |
0.0% |
(16.9%) |
0.2x |
Sell |
|
Liberty Holdings |
7.8 |
9.6 |
22.6% |
24.2% |
7.7 |
8.4 |
0.0% |
(12.1%) |
0.7x |
Sell |
|
CIC Group |
2.6 |
2.6 |
(3.4%) |
20.9% |
2.1 |
1.8 |
0.0% |
(29.4%) |
0.9x |
Sell |
|
Target Price as per Cytonn Analyst estimates **Upside/ (Downside) is adjusted for Dividend Yield ***For Disclosure, these are stocks in which Cytonn and/or its affiliates are invested in Key to note, I&M Holdings YTD share price change is mainly attributable to counter trading ex-bonus issue. |
||||||||||
We are “Neutral” on the Equities markets in the short term. With the market currently trading at a premium to its future growth (PEG Ratio at 1.6x), we believe that investors should reposition towards companies with a strong earnings growth and are trading at discounts to their intrinsic value. Additionally, we expect the recent discovery of new strains of COVID-19 coupled with the introduction of strict lockdown measures in major economies to continue dampening the economic outlook.
- Industry Reports
During the week, the Central Bank of Kenya (CBK) released the Quarterly Economic Review Report January- March 2021 and the key take outs for the real estate sector included;
- The gross loans advanced to the real estate sector increased by 11.4% to approximately 444.0 bn in Q1’2021 from approximately Kshs 439.0 bn advanced in Q4’2020. The gross loans advanced to buildings and constructions sector increased from 123.0 bn in Q4’2020 to 125.0 bn in Q1’2021 while loans advanced to the tourism sector increased from Kshs 102.0 bn to Kshs 104.0 bn during the same period under review. The increase is attributable to layoffs, business closures affecting the commercial and retails sectors and travel restrictions triggered by the pandemic affecting the performance of the hospitality industry,
- The gross non-performing loans to the real estate sector increased by 14.8% to Kshs 70.5 bn in Q1’2021 from Kshs 61.4 bn recorded in Q4’2020, accounting for 15.9% of the total real estate loan book. The increase was attributed to economic disruptions by the Covid-19 pandemic reducing cash flows and the ability to service debt, and,
- With regards to the loans to the sector, real estate accounted for 14.6% of the total loan advances valued at Kshs 444.0 bn compared to the total Kshs 3.0 tn, while building and construction, and tourism sectors accounted for 4.1% and 3.4% of the total loan book, respectively;
The graph below shows the number of real estate non-performing loans compared to the total real estate loan book from 2016-Q1’2021;
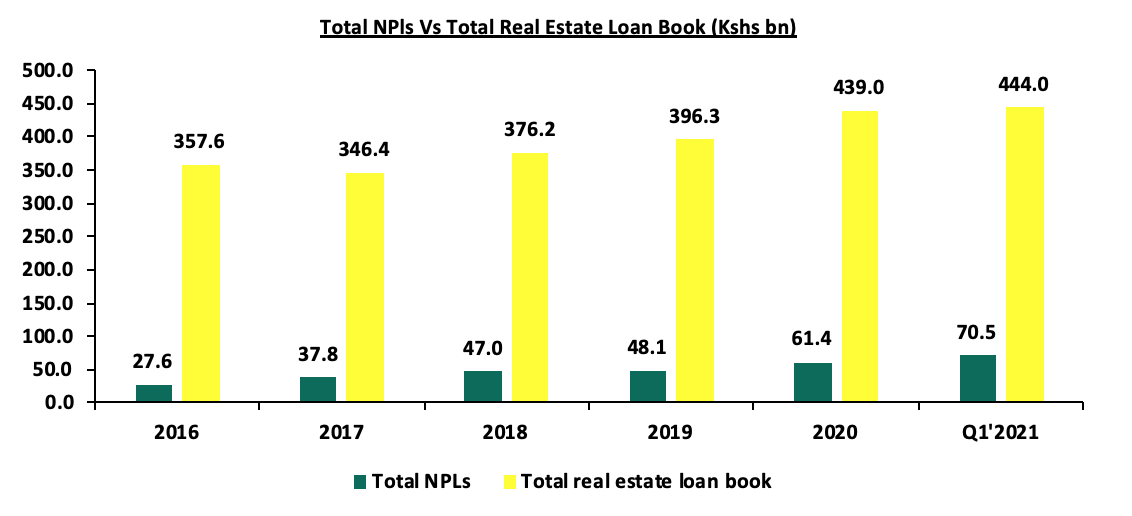
Source: Central Bank of Kenya
The resultant impact of this is that lenders are expected to exercise a more conservative approach in loan provision such as tighter risk provisions as a strategy to cushion themselves against high loan default rates.
- Residential Sector
During the week, Acorn Holdings, a student hostels developer, announced that it had raised Kshs 2.1 bn from a corporate bond, to develop 2 new hostels expected to avail 2,654 beds in addition to the 4,695 bed capacity currently being developed under the bond funding. This will bring the total number of developments funded under their bond programme to 8. The amount raised represents a 145.8% oversubscription from the targeted Kshs 1.4 bn, incentivized with partial credit guarantee of 50.0% of the principal and interest by GuarantCo, a fund backed by the governments of the UK, the Netherlands, Switzerland, Australia, Sweden, Germany and the International Finance Corporation (IFC). Acorn Holdings had initially floated a Kshs 5.0 bn first green bond in October 2019, with the first tranche raising Kshs 4.3 bn against the minimum expected Kshs 2.0 bn which was deployed towards construction of 6 environment friendly purpose-built student accommodations (PBSA) under the Qwetu and Qejani brands. Additionally, in March 2021, Acorn received Kshs 2.1 bn when it split its portfolio into two, a development and an investment trust. The firm currently has 3,000 beds under management with a target aim of 30,000 beds under management by 2030, with Qwetu having 4 properties under development to provide 5,700 beds while Qejani has two flagship projects, Qejani Chiromo and Qejani Catholic, whose development began in April 2021, in an aim to add an additional 3,000 beds. The launch of the construction of the 3,591 room-hostels in Nairobi Karen in June 2021, is the most recent development by the firm, in a project that is expected to cost Kshs 1.9 bn, and set for completion in December 2022.
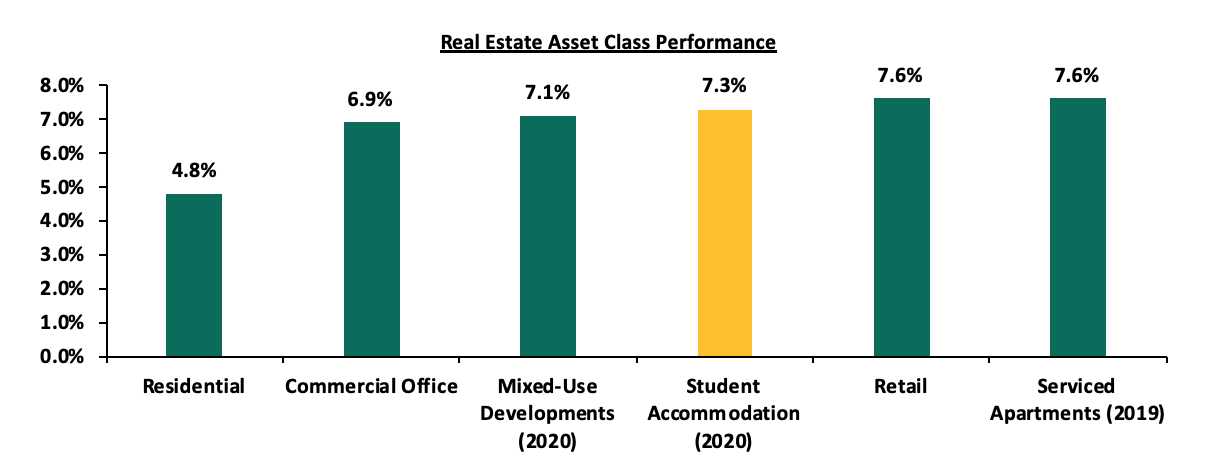
The oversubscription of the Acorn bond is expected to set good precedent for investors regaining their confidence in corporate bonds which is one of the key methods of real estate financing. Acorn Holdings remains committed to bridging the gap between the increasing demand and the low supply for student’s hostels in the country, supported by i) the high deficit of student accommodation at of 209,473 students according to the Kenya National Bureau of Statistics, with exclusion of technical colleges, ii) the inability of individual learning institutions to host enrolled students into their premises, iii) the need by students for secure but affordable housing near the learning institutions from the high cases of insecurities, and iv) the high returns from this thematic sector at 7.3% as at 2020 compared to other real estate classes such residential and commercial sectors with H1’2021 rental yields at 4.8% and 6.9%, respectively.
The graph below shows the performance of rental yields in student housing compared to the different real estate asset classes in H1’2021;
Source: Cytonn Research
Investment in student accommodation is expected to continue gaining traction supported by the continued acceptance of corporate bonds and the high returns, leading to higher developers’ interests in the sector compared to other real estate classes.
Additionally, Standard Chartered Bank of Kenya announced that it had cut the interest on new mortgages and waived legal and valuation fees for clients moving existing facilities from other banks, in a bid to grow home loans. This will see new customers seeking mortgages of between Kshs 1.0mn to Kshs 100.0 mn in the next three months up to October, enjoy a discounted variable rate such as benchmark average lending rates of approximately 10.9% from the 13.9% average that the bank is currently charging. To encourage those moving from other banks, StanChart will meet fees from lawyers averaging at 1.2% of the value of the mortgage and valuation fees usually charged at about 2.0% on the first Kshs 2.0 mn of the mortgage plus 0.3% on any amounts beyond this.
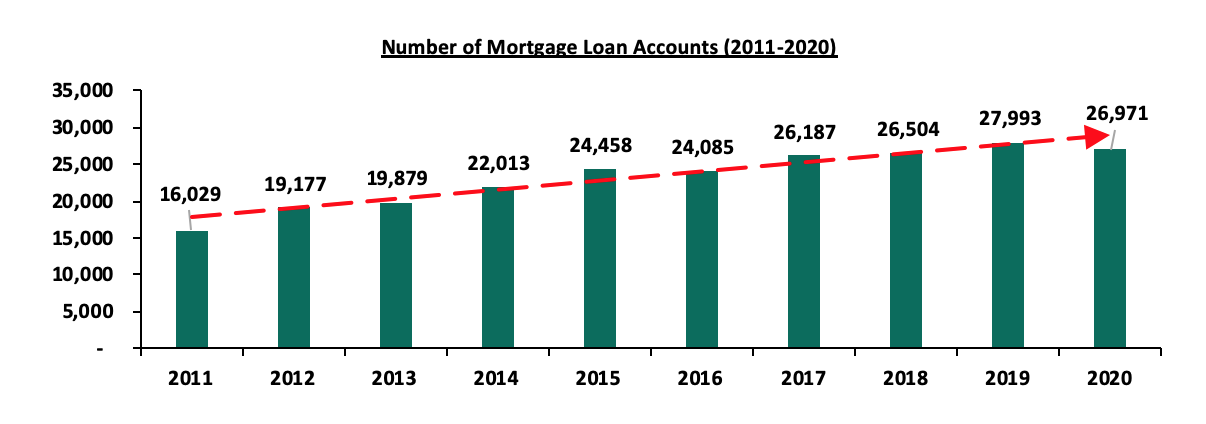
This move is expected to increase the bank’s 9.2% share of Kenya’s mortgages having last reported 1,942 mortgage accounts as at 2020, and remove constraint for individuals moving mortgage facilities due to the high legal and valuation fees. Moreover, it will support increase the number of mortgage accounts for the country, currently standing at 26,971 as at 2020, representing a 3.5% decline from 27,943 in 2019 due to the economic disruptions that came about from the Covid-19 pandemic.
The graph below shows the number of mortgage loan accounts in Kenya over the last 10 years;
Source: Central Bank of Kenya
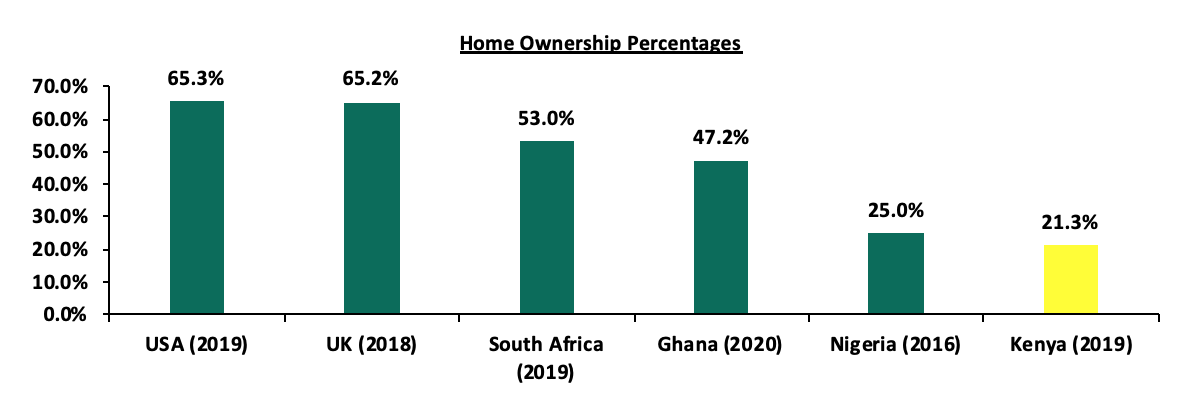
With the increase in mortgage accounts, this will boost the home ownership percentage in the country which continues to remain relatively low at 21.3%, compared to other countries such as USA and UK at 65.3% and 65.2%, respectively as at 2020.
The graph below shows the percentage of home ownership in different countries compared to Kenya;
Source: Centre for Affordable Housing Finance in Africa
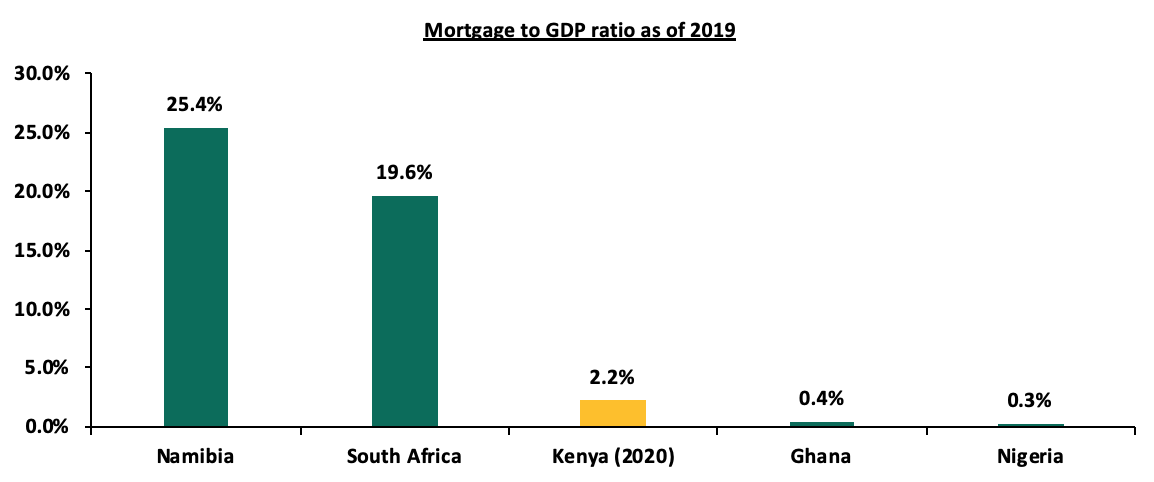
Kenya has continued to record slow mortgage penetration, resulting to a relatively low mortgage to GDP ratio which stands at 2.2% as at 2020, compared to other African countries such as Namibia at 25.4%. The low mortgage uptake has been due to; i) the high interest rates and high deposit requirements, ii) soaring of property prices, iii) low-income levels making it hard to service loans, and, iv) lack of credit risk information for those in the informal sector leading to their exclusion. However, the Kenyan government is working on improving this through the Kenya Mortgage and Refinance Company (KMRC) which advances credit to mortgage lenders at a rate of 5.0% for onward lending at rate of 7.0%, 3.9% lower than the average market lending rate of 10.9% as at 2020. However, it is not clear how KMRC will sustainably access funds at the such low rates, yet even the government can only access 20-year funds at a 13.2% rate.
The graph below shows the mortgage to GDP ratio for Kenya compared to other countries as at 2019;
Source: Center for Affordable Housing Africa
The residential sector is expected continue recording increased activities following focus on development of student housing and private players such as the banking sector availing mortgage solutions to Kenyans, aiming to raise mortgage accounts and increase home ownership.
- Retail Sector
During the week, Naivas Supermarket, a local retailer, opened a new store in Githurai 44, along Kamiti Road, taking up 28,000 SQFT of space previously occupied by Tuskys Supermarket, which shut down due to cash flow setbacks. This brings the retailer’s total operational outlets to 74, having opened 4 other outlets this year in various parts of the country, with the latest being an outlet in Nairobi Central Business District (CBD) along Muindi Mbingu street in June 2021. Naivas aims to cement its position as the top retailer in the country in an expansion spree to serve a larger number of clientele thus boosting profits, while competing against other expanding retailers such as Quickmart and Carrefour who have each opened 4 outlets this year. Moreover, Naivas also announced plans to open a new outlet in Kisumu’s Simba Hall by the end of August 2021.
The retailer’s entry into Githurai 44 is supported by i) financial muscle to drive growth after a Kshs 6.0 bn financing by Amethis Capital, a France based private equity firm, for sale of 30.0% stake in August 2020, ii) the market niche in the specific area, currently being served by Khetias Supermarket, iii) the accessibility of the area by both suppliers and shoppers through Kamiti Road which is off Thika Super-Highway, and, iv) the availability of prime space left by troubled retailers. According to our Cytonn H1’2021 Markets Review, the average rental rates for retail spaces within Thika Road area, where Githurai 44 is categorized, came in at Kshs 159 per SQFT in H1’2021, 5.9% lower compared to a market average rent of Kshs 169 per SQFT, thus offering relatively affordable retail space for Naivas and hence suitability for uptake.
The table below shows the average retail rents per SQFT in the Nairobi Metropolitan Area in H1’2021;
|
Nairobi Metropolitan Area Retail Performance H1’2021 |
|||
|
Area |
Rent/SQFT H1'2021 (Kshs) |
Occupancy % H1'2021 |
Rental Yield H1'2021 |
|
Westlands |
209 |
80.0% |
9.7% |
|
Karen |
217 |
80.6% |
9.5% |
|
Kilimani |
173 |
82.8% |
8.9% |
|
Ngong Road |
178 |
78.8% |
8.0% |
|
Kiambu road |
178 |
68.8% |
7.1% |
|
Thika Road |
159 |
73.3% |
6.7% |
|
Mombasa road |
139 |
73.0% |
6.3% |
|
Satellite towns |
134 |
74.0% |
6.2% |
|
Eastlands |
136 |
70.0% |
5.8% |
|
Average |
169 |
75.7% |
7.6% |
Source: Cytonn Research 2021
The table below shows the summary of the number of stores of the Key local and international retailer supermarket chains in Kenya;
|
Main Local and International Retail Supermarket Chains |
|||||||||
|
Name of Retailer |
Category |
Highest number of branches that have ever existed as at FY’2018 |
Highest number of branches that have ever existed as at FY’2019 |
Highest number of branches that have ever existed as at FY’2020 |
Number of branches opened in 2021 |
Closed branches |
Current number of Branches |
Number of branches expected to be opened |
Projected number of branches FY’2021 |
|
Naivas |
Local |
46 |
61 |
69 |
5 |
0 |
74 |
1 |
75 |
|
QuickMart |
Local |
10 |
29 |
37 |
4 |
0 |
41 |
4 |
45 |
|
Chandarana Foodplus |
Local |
14 |
19 |
20 |
0 |
0 |
20 |
0 |
20 |
|
Carrefour |
International |
6 |
7 |
9 |
4 |
0 |
13 |
2 |
15 |
|
Cleanshelf |
Local |
9 |
10 |
11 |
1 |
0 |
12 |
0 |
12 |
|
Tuskys |
Local |
53 |
64 |
64 |
0 |
61 |
3 |
0 |
3 |
|
Game Stores |
International |
2 |
2 |
3 |
0 |
0 |
3 |
0 |
3 |
|
Uchumi |
Local |
37 |
37 |
37 |
0 |
35 |
2 |
0 |
2 |
|
Choppies |
International |
13 |
15 |
15 |
0 |
13 |
2 |
0 |
2 |
|
Shoprite |
International |
2 |
4 |
4 |
0 |
3 |
1 |
0 |
1 |
|
Nakumatt |
Local |
65 |
65 |
65 |
0 |
65 |
0 |
0 |
0 |
|
Total |
257 |
313 |
334 |
14 |
177 |
171 |
7 |
178 |
|
Source: Online Research
The performance of the retail sector is expected to improve supported by i) consistent expansion by local and international retailers taking up prime retail spaces left by cash-strapped retailers, ii) increased clientele base aiming to increase footprint and boost profits, iii) international financing deals and partnerships to increase funding, and, iv) the increasing middle income population with high need to finance their lifestyles, taste and preferences. However, performance is expected to continue being constrained by factors such as e-commerce reducing need for physical space, the current oversupply of retail space at 3.1 mn SQFT in the Nairobi Metropolitan Area (NMA) and tough economic times reducing disposable income for majority of Kenyans.
- Hospitality Sector
During the week, the British government announced that the United Kingdom has retained Kenya in its ‘Red List’ of countries whose nationals are barred from entering the United Kingdom (UK) due to concerns of the Covid-19 Delta variant. The Kenyan ban came into effect in April 2021 and has now been extended for a further 21 days with the next review expected on 5th August. The ban comes after 50 other countries decided to deny access to tourists bearing Kenyan passports into their territories for the same reasons despite increasing demand for tourists due to summer vacations in Europe. Kenya had lifted the ban on flights between Nairobi and London in May 2021 after a retaliation ban in April 2021, and reduced the restrictions for self-isolation in June 2021, after bilateral talks with the UK.
The move by the UK is expected to reduce the expected number of international arrivals and activities in the tourism sector as tourists shy away from the country due to fears of contracting the Delta Covid-19 variant, worsened by the current lockdown and curfews in the Western side of the country to curb the spread of the same. According to International Tourism Performance Report January to June 2021, by the Tourism Research Institute (TRI), Kenya registered a 21.7% decline in the number of international arrivals between January and June 2021 compared to a similar period in 2020. The report indicated that the UK was the fifth highest source market of tourists in the country with 16,264 persons representing a 5.3% of the 305,635 total arrivals. The highest number of visitor arrivals were from the United States of America (USA) and Uganda, which registered total number of tourists at 49,178 and 31,418, respectively.
The graph below shows the number of international arrivals from January 2020 to June 2021;
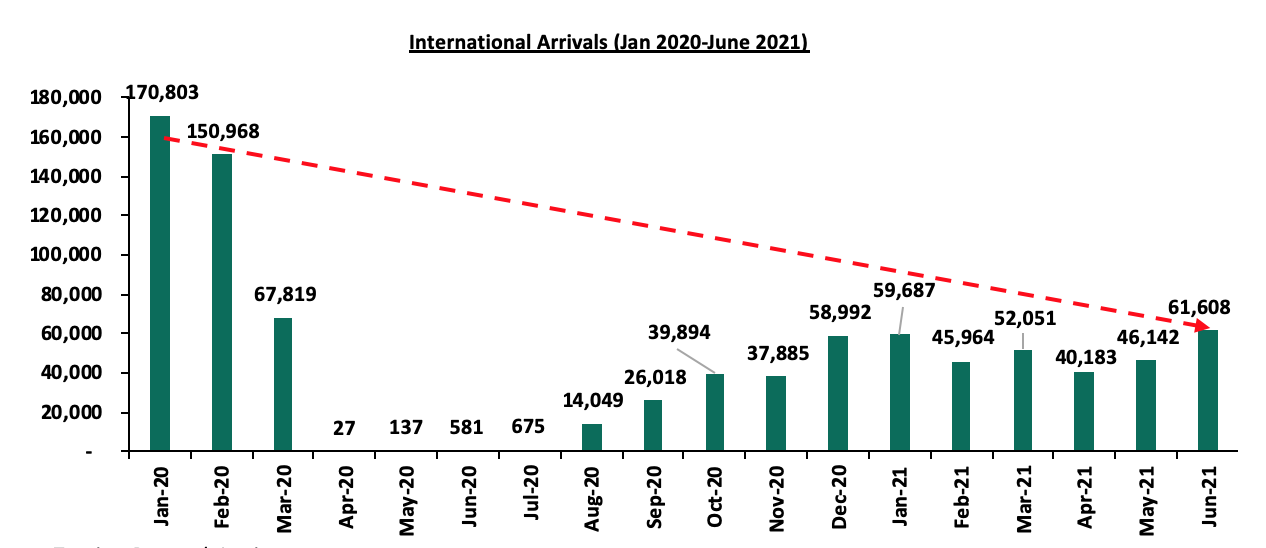
Source: Tourism Research Institute
The hospitality sector performance is expected to continue being affected by its reliance on the tourism industry which is expected to continue recording a lower number of international arrivals compared to the pre-Covid period, attributed to travel bans and restrictions. Despite the low numbers, we expect better performance in the second half of 2021 to following the government’s continued efforts to boost the sector through favorable budgetary allocations, increase in activities such as the recently concluded World Rally Championships (WRC) which has been announced to run every year up to 2026, and the priority of the sector players in vaccination plans.
The real estate sector performance is expected to be supported by increased funding for the student housing sector, the mortgage solutions provided by key financial players in the market such as banks, and the expansion by local retailers taking up prime retail spaces left by troubled retailers. However, increase in loan defaults in the real estate sector, and the travel bans and restrictions will have an impact on the number of tourists arriving into the country, thereby constraining performance real estate sector.
In July 2020, we released the Nairobi Metropolitan Area Land Report 2020 which highlighted that in 2019/2020 the land sector recorded an annual capital appreciation of 1.5%, compared to the price correction of 0.3% recorded in 2018/2019, attributed to increased demand for land mainly in the low rise residential areas and satellite towns. Asking land prices in low rise residential areas recorded a 3.8% capital appreciation y/y, attributed to the availability of development land in these areas. Additionally, people are attracted to these areas as they are sparsely populated, thus offering exclusivity and privacy. Unserviced land in satellite towns such as Ruaka also recorded a capital appreciation of 3.8% y/y, attributable to the growing demand for land in these areas fueled by the demand for housing by the growing working population as the areas act as Nairobi’s dormitory, coupled by the improving infrastructure.
This week, we update our report by highlighting the various factors affecting the NMA land sector, market performance based on selling prices and the annual capital appreciation, as well as identify investment opportunities for the sector, using 2021 market research data. Therefore, in this topical we shall focus on;
- Introduction to the Nairobi Metropolitan Area (NMA) Land Sector,
- NMA Land Sector Performance 2021 Based on Various Locations,
- Summary and Investment Opportunity in the Sector, and,
- Conclusion and Outlook for the Sector.
- Introduction to the Nairobi Metropolitan Area (NMA) Land Sector
The Nairobi Metropolitan Area (NMA) land sector registered improvement in activities in 2020/2021 despite the tough economic environment and an oversupply in select sectors of real estate such as the commercial office sector of 7.3mn SQFT. Some of the factors that supported the performance of the sector in 2020/2021 include;
- Improving infrastructure with the government aggressively focusing on the implementation and conclusion of the various projects such as the Lamu Port-South Sudan-Ethiopia Transport (LAPSSET) project whose first berth was completed and launched in May 2021, Nairobi Expressway which is expected to be completed by February 2022 (six months ahead of its initial December 2022 completion date), and, the Western Bypass, among many other projects, which will in turn boost property prices and open up surrounding areas for real estate development,
- The 0.6% and 33.6% improved budget allocation for the infrastructure, and, Housing, Urban Development and Public Works sectors in FY’ 2021/22 to Kshs 182.5 bn and Kshs 21.8 bn, respectively, from the Kshs 181.4 bn and Kshs 16.2 bn allocated in FY’2020/21, respectively. The improved allocations for the sectors is also expected to significantly increase development activities in the infrastructure and housing sectors which in return will source for improved demand for land and its overall upward performance,
- The increasing focus on the affordable housing agenda by the government and other private developers hence creating demand for land especially in the satellite towns of NMA,
- Relatively high population growth rates and urbanization rates of 2.3% and 4.0%, respectively in Kenya, against a global average of 1.1% and 1.9%, respectively, and,
- Reduced supply of development land at affordable prices in areas close to the Nairobi CBD resulting in demand for the same in satellite towns.
Contrary to the aforementioned supporting factors, the sector’s performance was still impeded by;
- Reduced spending power by prospective clients attributed to the tough economic condition brought about by the pandemic hence crippling performance of the sector, in addition to the increased unemployment rate with approximately 0.9 mn people having lost their jobs in 2020, thereby bringing the unemployment rate in Kenya to 36.1% in Q3’2020 from 33.9% in Q3’2019, according to the Quarterly Labour Force Report-Q3’2020 by the Kenya National Bureau of Statistics (KNBS),
- Reduced development activities in the real estate sector in the wake of the pandemic brought about by limited access to financing, and, oversupply in select sectors of real estate such as the commercial office and retail sectors of 7.3 mn SQFT and 3.1 mn SQFT in NMA, respectively, forcing developers halt their plans as they await the absorption of the current space,
- Inadequate infrastructure despite government’s efforts to initiate and implement projects in the infrastructure sector, thereby hindering accessibility and investment opportunities in various parts within the NMA, and,
- High mortgage lending interest rates currently averaging at 10.9%, and longer credit transaction timelines impeding access to loans, thereby also negatively affecting performance of the land sector due to limited purchasing and development power of prospective clients.
Despite the challenges affecting the sector, some of the factors that are likely to shape it going forward include;
- Stamp Duty (Valuation of Immovable Property) Regulations 2020- In a bid to shorten and ease land transaction timelines and processes in Kenya, the National Treasury Secretary, Hon Ukur Yatani published the Stamp Duty (Valuation of Immovable Property) Regulations 2020, in October 2020. In addition to simplifying land transactions, the move also boosts confidence in undertaking land transactions in the country thus improving performance of the land sector through increased demand and uptake, as well as boost prices of various regions,
- Digitization of Land Records- In a bid to curb fraud cases and ease land transaction processes, President Uhuru Kenyatta launched the National Land Information Management System (NLIMS) in April 2021, marking the culmination of years of digitization of land records in Kenya. The launch of the digital land platform named ‘Ardhi Sasa’, which was first rolled out in Nairobi then in other counties in phases, coincided with the opening of the National Geospatial Data Centre, an online depository that will contain all the land records in Kenya, and,
- E-Construction Permit System- The system which also includes the QR code system was launched by City Hall in March 2020 to improve building plan approval performances, however was compromised in June 2021 forcing its operations to be withheld, and has since been under renovation with operations expected to resume in August 2021. With its revamp, it will further enable easier and faster building plan approvals which in return will boost land development activities through various construction activities which initiate improved demand for land.
- NMA Land Sector Performance 2021 Based on Various Locations
For the analysis, we conducted research on various major towns within the NMA and classified them as follows;
- High Rise Residential Areas: They comprise of areas such as Kileleshwa, Dagoretti, Githurai, Embakasi, and Kasarani, and are majorly characterized by the numerous high rise buildings such as the apartments found within,
- Low Rise Residential Areas: These are areas which generally consist of low rise buildings such as the bungalows, maisonettes and villas. They include; Kitisuru, Runda, Ridgeways, Karen and Spring Valley,
- Commercial Zones: They comprise of areas such as Kilimani, Westlands, Riverside and Upperhill, and are popular because of the numerous commercial office buildings that they have, and,
- Satellite Towns: Land in the area was categorized into serviced (site and service schemes) and unserviced land.
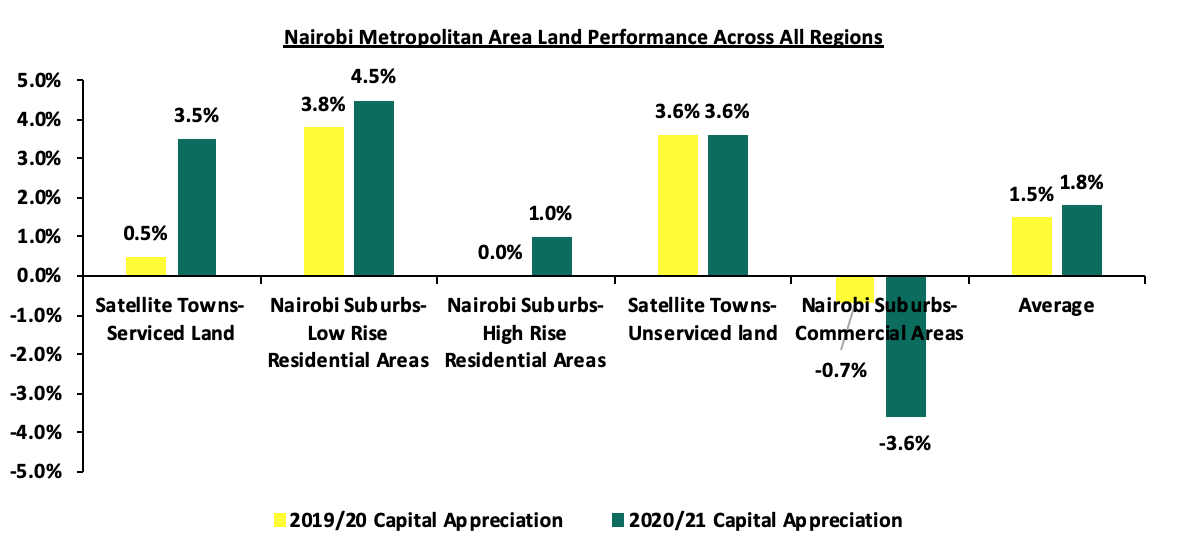
The NMA land sector on overall recorded an average annual capital appreciation of 1.8% in 2020/2021, 0.3% points increase when compared to the 1.5% realized in 2019/2020, with asking prices averaging at Kshs 127.8 mn thereby realizing a 9-year CAGR of 12.2%. The improvement in performance was mainly attributed to the increased demand for land in low rise areas which recorded the highest annualized capital appreciation of 4.6% compared to a market average of 1.8%. However, land prices in the commercial areas of the NMA registered the highest price correction declining by 3.6% attributed to unaffordability with their current average prices coming in at Kshs 404.4 mn compared to a market average of Kshs 127.8 mn, coupled with the limited development activities in the real estate commercial office sector and an oversupply of 7.3mn SQFT as at 2020.
The summary of the performance is as shown below;
The table below shows a 9-year performance summary of the NMA land sector based on the average asking prices, CAGR and capital appreciation;
All Values in Kshs Unless Stated Otherwise
|
Summary of the Land Performance Across All regions in Nairobi Metropolitan Area |
|||||||||||
|
Location |
*Price in 2011 |
*Price in 2015 |
*Price in 2016 |
*Price in 2017 |
*Price 2018/19 |
*Price 2019/20 |
*Price 2020/21 |
CAGR |
2019/20 Capital Appreciation |
2020/21 Capital Appreciation |
∆ in capital appreciation |
|
NMA Low Rise Residential Areas |
35.6 mn |
67.8 mn |
78.4 mn |
82.4 mn |
81.0 mn |
84.2 mn |
87.9 mn |
10.6% |
3.8% |
4.5% |
0.6% |
|
Satellite Towns-Unserviced land |
4.2 mn |
9.5 mn |
12.8 mn |
13.8 mn |
14.2 mn |
14.7 mn |
15.2 mn |
15.4% |
3.6% |
3.6% |
0.0% |
|
Satellite Towns-Serviced land |
5.5 mn |
12.7 mn |
14.0 mn |
15.0 mn |
14.2 mn |
15.0 mn |
15.7 mn |
13.3% |
0.5% |
3.5% |
3.0% |
|
NMA High Rise Residential Areas |
52.6 mn |
91.4 mn |
109.2 mn |
117.0 mn |
116.6 mn |
115.6 mn |
115.8 mn |
9.7% |
0.0% |
1.0% |
0.6% |
|
Commercial Areas- NMA |
145.0 mn |
359.3 mn |
421.8 mn |
433.0 mn |
421.0 mn |
419.0 mn |
404.6 mn |
12.3% |
(0.7%) |
(3.6%) |
(3.0%) |
|
Average |
48.6 mn |
108.1 mn |
127.2 mn |
132.2 mn |
129.4 mn |
129.7 mn |
127.8 mn |
12.2% |
1.5% |
1.8% |
0.3% |
|
· The NMA land sector on overall recorded an average annual capital appreciation of 1.8% in 2020/2021, a 0.3% points increase when compared to the 1.5% realized in 2019/2020 mainly attributed to the increased demand for land in low rise areas which recorded the highest price appreciation of 4.5% when compared to the market average capital appreciation of 1.8% |
|||||||||||
Source: Cytonn Research
Performance per node:
- Nairobi Suburbs-Low Rise Residential Areas
The average asking prices and annual capital appreciation for land in the low rise areas came in at Kshs 87.9 mn and 4.5%, respectively, in 2020/2021. The performance was attributable to; i) serene environments hence attracting high end income earners, ii) sufficient amenities, iii) adequate infrastructure boosting investment opportunities and price boosts and, iv) their strategic locations in sparsely populated zones hence enhancing privacy. Kitisuru was the best performing node registering annual capital appreciation of 6.3%, a 3.3% points higher than the 3.0% recorded in 2019/2020, attributable to the increasing demand and accessibility of the area due to improving infrastructure.
All values is Kshs unless stated otherwise
|
Land Performance-Low Rise Residential Areas in Nairobi Metropolitan Area 2020/21 |
|||||||||||
|
Location |
*Price in 2011 |
*Price in 2015 |
*Price in 2016 |
*Price in 2017 |
*Price 2018/19 |
*Price 2019/20 |
*Price 2020/21 |
CAGR |
2019/20 Capital Appreciation |
2020/21 Capital Appreciation |
∆ in capital appreciation |
|
Kitisuru |
32.0 mn |
59.0 mn |
70.0 mn |
70.0 mn |
71.0 mn |
73.0 mn |
77.9 mn |
10.4% |
3.0% |
6.3% |
3.3% |
|
Karen |
25.0 mn |
40.0 mn |
46.0 mn |
52.0 mn |
53.0 mn |
56.0 mn |
59.0 mn |
10.0% |
5.6% |
5.1% |
(0.5%) |
|
Ridgeways |
24.0 mn |
51.0 mn |
62.0 mn |
68.0 mn |
65.0 mn |
66.0 mn |
68.8 mn |
12.4% |
1.8% |
4.0% |
2.2% |
|
Runda |
33.0 mn |
58.0 mn |
67.0 mn |
68.0 mn |
68.0 mn |
70.0 mn |
72.8 mn |
9.2% |
3.3% |
3.8% |
0.5% |
|
Spring Valley |
64.0 mn |
131.0 mn |
147.0 mn |
154.0 mn
|
148.0 mn |
156.0 mn |
161.0 mn |
10.8% |
5.4% |
3.1% |
(2.3%) |
|
Average |
35.6 mn |
67.8 mn |
78.4 mn |
82.4 mn |
81.0 mn |
84.2 mn |
87.9 mn |
10.6% |
3.8% |
4.5% |
0.6% |
|
· Low rise residential areas registered the highest capital appreciation of 4.5% against the market average of 1.8% in 2020/2021 attributed to their serene environment, adequate infrastructure and amenities, and strategic location enhancing privacy · Kitisuru was the best performing node registering annual capital appreciation of 6.3%, a 3.3% points higher than the 3.0% recorded in 2019/2020, attributable to the increasing demand and accessibility of the area due to improving infrastructure |
|||||||||||
Source: Cytonn Research
- Satellite Towns-Unserviced Land
The unserviced land in satellite towns recorded an average annualized capital appreciation of 3.6% in 2020/2021 with the average asking prices coming in at Kshs 15.2 mn, thereby realizing a 9-year CAGR of 15.4%. The performance was mainly driven by factors such as affordability when compared to areas such as the low and high rise areas which registered average asking prices of Kshs 87.9 mn and Kshs 115.8 mn, respectively, urban sprawl, and improving infrastructure servicing the areas. Ruiru was the best performing node registering highest annual market capital appreciation and average selling prices of 6.9% and Kshs 23.6 mn, respectively, mainly attributable to the availability of infrastructure supporting easier access to the area such as the Thika Super Highway, and, increased demand for land to develop student housing facilities as the area serves various educational centers among other factors.
All values is Kshs unless stated otherwise
|
Land Performance-Satellite Towns in Nairobi Metropolitan Area- Unserviced Land |
|||||||||||
|
Location |
*Price in 2011 |
*Price in 2015 |
*Price in 2016 |
*Price in 2017 |
*Price 2018/19 |
*Price 2019/20 |
*Price 2020/21 |
CAGR |
2019/20 Capital Appreciation |
2020/21 Capital Appreciation |
∆ in capital appreciation |
|
Ruiru |
7.0 mn |
15.0 mn |
19.0 mn |
20.0 mn |
21.0 mn |
22.0 mn |
23.6 mn |
14.5% |
6.2% |
6.9% |
0.7% |
|
Juja |
3.0 mn |
7.0 mn |
9.0 mn |
10.0 mn |
10.0 mn |
10.0 mn |
10.6 mn |
15.1% |
3.4% |
5.5% |
2.1% |
|
Athi River |
2.0 mn |
3.0 mn |
4.0 mn |
4.0 mn |
4.0 mn |
4.0 mn |
4.2 mn |
8.6% |
3.4% |
5.1% |
1.7% |
|
Utawala |
6.0 mn |
9.0 mn |
10.0 mn |
11.0 mn |
12.0 mn |
12.0 mn |
12.4 mn |
8.4% |
4.1% |
3.2% |
(0.9%) |
|
Limuru |
5.0 mn |
13.0 mn |
17.0 mn |
20.0 mn |
20.0 mn |
21.0 mn |
21.2 mn |
17.4% |
2.9% |
1.0% |
(1.9%) |
|
Ongata Rongai |
2.0 mn |
10.0 mn |
18.0 mn |
18.0 mn |
18.0 mn |
19.0 mn |
19.0 mn |
28.4% |
1.6% |
0.0% |
(1.6%) |
|
Average |
4.2 mn |
9.5 mn |
12.8 mn |
13.8 mn |
14.2 mn |
14.7 mn |
15.2 mn |
15.4% |
3.6% |
3.6% |
0.0% |
|
· The unserviced land in satellite towns recorded an average annualized capital appreciation 3.6% in 2020/2021 with the average asking prices coming in at Kshs 15.2 mn, thereby realizing a 9-year CAGR of 15.4% · Ruiru was the best performing node registering highest annual market capital appreciation and average selling prices of 6.9% and Kshs 23.6 mn, respectively, mainly attributable to the availability of infrastructure supporting easier access to the area such as the Thika Super Highway, and, increased demand for land to develop student housing facilities as the area serves various educational centers among other factors |
|||||||||||
Source: Cytonn Research
- Satellite Towns-Serviced Land
Serviced land performance in NMA’s satellite towns registered a 9-year CAGR of 13.3%, with asking prices coming in at Kshs 15.7 mn in 2020/2021, 4.7% points up from the Kshs 15.0 mn recorded in 2019/2020, whereas average annual capital appreciation came in at 3.5%. Performance in the sector was mainly driven by the relatively affordable selling prices, improving infrastructure and positive demographics. Additionally, serviced land offers greater investment opportunity attributable to the advantage of easier accessibility to amenities such as water, drainage systems and, electricity among many other amenities, hence performance better when compared to unserviced land performance of similar areas. Ongata Rongai registered the highest annual capital appreciation of 8.9% when compared to the market average of 3.5% signifying robust demand for land in the area by a growing middle income class, positive demographics and, availability of infrastructure with the area being served by the Magadi Road which is opening the area for real estate development.
All values is Kshs unless stated otherwise
|
Land Performance-Satellite Towns in Nairobi Metropolitan Area- Serviced Land |
|||||||||||
|
Location |
*Price in 2011 |
*Price in 2015 |
*Price in 2016 |
*Price in 2017 |
*Price 2018/19 |
*Price 2019/20 |
*Price 2020/21 |
CAGR |
2019/20 Capital Appreciation |
2020/21 Capital Appreciation |
∆ in capital appreciation |
|
Ongata Rongai |
7.0 mn |
16.0 mn |
19.0 mn |
19.0 mn |
19.0 mn |
18.0 mn |
19.8 mn |
12.2% |
(3.8%) |
8.9% |
12.7% |
|
Athi River |
2.0 mn |
11.0 mn |
13.0 mn |
13.0 mn |
12.0 mn |
12.0 mn |
13.1 mn |
23.2% |
3.5% |
8.7% |
5.2% |
|
Ruiru |
8.0 mn |
18.0 mn |
19.0 mn |
21.0 mn |
23.0 mn |
24.0 mn |
25.3 mn |
13.6% |
5.8% |
5.2% |
(0.6%) |
|
Thika |
5.0 mn |
7.0 mn |
8.0 mn |
10.0 mn |
10.0 mn |
10.0 mn |
10.4 mn |
8.5% |
0.5% |
3.5% |
3.0% |
|
Syokimau-Mlolongo |
3.0 mn |
12.0 mn |
12.0 mn |
12.0 mn |
12.0 mn |
12.0 mn |
11.8 mn |
16.4% |
(3.8%) |
(1.4%) |
2.4% |
|
Ruai |
8.0 mn |
12.0 mn |
13.0 mn |
15.0 mn |
14.0 mn |
14.0 mn |
13.5 mn |
6.0% |
1.0% |
(3.6%) |
(4.6%) |
|
Average |
5.5 mn |
12.7 mn |
14.0 mn |
15.0 mn |
15.0 mn |
15.0 mn |
15.7 mn |
13.3% |
0.5% |
3.5% |
3.0% |
|
· Ongata Rongai registered the highest annual capital appreciation of 8.9% when compared to the market average of 3.5% signifying robust demand for land in the area by a growing middle income class, positive demographics and, availability of infrastructure with the area being served by the Magadi Road which is opening the area for real estate development |
|||||||||||
Source: Cytonn Research
- Nairobi Suburbs- High Rise Residential Areas
Land in the high rise residential areas of Nairobi recorded an annualized capital appreciation of 1.0% in 2020/2021 from 0.0% annualized price appreciation in 2019/2020, with asking prices registering a slight improvement to Kshs 115.8 mn from Kshs 115.6 mn registered in 2019/2020, attributable to the slight increase in the demand for land in the areas. Embakasi was the best performing node registering annual capital appreciation of 6.3% against the market average of 1.0% attributable to positive demographics, a fast growing middle income class with disposable income, and an improving infrastructure with the area being serviced by roads such as the Outering road and Manyanja road among many others.
All values is Kshs unless stated otherwise
|
Land Performance-High Rise Residential Areas in Nairobi Metropolitan Area 2020/21 |
|||||||||||
|
Location |
*Price in 2011 |
*Price in 2015 |
*Price in 2016 |
*Price in 2017 |
*Price 2018/19 |
*Price 2019/20 |
*Price 2020/21 |
CAGR |
2019/20 Capital Appreciation |
2020/21 Capital Appreciation |
∆ in capital appreciation |
|
Embakasi |
33.0 mn |
61.0 mn |
60.0 mn |
70.0 mn |
61.0 mn |
63.0 mn |
67.2 mn |
8.2% |
(4.4%) |
6.3% |
10.7% |
|
Kasarani |
32.0 mn |
51.0 mn |
60.0 mn |
64.0 mn |
66.0 mn |
65.0 mn |
67.7 mn |
8.7% |
5.7% |
3.9% |
(1.8%) |
|
Kileleshwa |
149.0 mn |
227.0 mn |
286.0 mn |
306.0 mn |
311.0 mn |
303.0 mn |
300.9 mn |
8.1% |
(2.6%) |
(0.7%) |
1.9% |
|
Githurai |
21.0 mn |
37.0 mn |
45.0 mn |
46.0 mn |
45.0 mn |
44.0 mn |
43.5 mn |
8.4% |
(1.4%) |
(1.2%) |
0.2% |
|
Dagoretti |
28.0 mn |
81.0 mn |
95.0 mn |
99.0 mn |
100.0 mn |
103.0 mn |
99.7 mn |
15.2% |
2.5% |
(3.3%) |
(5.8%) |
|
Average |
52.6 mn |
91.4 mn |
109.2 mn |
117.0 mn |
116.6 mn |
115.6 mn |
115.8 mn |
9.7% |
0.0% |
1.0% |
1.0% |
|
· Embakasi was the best performing node registering annual capital appreciation of 6.3% against the market average of 1.0% attributable to positive demographics, a fast growing middle income class with disposable income, and an improving infrastructure with the area being serviced by roads such as the Outering road and Manyanja road among many others |
|||||||||||
Source: Cytonn Research
- Nairobi Suburbs- Commercial Zones
The commercial zones recorded a 3.6% price correction in the average asking prices of land from Kshs 419.0 mn in 2019/2020 to 404.6 mn in 2020/2021. The performance is majorly attributed to the reduced development activities coupled with the existing oversupply of 7.3 mn SQFT and 3.1 mn SQFT of space in NMA’s commercial office and retail sectors, respectively, thereby crippling investment opportunity in the areas, which in return has resulted to a decline in the demand for land. Additionally, due to the existing oversupply, developers have halted their plans to allow for absorption of the current space.
All values is Kshs unless stated otherwise
|
Land Performance-Commercial Zones in Nairobi Metropolitan Areas 2020/21 |
|||||||||||
|
Location |
*Price in 2011 |
*Price in 2015 |
*Price in 2016 |
*Price in 2017 |
*Price 2018/19 |
*Price 2019/20 |
*Price 2020/21 |
CAGR |
2019/20 Capital Appreciation |
2020/21 Capital Appreciation |
∆ in capital appreciation |
|
Westlands |
150.0 mn |
350.0 mn |
453.0 mn |
474.0 mn |
430.0 mn |
421.0 mn |
413.6 mn |
11.9% |
(1.9%) |
(1.8%) |
0.1% |
|
Upper Hill |
200.0 mn |
450.0 mn |
512.0 mn |
510.0 mn |
488.0 mn |
506.0 mn |
487.3 mn |
10.4% |
3.8% |
(3.8%) |
(7.6%) |
|
Kilimani |
114.0 mn |
294.0 mn |
360.0 mn |
387.0 mn |
403.0 mn |
398.0 mn |
381.7 mn |
14.4% |
(1.2%) |
(4.3%) |
(3.1%) |
|
Riverside |
116.0 mn |
343.0 mn |
362.0 mn |
361.0 mn |
363.0 mn |
351.0 mn |
335.7 mn |
12.5% |
(3.3%) |
(4.6%) |
(1.3%) |
|
Average |
145.0 mn |
359.3 mn |
421.8 mn |
433.0 mn |
421.0 mn |
419.0 mn |
404.6 mn |
12.3% |
(0.7%) |
(3.6%) |
(3.0%) |
|
· The commercial zones recorded a 3.6% price correction in the average asking prices of land from Kshs 419.0 mn in 2019/2020 to 404.6 mn in 2020/2021 attributable to reduced development activities and existing oversupply of 7.3 mn SQFT and 3.1mn SQFT of space in NMA’s commercial office and retail sectors, respectively · Despite this, Westlands registered a 0.1% improvement in its Y/Y capital appreciation to (1.8%) in 2020/21 from (1.9%) registered in 2019/2020, attributable to the robust growth of its infrastructure sector such as the development of the Nairobi Expressway opening up areas for investment opportunities, adequate amenities, and, its close proximity to Nairobi’s Central Business District (CBD) |
|||||||||||
Source: Cytonn Research
- Summary and Investment Opportunity in The Sector
The table below summarizes the performance of the various areas:
|
Summary and Conclusions- y/y Capital Appreciation Nairobi Metropolitan Area |
|
|
Unserviced Land Capital Appreciation |
|
|
2020/2021 |
Areas |
|
>5.0% |
Ruiru, Juja, Athi River, Kitisuru, Karen, Embakasi |
|
1.0%- 4.9% |
Limuru, Utawala, Ridgeways, Runda, Spring Valley, Kasarani |
|
<1.0% |
Githurai, Dagorreti, Kileleshwa, Kilimani, Westlands, Riverside, Upper Hill |
|
Site and Service Capital Appreciation |
|
|
2020/2021 |
Areas |
|
>5.0% |
Athi River, Ongata Rongai, Ruiru |
|
1.0%- 4.9% |
Thika |
|
<1.0% |
Ruai, Syokimau- Mlolongo |
Source: Cytonn Research
Investment Opportunity
- Low rise residential areas- The investment opportunity in this sector lies in Kitisuru which recorded the highest annual capital appreciation of 6.3% against the market average attributed to the relatively high demand as well as relatively affordable prices having recorded an average market selling price of Kshs 77.9 mn against the market average of Kshs 87.9 mn,
- Satellite towns (unserviced land)- The investment opportunity in this sector lies in Ruiru submarket which registered the highest Y/Y capital appreciation and average selling prices of 6.9% and Kshs 23.6 mn mainly attributable to the adequate infrastructure supporting easier access and investment opportunities, with the area being served with roads such as Thika superhighway, and, increased demand for land to develop student housing facilities as the area serves various educational centers among other factors,
- Satellite towns (serviced land)- Ongata Rongai and Athi River present the best investment opportunity having recorded capital appreciations of 8.9% and 8.7%, respectively, in 2020/2021 against the 1.7% market average, attributable to robust demand by the existing growing middle class coupled with the adequacy and ease of access to amenities,
- High rise residential areas- Embakasi presents a greater investment opportunity in this sector having recorded the highest Y/Y capital appreciation of 6.3% attributed to a growing middle income with disposable income, positive demographics and improving infrastructure, and,
- Commercial zones- Westlands presents the best investment opportunity in this sector having registered a 0.1% improvement in its Y/Y capital appreciation to (1.8%) in 2020/2021 from (1.9%) registered in 2019/2020, attributable to the robust growth of its infrastructure sector such as the development of the Nairobi Expressway opening up areas for investment opportunities, adequate amenities, and, its close proximity to Nairobi’s Central Business District (CBD).
- Conclusion and Outlook for The Sector
|
Indicator |
2020 Projections |
2021 Projections |
2020 Outlook |
2021 Outlook |
|
Infrastructure Development |
|
|
Neutral |
Positive |
|
Legal Reforms |
|
|
Positive |
Positive |
|
Credit Supply |
|
|
Negative |
Negative |
|
Real Estate Activities |
|
|
Neutral |
Neutral |
|
Performance |
|
|
Neutral |
Positive |
We have three positive outlooks for infrastructure development, legal reforms and land sector performance, one neutral outlook for real estate activities and one negative outlook for credit supply bringing the total outlook of the sector to POSITIVE. We therefore expect its performance to be further boosted by robust infrastructure activities ongoing, increased demand for developments going forward and positive demographics, despite factors such as reduced spending power owed to the tough economic conditions and the inadequate infrastructure in some areas of the country still impeding its performance.
Disclaimer: The views expressed in this publication are those of the writers where particulars are not warranted. This publication, which is in compliance with Section 2 of the Capital Markets Authority Act Cap 485A, is meant for general information only and is not a warranty, representation, advice or solicitation of any nature. Readers are advised in all circumstances to seek the advice of a registered investment advisor.

- Talk to us
- Kenya
- P.O Box 20695 - 00200, Nairobi, Kenya
- Cell +254709101200
- Tel +254709101200
- WhatsApp +254741676635
- United States
- +254709101200
- DOWNLOAD OUR APP
-


- Kenya
- 8th Floor, Pinetree Plaza, Kaburu Drive, Ngong Road, Nairobi, Kenya
- USA
- Suite 1150, 1775 Eye Street NW, USA, Washington DC 20006, USA
- Investments
- High Yield
- Private Equity
- Real Estate
- Real Estate
- RiverRun Estates
- Cytonn Towers
- The Ridge
- Taraji Heights
- The Alma