Nairobi Metropolitan Area (NMA) Land Report 2023, & Cytonn Weekly #28/2023
By Cytonn Research, Jul 16, 2023
Executive Summary
Fixed Income
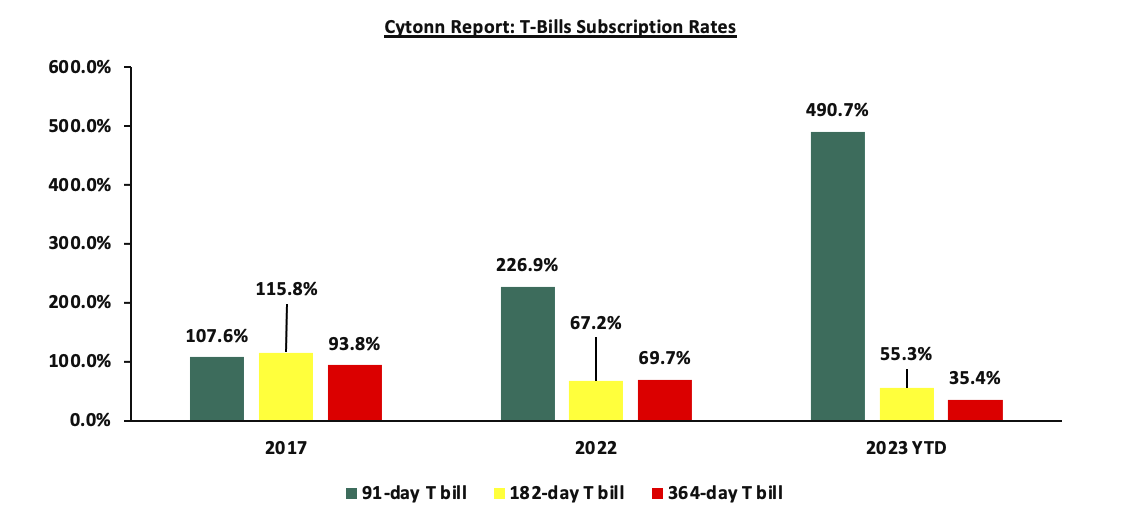
During the week, T-bills were oversubscribed for the second consecutive week, with the overall subscription rate coming in at 151.8%, up from an oversubscription rate of 125.5% recorded the previous week. Investors’ preference for the shorter 91-day paper persisted as they sought to avoid duration risk, with the paper receiving bids worth Kshs 33.3 bn against the offered Kshs 4.0 bn, translating to an oversubscription rate of 833.1%, up from 667.7% recorded the previous week. The subscription rate for the 364-day paper decreased to 17.7%, down from 22.7% recorded the previous week, while the subscription rate for the 182-day paper increased to 13.5%, from 11.4% recorded the previous week. The government accepted all the bids of Kshs 36.4 bn. The yields on the government papers continued to rise, with the yields on the 364-day, 182-day, and 91-day papers increasing by 20.2 bps, 7.2 bps, and 9.5 bps to 12.5%, 12.3% and 12.1% respectively;
In the primary market, the Central Bank of Kenya released the auction results for the newly issued bond FXD1/2023/05 with a tenor to maturity of 5 years and the re-opened bond FXD1/2016/10 with a 3.2-year tenor to maturity. In line with our expectations, the bonds recorded an oversubscription rate of 129.4%, receiving bids worth Kshs 51.8 bn against the offered Kshs 40.0 bn. The government accepted bids worth Kshs 38.6 bn, translating to an acceptance rate of 74.5%. The weighted average yield of accepted bids came in at 16.3% and 16.8% for FXD1/2016/10 and FXD1/2023/05, respectively. The coupon rate for the FXD1/2016/10 and FXD1/2023/05 is set at 15.0% and 16.8%, respectively. Notably, the interest on FXD1/2023/5 will be subjected to a withholding tax (WHT) at a rate of 15.0%, while the interest on FXD1/2016/10 will be subjected to a 10.0% withholding tax rate. The FXD1/2016/10 bond's lower WHT served to increase investor attraction;
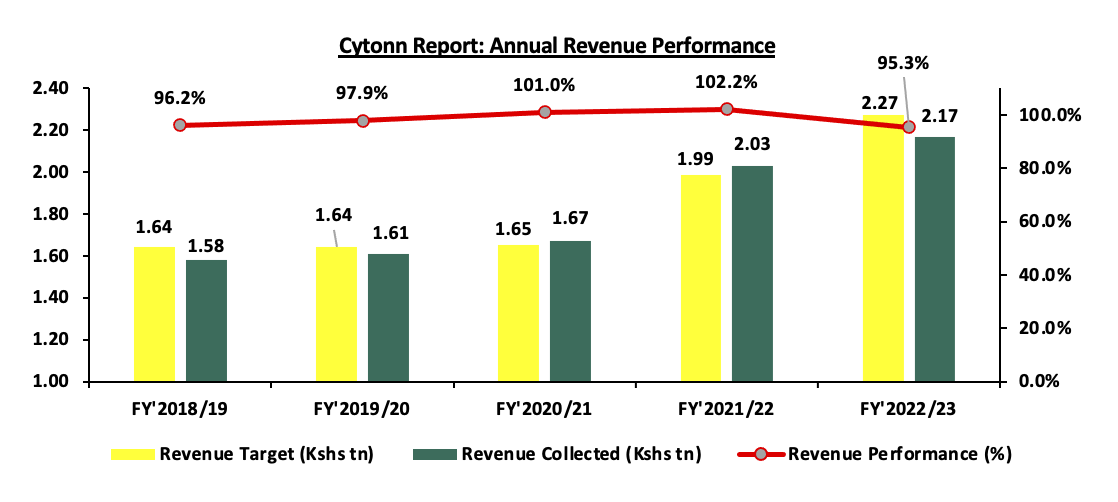
Additionally, during the week, the Kenya Revenue Authority (KRA) released the annual revenue performance for FY’2022/2023 highlighting that the total revenue collection amounted to Kshs 2.2 tn against the target of Kshs 2.3 tn, translating to a target achievement of 95.3%;
Also, during the week, the Energy and Petroleum Regulatory Authority (EPRA) released their monthly statement on the maximum retail fuel prices in Kenya, effective 15 July 2023 to 14 August 2023. Notably, prices for Super Petrol and Kerosene declined 0.4% and 2.3% to Kshs 194.7 and Kshs 169.5, respectively, from Kshs 195.5 and 173.4 per litre. However, the price of diesel remained unchanged at Kshs 179.7 per litre;
Recently, the United Nations Conference on Trade and Development (UNCTD) released the 2023 World Investment Report, highlighting that Kenya recorded an enormous growth in Foreign Direct Investment (FDI), having grown by 63.9% to USD 759.1 mn in 2022 from USD 463.0 mn in 2021 after a five-year dip leading to 2021. The significant increase is mainly attributable to a range of policy interventions to mobilize resources and investments within the renewable energy sector;
Equities
During the week, the equities market was on an upward trajectory, with NASI and NSE 25 each gaining by 2.3%, while NSE 20 gained by 0.4%, taking the YTD performance to losses of 10.5%, 3.0%, and 7.5% for NASI, NSE 20, and NSE 25, respectively. The equities market's performance was mainly driven by gains recorded by large-cap stocks such as Equity Group, KCB Group, and EABL of 7.6%, 3.4%, and 3.3%, respectively. The gains were, however, weighed down by losses recorded by stocks such as Diamond Trust Bank–Kenya and BAT of 4.7% and 2.1%, respectively;
Real Estate
During the week, Fahari I-REIT closed the week trading at an average price of Kshs 6.3 per share in the Nairobi Securities Exchange, representing a 4.7% gain from the Kshs 6.0 per share recorded the previous week. On the Unquoted Securities Platform as at 7 July 2023, Acorn D-REIT and I-REIT closed the week trading at Kshs 23.9 and Kshs 21.6 per unit, respectively, a 19.5% and 8.0% gain for the D-REIT and I-REIT, respectively, from the Kshs 20.0 inception price. In addition, Cytonn High Yield Fund (CHYF) closed the week with an annualized yield of 13.6%, remaining relatively unchanged from the previous week;
Focus of the Week
In July 2022, we released the Nairobi Metropolitan Area Land Report 2022, which highlighted the performance of the Nairobi Metropolitan Area (NMA) land sector. This week, we update our report by discussing the overall performance of the NMA land sector over time and examining various factors that influence its performance, based on selling prices and the annual capital appreciation. During FY’2022/23, the NMA land sector recorded an improvement in performance with the average Year-on-Year (YoY) price appreciation coming in at 4.5% in FY’2022/23, 1.3% points higher than the 3.2% appreciation recorded in FY’2021/22. This is as the average asking prices came in at Kshs 128.5 mn in FY’2022/23, from Kshs 128.4 mn in FY’2021/22. The performance also represented an 11-year average price appreciation CAGR of 9.1%, with the average selling price for land coming in at Kshs 128.5 mn in FY’2022/23, from Kshs 47.9 mn in 2011. This signifies the continued rise in the demand for development land;
Investment Updates:
- Weekly Rates:
- Cytonn Money Market Fund closed the week at a yield of 12.08%. To invest, dial *809# or download the Cytonn App from Google Playstore here or from the Appstore here;
- Cytonn High Yield Fund closed the week at a yield of 13.56% p.a. To invest, email us at sales@cytonn.com and to withdraw the interest, dial *809# or download the Cytonn App from Google Playstore here or from the Appstore here;
- We continue to offer Wealth Management Training every Wednesday, from 9:00 am to 11:00 am. The training aims to grow financial literacy among the general public. To register for any of our Wealth Management Trainings, click here;
- If interested in our Private Wealth Management Training for your employees or investment group, please get in touch with us through wmt@cytonn.com;
- Cytonn Insurance Agency acts as an intermediary for those looking to secure their assets and loved ones’ future through insurance namely; Motor, Medical, Life, Property, WIBA, Credit and Fire and Burglary insurance covers. For assistance, get in touch with us through insuranceagency@cytonn.com;
- Cytonn Asset Managers Limited (CAML) continues to offer pension products to meet the needs of both individual clients who want to save for their retirement during their working years and Institutional clients that want to contribute on behalf of their employees to help them build their retirement pot. To more about our pension schemes, kindly get in touch with us through pensions@cytonn.com;
Real Estate Updates:
- For more information on Cytonn’s real estate developments, email us at sales@cytonn.com;
- Phase 3 of The Alma is now ready for occupation and the show house is open daily. To join the waiting list to rent, please email properties@cytonn.com;
- For Third Party Real Estate Consultancy Services, email us at rdo@cytonn.com;
- For recent news about the group, see our news section here;
Hospitality Updates:We currently have promotions for Staycations. Visit cysuites.com/offers for details or email us at sales@cysuites.com;
Money Markets, T-Bills Primary Auction:
During the week, T-bills were oversubscribed for the second consecutive week, with the overall subscription rate coming in at 151.8%, up from an oversubscription rate of 125.5% recorded the previous week. Investors’ preference for the shorter 91-day paper persisted as they sought to avoid duration risk, with the paper receiving bids worth Kshs 33.3 bn against the offered Kshs 4.0 bn, translating to an oversubscription rate of 833.1%, up from 667.7% recorded the previous week. The subscription rate for the 364-day paper decreased to 17.7%, down from 22.7% recorded the previous week, while the subscription rate for the 182-day paper increased to 13.5%, from 11.4% recorded the previous week. The government accepted all the bids of Kshs 36.4 bn. The yields on the government papers continued to rise, with the yields on the 364-day, 182-day, and 91-day papers increasing by 20.2 bps, 7.2 bps, and 9.5 bps to 12.5%, 12.3% and 12.1% respectively. The chart below compares the overall average T- bills subscription rates obtained in 2017, 2022 and 2023 Year to Date (YTD):
In the primary market, the Central Bank of Kenya released the auction results for the newly issued bond FXD1/2023/05 with a tenor to maturity of 5 years and the re-opened bond FXD1/2016/10 with a 3.2-year tenor to maturity. In line with our expectations, the bonds recorded an oversubscription rate of 129.4%, receiving bids worth Kshs 51.8 bn against the offered Kshs 40.0 bn. The government accepted bids worth Kshs 38.6 bn, translating to an acceptance rate of 74.5%. The weighted average yield of accepted bids came in at 16.3% and 16.8% for FXD1/2016/10 and FXD1/2023/05, respectively. The coupon rate for the FXD1/2016/10 and FXD1/2023/05 is set at 15.0% and 16.8%, respectively. Notably, the interest on FXD1/2023/5 will be subjected to a withholding tax (WHT) at a rate of 15.0%, while the interest on FXD1/2016/10 will be subjected to a 10.0% withholding tax rate. The FXD1/2016/10 bond's lower WHT served to increase investor attraction. With the Inflation rate at 7.9% as of June 2023, the real return of the bonds is 8.4% and 9.0% for the FXD1/2016/10 and FXD1/2023/05, respectively.
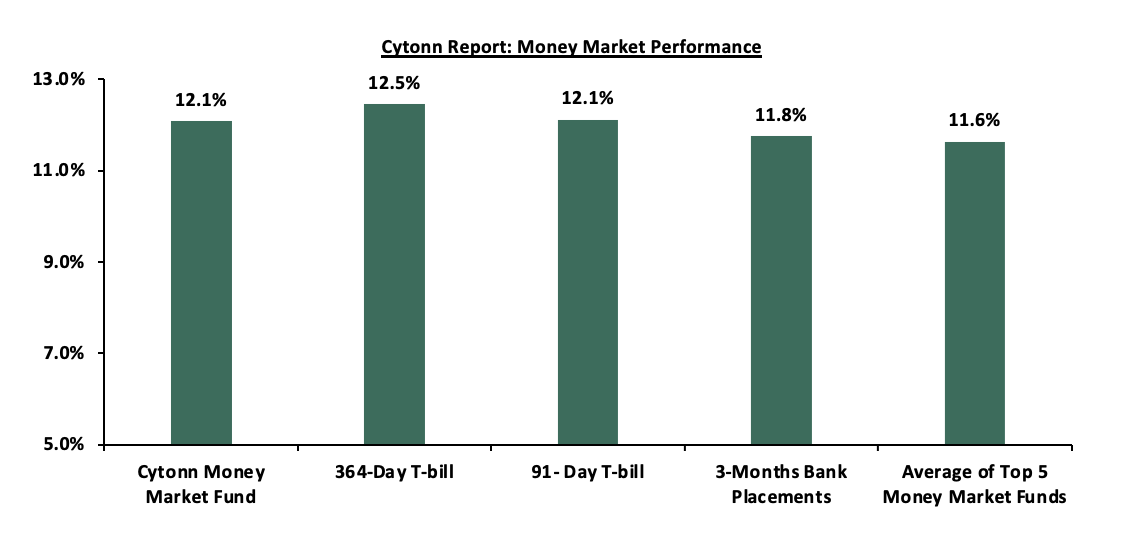
In the money markets, 3-month bank placements ended the week at 11.8% (based on what we have been offered by various banks), while the yields on the 364-day and 91-day papers increased by 20.2 bps and 9.5 bps to 12.5% and 12.1%, respectively. The yield of the Cytonn Money Market Fund decreased by 2.0 bps to remain relatively unchanged at 12.1% from what was recorded the previous week. Similarly, the average yields of the Top 5 Money Market Funds decreased by 1.6 bps to 11.6% from 11.7% recorded the previous week.
The table below shows the Money Market Fund Yields for Kenyan Fund Managers as published on 14th July 2023:
|
Cytonn Report: Money Market Fund Yield for Fund Managers as published on 14th July 2023 |
||
|
Rank |
Fund Manager |
Effective Annual Rate |
|
1 |
Cytonn Money Market Fund (dial *809# or download Cytonn App) |
12.1% |
|
2 |
Enwealth Money Market Fund |
11.8% |
|
3 |
Etica Money Market Fund |
11.7% |
|
4 |
Madison Money Market Fund |
11.5% |
|
5 |
GenAfrica Money Market Fund |
11.2% |
|
6 |
Co-op Money Market Fund |
11.2% |
|
7 |
Apollo Money Market Fund |
11.1% |
|
8 |
Jubilee Money Market Fund |
11.1% |
|
9 |
AA Kenya Shillings Fund |
11.1% |
|
10 |
Old Mutual Money Market Fund |
11.1% |
|
11 |
Kuza Money Market fund |
11.0% |
|
12 |
Nabo Africa Money Market Fund |
10.8% |
|
13 |
Sanlam Money Market Fund |
10.8% |
|
14 |
GenCap Hela Imara Money Market Fund |
10.6% |
|
15 |
Dry Associates Money Market Fund |
10.4% |
|
16 |
KCB Money Market Fund |
10.3% |
|
17 |
NCBA Money Market Fund |
10.2% |
|
18 |
ICEA Lion Money Market Fund |
10.0% |
|
19 |
Zimele Money Market Fund |
9.9% |
|
20 |
Absa Shilling Money Market Fund |
9.8% |
|
21 |
CIC Money Market Fund |
9.8% |
|
22 |
British-American Money Market Fund |
9.5% |
|
23 |
Orient Kasha Money Market Fund |
9.2% |
|
24 |
Mali Money Market Fund |
9.1% |
|
25 |
Equity Money Market Fund |
8.5% |
Source: Business Daily
Liquidity:
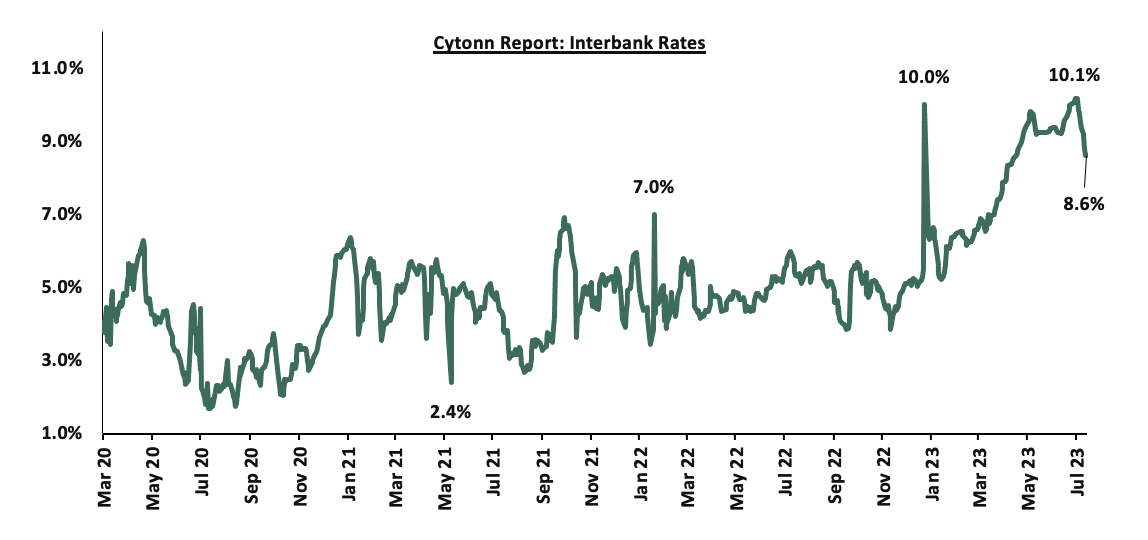
During the week, liquidity in the money markets increased, with the average interbank rate declining to 8.8% from 9.7% recorded the previous week, partly attributable to government payments that offset tax remittances. The average interbank volumes traded increased by 86.6% to Kshs 17.8 bn from Kshs 9.5 bn recorded the previous week. The chart below shows the interbank rates in the market over the years:
Source: CBK
Kenya Eurobonds:
During the week, the yields on Eurobonds recorded mixed performance, with the yield on the 10-year Eurobond issued in 2014 decreasing by 0.8% points to 12.5% from 13.3% recorded the previous week, while the yield of the 7-year Eurobond issued in 2019 increased the most by 0.3% points to 11.9% from 11.6% recorded the previous week. The table below shows the summary of the performance of the Kenyan Eurobonds as of 13th July 2023;
|
Cytonn Report: Kenya Eurobonds Performance |
||||||
|
|
2014 |
2018 |
2019 |
2021 |
||
|
Date |
10-year issue |
10-year issue |
30-year issue |
7-year issue |
12-year issue |
12-year issue |
|
Amount Issued (USD) |
2.0 bn |
1.0 bn |
1.0 bn |
0.9 bn |
1.2 bn |
1.0 bn |
|
Years to Maturity |
1.1 |
4.8 |
24.8 |
4.0 |
9.0 |
11.1 |
|
Yields at Issue |
6.6% |
7.3% |
8.3% |
7.0% |
7.9% |
6.2% |
|
02-Jan-23 |
12.9% |
10.5% |
10.9% |
10.9% |
10.8% |
9.9% |
|
03-Jul-23 |
12.5% |
11.0% |
11.0% |
11.2% |
11.0% |
10.3% |
|
06-Jul-23 |
13.3% |
11.4% |
11.3% |
11.6% |
11.2% |
10.6% |
|
07-Jul-23 |
14.0% |
11.7% |
11.4% |
12.2% |
11.5% |
10.8% |
|
10-Jul-23 |
14.1% |
11.8% |
11.5% |
12.3% |
11.6% |
10.9% |
|
11-Jul-23 |
13.7% |
11.7% |
11.5% |
12.3% |
11.6% |
10.9% |
|
12-Jul-23 |
12.3% |
11.4% |
11.4% |
11.9% |
11.4% |
10.7% |
|
13-Jul-23 |
12.5% |
11.5% |
11.4% |
11.9% |
11.4% |
10.8% |
|
Weekly Change |
(0.8%) |
0.1% |
0.1% |
0.3% |
0.2% |
0.2% |
|
MTD Change |
0.0% |
0.5% |
0.3% |
0.7% |
0.4% |
0.5% |
|
YTD Change |
(0.4%) |
1.0% |
0.5% |
1.0% |
0.6% |
0.9% |
Source: Central Bank of Kenya (CBK) and National Treasury
Kenya Shilling:
During the week, the Kenya Shilling remained under pressure, having depreciated by 0.3% against the US dollar to close the week at Kshs 141.4 from Kshs 140.9 recorded the previous week, partly attributable to the persistently high dollar demand from importers, especially in the oil and energy sectors. On a year-to-date basis, the shilling has depreciated by 14.6% against the dollar, adding to the 9.0% depreciation recorded in 2022. We expect the shilling to remain under pressure in 2023 as a result of:
- An ever-present current account deficit, which came to 2.3% of GDP in Q1’2023 from 4.2% recorded in a similar period last year, and,
- The need for government debt servicing, continues to put pressure on forex reserves given that 67.3% of Kenya’s external debt is US Dollar denominated as of March 2023, and,
The shilling is however expected to be supported by:
- Diaspora remittances standing at a cumulative USD 2,033.8 mn in 2023 as of June 2023, albeit 0.5% lower than the USD 2,044.6 mn recorded over the same period in 2022, and,
- The tourism inflow receipts which came in at Kshs 268.1 bn in 2022, a significant 82.9% increase from Kshs 146.5 bn inflow receipts recorded in 2021.
- Sufficient forex reserves currently at USD 7.5 bn (equivalent to 4.1-months of import cover), which is above the statutory requirement of maintaining at least 4.0-months of import cover, and the EAC region’s convergence criteria of 4.5-months of import cover.
The chart below summarizes the evolution of Kenya months of import cover over the years: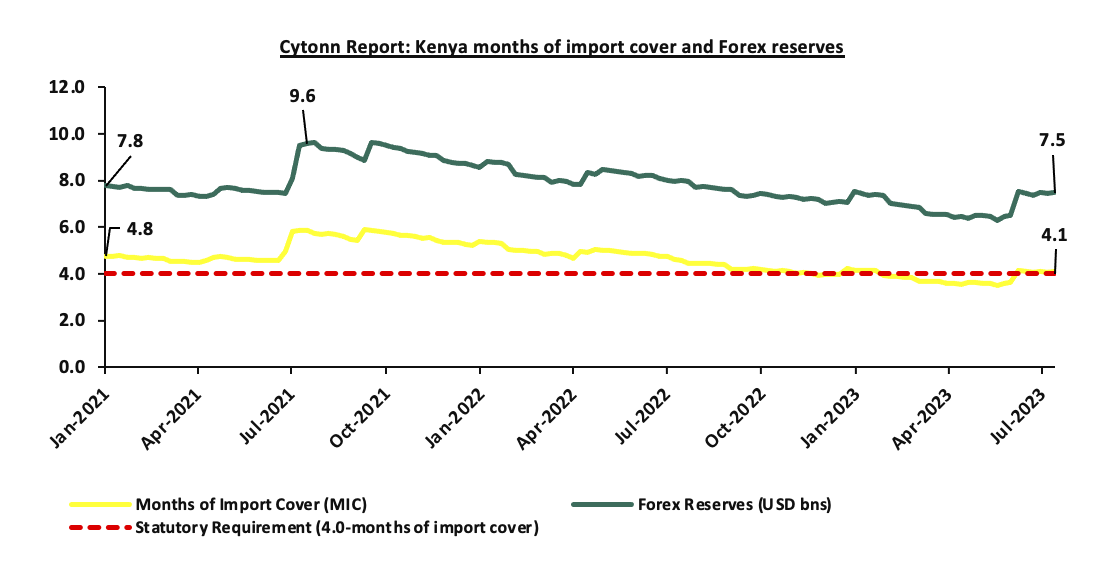
Weekly Highlights:
- FY’2022/2023 Revenue Performance
During the week, the Kenya Revenue Authority (KRA) released the annual revenue performance for FY’2022/2023 highlighting that the total revenue collection amounted to Kshs 2.2 tn against the target of Kshs 2.3 tn, translating to a target achievement of 95.3%. The performance also marked the second consecutive year that the KRA has surpassed the Kshs 2.0 tn mark in revenue collection and a 6.6% growth in revenue from the 2.0 tn in FY’2021/2022. The performance was mainly supported by an 8.5% growth in domestic tax revenue to Kshs 1.4 tn from Kshs 1.3 tn recorded in FY’2021/2022, coupled with a 3.5% growth in customs tax revenue to Kshs 754.1 bn from Kshs 728.6 bn recorded in FY’2021/2022. However, the performance of custom taxes was curtailed by an increase in exemptions and remissions, which grew by 39.7%, as a result of exemptions on imports of commodities such as rice, maize, sugar, and cooking oil. Notably, the exemptions were a move by the government to lower the cost of living in the country.
Key takeout from the report includes;
- Strong growth in collections from Excise on Betting. Collection from excise on betting recorded a 30.0% growth to Kshs 6.6 bn from Kshs 5.1 bn recorded in FY’2021/2022. The performance is attributable to the streamlined tax remittance from the sector through the integration of betting companies into the KRA tax systems,
- Growth in Domestic VAT collection. Domestic VAT collection grew by 11.3% to Kshs 272.5 bn from 244.8 bn recorded in FY’2021/2022. The performance is largely attributable to the implementation of the Tax Invoice Management System (TIMS), which enhanced compliance. This was evidenced by the significant growth of 18.0% in the period between February 2023 and June 2023 upon the implementation of the TIMS, compared to the 6.7% performance in the first 7 months of FY’2022/2023,
- Growth in corporation tax collection. Corporation tax collection grew by 9.0% to Kshs 263.8 bn from Kshs 242.0 bn recorded in FY’2021/2022. The performance was mainly supported by increased in remittances from sectors such a Finance & Insurance; Information & Communication; Manufacturing; Wholesale & Retail Trade; and Electricity, Oil, & Gas, which accounted for 77.8% of the Corporation tax collections,
- Slow growth in Domestic Excise collections. Revenue in the tax head recorded a modest growth of 2.8% to Kshs 68.1 bn from Kshs 66.2 bn in FY’2021/2022, attributable to the slow growth in excise duty collections from Beer and Tobacco of 0.4% and 2.8%, respectively. However, the growth was supported by growth in revenue from Cosmetics, Wines and Spirits, Soft drinks, and Bottled water of 60.6%, 8.7%, 8.0%, and 4.4% respectively. The agency noted that it continues to enhance surveillance at the tax head in order to ensure compliance.
The growth in revenue is mainly attributed to implementation of key strategies by the KRA such as:
- Having customer support programs such as Tax education & awareness and stakeholder’s engagements with the aim of promoting voluntary remittance,
- Expansion of the tax base by onboarding tax payers that were previously not paying taxes. The initiative included the recruitment of landlords under the Monthly Rental Income (MRI) obligation and Block Management System (BMS) to map out potential taxpayers,
- Taxing the digital economy through the introduction of digital service tax and VAT on digital market supply has brought inclusivity in the payment of taxes, especially from non-residents. As such, KRA collected a total of Kshs 5.3 bn from taxing of digital economy, representing a 207.9% growth from the Kshs 1.7 bn recorded in FY’2021/2022
- Taxing directly at the source on a real-time basis via the Electronic Tax Management System (eTIMS) and integrating of betting and gaming companies into the KRA system so as to minimize the risk of fraud,
- Leveraging on technology to simplify tax process by integrating with e-citizen government agencies and private entities for payroll taxes,
- Dispute resolution framework that has enabled revenue collection from litigation, Alternative Dispute Resolution (ADR) and Tax Appeal Tribunal (TAT).
The graph below shows a summary of Kenya’s revenue performance over the last 5 years, as per data by the Kenya Revenue Authority (KRA):
Source: Kenya Revenue Authority
In FY’2023/2024 the KRA authority has targeted a revenue collection of Kshs 2.8 tn and projects to surpass the Kshs 3.0 tn mark by FY’2024/2025. The agency aims to achieve its target through implementation of both tax administrative measures and tax policy reforms, such as the National Tax Policy and the Medium-Term Revenue Strategy (MTRS) for the period FY 2023/24 - 2026/27. Additionally, the agency will also develop and implement its 9th Strategic Plan after the end of the 8th Corporate Plan cycle in 2023/24. However, we expect the performance to be curtailed given the poor operating business environment evident by the Purchasing Managers Index operating below the 50-mark threshold for the 5 months to June 2023 and averaging at 48.8 in H1’2022. As a result, volumes of new business have declined, mainly due to reduced demand for commodities. This comes on the back of the elevated inflationary pressures experienced in the country and the sustained depreciation of the Kenya shilling against major currencies. The sustained shilling depreciation leads to high import costs, which manufacturers pass on to consumers through hikes in consumer prices. Consequentially, this lowers consumer purchasing power, leading to reduced demand for commodities and eventually a slowdown in economic activity.
- Fuel Prices effective 15 July 2023 to 14 August 2023
During the week, the Energy and Petroleum Regulatory Authority (EPRA) released their monthly statement on the maximum retail fuel prices in Kenya, effective 15 July 2023 to 14 August 2023. Notably, prices for Super Petrol and Kerosene declined 0.4% and 2.3% to Kshs 194.7 and Kshs 169.5, respectively, from Kshs 195.5 and 173.4 per litre. However, the price of diesel remained unchanged at Kshs 179.7 per litre.
We note that Fuel prices in the country still remain elevated based on historical levels, despite global fuel prices dropping to USD 81.5 per barrel from a peak of USD 117.7 per barrel in June 2022. Notably, the high fuel prices in the country are mainly due to the high cost of fuel imports as a result of the sustained depreciation of the shilling against the US dollar, as well as the government's move to completely remove fuel subsidies, which cushioned consumers from the otherwise high fuel prices. Additionally, following the double increase in VAT on petroleum products to 16.0% from 8.0% in the Finance Act 2023, fuel prices are expected to rise further.
Despite government intervention through a government-to-government deal with the three government owned entities Saudi Aramco (ARAMCO), Abu Dhabi National Oil Company (ADNOC) and Emirates National Oil Company (ENOC) to supply fuel on credit in an effort to relieve pressure on the Kenya shilling and consequently ease the cost of fuel imports, the deal has yet to bear fruit since the shilling has been on a continuous record low against the US dollar. As such, fuel prices are expected to remain elevated, and given that fuel is a major input in most businesses, its multiplier effect is expected to curtail economic activity.
- World Investment Report 2023
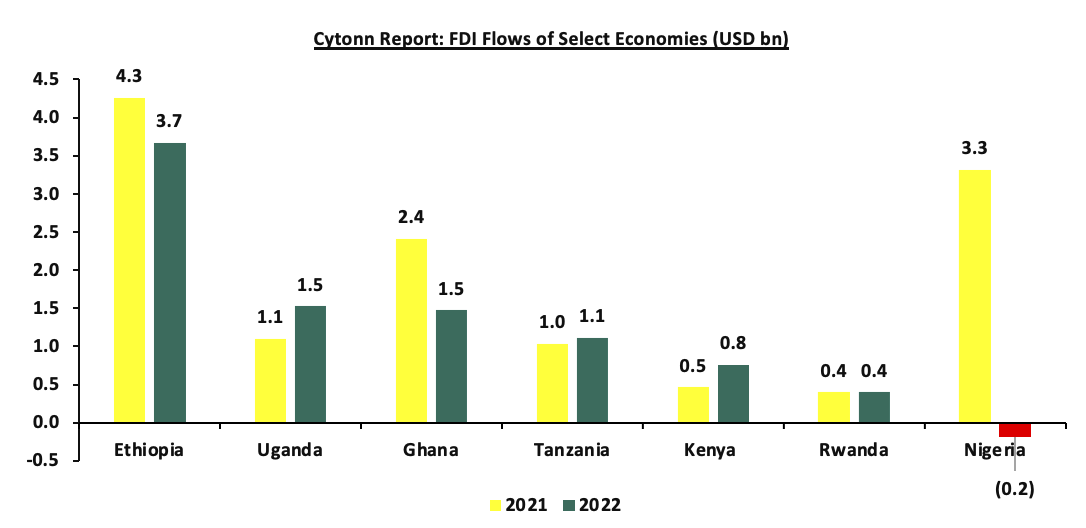
Recently, the United Nations Conference on Trade and Development (UNCTD) released the 2023 World Investment Report, noting that global foreign direct investment (FDI) declined by 12.0% in 2022 to USD 1.3 tn. The slowdown was mainly on the back of the war in Ukraine, high food and energy prices, as well as debt pressures due to tighter financing conditions, rising interest rates, and uncertainty in the capital markets. Notably, FDI in Africa dropped by 44.0% to USD 45.0 bn in 2022, following a record high of USD 80.0 bn recorded in 2021. Despite the decline, the value of announced greenfield projects rose to a record of USD 195.0 bn from USD 52.0 bn in 2021. Additionally, the number of projects increased by 39.0% to 766, with the biggest increase recorded in energy and gas supply worth USD 120.0 bn, construction worth USD 24.0 bn and extractive industries worth USD 21.0 bn. Among major sub-Saharan economies, there was mixed performance, with Nigeria recording negative flows of USD 187.0 mn mainly due to equity divestments; however, the value of announced greenfield projects increased by 24.0%. Similarly, Ghana recorded a 39.0% decline in FDI flows to USD 1.5 bn down from USD 3.8 bn recorded in 2021.
In the East Africa region, FDI rose by 3.0% to USD 8.7 bn from USD 8.4 bn recorded in 2021; notably, Ethiopia continued to account for the largest share of the region's FDI despite its flows declining by 14.0% to USD 3.7 bn in 2022 from USD 4.2 bn recorded in 2021. Uganda recorded the largest growth in FDI in the region, having recorded a 39.0% increase to USD 1.5 bn up from USD 1.1 bn in 2021. This was mainly attributable to the two large greenfield projects that were announced by Total Energies (France) during the period, which comprised: the development of the Lake Albert oil field in a joint venture with China National Offshore Oil Corporation and the Uganda National Oil Company worth USD 6.5 bn, and the construction of the 1,440.0 km East African Crude Oil Pipeline worth USD 3.5 billion, in a joint venture with the Uganda National Oil Company, the Petroleum Development Corporation (United Republic of Tanzania), and the China National Offshore Oil Corporation.
Kenya recorded an enormous growth in FDI, having grown by 63.9% to USD 759.1 mn in 2022 from USD 463.0 mn in 2021 after a five-year dip leading to 2021. The significant increase is mainly attributable to a range of policy interventions to mobilize resources and investments within the renewable energy sector under the Vision 2030 strategy, which include the Renewable Energy Technologies Programme, which involves the preparation of a renewable energy resources inventory and resource map; the formulation of a national strategy for coordinating research in renewable energy; and promoting the use of municipal waste for energy production. The programme also involves harnessing opportunities offered under the clean development mechanism and other mechanisms, as well as promoting international cooperation on programmes focusing on renewable energy sources and climate change. As such, Kenya was one of the top 5 economies in Africa that accounted for 40.0% of projects in the region, ranked ahead of Nigeria and Zambia. The chart below shows a comparison of FDI in 2021 and 2022 in select economies:
Despite the increase in Kenya’s FDI, it still lags behind its peers in terms of its ability to attract foreign investors to the country. However, we expect a high growth rate in 2023, as experienced in 2022, as the country continues to be a magnet for foreign investors interested in renewable energy which has become a national interest. We also expect high FDI growth on the back of revised government policies to encourage more foreign investors. For example, the removal of the 30.0% local ownership requirement for foreign companies in the ICT sector is set to encourage more ICT company setups. The newly signed trade agreement with the European Union is also set to encourage more flows into the country, provided that most of Kenya's FDI stock is UK-owned. However, the continuing high debt levels limit fiscal space, and investors continue to exhibit uncertainty and be more skeptic. Additionally, the high levels of corruption scandals are also a major concern among foreign investors interested in investing in Kenya.
Rates in the Fixed Income market have been on an upward trend given the continued government demand for cash and the tight liquidity in the money market. The government is 9.8% ahead its prorated net domestic borrowing target of Kshs 26.3 bn, having a net borrowing position of Kshs 28.9 bn of the domestic net borrowing target of Kshs 598.3 bn for the FY’2023/2024. Therefore, we expect a continued upward readjustment of the yield curve in the short and medium term, with the government looking to bridge the fiscal deficit through the domestic market. Owing to this, our view is that investors should be biased towards short-term fixed-income securities to reduce duration risk
Market Performance:
During the week, the equities market was on an upward trajectory, with NASI and NSE 25 each gaining by 2.3%, while NSE 20 gained by 0.4%, taking the YTD performance to losses of 10.5%, 3.0%, and 7.5% for NASI, NSE 20, and NSE 25, respectively. The equities market's performance was mainly driven by gains recorded by large-cap stocks such as Equity Group, KCB Group, and EABL of 7.6%, 3.4%, and 3.3%, respectively. The gains were, however, weighed down by losses recorded by stocks such as Diamond Trust Bank–Kenya and BAT of 4.7% and 2.1%, respectively.
During the week, equities turnover decreased by 47.7% to USD 5.9 mn from USD 11.3 mn, recorded the previous week, taking the YTD turnover to USD 470.6 mn. Foreign investors remained net buyers for a fifth consecutive week with a net buying position of USD 0.5 mn, from a net buying position to USD 1.5 mn recorded the previous week, taking the YTD net selling position to USD 254.3 mn.
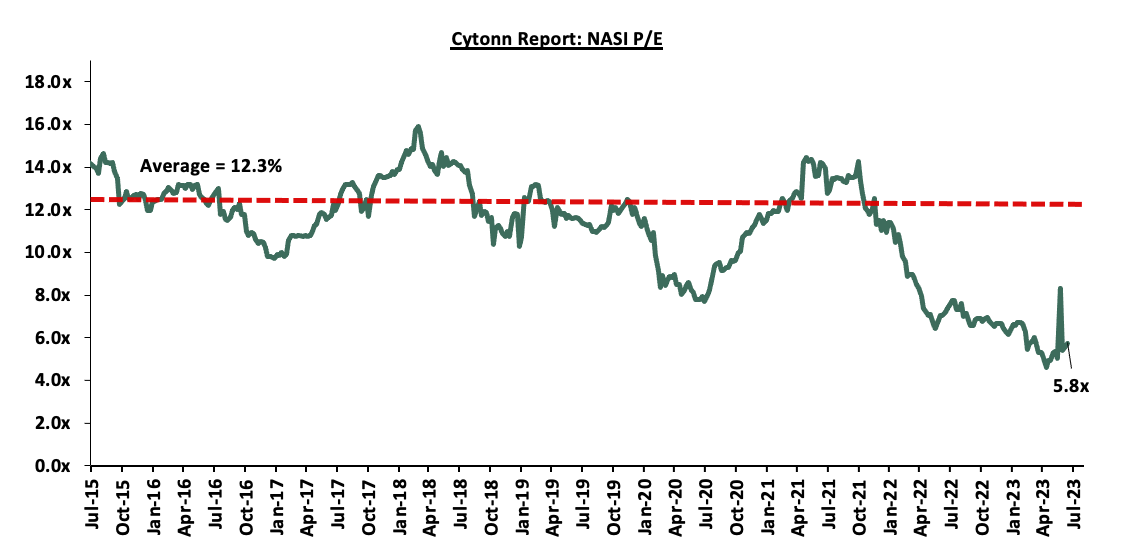
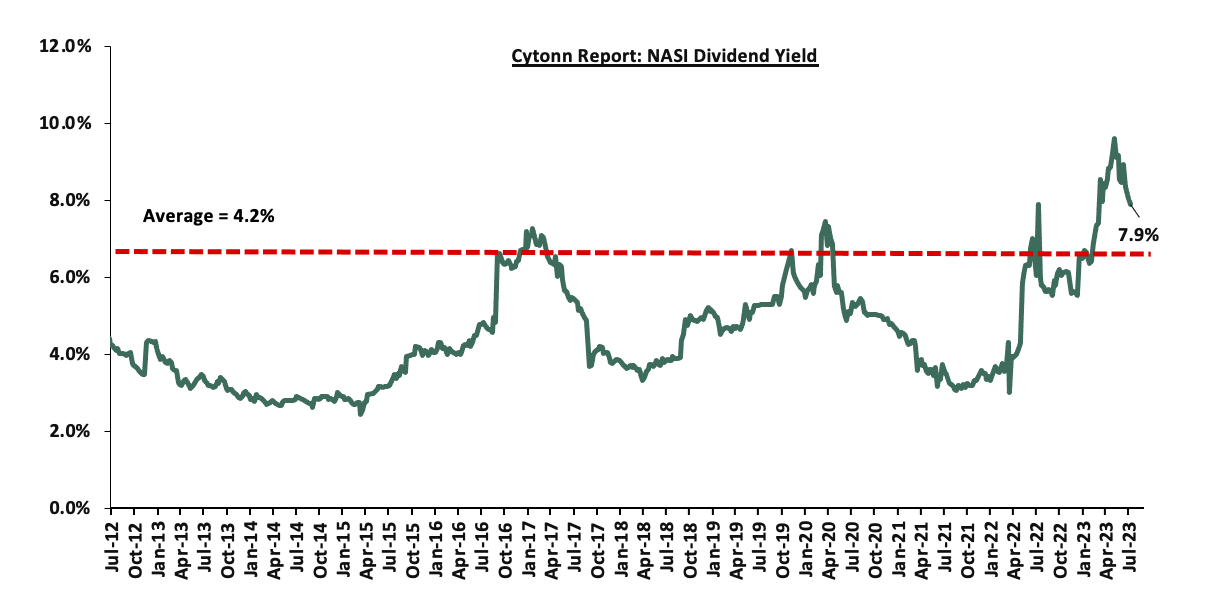
The market is currently trading at a price to earnings ratio (P/E) of 5.8x, 53.3% below the historical average of 12.3x. The dividend yield stands at 7.9%, 3.6% points above the historical average of 4.3%. Key to note, NASI’s PEG ratio currently stands at 0.7x, an indication that the market is undervalued relative to its future growth. A PEG ratio greater than 1.0x indicates the market is overvalued while a PEG ratio less than 1.0x indicates that the market is undervalued. The charts below indicate the historical P/E and dividend yields of the market;
Universe of coverage:
|
Company |
Price as at 7/07/2023 |
Price as at 14/07/2023 |
w/w change |
YTD Change |
Target Price* |
Dividend Yield |
Upside/ Downside** |
P/TBv Multiple |
Recommendation |
|
Kenya Reinsurance |
1.8 |
1.9 |
0.5% |
(1.1%) |
2.5 |
10.8% |
46.5% |
0.1x |
Buy |
|
Jubilee Holdings |
189.0 |
190.0 |
0.5% |
(4.4%) |
260.7 |
6.3% |
43.5% |
0.3x |
Buy |
|
KCB Group*** |
29.2 |
30.2 |
3.4% |
(21.4%) |
41.3 |
6.6% |
43.5% |
0.5x |
Buy |
|
Liberty Holdings |
4.2 |
4.2 |
(2.1%) |
(17.7%) |
5.9 |
0.0% |
42.7% |
0.3x |
Buy |
|
Co-op Bank*** |
12.2 |
12.1 |
(0.8%) |
0.0% |
15.0 |
12.4% |
36.0% |
0.6x |
Buy |
|
NCBA*** |
39.4 |
39.9 |
1.1% |
2.3% |
48.9 |
10.7% |
33.2% |
0.8x |
Buy |
|
CIC Group |
2.0 |
2.0 |
2.1% |
4.2% |
2.5 |
6.5% |
32.2% |
0.6x |
Buy |
|
ABSA Bank*** |
12.1 |
12.2 |
0.8% |
0.0% |
14.7 |
11.1% |
31.3% |
1.0x |
Buy |
|
HF Group |
4.8 |
4.5 |
(6.2%) |
43.5% |
5.8 |
0.0% |
28.5% |
0.2x |
Buy |
|
Equity Group*** |
40.0 |
43.1 |
7.6% |
(4.4%) |
51.2 |
9.3% |
28.2% |
1.0x |
Buy |
|
Standard Chartered*** |
162.0 |
161.8 |
(0.2%) |
11.6% |
183.9 |
13.6% |
27.3% |
1.1x |
Buy |
|
Diamond Trust Bank*** |
50.0 |
47.7 |
(4.7%) |
(4.4%) |
54.6 |
10.5% |
25.0% |
0.2x |
Buy |
|
Sanlam |
8.0 |
8.4 |
5.0% |
(12.3%) |
10.3 |
0.0% |
22.5% |
2.4x |
Buy |
|
I&M Group*** |
18.5 |
18.1 |
(2.2%) |
6.2% |
19.5 |
12.4% |
19.9% |
0.4x |
Accumulate |
|
Stanbic Holdings |
119.8 |
120.0 |
0.2% |
17.6% |
127.9 |
10.5% |
17.1% |
0.9x |
Accumulate |
|
Britam |
5.1 |
5.1 |
0.8% |
(1.2%) |
6.0 |
0.0% |
16.1% |
0.7x |
Accumulate |
We are “Neutral” on the Equities markets in the short term due to the current tough operating environment and huge foreign investor outflows, and, “Bullish” in the long term due to current cheap valuations and expected global and local economic recovery.
With the market currently being undervalued to its future growth (PEG Ratio at 0.7x), we believe that investors should reposition towards value stocks with strong earnings growth and that are trading at discounts to their intrinsic value. We expect the current high foreign investors sell-offs to continue weighing down the equities outlook in the short term.
- Real Estate Regulated Funds
- Real Estate Investment Trusts (REITs)
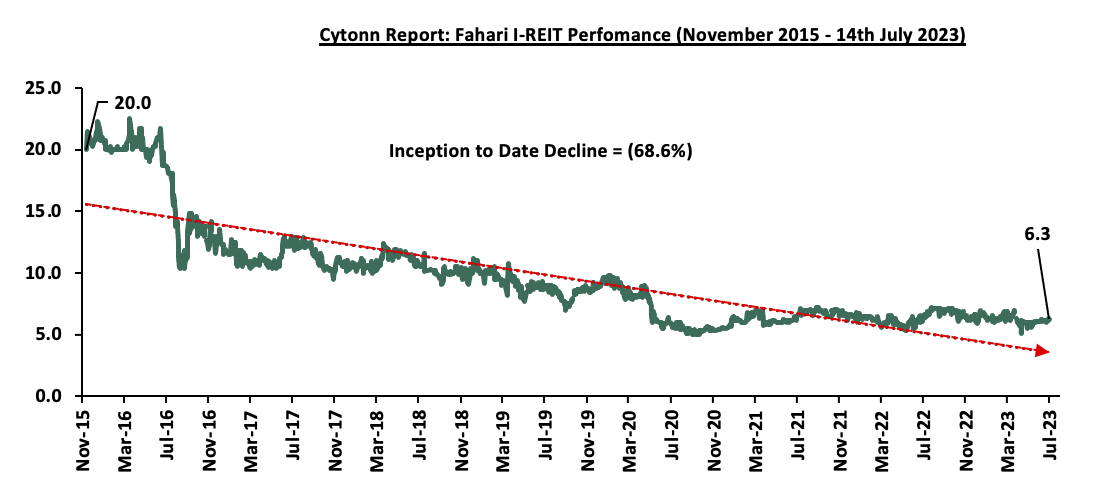
In the Nairobi Securities Exchange, ILAM Fahari I-REIT closed the week trading at an average price of Kshs 6.3 per share. The performance represented a 4.7% gain from Kshs 6.0 per share recorded the previous week, taking it to a 7.4 % Year-to-Date (YTD) decline from Kshs 6.8 per share recorded on 3 January 2023. In addition, the performance represented a 68.6% Inception-to-Date (ITD) loss from the Kshs 20.0 price. The dividend yield currently stands at 10.4%. The graph below shows Fahari I-REIT’s performance from November 2015 to 14 July 2023;
In the Unquoted Securities Platform, Acorn D-REIT and I-REIT traded at Kshs 23.9 and Kshs 21.6 per unit, respectively, as at 7 July 2023. The performance represented a 19.5% and 8.0% gain for the D-REIT and I-REIT, respectively, from the Kshs 20.0 inception price. The volumes traded for the D-REIT and I-REIT came in at 12.3 mn and 30.1 mn shares, respectively, with a turnover of Kshs 257.5 mn and Kshs 620.7 mn, respectively, since inception in February 2021.
REITs provide numerous advantages, including; access to larger capital pools, consistent and prolonged profits, tax exemptions, diversified portfolios, transparency, liquidity, and flexibility as an asset class. Despite these benefits, the performance of the Kenyan REITs market remains limited by several factors, such as; i) insufficient investor understanding of the investment instrument, ii) time-consuming approval procedures for REIT creation, iii) high minimum capital requirements of Kshs 100.0 mn for trustees, and, iv) high minimum investment amounts set at Kshs 5.0 mn discouraging investments.
- Cytonn High Yield Fund (CHYF)
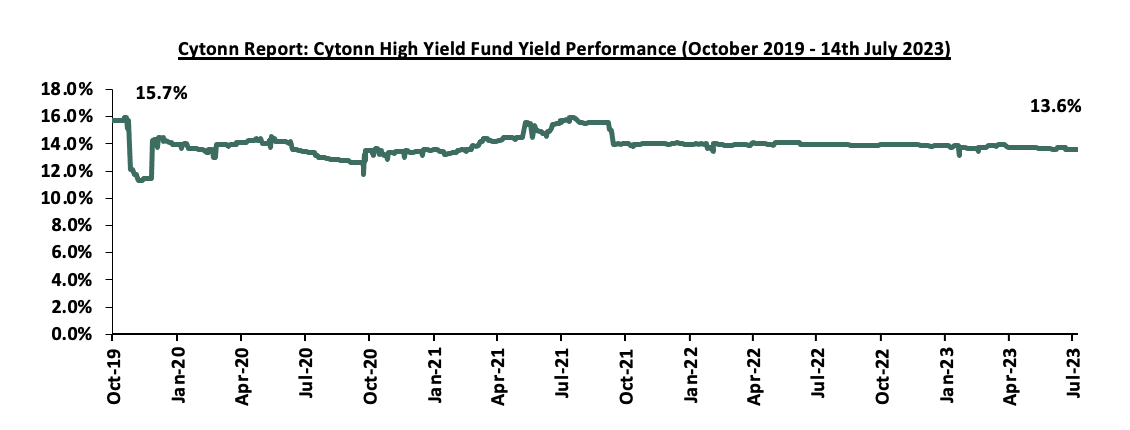
Cytonn High Yield Fund (CHYF) closed the week with an annualized yield of 13.6%, remaining relatively unchanged from the previous week. The performance also represented 0.3% points Year-to-Date (YTD) decline from 13.9% yield recorded on 1 January 2023, and 2.1% points Inception-to-Date (ITD) decline from the 15.7% yield. The graph below shows Cytonn High Yield Fund’s performance from October 2019 to 14 July 2023;
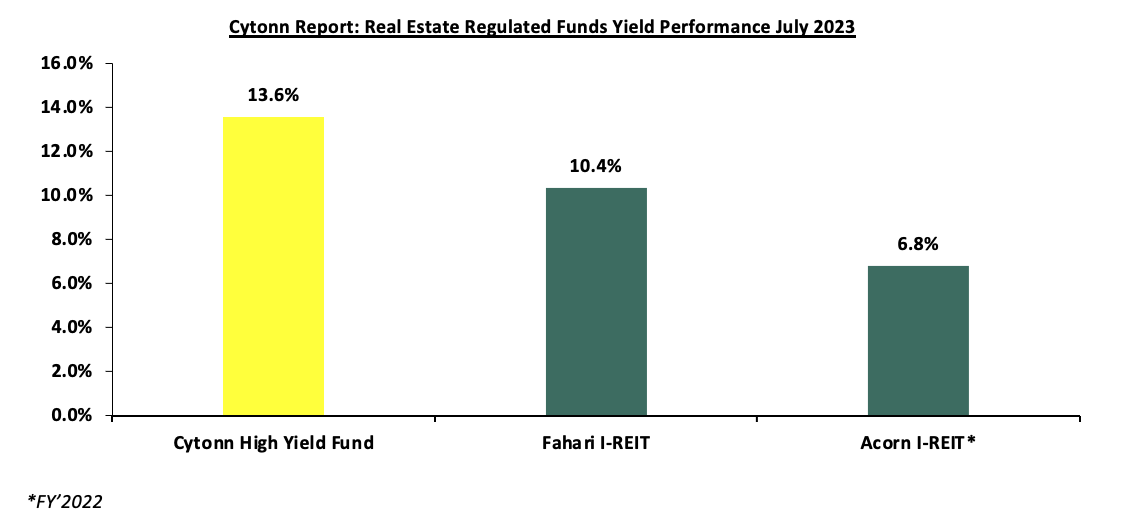
Notably, the CHYF has outperformed other regulated Real Estate funds with an annualized yield of 13.6%, as compared to Fahari I-REIT and Acorn I-REIT with yields of 10.4%, and 6.8% respectively. As such, the higher yields offered by CHYF makes the fund one of the best alternative investment resource in the Real Estate sector. The graph below shows the yield performance of the Regulated Real Estate Funds:
Source: Cytonn Research
We expect the performance of Kenya’s Real Estate sector to remain on an upward trajectory, supported by factors such as; i) initiatives by the government and private sector to prioritize affordable housing, ii) infrastructure developments facilitating investments, and iii) positive demographic trends facilitating increased housing demand. However, challenges such as existing oversupply in specific real estate sectors particularly commercial office and retail sectors standing at 5.8 mn and 3.9 mn respectively, ii) escalating construction costs due to rising inflation, and iii) limited investor knowledge and interest in REITs are expected to persist thus impeding the sector's optimal performance.
In July 2022, we released the Nairobi Metropolitan Area Land Report 2022, which highlighted that the Nairobi Metropolitan Area (NMA) land sector recorded an improvement in performance with the average annual price appreciation coming in at 3.2% in FY’2021/22, 1.7% points higher than the 1.5% appreciation recorded in FY’2020/21. The performance represented a 10-year average price appreciation CAGR of 11.4%, with the average selling price for land coming in at Kshs 126.8 mn in FY’2021/22, from Kshs 47.5 mn in 2011.
The performance was mainly driven by the increased demand for unserviced land in satellite towns of the NMA which recorded the highest annualized capital appreciation of 9.7%, compared to a market average of 3.2%. This was attributed to; i) adequate infrastructural developments, ii) proximity to amenities such as malls, education institutions among others, and, iii) positive demographics fueling demand. Conversely, land prices in the high rise residential areas of the NMA registered the highest price correction declining by 2.0%. The decline in performance was mainly driven by the reduced demand for land in these areas, as a result of inadequate land for development.
This week, we updated our report by discussing the overall performance of the NMA land sector over time, and examining various factors that influence its performance based on selling prices and annual capital appreciation. Additionally, we identify investment opportunities for the sector, using 2023 market research data. As such, in this topic we shall focus on;
- Introduction to the Nairobi Metropolitan Area (NMA) Land Sector,
- NMA Land Sector Performance in 2023 Based on Various Locations,
- Summary and investment opportunities in the sector, and,
- Conclusion and Outlook for the Sector.
Section I: Introduction to the Nairobi Metropolitan Area (NMA) Land Sector
The land sector in the Nairobi Metropolitan Area (NMA) has continued to exhibit resilience, as evidenced by its consistent improvement in performance despite facing challenges such as the COVID-19 pandemic, and an oversupply in select Real Estate sectors such as commercial office and retail sectors. These oversupplies have exerted downward pressure on land demand, especially within the commercial zones of the NMA. Nevertheless, the sector managed to thrive in FY’2022/23, benefiting from various factors that played a crucial role in supporting its performance. Some of these factors include:
- Government’s Continued Focus on Infrastructural Developments: The government of Kenya has continued to initiate and implement various infrastructure projects across the country, aimed at improving the economy’s performance. This in turn has benefitted the Real Estate sector by improving connectivity, thereby bolstering demand and uptake, particularly in satellite towns, and opening up areas for investment, ultimately increasing property prices. Some key projects that were completed include; the dualling of the 27.8 Km Nairobi Eastern By-pass road, the 27.1 Km Expressway road project launched in July 2022 in the NMA, the completion of the Makupa Bridge in Mombasa, Eldoret Southern Bypass, Kenol-Marua road, Kibarani-Changamwe road, among others, whereas the projects in the pipeline include; Dongo Kundu Bypass Phase 2 in Kwale county, ii) dualling of the Mombasa-Malindi road, ii) Limuru-UN Avenue road expansion and dualling scheduled for completion in 2024, and, iii) Athi River-Machakos road turnoff, among many others,
- Positive Demographics: This is evidenced by Kenya’s relatively high population and urbanization growth rates of 1.9% p.a and 3.7% p.a, respectively, against the global average of 0.9% p.a and 1.6% p.a, respectively, as at 2022, which in turn continue to drive the demand for development land upwards,
- Increased Roll-Out of Affordable Housing Projects: The Affordable Housing initiative has continued to take shape in the country. This has seen the current administration launch and commission more projects under the initiative, in line with the government’s affordable housing agenda. Subsequently, there has been an upward demand for development land. Some notable ongoing projects include; Pangani Affordable Housing Project, Kings Boma Estate in Ruiru, and, River Estate project in Ngara, among many others, and,
- Limited Supply of Land Particularly in Urban Centers: Inadequate land within Nairobi Commercial Zones has driven developers to source for development land in the satellite towns of Nairobi, thus driving demand for land in these areas upward. Demand for land in the satellite towns has also been fueled by their affordability, compared to Nairobi suburbs. According to our H1’2023 Markets Review Report, the average asking land price per acre for un-serviced land in satellite towns came in at Kshs 15.4 mn, significantly lower than Kshs 397.3 mn per acre in Nairobi suburbs.
However, despite the aforementioned supporting elements, the sector's optimal performance in FY’2022/23 was hampered by;
- Increased Construction Costs: Construction costs have increased steadily, averaging Kshs 41,600 per SQM in 2023, a 20.1% increase from Kshs 34,650 per SQM recorded in 2022. This was attributed to a hike in prices of key construction materials such as cement, steel, paint, aluminum, and PVC on the back of rising inflation and supply chain disruptions. In turn, this led to some developers withholding or stalling their development projects due to the high associated costs of construction materials. Ultimately, this has had a trickle-down impact on the demand for land, weighing it down as a result of withheld development plans by developers,
- Oversupply in Select Real Estate Sectors: The oversupply in select Real Estate sectors, particularly the commercial office and retail sectors, estimated at 5.8 mn SQFT and 3.0 mn SQFT in the NMA respectively, weighed down the overall demand for development land. As such, some developers were prompted to halt or put on hold their development plans in light of the above, as they waited for absorption rates of the existing spaces to improve,
- Inadequate infrastructure: Despite the government’s efforts to improve infrastructure through the launch and conclusion of various infrastructure projects across the country, some areas are still lacking basic and adequate infrastructure such as water, roads, and sewer. As a result, this affects the optimum demand for land in such areas, and,
- Reduced Investor Confidence: In light of the 2022 August general elections, investors adopted a ‘wait-and-see’ approach to investment on the back of political uncertainty associated with the elections. As a result, most developers put their development plans on hold for the most part of the year owing to reduced investor confidence, which further diluted the overall demand for development land. However, following the peaceful conclusion of the polls, demand and uptake for development land has been stabilizing on the back of enhanced investor confidence.
Notably, going forward, some of the factors expected to shape performance of the sector include;
- Increase in Capital Gains Tax (CGT): As of 1st January 2023, the Finance Act 2022, became effective thereby increasing the CGT chargeable on net gains upon transfer of property to 15.0% from the 5.0% previously chargeable. We expect the tax will elicit mixed performance in the sector, possibly prompting investors to increase land prices. Conversely, we retain concerns regarding how the increase will dampen property transaction volumes exist, as many investors are likely to rethink their disposal transactions, ultimately leading to a decline in property transaction volumes and consequent liquidity gaps in the market, and,
- Continued Efforts in Digitization of Land Records: The ongoing digitization of land records under the National Land Information Management System (NLIMS), dubbed ‘Ardhi Sasa’ that was launched in April 2021, will ensure enhanced and streamlined land transaction processes. Digitization will assist curb fraud cases and ease land transaction processes by reducing protracted timelines.
Section II: NMA Land Sector Performance in 2023 Based on Various Locations
For the analysis, we conducted research on various major towns within the NMA and classified them as follows;
- High Rise Residential Areas: They comprise of areas such as Dagoretti, Embakasi, and Kasarani, and are majorly characterized by the numerous high-rise buildings such as the apartments found within,
- High End Residential Suburbs: These are areas which generally consist of low rise buildings such as the bungalows, maisonettes and villas and also high end apartments. They include; Kitisuru, Runda, Ridgeways, Kileleshwa, Karen, and Spring Valley,
- Commercial Zones: They comprise of areas such as Kilimani, Westlands, Riverside, and Upper Hill, and are popular because of the numerous commercial office buildings that they have, and,
- Satellite Towns: Land in the area was categorized into serviced (site and service schemes) and unserviced land. It comprises of areas such as Syokimau, Ruiru, Rongai, Athi River, and, Limuru.
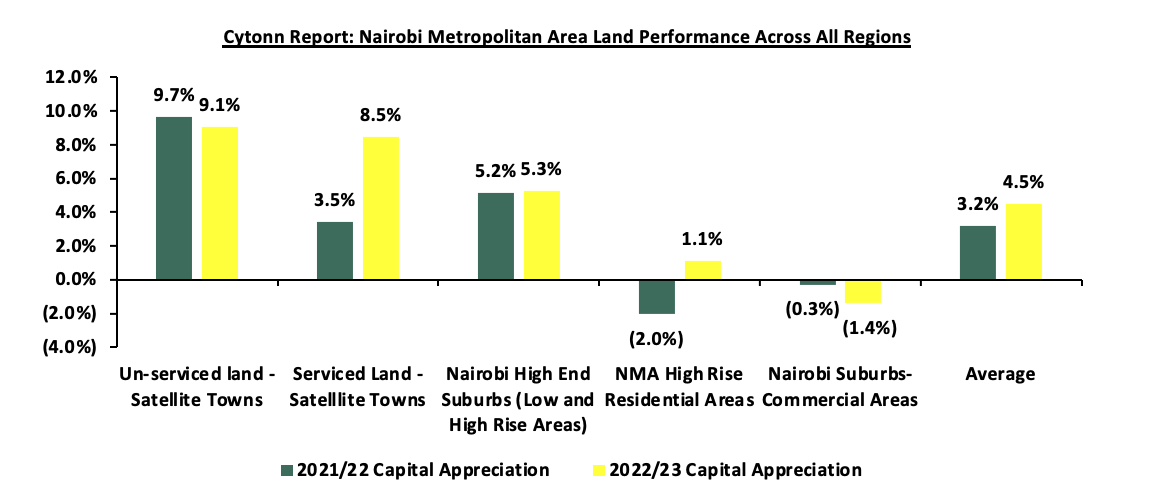
The NMA land sector recorded an improvement in performance with the average Year-on-Year (YoY) price appreciation coming in at 4.5% in FY’2022/23, 1.3% points higher than the 3.2% appreciation recorded in FY’2021/22. This is as the average asking prices came in at Kshs 128.5 mn in FY’2022/23, from Kshs 128.4 mn in FY’2021/22. The performance also represented an 11-year average price appreciation CAGR of 9.1%, with the average selling price for land coming in at Kshs 128.5 mn in FY’2022/23, from Kshs 47.9 mn in 2011. This signifies the continued rise in the demand for development land mainly driven by; i) increased need for land for development facilitated by positive population demographics, ii) ongoing efforts by the government to streamline land transactions creating a more efficient and accessible market, iii) notable increase in the initiation and completion of affordable housing projects owing to both government and private sector involvement, and, iv) rapid expansion of satellite towns, accompanied by substantial infrastructural developments resulting in elevated property prices. The graph below shows the capital appreciation of land in the NMA from FY’2021/22 to FY’2022/23;
The table below shows the performance summary of the NMA land sector based on the average asking prices, CAGR and capital appreciation;
All Values in Kshs mn per Acre Unless Stated Otherwise
|
Cytonn Report: Summary of the Land Performance Across All Regions in the Nairobi Metropolitan Area |
|||||||||||||
|
Location |
*Price in 2011 |
*Price in 2015 |
*Price in 2016 |
*Price in 2017 |
*Price 2018/19 |
*Price 2019/20 |
*Price 2020/21 |
*Price 2021/22 |
*Price 2022/23 |
11-Year CAGR |
2021/22 Capital Appreciation |
2022/23 Capital Appreciation |
∆ in Capital appreciation |
|
Unserviced land - Satellite Towns |
3.6 |
8.4 |
11.6 |
12.6 |
12.8 |
13.2 |
13.5 |
14.7 |
15.4 |
14.2% |
9.7% |
9.1% |
(0.6%) |
|
Serviced Land - Satellite Towns |
5.6 |
13.8 |
15.2 |
16.0 |
16.0 |
16.0 |
16.7 |
17.0 |
18.3 |
12.5% |
3.5% |
8.5% |
5.0% |
|
Nairobi High End Suburbs (Low and High Rise Areas) |
54.5 |
94.3 |
113.0 |
119.7 |
119.3 |
120.7 |
123.8 |
130.5 |
135.5 |
9.1% |
5.2% |
5.3% |
0.1% |
|
NMA High Rise Residential Areas |
31.0 |
64.3 |
71.7 |
77.7 |
75.7 |
77.0 |
76.7 |
76.3 |
76.1 |
8.5% |
(2.0%) |
1.1% |
3.2% |
|
Nairobi Suburbs- Commercial Areas |
145.0 |
359.3 |
421.8 |
433.0 |
421.0 |
419.0 |
404.6 |
403.4 |
397.3 |
9.8% |
(0.3%) |
(1.4%) |
(1.1%) |
|
Average |
47.9 |
108.0 |
126.6 |
131.8 |
129.0 |
129.2 |
127.1 |
128.4 |
128.5 |
9.1% |
3.2% |
4.5% |
1.3% |
Source: Cytonn Research
Performance per node:
- Satellite Towns - Unserviced Land
Unserviced land in the satellite towns of Nairobi recorded an average YoY capital appreciation of 9.1%, with average asking prices coming in at Kshs 15.4 mn in FY’2022/23, from the Kshs 14.7 mn recorded in FY’2021/22. Additionally, the performance grew by an 11-year average CAGR of 14.2%, to average asking prices of Kshs 15.4 mn in FY’2022/23 from the Kshs 3.6 mn recorded in 2011. The performance was supported by; i) improved infrastructural developments such as the Thika Superhighway, opening up new areas for investments, and, ii) increased demand for residence in towns such as Juja owing to presence of notable higher learning institutions.
In terms of performance per node, Athi River was the best performing with a Year-on-Year (YoY) capital appreciation of 19.2% attributed to; i) adequate transport links such as Mombasa Road, which enable access from the city that is necessary for investments, consequently driving up land prices, ii) proximity to amenities such as Greatwall Gardens Mall, Coloho Mall, and, Mavoko Hospital, among others, and, iii) positive demographics fueling demand. On the other hand, Limuru and Rongai recorded price corrections of 2.6% and 8.5% to Kshs 23.5 mn and Kshs 17.3 mn, respectively, from Kshs 24.1 mn and Kshs 18.9 mn, respectively, as a result of a slight decline in the demand for land in the areas. The table below shows the performance of unserviced land in satellite towns within the NMA;
All values is Kshs mn per Acre unless stated otherwise
|
Cytonn Report: NMA Satellite Towns - Unserviced Land Performance |
|||||||||||||
|
Location |
*Price in 2011 |
*Price in 2015 |
*Price in 2016 |
*Price in 2017 |
*Price 2018/19 |
*Price 2019/20 |
*Price 2020/21 |
*Price 2021/22 |
*Price 2022/23 |
11-Year CAGR |
2021/22 Capital Appreciation |
2022/23 Capital Appreciation |
∆ in Capital appreciation |
|
Juja |
3.0 |
7.0 |
9.0 |
10.0 |
10.0 |
10.0 |
10.6 |
12.2 |
14.5 |
15.4% |
14.8% |
18.9% |
4.1% |
|
Athi River |
2.0 |
3.0 |
4.0 |
4.0 |
4.0 |
4.0 |
4.5 |
4.4 |
5.2 |
9.1% |
(2.7%) |
19.2% |
22.0% |
|
Utawala |
6.0 |
9.0 |
10.0 |
11.0 |
12.0 |
12.0 |
12.4 |
14.1 |
16.7 |
9.8% |
13.8% |
18.4% |
4.5% |
|
Limuru |
5.0 |
13.0 |
17.0 |
20.0 |
20.0 |
21.0 |
21.2 |
24.1 |
23.5 |
15.1% |
13.8% |
(2.6%) |
(16.4%) |
|
Rongai |
2.0 |
10.0 |
18.0 |
18.0 |
18.0 |
19.0 |
19.0 |
18.9 |
17.3 |
21.6% |
(0.7%) |
(8.5%) |
(7.8%) |
|
Average |
3.6 |
8.4 |
11.6 |
12.6 |
12.8 |
13.2 |
13.5 |
14.7 |
15.4 |
14.2% |
7.8% |
9.1% |
1.3% |
Source: Cytonn Research
- Nairobi Suburbs – High End (Low and High Rise) Residential Areas
High end residential areas of Nairobi suburbs registered an average YoY capital appreciation of 5.3%, with the average asking prices coming at Kshs 135.5 mn in FY’2022/23, from Kshs 130.5 mn in FY’2021/22. Additionally, the performance represented an 11-year average CAGR of 9.1%, with average asking prices coming in at Kshs 135.5 mn in FY’2022/23 from the Kshs 54.5 mn recorded in 2011. These areas continue to remain attractive to investors due to; i) their serene environments attracting demand particularly from the high-end income earners, ii) privacy enhanced by the sparse population, iii) relatively affordable prices at Kshs 135.5 mn per acre compared to the commercial zones averaging at Kshs 397.3 mn per acre.
In terms of performance per node, Spring Valley was the best performing with an average YoY price appreciation of 9.2%, 3.9% points higher than the market average of 5.3% due to; i) its closeness to the city (5.0 km) thereby creating demand for residential developments, ii) availability of development land due to low population, iii) ample infrastructure servicing the area, such as the Nairobi Expressway, among others, iv) proximity to adequate amenities such as Spring Valley Mall, and St. Austin’s Academy, among others, and, v) strategic location as it’s connected to high end areas like Westlands, hence attracting investments. The table below shows the performance of land in high end (low and high rise) suburbs within the NMA
All values is Kshs mn per Acre unless stated otherwise
|
Cytonn Report: NMA High End Suburbs (Low and High Rise Areas) Land Performance |
|||||||||||||
|
Location |
*Price in 2011 |
*Price in 2015 |
*Price in 2016 |
*Price in 2017 |
*Price 2018/19 |
*Price 2019/20 |
*Price 2020/21 |
*Price 2021/22 |
*Price 2022/23 |
11-Year CAGR |
2021/22 Capital Appreciation |
2022/23 Capital Appreciation |
∆ in Capital appreciation |
|
Kitisuru |
32.0 |
59.0 |
70.0 |
70.0 |
71.0 |
73.0 |
77.9 |
90.3 |
95.0 |
9.9% |
13.7% |
5.2% |
(8.5%) |
|
Karen |
25.0 |
40.0 |
46.0 |
52.0 |
53.0 |
56.0 |
59.6 |
62.0 |
64.5 |
8.6% |
3.8% |
4.2% |
0.4% |
|
Kileleshwa |
149.0 |
227.0 |
286.0 |
306.0 |
311.0 |
303.0 |
300.9 |
305.8 |
301.9 |
6.8% |
1.6% |
(1.3%) |
(2.9%) |
|
Ridgeways |
24.0 |
51.0 |
62.0 |
68.0 |
65.0 |
66.0 |
68.8 |
81.4 |
87.0 |
11.7% |
15.5% |
6.8% |
(8.7%) |
|
Runda |
33.0 |
58.0 |
67.0 |
68.0 |
68.0 |
70.0 |
74.3 |
81.7 |
87.9 |
8.6% |
9.0% |
7.6% |
(1.5%) |
|
Spring Valley |
64.0 |
131.0 |
147.0 |
154.0 |
148.0 |
156.0 |
161.0 |
161.7 |
176.5 |
8.8% |
0.4% |
9.2% |
8.7% |
|
Average |
54.5 |
94.3 |
113.0 |
119.7 |
119.3 |
120.7 |
123.8 |
130.5 |
135.5 |
9.1% |
5.2% |
5.3% |
0.1% |
Source: Cytonn Research
- Satellite Towns - Serviced Land
Serviced land in the satellite towns of Nairobi recorded an average YoY capital appreciation of 8.5%, with the average asking prices coming in at Kshs 18.3 mn in FY’2022/23, from Kshs 17.0 mn in FY’2021/22. Additionally, the performance represented an 11-year average CAGR of 12.5%, with average asking prices coming in at Kshs 18.3 mn in FY’2022/23 from the Kshs 5.6 mn recorded in 2011. The performance was supported by; i) ample infrastructure such as the various bypasses and the Thika Superhighway, ii) rising demand for residential developments on the back of positive demographics, and, iii) convenient access to the city thereby allowing increased investments.
In terms of performance per node, Syokimau was the best performing with a relatively high average YoY price appreciation of 23.9%. This was mainly driven by; i) its strategic location along the recently completed Nairobi Expressway project promoting investments, ii) presence of a commuter rail network allowing accessibility to various areas in addition to Mombasa Road, iii) relatively affordable land prices at Kshs 17.2 mn per acre against the market average of Kshs 18.3 mn per acre, and, iv) presence of a growing middle income class driving demand for land investments. On the other hand, Rongai recorded a price correction of 6.1% attributed to reduced land transactions within the period under review. The table below shows the performance of serviced land in satellite towns within the NMA;
All values is Kshs mn per Acre unless stated otherwise
|
Cytonn Report: NMA Satellite Towns - Serviced Land Performance |
|||||||||||||
|
Location |
*Price in 2011 |
*Price in 2015 |
*Price in 2016 |
*Price in 2017 |
*Price 2018/19 |
*Price 2019/20 |
*Price 2020/21 |
*Price 2021/22 |
*Price 2022/23 |
11-Year CAGR |
2021/22 Capital Appreciation |
2022/23 Capital Appreciation |
∆ in Capital appreciation |
|
Rongai |
7.0 |
16.0 |
19.0 |
19.0 |
19.0 |
18.0 |
20.0 |
20.4 |
19.1 |
9.6% |
1.8% |
(6.1%) |
(7.9%) |
|
Athi River |
2.0 |
11.0 |
13.0 |
13.0 |
12.0 |
12.0 |
13.1 |
13.3 |
14.4 |
19.7% |
1.6% |
8.2% |
6.7% |
|
Ruiru |
8.0 |
18.0 |
19.0 |
21.0 |
23.0 |
24.0 |
25.3 |
25.9 |
28.1 |
12.1% |
2.2% |
8.6% |
6.4% |
|
Syokimau |
3.0 |
12.0 |
12.0 |
12.0 |
12.0 |
12.0 |
11.8 |
13.9 |
17.2 |
17.2% |
17.5% |
23.9% |
6.4% |
|
Ruai |
8.0 |
12.0 |
13.0 |
15.0 |
14.0 |
14.0 |
13.5 |
11.6 |
12.5 |
4.2% |
(13.9%) |
7.7% |
21.6% |
|
Average |
5.6 |
13.8 |
15.2 |
16.0 |
16.0 |
16.0 |
16.7 |
17.0 |
18.3 |
12.5% |
3.5% |
8.5% |
5.0% |
Source: Cytonn Research
- Nairobi Suburbs - Commercial Zones
Land in the Nairobi commercial zones realized a price correction of 1.4% in their average asking prices which came in at Kshs 397.3 mn in FY’2022/23, from the Kshs 403.4 mn that was recorded in FY’2021/22. This is mainly on the back of declined demand owing to high land prices. In addition, these areas are increasingly becoming congested due to relaxed zoning regulations in areas such as Kilimani, occasioning frequent traffic snarl-ups rendering them inconvenient compared to areas such as the high end suburbs of Nairobi. On the other hand, commercial zones realized an 11-year average CAGR of 9.8%, with average asking prices coming in at Kshs 397.3 mn in FY’2022/23 from the Kshs 145.0 mn recorded in 2011, owing to heightened property transactions in the period.
In terms of performance per node, all areas recorded price corrections, with Upper Hill recording the sharpest decline at 2.9% due to declined demand for development resulting from expensive land in the area, coming in at Kshs 458.1 mn per acre, compared to the average of Kshs 397.3 mn per acre. The table below shows the performance of land in commercial zones within the NMA;
All values is Kshs mn per Acre unless stated otherwise
|
Cytonn Report: NMA Suburbs - Commercial Zones Land Performance |
|||||||||||||
|
Location |
*Price in 2011 |
*Price in 2015 |
*Price in 2016 |
*Price in 2017 |
*Price 2018/19 |
*Price 2019/20 |
*Price 2020/21 |
*Price 2021/22 |
*Price 2022/23 |
11-Year CAGR |
2021/22 Capital Appreciation |
2022/23 Capital Appreciation |
∆ in Capital appreciation |
|
Westlands |
150.0 |
350.0 |
453.0 |
474.0 |
430.0 |
421.0 |
413.6 |
418.3 |
413.2 |
9.6% |
1.1% |
(1.2%) |
(0.1%) |
|
Upper Hill |
200.0 |
450.0 |
512.0 |
510.0 |
488.0 |
506.0 |
487.3 |
471.9 |
458.1 |
7.8% |
(3.2%) |
(2.9%) |
0.3% |
|
Kilimani |
114.0 |
294.0 |
360.0 |
387.0 |
403.0 |
398.0 |
381.7 |
380.4 |
375.9 |
11.5% |
(0.3%) |
(1.2%) |
(0.9%) |
|
Riverside |
116.0 |
343.0 |
362.0 |
361.0 |
363.0 |
351.0 |
335.7 |
343.1 |
342.1 |
10.3% |
2.2% |
(0.3%) |
(1.9%) |
|
Average |
145.0 |
359.3 |
421.8 |
433.0 |
421.0 |
419.0 |
404.6 |
403.4 |
397.3 |
9.8% |
(0.3%) |
(1.4%) |
(1.7%) |
Source: Cytonn Research
- Nairobi Suburbs – High Rise Residential Areas
High rise residential areas of Nairobi realized an average YoY capital appreciation of 1.1%, with the average asking prices coming in at Kshs 76.3 mn in FY’2022/23 from Kshs 76.1 mn recorded in FY’2021/22. Additionally, the performance represented an 11-year average CAGR of 8.5%, with average asking prices coming in at Kshs 76.1 mn in FY’2022/23 from the Kshs 31.0 mn recorded in 2011. The performance was supported by; i) affordability of land prices enticing buyers and investors compared to high end suburbs, ii) rising demand for residential developments on the back of positive demographics, and, iii) unrestricted zoning regulations allowing investments in the areas.
In terms of performance per node, Embakasi was the best performing, with an average YoY price appreciation of 6.9%, 5.8% points higher than the 1.1% market average. This was mainly driven by; i) investors increasingly putting up developments in the densely populated area to accommodate the middle-income population, ii) affordability of land in the area, coming in at Kshs 71.5 mn per acre, compared to the market average of Kshs 76.1 mn per acre, and, iii) availability of infrastructure with the area being served by the Airport Road and part of the Outer Ring Road. On the other hand, Dagoretti recorded a price correction of 10.1% attributed to decreased investment activities in the area within the period. The table below shows the performance of land in high rise residential areas within the NMA;
All values is Kshs mn per Acre unless stated otherwise
|
Cytonn Report: NMA Middle End Suburbs – High Rise Residential Areas Land Performance |
|||||||||||||
|
Location |
*Price in 2011 |
*Price in 2015 |
*Price in 2016 |
*Price in 2017 |
*Price 2018/19 |
*Price 2019/20 |
*Price 2020/21 |
*Price 2021/22 |
*Price 2022/23 |
11-Year CAGR |
2021/22 Capital Appreciation |
2022/23 Capital Appreciation |
∆ in Capital appreciation |
|
Embakasi |
33.0 |
61.0 |
60.0 |
70.0 |
61.0 |
63.0 |
67.2 |
66.9 |
71.5 |
7.3% |
(0.5%) |
6.9% |
7.4% |
|
Kasarani |
32.0 |
51.0 |
60.0 |
64.0 |
66.0 |
65.0 |
67.7 |
66.9 |
71.3 |
7.6% |
(1.2%) |
6.6% |
7.8% |
|
Dagoretti |
28.0 |
81.0 |
95.0 |
99.0 |
100.0 |
103.0 |
95.2 |
95.2 |
85.6 |
10.7% |
0.0% |
(10.1%) |
(10.1%) |
|
Average |
31.0 |
64.3 |
71.7 |
77.7 |
75.7 |
77.0 |
76.7 |
76.1 |
76.3 |
8.5% |
(0.6%) |
1.1% |
0.5% |
Source: Cytonn Research
Section III: Summary and Investment Opportunity in the Sector
The table below summarizes the performance in capital appreciation of the various areas:
|
Summary and Conclusions - y/y Capital Appreciation Nairobi Metropolitan Area |
|
|
Unserviced Land Capital Appreciation |
|
|
FY’2022/23 |
Areas |
|
>5.0% |
Juja, Athi River, Utawala, Kitisuru, Ridgeways, Runda, Spring Valley, Embakasi, Kasarani |
|
1.0%- 4.9% |
Karen |
|
<1.0% |
Limuru, Rongai, Kileleshwa, Westlands, Upper Hill, Kilimani, Riverside |
|
Site and Service Capital Appreciation |
|
|
FY’2022/23 |
Areas |
|
>5.0% |
Athi River, Ruiru, Syokimau, Ruai |
|
<1.0% |
Rongai |
Source: Cytonn Research
Investment Opportunity
- Satellite Towns (Unserviced land) - The investment opportunity in this segment lies in Juja, Athi River, and Utawala submarkets which registered the highest YoY capital returns at 18.9%, 19.2%, and 18.4%, respectively, against a market average of 9.1% owing to relative affordability of land and presence of adequate infrastructure allowing access to the city thereby drawing investments,
- High End Residential Suburbs - The investment opportunity in this segment lies in Spring Valley and Runda which recorded the highest YoY capital appreciations of 9.2% and 7.6%, respectively, against the market average of 5.3%. The impressive performance was driven by the relatively high demand resulting from their exclusivity, prime locations attracting high net worth investments, availability of ample development land, adequate infrastructure and various amenities,
- Satellite Towns (Serviced Land) - The investment opportunity in the segment lies in Syokimau and Ruiru which recorded the highest YoY capital appreciations of 23.9% and 8.6%, respectively, against the market average of 8.5%. The performance was supported by; rapid demand driven by the existing growing middle income class earners, availability of infrastructure networks such as the commuter train station in Syokimau and Thika Superhighway along Ruiru, and relatively affordable land prices,
- Commercial Zones - Riverside presents the most favorable investment opportunity in the segment, having registered the least price correction of 0.3% compared to the market average of 1.4%, driven by its close proximity to Nairobi’s Central Business District (CBD) and its relatively affordable land compared to the commercial zone market average, and,
- High Rise Residential Areas - The investment opportunity in the segment lies in Embakasi and Kasarani which recorded the highest YoY capital appreciations of 6.9% and 6.6%, respectively, against the market average of 1.1%, driven by increased demand for development land to cater for the rapidly dense population in the areas.
Section IV: Conclusion and Outlook for the Sector
|
Indicator |
2022 Projections |
2023 Projections |
2022 Outlook |
2023 Outlook |
|
Infrastructure Development |
|
|
Positive |
Positive |
|
Legal Reforms |
|
|
Positive |
Positive |
|
Credit Supply |
|
|
Negative |
Negative |
|
Real Estate Activities |
|
|
Neutral |
Neutral |
|
Land Sector Performance |
|
|
Positive |
Positive |
We have three positive outlooks; for infrastructure development, legal reforms and land sector performance, one neutral outlook for Real Estate activities and one negative outlook for credit supply thereby bringing our overall outlook for the sector to POSITIVE. We expect the performance to be further boosted by factors driving demand for development land such as; i) Increased infrastructure developments which has improved and opened up areas for investment, ii) Roll out of numerous affordable housing projects by both the public and private sectors, iii) Affordability of land in the satellite towns, iv) Limited supply of land especially in urban areas which has contributed to exorbitant prices, and, v) Positive demographics driving demand for land upwards, facilitated by high population and urbanization growth rates of 1.9% and 3.7%, 1.0% points and 2.1% points higher than the global averages of 0.9% and 1.6% respectively.
Disclaimer: The views expressed in this publication are those of the writers where particulars are not warranted. This publication, which is in compliance with Section 2 of the Capital Markets Authority Act Cap 485A, is meant for general information only and is not a warranty, representation, advice or solicitation of any nature. Readers are advised in all circumstances to seek the advice of a registered investment advisor.

- Talk to us
- Kenya
- P.O Box 20695 - 00200, Nairobi, Kenya
- Cell +254709101200
- Tel +254709101200
- WhatsApp +254741676635
- United States
- +254709101200
- DOWNLOAD OUR APP
-


- Kenya
- 8th Floor, Pinetree Plaza, Kaburu Drive, Ngong Road, Nairobi, Kenya
- USA
- Suite 1150, 1775 Eye Street NW, USA, Washington DC 20006, USA
- Investments
- High Yield
- Private Equity
- Real Estate
- Real Estate
- RiverRun Estates
- Cytonn Towers
- The Ridge
- Taraji Heights
- The Alma