Cytonn H1’2023 Markets Review
By Research Team, Jul 2, 2023
Executive Summary
Global Markets Review
According to the World Bank’s June 2023 Global Economic Prospects, the global economy is projected to grow at a rate of 2.1% in 2023, 1.0% points slower than the estimated growth of 3.1% recorded in 2022. The latest projection is 0.8% points lower than the IMF’s earlier projection of 2.9% growth, with the downward revision being on the back of the continued tightening of monetary policies by the Central Banks around the world aimed at curbing the elevated inflationary pressures. Notably, advanced economies are expected to record a 0.7% growth in 2023, which is a significant decline from the 2.6% expansion recorded in 2022. However, emerging markets and developing economies are projected to expand by 4.0% in 2023, marginally upwards from an estimated growth of 3.7% in 2022;
Sub-Saharan Africa Regional Review
According to the World Bank, the Sub-Saharan economy is projected to grow at a moderate rate of 3.2% in 2023, which is 0.5% lower than the 3.7% growth estimate recorded in 2022. The expected slowdown in the regional economic growth is mainly on the back of adverse weather conditions that have undermined agricultural productivity, weak external demand, tight global financial conditions, and high inflationary pressures in most countries in the region. The challenges have continued to exacerbate fiscal deficits in most countries, leading to increased debt sustainability concerns in Sub-Saharan Africa as the region’s public debt to GDP ratio remained high at 56.0% in 2022, albeit a decline from 60.0% in 2021. The public debt is expected to remain high due to increased debt servicing costs as a result of continued currency depreciation and increased interest rates in developed economies. Additionally, many countries are providing subsidies in order to mitigate inflationary pressures, which could worsen public finance, increase public debt, and weigh down on debt sustainability;
In H1’2023, most of the select Sub-Saharan currencies depreciated against the US Dollar, mainly attributable to the high debt servicing costs that continue to dwindle foreign exchange reserves and monetary policy tightening by advanced economies. Additionally, Sub-Saharan Africa (SSA) stock markets recorded mixed performance in H1’2023, with Zambia’s stock market (LASILZ) being the best performing market, gaining by 15.2% YTD driven by the rallying of commodity prices due to easing global supply chain constraints, with the country being the main exporter of Copper to countries such as China, Switzerland, and Singapore;
Kenya Macroeconomic Review
According to the Kenya National Bureau of Statistics (KNBS) Economic Survey 2023, the Kenyan economy recorded a 4.8% expansion in FY’2022, lower than the 7.6% growth recorded in FY’2021. The performance was supported by growth in most economic sectors such as Financial and insurance, Information and communication, and Transportation and storage, which grew by 12.8%, 9.9%, and 5.6% respectively. The overall growth was however curtailed by the 1.6% contraction in the Agriculture, Forestry and Fishing sectors, largely attributable to the drought experienced in most parts of the country in 2022. The average inflation rate for the first half of 2023 came in at 8.5%, higher than the 6.3% recorded in H1’2022, mainly as a result of high food and fuel prices. As a result, the business environment deteriorated in H1’2023, with the average Purchasing Managers Index (PMI) coming in at 48.9 in the first five months of 2023, down from the 49.7 recorded in the same period in 2022, as consumers cut back on spending;
Fixed Income
During H1’2023, T-bills were oversubscribed, with the overall subscription rate coming in at 121.7%, up from 89.3% in H1’2022. Investors preference for the 91-day paper persisted as they sought to avoid duration risk, with the paper receiving bids worth Kshs 481.8 bn against the offered Kshs 100.0 bn, translating to an oversubscription rate of 481.8%, higher than the oversubscription rate of 109.0% recorded in H1’2022. Overall subscription rates for the 364-day and 182-day papers came in at 37.9% and 61.3%, lower than the 101.7% and 69.0%, respectively, recorded in H1’2022. The average yields on the 364-day, 182-day, and 91-day papers increased by 1.2% points, 2.1% points and 2.7% points to 11.0%, 10.5%, and 10.2% in H1’2023, respectively, from 9.7%, 8.4%, and 7.5%, respectively, in H1’2022. The upward trajectory in yields is mainly on the back of investors attaching higher risks amid high inflation, currency depreciation, and tight liquidity positions, hence the need to demand higher returns to cushion against the possible loss. The acceptance rate during the period came in at 91.6%, albeit lower than the 92.7% recorded in H1’2022, with the government accepting a total of Kshs 668.3 bn out of the Kshs 730.0 bn worth of bids received;
During the week, T-bills remained undersubscribed for the third consecutive week, with the overall subscription rate coming in at 39.5 %, a decrease from the under-subscription rate of 63.9% recorded the previous week. Investors’ preference for the shorter 91-day paper persisted as they sought to avoid duration risk, with the paper receiving bids worth Kshs 5.8 bn against the offered Kshs 4.0 bn, translating to an oversubscription rate of 144.5%, albeit lower than the 275.3% recorded the previous week. The subscription rate for the 364-day paper declined to 15.1%, from 23.4% recorded the previous week, while the subscription rate for the 182-day paper increased to 22.0%, from 19.9% recorded the previous week. The government rejected expensive bids, accepting a total of Kshs 5.5 bn worth of bids out of Kshs 9.5 bn bids received, translating to an acceptance rate of 58.2%. The yields on the government papers continued to rise, with the yields on the 364-day, 182-day and 91-day papers increasing by 22.3 bps, 8.4 bps, and 11.9 bps to 12.2%, 11.9%, and 11.9%, respectively;
Equities
During Q2’2023, the equities market was on a downward trajectory, with NASI, NSE 20, and NSE 25 declining by 5.1%, 2.9% and 8.0%, respectively, taking the H1’2023 performance to losses of 16.0%, 6.0%, and 13.0% for NASI, NSE 20, and NSE 25, respectively. The equities market performance during the quarter was driven by losses recorded by large caps such as KCB Group, Equity Group, and Bamburi of 17.5%, 15.9%, and 10.3%, respectively;
During the week, the equities market recorded mixed performance, with NASI and NSE 20 declining by 0.2% and 0.5%, while NSE 25 gained by 0.4%, taking their YTD performance to losses of 16.0%, 6.0%, and 13.0% for NASI, NSE 20, and NSE 25 respectively. The equities market performance was mainly driven by losses recorded by large-cap stocks such as Co-operative Bank and Standard Chartered bank of 0.8% each, while KCB Group and NCBA Bank declined by 0.7% and 0.3%, respectively. The losses were however mitigated by gains recorded by East African Breweries Limited (EABL) and Equity Group of 2.0% each, while British American Tobacco gained by 1.8%;
Real Estate
In H1’2023, the Real Estate sector in Kenya witnessed increased activity in terms of developments and property transactions, in comparison to the similar period in 2022, attributable to continued investments flowing into the sector. In light of this, the year-on-year (y/y) gross loans advanced to the Real Estate sector increased by 4.6% to Kshs 481.0 bn in Q1’2023, from Kshs 460.0 bn in Q1’2022, attributable to increased construction activities in the sector according to the Central Bank of Kenya (CBK). In the Nairobi Metropolitan Area (NMA), the residential sector recorded improved performance with a 0.2% points y/y increase in average total returns to 6.0%, from the 5.8% recorded in H1’2022. The commercial office sector recorded average rental yields of 7.8% in H1’2023, representing a 0.4% points y/y increase from 7.4% recorded in H1’2022. The retail sector recorded average rental yields of 8.2% in H1’2023, representing a 0.4% points y/y increase from 7.8% recorded in H1’2022. The land sector recorded an average annualized capital appreciation of 4.5% in H1’2023, with the average prices per acre in the NMA coming in at Kshs 128.5 mn in H1’2023, from Kshs 128.4 mn recorded in H1’2022;
Investment Updates:
- Weekly Rates:
- Cytonn Money Market Fund closed the week at a yield of 11.93%. To invest, dial *809# or download the Cytonn App from Google Playstore here or from the Appstore here;
- Cytonn High Yield Fund closed the week at a yield of 13.56% p.a. To invest, email us at sales@cytonn.com and to withdraw the interest, dial *809# or download the Cytonn App from Google Playstore here or from the Appstore here;
- We continue to offer Wealth Management Training every Wednesday, from 9:00 am to 11:00 am. The training aims to grow financial literacy among the general public. To register for any of our Wealth Management Trainings, click here;
- If interested in our Private Wealth Management Training for your employees or investment group, please get in touch with us through wmt@cytonn.com;
- Cytonn Insurance Agency acts as an intermediary for those looking to secure their assets and loved ones’ future through insurance namely; Motor, Medical, Life, Property, WIBA, Credit and Fire and Burglary insurance covers. For assistance, get in touch with us through insuranceagency@cytonn.com;
- Cytonn Asset Managers Limited (CAML) continues to offer pension products to meet the needs of both individual clients who want to save for their retirement during their working years and Institutional clients that want to contribute on behalf of their employees to help them build their retirement pot. To more about our pension schemes, kindly get in touch with us through pensions@cytonn.com;
Real Estate Updates:
- For more information on Cytonn’s real estate developments, email us at sales@cytonn.com;
- Phase 3 of The Alma is now ready for occupation and the show house is open daily. To join the waiting list to rent, please email properties@cytonn.com;
- For Third Party Real Estate Consultancy Services, email us at rdo@cytonn.com;
- For recent news about the group, see our news section here;
Hospitality Updates:
- We currently have promotions for Staycations. Visit cysuites.com/offers for details or email us at sales@cysuites.com;
Global Economic Growth:
According to the World Bank’s June 2023 Global Economic Prospects, the global economy is projected to grow at a rate of 2.1% in 2023, 1.0% points slower than the estimated growth of 3.1% recorded in 2022. The latest projection is 0.8% points lower than the IMF’s earlier projection of 2.9% growth, with the downward revision being on the back of the continued tightening of monetary policies by the Central Banks around the world aimed at curbing the elevated inflationary pressures. Notably, advanced economies are expected to record a 0.7% growth in 2023, which is a significant decline from the 2.6% expansion recorded in 2022. However, the emerging markets and developing economies are projected to expand by 4.0% in 2023, marginally upwards from an estimated growth of 3.7% in 2022.
The expected slowdown in global economic growth in 2023 as compared to 2022 is majorly attributable to;
- The headline inflation remains elevated despite a recent deceleration due to falling energy prices, necessitating the hiking of interest rates by central banks around the world with the aim of anchoring inflation. As such, the global inflation is forecasted to gradually ease to 5.5% in 2023 from 7.3% in 2022, and,
- Tight global financial conditions occasioned by high cost of borrowing which have increased the risk of debt distress in emerging economies as most advanced economies continue to tighten their monetary policies.
The global economy is expected to remain subdued in the short term, mainly as a result of persistent inflationary pressures as well as tight monetary policies, which are expected to curtail economic growth.
Global Commodities Market Performance:
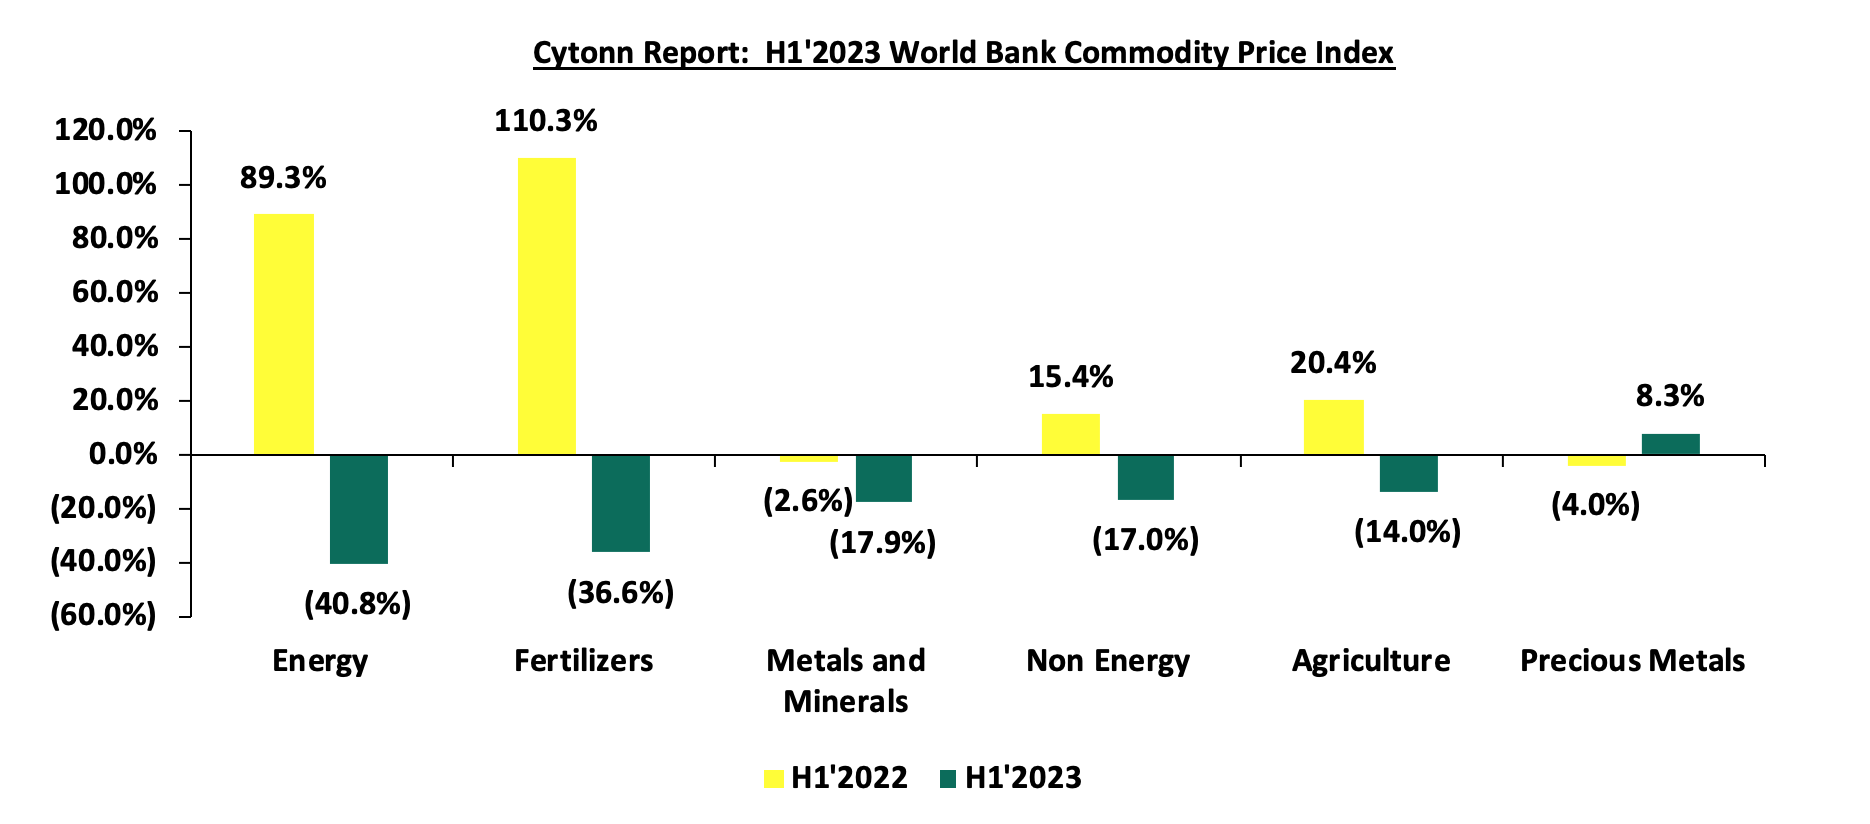
Global commodity prices registered mixed performance in H1’2023, with prices of energy declining the most by 40.8% compared to the 89.3% increase recorded in H1’2022, mainly as a result of weaker global demand. Similarly, prices of fertilizers, Metals and Minerals, Non-energy and Agriculture declined by 36.6%, 17.9%, 17.0% and 14.0%, respectively, on the back of reduced global demand coupled with easing supply chain constraints. On the other hand, Precious Metal prices recorded an increase of 8.3% in H1’2023 compared to a decline of 4.0% in H1’2022, mainly attributable to mismatch between demand and supply. Below is a summary performance of various commodities;
Source: World Bank
Global Equities market performance:
Global stock market recorded mixed performance in H1’2023, with most indices in developing economies declining attributable to capital flights following interest rate hikes in advanced economies aimed at curbing the inflationary pressures. Consequently, investors have resorted to place their investments in less risky markets, such as government papers and other investments alternatives. On the other hand, most indices in the developed countries recorded gains during the period, largely attributable to increased investor sentiments as a result of continued economic recovery following the full reopening of the economies coupled with investor preference for the stock markets in the developed countries. Notably, Nikkei 225 recorded the largest gain at 17.0% in H1’2023 driven by gains recorded by companies in automotive industry as a result of easing supply chain constraints which has increased investor sentiments on the industry’s stocks. NGSE ASI was the largest decliner, recording losses of 30.3% with the performance being skewed by the weakened Nigerian Naira following recent decision by the Central Bank of Nigeria to adopt floating exchange rate regime. NASI was the second largest decliner, recording losses of 26.2%, mainly due to capital flight as foreign investors sold off their investments in the Kenyan equities market. Additionally, investors have continued to attach a higher risk premium to the country as a result of deteriorated business environment as evidenced by the average Purchasing Managers Index (PMI) of 48.9 in the first five months of 2023, mainly attributable to the high inflation rate which has remained above the government’s target of 2.5%-7.5% for the past one year as well as the continued weakening of the Kenyan Shilling which has depreciated by 13.9% on a year to date basis in 2023. Below is a summary of the performance of key indices:
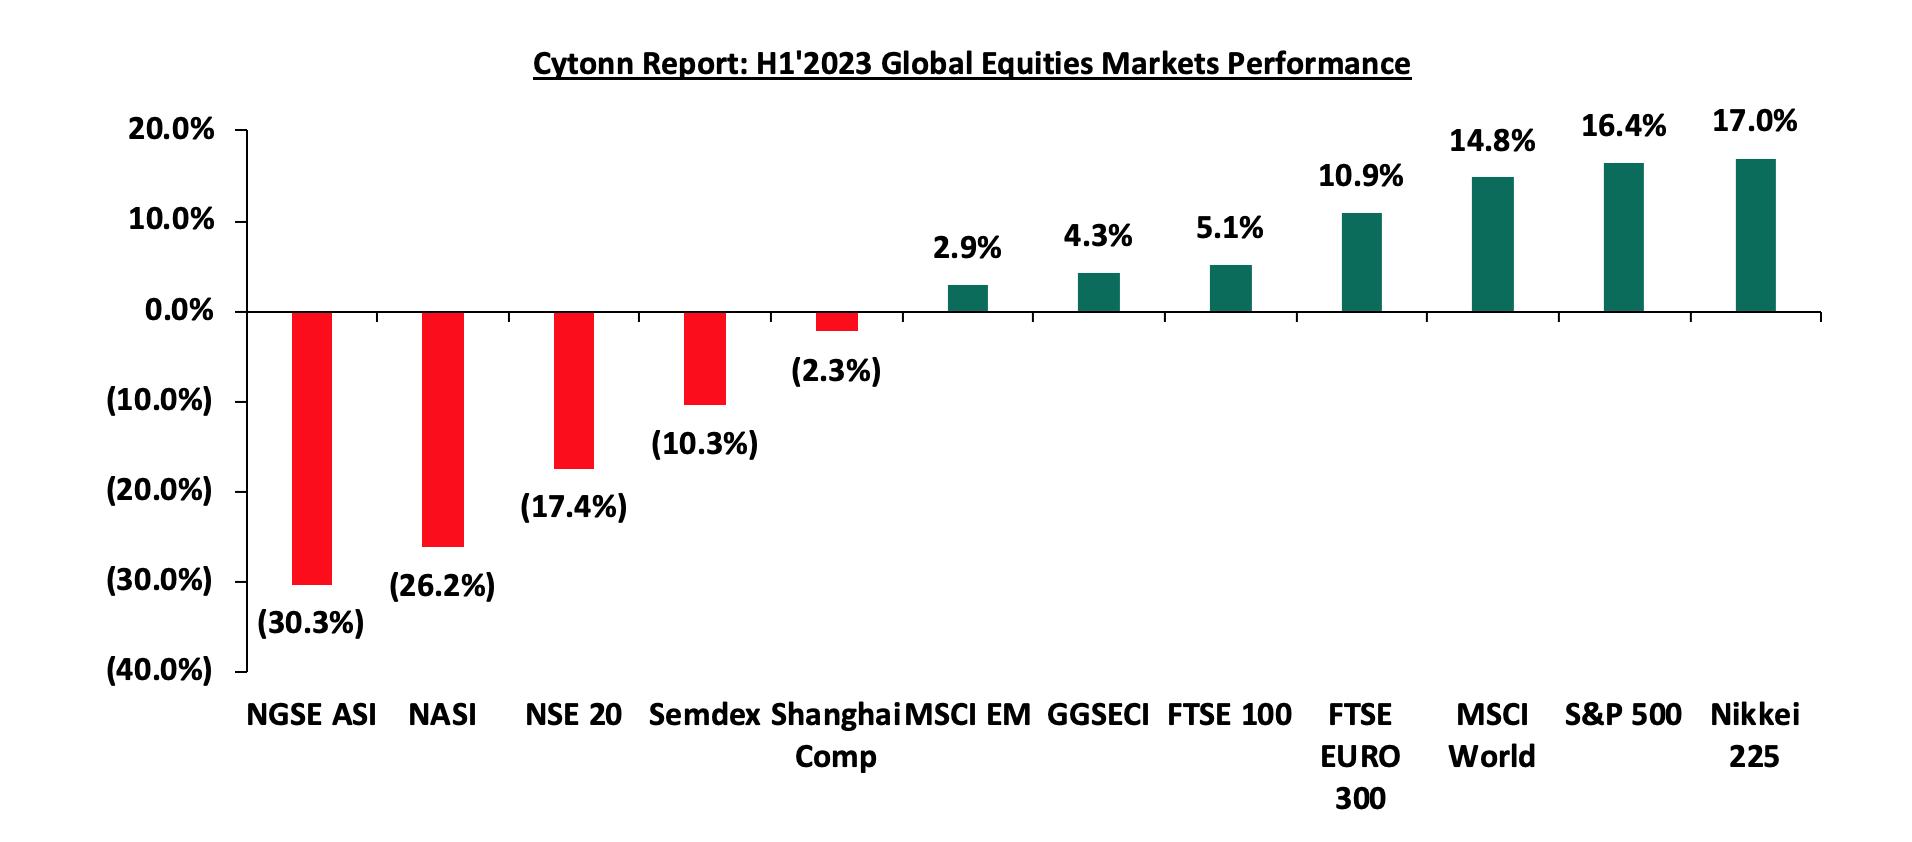
*Dollarized performance
According to the World Bank, the Sub Saharan economy is projected to grow at a moderate rate of 3.2% in 2023, which is 0.5% lower than the 3.7% growth estimates recorded in 2022. The expected slowdown in the regional economic growth is mainly on the back of adverse weather conditions that have undermined agricultural productivity, weak external demand, tight global financial conditions and high inflationary pressures in most countries in the region. The challenges have continued to exacerbate fiscal deficits in most countries leading to increased debt sustainability concerns in Sub-Saharan Africa as the region’s public debt to GDP ratio, remained high at 56.0% in 2022, albeit a decline from 60.0% in 2021. The public debt is expected to remain high due to increased debt serving costs as a result of continued currency depreciations and increased interest rates in developed economies. Additionally, many countries are providing subsidies in order to mitigate inflationary pressures which could worsen public finance, increase public debt and weigh down on debt sustainability.
Currency Performance:
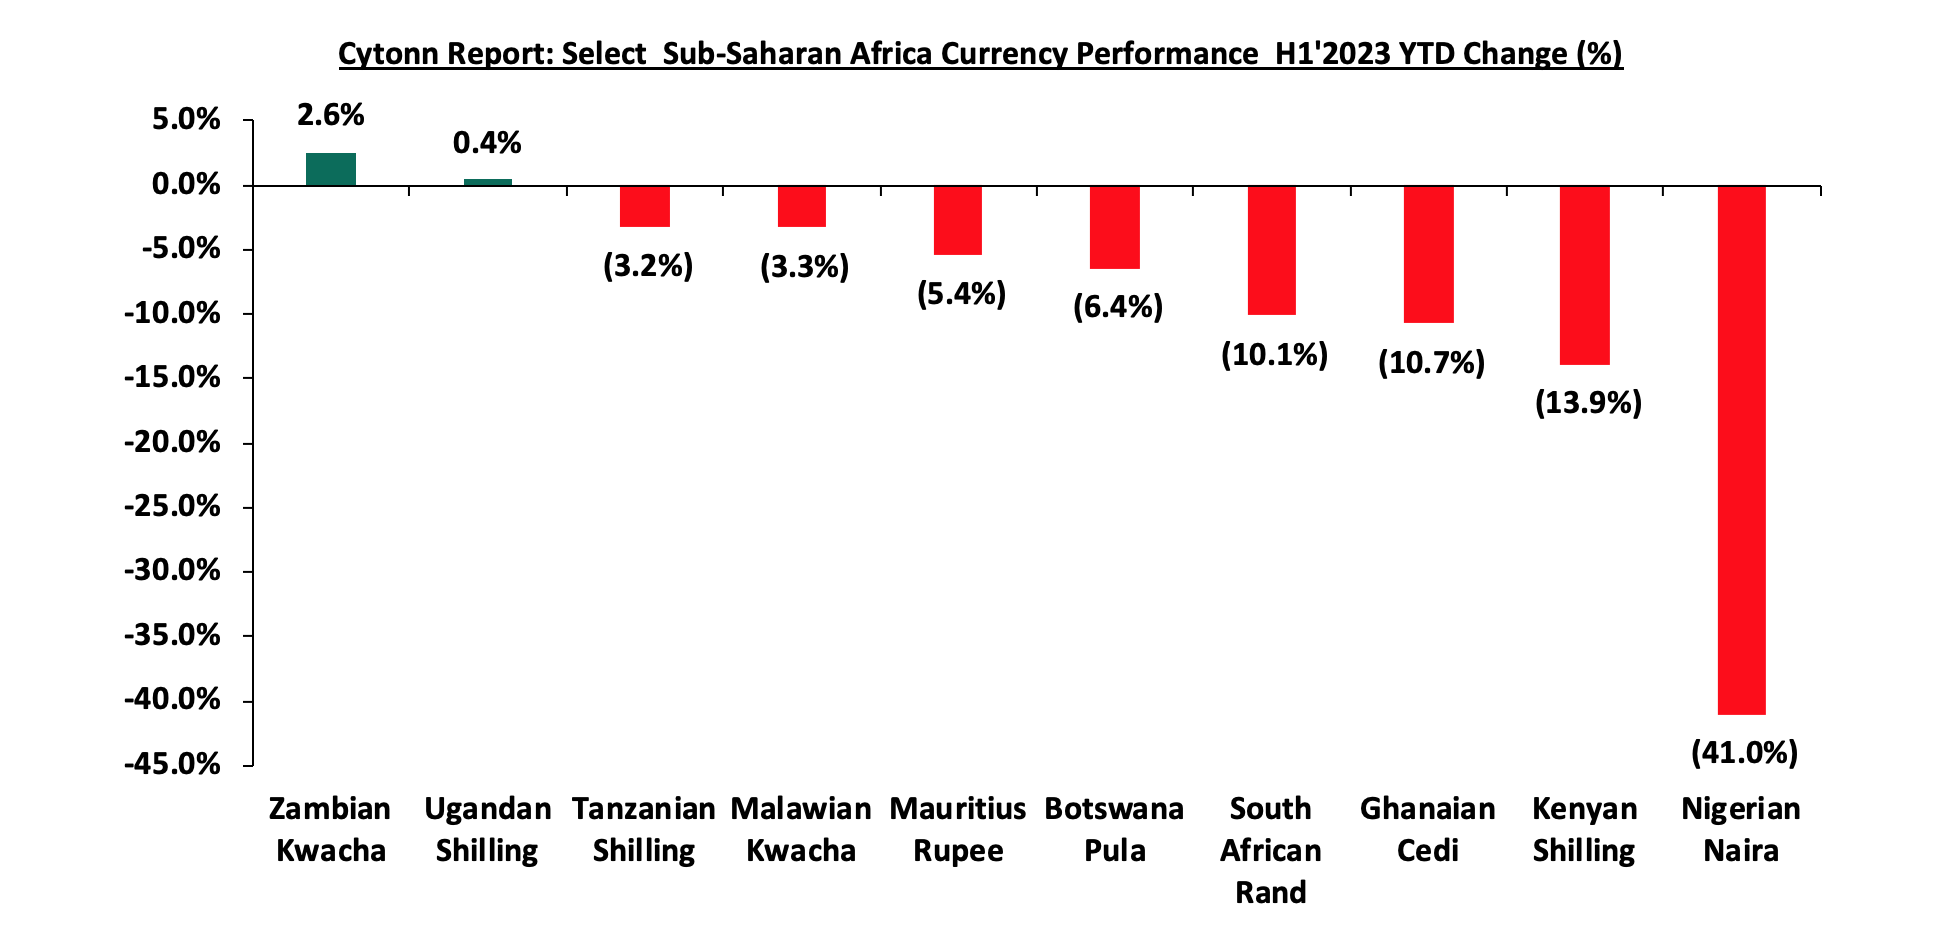
In H1’2023, most of the select Sub-Saharan currencies depreciated against the US Dollar, mainly attributable to the elevated inflationary pressures in the region, high debt servicing costs that continue to dwindle foreign exchange reserves, and monetary policy tightening by advanced economies. The high interest rates in developed countries have led to massive capital outflows as investors, both institutional and individual seek to take advantage of the higher returns offered in developed economies. Further, the elevated inflationary pressures in most economies in the region puts pressure on the value of local currencies due to expensive importation. Below is a table showing the performance of select African currencies against the US Dollar:
|
Cytonn Report: H1’2023 Select Sub Saharan Africa Currency Performance vs USD |
|
||||
|
Currency |
Jun-22 |
Jan-23 |
Jun-23 |
Last 12 Months change (%) |
YTD change (%) |
|
Zambian Kwacha |
17.1 |
18.1 |
17.6 |
(3.0%) |
2.6% |
|
Ugandan Shilling |
3,715.1 |
3,678.1 |
3,662.1 |
1.4% |
0.4% |
|
Tanzanian Shilling |
2,333.0 |
2,332.0 |
2,409.0 |
(3.2%) |
(3.2%) |
|
Malawian Kwacha |
1,022.0 |
1,009.0 |
1,043.0 |
(2.0%) |
(3.3%) |
|
Mauritius Rupee |
43.5 |
43.0 |
45.4 |
(4.3%) |
(5.4%) |
|
Botswana Pula |
12.1 |
12.6 |
13.5 |
(9.9%) |
(6.4%) |
|
South African Rand |
16.2 |
16.9 |
18.8 |
(13.8%) |
(10.1%) |
|
Ghanaian Cedi |
7.9 |
9.8 |
11.0 |
(27.8%) |
(10.7%) |
|
Kenyan Shilling |
117.8 |
123.4 |
140.5 |
(19.3%) |
(13.9%) |
|
Nigerian Naira |
414.6 |
447.6 |
758.8 |
(45.4%) |
(41.0%) |
Source: Yahoo Finance
The chart below shows the year to date performance of different sub-Saharan African countries in H1’2023;
Source: Yahoo Finance
Key take outs from the above table and chart include:
- The Zambian kwacha was the largest gainer against the USD Dollar, gaining by 2.6% year to date, mainly attributable to positive investor confidence following Zambia’s improved macroeconomic performance and strong trade surplus driven by higher copper price earnings on the back of easing global supply chain constraints,
- Nigeria Naira was the worst performing currency in H1’2023 and the largest decliner over the last twelve months, depreciating by 41.0% and 45.4%, respectively, mainly as a result of the recent decision by the Central Bank of Nigeria to adopt floating exchange rate regime, where the currency value of the Naira is allowed to vary according to the foreign exchange market, and,
- The Kenya Shilling depreciated by 13.9% in H1’2023 to close at Kshs 140.5 against the US Dollar, compared to Kshs 123.4 recorded at the beginning of the year, driven by increased dollar demand from importers, especially in the oil and energy sectors, the ever-present current account deficit, and the need for government debt servicing, which has continued to put pressure on the country’s forex reserves.
African Eurobonds:
Africa’s appetite for foreign-denominated debt has continued to decline in recent times, with no issuer during H1’2023, with most countries shying away from the Eurobonds market due to sustained high yields and tough macroeconomic conditions. The significant increase in yields was partly attributable to investors attaching a higher risk premium to Sub-Saharan Countries, driven by the region’s elevated inflationary pressures, public debt distress, and continued depreciation of local currencies. Yields on the Kenyan and Senegal Eurobonds remained elevated despite recording marginal declines of 0.3% points and 1.1% points in H1’2023 to 12.6% and 7.8%, respectively, from 12.9% and 8.9% recorded at the end of December 2022. Below is a 5-year graph showing the Eurobond secondary market performance of select 10-year Eurobonds issued by the respective countries:
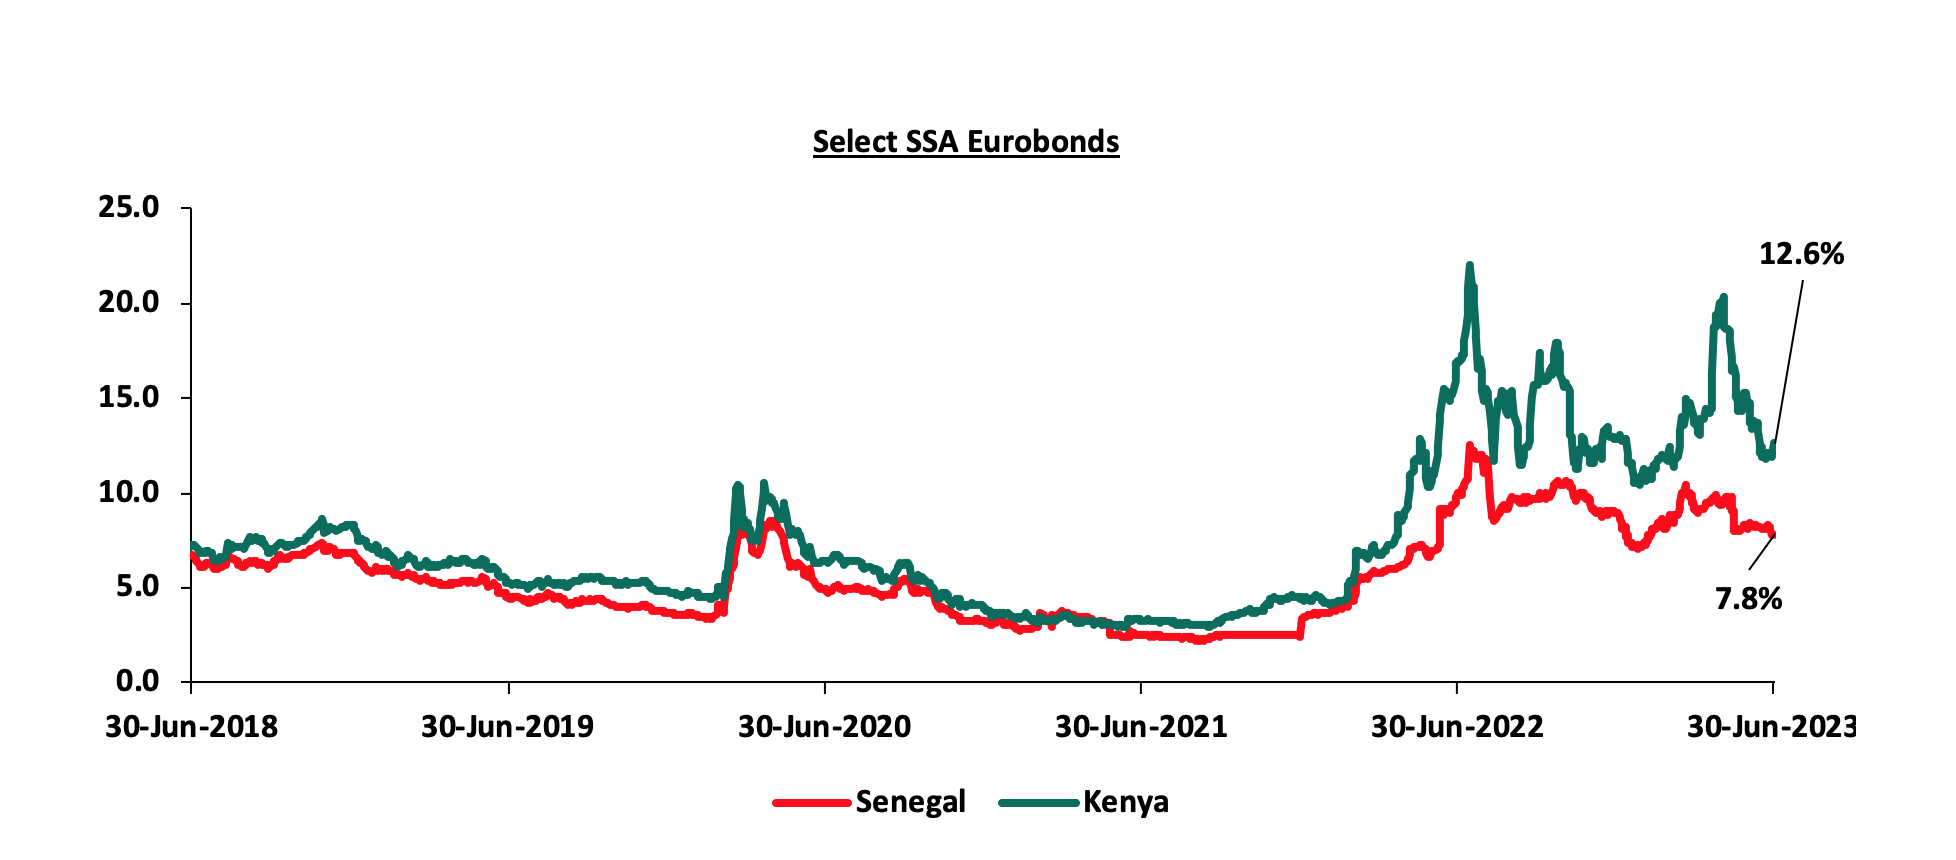
Source: S&P Capital
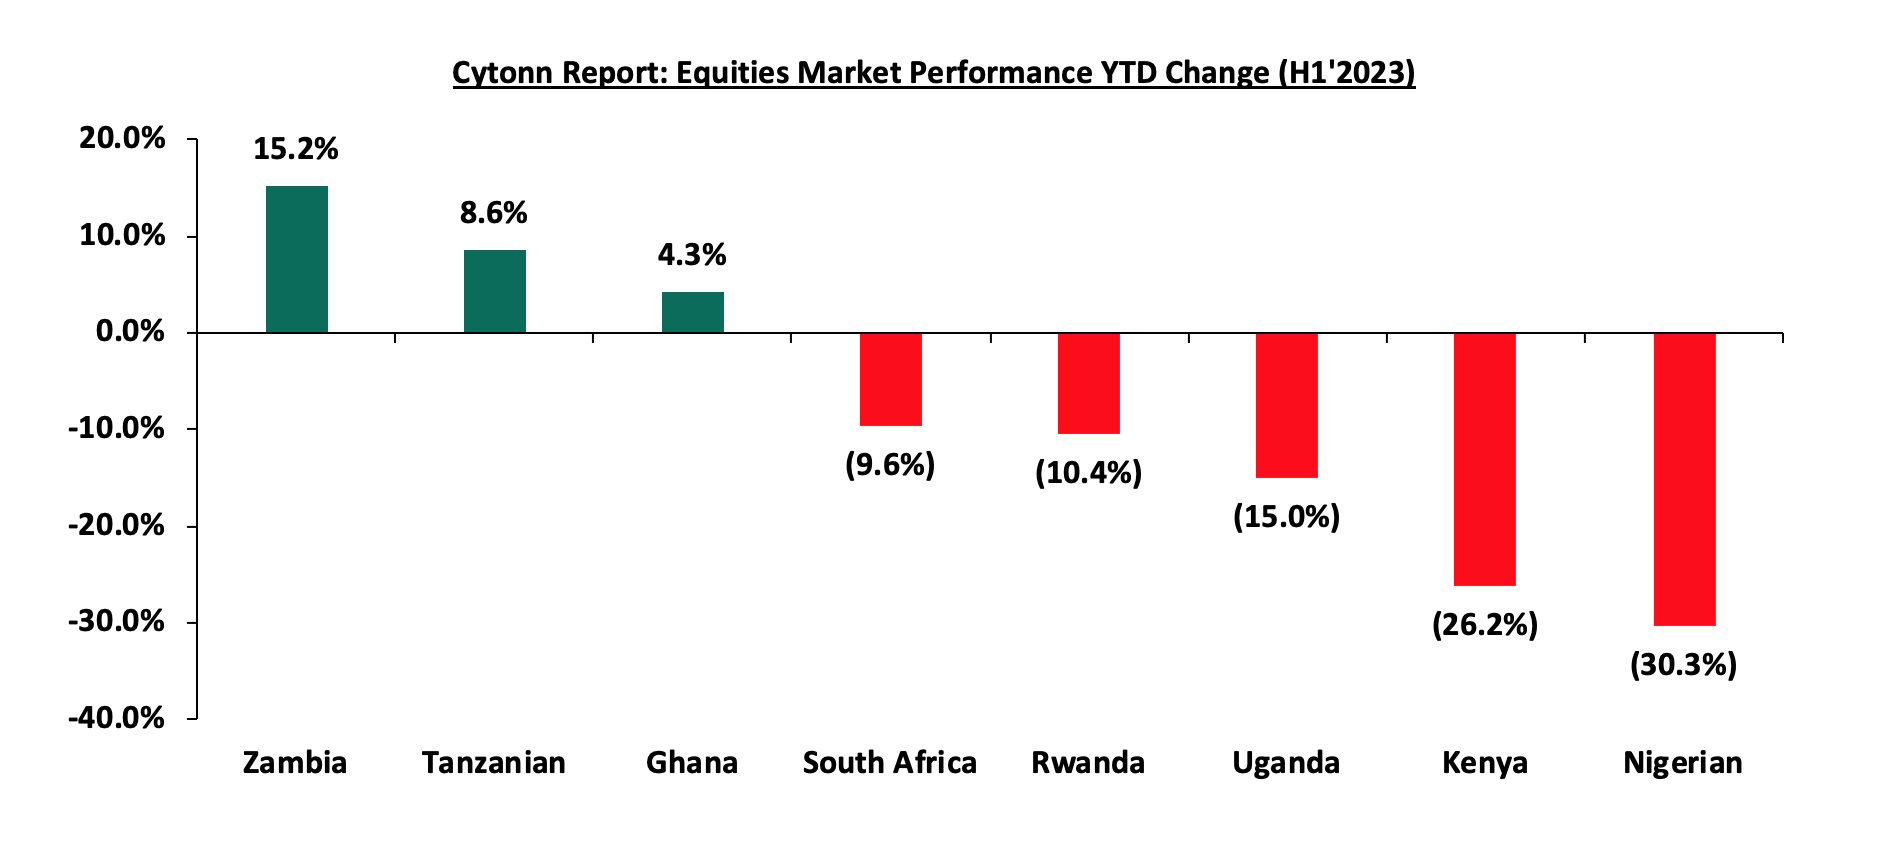
Equities Market Performance:
Sub-Saharan Africa (SSA) stock markets recorded mixed performance in H1’2023, with Zambia’s stock market (LASILZ) being the best performing market gaining by 15.2% YTD driven by the rallying of commodity prices due to easing global supply chain constraints with the country being the main exporter of Copper to countries such as China, Switzerland and Singapore. Nigeria’s NGSEASI was the worst performing stock market, declining by 30.3% YTD, with the index being weighed down by the devaluation of the Nigerian Naira following the recent decision by the Central Bank of Nigeria to adopt floating exchange rate regime. Kenya’s NASI was the second worst performing stock market, declining by 26.2% at the end of H1’2023, mainly attributable to increased capital flight with investors chasing higher returns from advanced economies following hiking of interest rates as well as deterioration in investor confidence in the country. This is mainly on the back of macroeconomic uncertainties occasioned by the high inflation rate of 7.9% as of June 2023 and the continued weakening of the Kenyan Shilling which has depreciated by 13.9% on a year to date basis in 2023. Below is a summary of the performance of key indices:
|
Cytonn Report: Equities Market Performance H1’2023 (Dollarized*) |
||||||
|
Country |
Index |
Jun-22 |
Jan-23 |
Jun-23 |
Last 12 Months change (%) |
YTD change (%) |
|
Zambia |
LASILZ |
398.6 |
406.2 |
468.1 |
17.4% |
15.2% |
|
Tanzanian |
DARSDEI |
1.6 |
1.6 |
1.7 |
7.7% |
8.6% |
|
Ghana |
GGSECI |
318.1 |
245.2 |
255.6 |
(19.7%) |
4.3% |
|
South Africa |
JALSH |
4,197.9 |
4,408.4 |
3,984.9 |
(5.1%) |
(9.6%) |
|
Rwanda |
RSEASI |
0.1 |
0.1 |
0.1 |
(14.5%) |
(10.4%) |
|
Uganda |
USEASI |
0.3 |
0.3 |
0.3 |
(9.4%) |
(15.0%) |
|
Kenya |
NASI |
1.0 |
1.0 |
0.8 |
(23.6%) |
(26.2%) |
|
Nigerian |
NGSEASI |
124.5 |
115.3 |
80.4 |
(35.5%) |
(30.3%) |
|
*The index values are dollarized for ease of comparison |
||||||
Source: Cytonn Research, Kwayisi, Yahoo Finance
The chart below shows the YTD Performance of the sub-Saharan Equities Market;
GDP growth in Sub-Saharan Africa region is expected to slow down, in line with the rest of the global economy. Additionally, public debt continues to be a major headwind, with high debt levels experienced in the region on the back of continued weakening of local currencies, which will make debt servicing costlier, making the region less attractive to foreign capital.
According to the Kenya National Bureau of Statistics (KNBS) Economic Survey 2023 the Kenyan economy recorded a 4.8% expansion in FY’2022, lower than the 7.6% growth recorded in FY’2021. The performance was supported by growth in most economic activities such as Financial and insurance, Information and communication and Transportation and storage which grew by 12.8%, 9.9% and 5.6%, respectively. The overall growth was however weighed down by the 1.6% contraction in the Agriculture, Forestry and Fishing sector, attributable to the drought experienced in most parts of the country in 2022. Despite the decline in the economic growth, the relatively high growth highlighted the economy’s resilience following multiple shocks such as supply chain constraints, soaring global fuel prices, elevated inflationary pressures and currency depreciation. The Kenyan Economy is projected to grow at an average of 5.2% in 2023 according to various organizations as shown below:
|
Cytonn Report: Kenya 2023 growth Projections |
||
|
No. |
Organization |
2023 GDP Projections |
|
1 |
International Monetary Fund |
5.1% |
|
2 |
National Treasury |
6.1% |
|
3 |
World Bank |
5.0% |
|
4 |
Fitch Solutions |
5.1% |
|
5 |
Cytonn Investments Management PLC |
5.0% |
|
Average |
5.2% |
|
Source: Cytonn Research
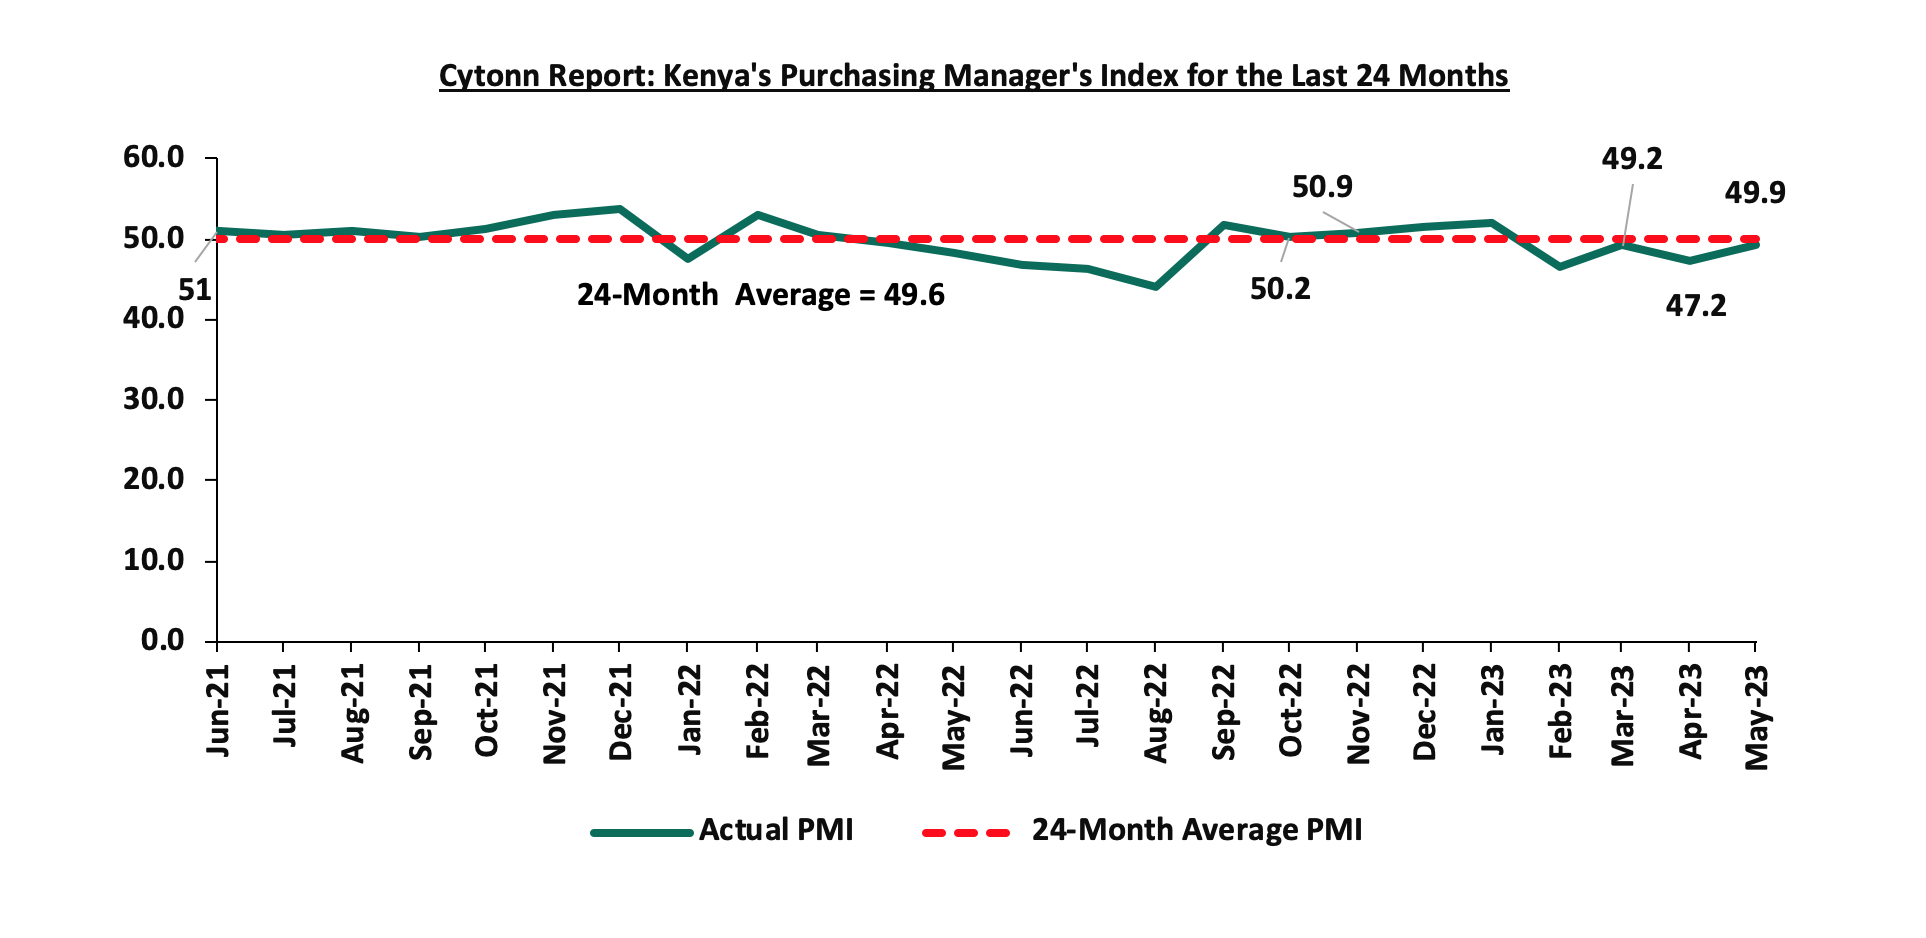
Key to note, Kenya’s general business environment deteriorated in the first half of 2023, with the average Purchasing Manager’s Index for the first five months of the year coming at 48.9, compared to 49.7 recorded in a similar period in 2022. The deterioration was mainly on the back of the elevated inflationary pressures experienced in the country, which have seen consumers cut back on spending, coupled with aggressive depreciation of the Kenyan shilling which has contributed significantly to the fall in production output by most businesses. Additionally, the Moody’s Credit Rating agency downgraded Government of Kenya’s long-term foreign currency and local-currency issuer ratings and senior unsecured debt ratings to B3 from B2 with a negative outlook. The downgrade was on the back of increased liquidity risk partly attributable to reduced investor appetite of longer dated government securities and the rising cost of domestic issuance with investors demanding higher rates from government issuance. The downgrade indicates increased material default risk with very limited margin of safety amid tighter liquidity as well as high debt servicing obligations in the next fiscal year. The chart below summarizes the evolution of PMI over the last 24 months. (A reading above 50.0 signal an improvement in business conditions, while readings below 50.0 indicate a deterioration):
Inflation:
The average inflation rate increased to 8.5% in H1’2023, compared to 6.3% in H1’2022, attributable to high fuel and food prices. Notably, fuel prices increased by 22.9%, 28.3% and 35.6% in June 2023 to Kshs 195.5, Kshs 179.7, and Kshs 173.4, from Kshs 159.1, Kshs 140.0, and Kshs 127.9 per liter in June 2022 for Super petrol, Diesel, and Kerosene, respectively. Inflation for the month of June 2023 marginally eased to 7.9%, from 8.0% recorded in May 2023, mainly driven by a 1.3% increase in the food and non-alcoholic beverages index. Below is a chart showing inflation trend for the last five years:
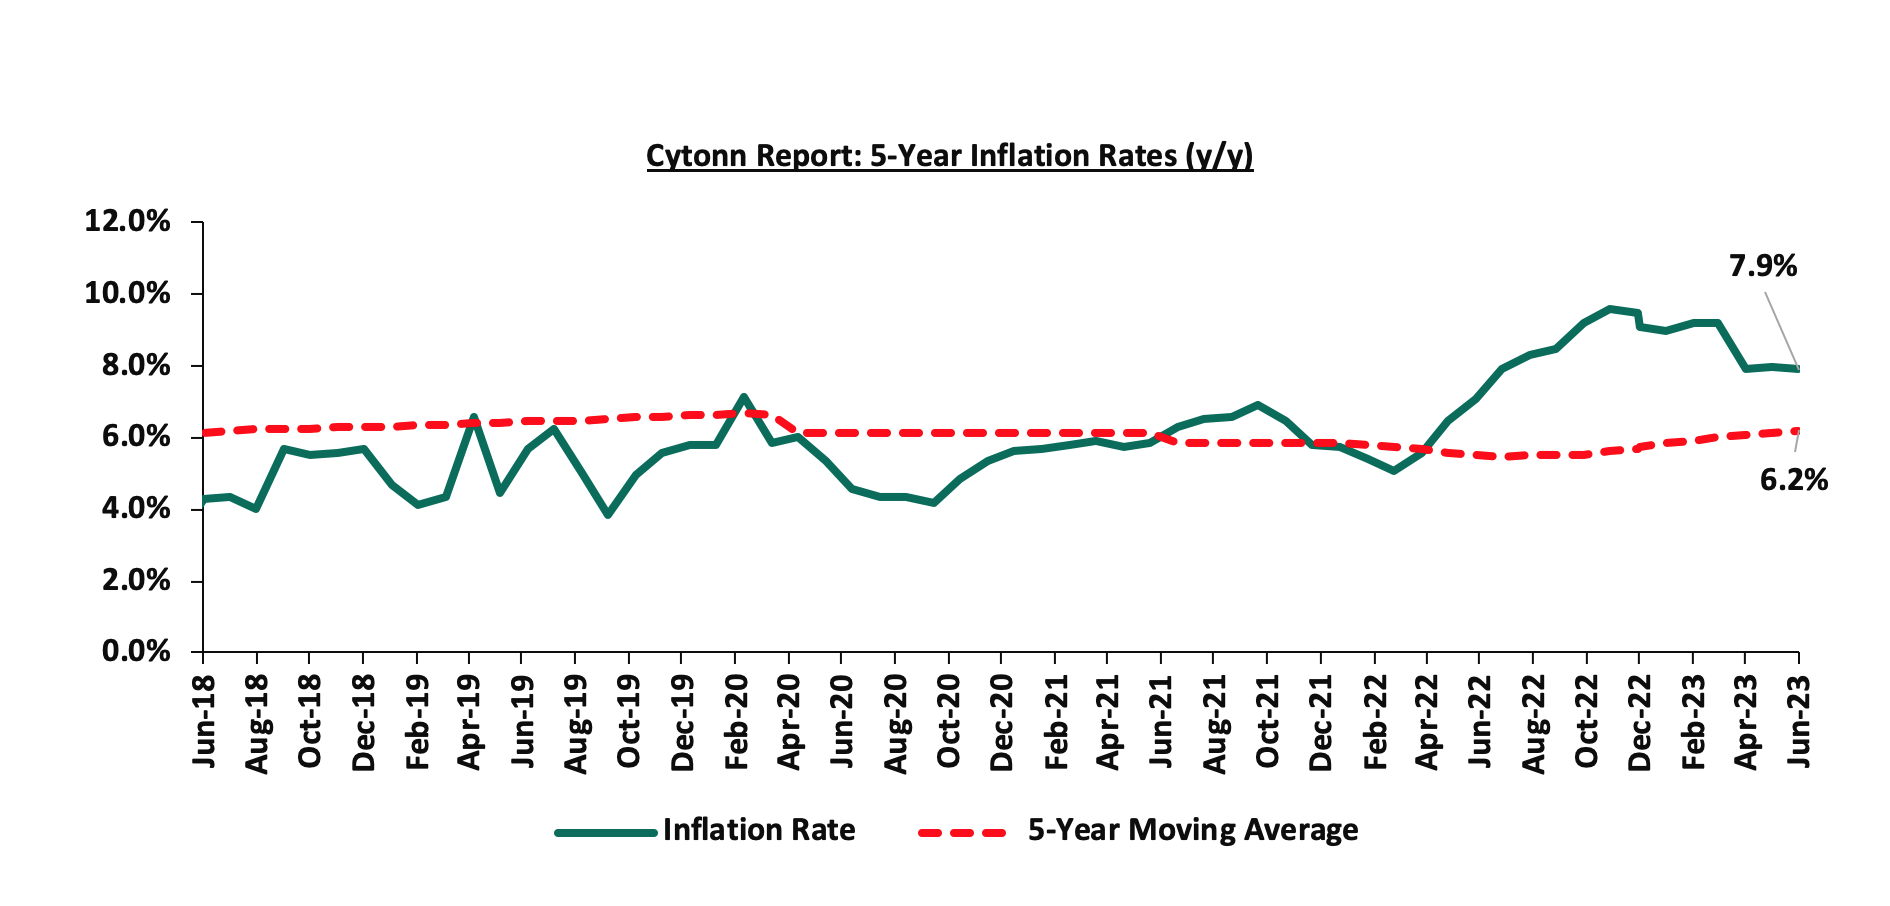
For the last 13 months, Kenya’s inflation has persistently remained above the Central Bank of Kenya (CBK) target range of 2.5% - 7.5%, despite efforts by the Monetary Policy Committee (MPC) to contain the rise by raising the Central Bank Rate (CBR) by cumulative of 300.0 bps to 10.5% in June 2023 from the 7.5% CBR rate that was set in July 2022. Going forward, we expect the inflationary pressures to remain elevated in the short to medium term, mainly on the back of high food and fuel prices, which are key components of the headline inflation index. Additionally, the complete removal of the fuel subsidy, coupled with the increase in VAT on petroleum products to 16.0% from 8.0% in the new Finance Act 2023 is expected to add more pressure on the fuel prices in the country.
June 2023 Inflation
The year-on-year inflation rate in the month of June 2023 eased to 7.9%, from the 8.0% inflation rate recorded in the month of May 2023, while the monthly inflation rate for June 2023 was 0.8%. This was in line with our expectation of the inflation rate to come in within a range of 7.7%-8.1%. The headline inflation was largely driven by increase in prices of commodities in the following categories; food and non-alcoholic beverages; housing, water, electricity, gas, and other fuels; and transport. The table below shows a summary of both the year on year and month on month commodity indices performance:
|
Cytonn Report: Major Inflation Changes – June 2023 |
|||
|
Broad Commodity Group |
Price change m/m (May-2023/June-2023) |
Price change y/y (May-2022/June-2023) |
Reason |
|
Food and Non-Alcoholic Beverages |
1.3% |
10.3% |
The m/m increase was mainly driven by increase in price commodities such as carrots, onions, tomatoes and maize grain-loose. The increase was, however, mitigated by drop in prices of commodities such potatoes, avocado, kales and cabbages |
|
Housing, Water, Electricity, Gas and Other Fuel |
0.6% |
9.4% |
The m/m change was mainly due to increase in prices of electricity. The increase was, however, mitigated by the drop in prices of LPG gas |
|
Overall Inflation |
0.8% |
7.9% |
The m/m was mainly driven by 1.3% increase in prices of food and non-alcoholic Beverages |
Inflationary pressures in the country continue to remain elevated and above the Central Bank of Kenya target range of 2.5%-7.5% for a thirteenth consecutive month to June 2023, with commodities under food and non-alcoholic beverages being the largest contributors of inflation. The sustained inflationary pressures continue despite the monetary policy committee intervening with subsequent hikes in the Central Bank Rate, raising the CBR rate by a cumulative of 300.0 bps since July 2022 to 10.50% in June 2023. Going forward, we expect the inflationary pressures in the country to remain elevated in the short to medium term due to high fuel and electricity prices following the increase on VAT on petroleum products to 16.0% in the Finance Act 2023 from 8.0% that was introduced in 2018, with fuel prices being a major contributor to the headline inflation. Additionally, the sharp rise in sugar prices witnessed in the month of June, coupled with the introduction of excise duty on imported sugar at the rate of Kshs 5.0 per kg is expected to exacerbate the food inflation. Further, we are of the view that the eventual slowdown in inflationary pressure is pegged on removing the impediments on the supply and production chain so as to match the supply and demand side thereby easing food supply deficit in the country.
The Kenyan Shilling:
The Kenyan Shilling depreciated against the US Dollar by 13.9% in H1’2023, to close at Kshs 140.5, from Kshs 123.4 as at the end of FY’2022, partly attributable to increased dollar demand from importers, especially in the energy, oil and manufacturing sectors. Key to note, this is the lowest the Kenyan shilling has ever depreciated against the dollar. During the week, the Kenya Shilling depreciated against the US Dollar by 0.1% to close at 140.5, from 140.4 the previous week. We expect the shilling to remain under pressure in 2023 as a result of:
- An ever-present current account deficit estimated at 4.9% of GDP in twelve months to January 2023, from 5.6% recorded in a similar period last year, and,
- The need for government debt servicing, continues to put pressure on forex reserves given that 67.3% of Kenya’s external debt was US Dollar denominated as of March 2023
The shilling is however expected to be supported by:
- Diaspora remittances standing at a cumulative USD 1,688.0 mn in 2023 as of May 2023, albeit 1.8% lower than the USD 1,718.6 mn recorded over the same period in 2022, which has continued to cushion the shilling against further depreciation. In the May 2023 diaspora remittances figures, North America remained the largest source of remittances to Kenya accounting for 55.4% in the period, followed by Europe at 17.7% while the rest of the world accounted for 26.8% of the total,
- High Forex reserves currently at USD 7.5 bn (equivalent to 4.1-months of import cover), which is above the statutory requirement of maintaining at least 4.0-months of import cover, albeit lower than EAC region’s convergence criteria of 4.5-months of import cover. In addition, the reserves were boosted by the USD 1.0 bn (Kshs 138.6 bn) World Bank loan facility received in June 2023 under the Development Policy Operation (DPO) and are expected to be boosted further by the expected USD 410 mn (Kshs 56.7 bn) from the International Monetary Fund (IMF) and the USD 500.0 mn (Kshs 69.6 bn) commercial loan secured from a syndicate of global banks consisting of American Citibank, British Standard Chartered Bank, Stanbic Bank, and South Africa’s RMB Holdings Ltd, and,
- The tourism inflow receipts came in at KSHS 268.1 bn in 2022, a significant 82.9% increase from KSHS 146.5 bn inflow receipts recorded in 2021
Monetary Policy:
The Monetary Policy Committee (MPC) met four times in H1’2023 and for the first time since May 2016, the Central Bank Rate was set at 10.5% in the Fourth sitting in June 2023. The MPC noted that the sustained elevated inflationary pressures in the country on the back of high fuel and commodity prices. Below are some of the Key highlights from the meeting:
- Overall Inflation increased to 8.0% in May 2023 from 7.9% in April 2023 on the back of high food and fuel prices in the country. Food inflation rose to 10.2% in May 2023 from 10.1% in April 2023, mainly due to increases in the prices of for sugar. However, the food inflation was slowed down by the decrease in the price of some key food items such as vegetables attributable to improved supply due to long rains and lower global food prices. Additionally, fuel inflation remained elevated at 13.6% in May 2023 from 13.2% in April 2023 attributable to the government’s decision to completely remove fuel subsidy program coupled with the upward adjustments of electricity prices. We expect the inflation to remain elevated in the near term partly attributed to the high electricity prices, the removal of fuel subsidy and associated second round effect,
- The leading economic indicators pointed to a strong performance of the Kenyan economy in the first half of 2023 driven by the activities in the service sector and the recovery of the Agriculture sector. The economy is expected to remain resilient in 2023 supported by continued strong performance of the services sector and expected recovery in agriculture sector,
- The Central Bank of Kenya forex reserve which currently stand at USD 7.5 bn representing a 4.1 months of import cover, continues to provide adequate cover against any short term shocks in the foreign exchange markets
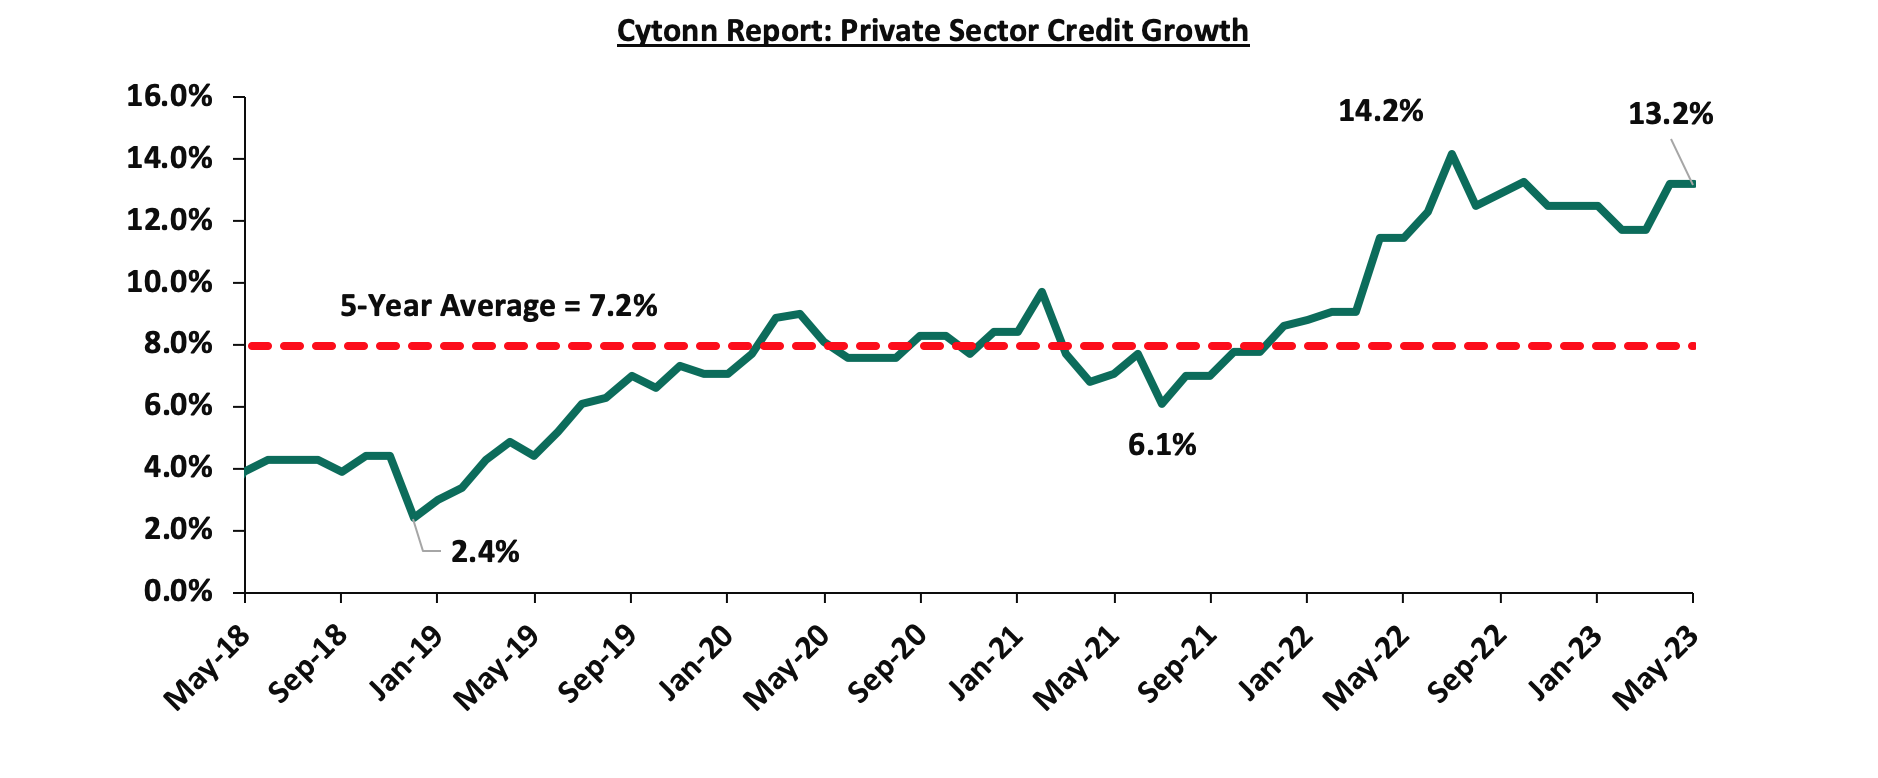
- Private sector credit growth stood at 13.2% in May 2023, similar to what was recorded in April 2023. Key sectors that recorded strong credit growth were transport and communication, manufacturing, trade, and Consumer durables of 22.0%, 19.3%, 15.4%, and 11.9%. Consequentially, the number of loan application and approval remained strong, reflecting increased demand and resilient economic activities. The chart below shows the movement of the private sector credit growth of the last five years:
- Goods exports remained strong having grown by 5.5% in the 12 months to May 2023 compared to 12.1% recorded in a similar period in 2022. Notably, receipts from tea and manufacturing goods exports increased by 10.2% and 25.4%, respectively during the period. The increase in receipts from tea exports is attributed to improved prices due to increased demand from traditional markets. In addition, imports declined by 2.3% in the 12 months to May 2023 compared to 20.4% growth recorded in a similar period in 2022, on the back of lower imports of infrastructure related equipment due to completion of major projects. Remittances stood at USD 4.0 bn in 12 months to May 2023 and were 0.1% higher compared to what was recorded in the same period in 2022,
- The banking sector remains resilient and stable with strong liquidity and capital adequacy ratios, despite the deterioration in asset quality. The Gross Non-Performing loans to gross loans ratio increased to 14.9% in May 2023, compared to 14.6% in April 2023. The increase in non-performing loans was noted in sectors such as Manufacturing, trade, real estate and transport and communication sector. However, banks have continued to make adequate provisioning for the NPLs, and,
- The Committee noted the ongoing implementation of the FY2022/23 Government Budget, particularly the recent strong tax revenue collection reflecting enhanced tax administration efforts, evidenced by the revenue collections of Kshs 1,812.2 bn in the FY’2022/2023 as at the end of May, equivalent to 82.7% of the revised estimates of Kshs 2,192.0 bn for FY’2022/2023 and was 90.2% of the prorated estimates of Kshs 2,009.3 bn. The committee also noted the proposed FY2023/24 budget is expected to support the envisaged fiscal consolidation.
The MPC concluded that following the sustained inflationary pressures, the elevated global risks and their potential impact on the domestic economy, there was a need for further tightening of the monetary policy in order to anchor inflation within its target range of 2.5% to 7.5%. Going forward, we expect the inflationary pressures to remain elevated in the short term, mainly on the back of high food and fuel prices. Additionally, the implementation of the Finance Act 2023 which contains a number of tax adjustments such as increase in VAT on petroleum products to 16.0% from the 8.0%, as well as introduction of excise duty of Kshs 5.0 per kg on imported sugar is expected to worsen fuel and food prices with businesses transferring the added cost to the consumers. The Committee will meet again in July 2023, but will closely monitor the impact of the policy measures as well as development in domestic and global economy and take additional measures as necessary.
Fiscal Policy:
The total Kenyan budget for the FY’2023/2024 National Budget increased by 8.7% to Kshs 3.7 tn from the Kshs 3.4 tn in FY’2022/2023 while the total revenue inclusive of grants increasing by 15.7% to Kshs 3.0 tn from the Kshs 2.6 tn in FY’2022/2023. The increase is mainly due to a 17.3% increase in ordinary revenue to Kshs 2.6 tn for FY’2023/2024, from the Kshs 2.2 tn in FY’2022/2023 with the increase largely dependent on the effectiveness of the Kenya Revenue Authority in collecting taxes as well as increase in some of the existing taxes to meet its revenue target. However, there are still concerns about the government's ability to meet its revenue collection targets in FY’2023/2024, on the back of the current operating environment with the business environment deteriorating to an average PMI for the first 5 months in 2023 coming at 48.9 below the 50-mark threshold, mainly occasioned by high inflationary pressures and the rising interest rates. For more information, see our note on Kenya’s FY’2023/2024 Budget Review.
For the FY’2022/2023, we do not expect the government to meet its revenue collection target having collected Kshs 1,812.7 bn, equivalent to 82.7% of the revised estimates of Kshs 2,192.0 bn for FY’2022/2023 and 90.2% of the prorated estimates of Kshs 2,009.3 bn in the first eleven months of FY’2022/2023. Notably, the total expenditure amounted to Kshs 2,601.6 bn, equivalent to 72.0% of the revised estimates of Kshs 3,612.3 bn, and 86.4% of the prorated expenditure estimates of Kshs 3,010.3 bn, an indication of modest spending by the government. The total borrowings as at the end of May 2023 amounted to Kshs 776.4 bn, equivalent to 55.2% of the revised estimates of Kshs 1,407.1 bn and 60.2% of the prorated estimates of Kshs 1,289.9 bn.
Going forward, we believe that the Tax adjustments in the adopted finance act 2023 will widen the tax base revenue for the government and the full implementation of the act will enable the government enhance the revenue collections.
H1’2023 Highlights:
- The Kenya Revenue Authority released the draft regulations for the Excise Duty (Excisable Goods Management Systems)(Amendment) Regulations, 2023 having reviewed the previous Excise Duty (Excisable Goods Management Systems)(Amendment) Regulations, 2017, under the Excise Duty Act No. 23 of 2015, seeking to increase the stamp duty fees on various commodities. For more information, please see our Cytonn Weekly #03/2023,
- The National Treasury presented the Supplementary Budget for FY’2022/23 to the National Assembly, seeking to slightly increase the gross total budget by 0.4% to Kshs 3,373.3 bn, from the previous estimates of Kshs 3,358.6 bn. Mainly due to an increase in the recurrent expenditure by 6.6% to Kshs 1,496.9 bn in the Supplementary estimates from Kshs 1,403.9 bn in the Original estimates. On the other hand, Development expenditure was set to reduce by 14.9% to Kshs 609.1 bn in the supplementary estimates from Kshs 715.4 bn in the original estimates. For more information, please see our Cytonn weekly #06/2023,
- S&P Global Ratings downgraded Kenya’s outlook to negative from stable, signaling increased risks of defaults in debt repayments amid weakening liquidity position aggravated by sustained decline in foreign exchange reserves as well as high debt servicing obligations in the next fiscal year. Furthermore, the constrained access to international capital markets has heightened Kenya’s medium term fiscal and external refinancing risks. For more information, please see our February 2023 Cytonn Monthly,
- The Central Bank of Kenya announced the issuance of the Foreign Exchange Code (the FX Code) on 22 March 2023 to commercial banks, in a move to regulate wholesale transactions of the foreign exchange market in Kenya. For more information, please see our Cytonn Weekly #12/2023,
- The Central Bank of Kenya announced the issuance and usage of the Kenya Quick Response Code Standard 2023 (KE-QR Code Standard 2023) which is aimed at guiding banks and payment service providers that are approved and regulated by the Central Bank in issuing of Quick Response Codes to consumers and businesses that accept digital payments. For more information, please see our Cytonn Weekly #18/2023,
- The Moody’s Credit Rating agency downgraded Government of Kenya’s long-term foreign currency and local-currency issuer ratings and senior unsecured debt ratings to B3 from B2 with a negative outlook. This indicated increased material default risk with very limited margin of safety amid tighter liquidity. For more information, please see our Cytonn Weekly #19/2023,
- The International Monetary Fund (IMF) announced that it had reached a staff level agreement with Kenyan authorities to conclude the fifth reviews of Kenya’s economic program under the Extended Fund Facility (EFF) and Extended Credit Facility (ECF) arrangements. This will allow Kenya to access financing of USD 410.0 mn (Kshs 56.7 bn) once the formal review is completed by July 2023. For more information, please see our Cytonn Weekly #21/2023,
- The World Bank approved a USD 1.0 bn (Kshs 138.6 bn) loan under the Development Policy Operation (DPO) to provide low cost budget financing, as well as to support key policy and institutional reforms for Kenya’s near term objectives of fiscal consolidations and long term goal of green and inclusive growth. For more information, please see our May 2023 Cytonn Monthly,
- The Kenya National Bureau of Statistics (KNBS) released the y/y inflation for May 2023, which came in at 8.0%, up from the 7.9% recorded in April 2023. This was in line to our expectations of an increase to within a range of 7.9% to 8.3%. For more information, please see our May 2023 Cytonn Monthly,
- Stanbic Bank released its monthly Purchasing Manager’s Index (PMI), highlighting that the index for the month of May 2023 came in at 49.2, up from 47.4 in April 2023, showing some slight improvement in business environment but still a contraction. This is the fourth consecutive month of sustained deterioration in the business environment. For more information, please see our Cytonn Weekly #23/2023,
- The government of Kenya secured a commercial loan of USD 500.0 million (Kshs 69.6 billion) to ease its financial distress According to the director-in-charge of debt management at the National Treasury, the loan was tapped from a syndicate of global banks consisting of American Citibank, British Standard Chartered Bank, Stanbic Bank, and South Africa’s RMB Holdings Ltd. For more information, please see our Cytonn Weekly #23/2023,
- The Energy and Petroleum Regulatory Authority (EPRA) released their monthly statement on the maximum retail fuel prices in Kenya effective 15 June 2023 to 14 July 2023. Notably, retail fuel prices for Diesel and Super Petrol per litre declined by 0.7% and 0.4% to Kshs 167.28 and Kshs 182.04, from Kshs 168.40 and 182.70 respectively. However, the retail price per litre for Kerosene increased by Kshs 0.2% to Kshs 161.48 from Kshs 161.13. For more information, please see our Cytonn Weekly #24/2023, and,
- The National Treasury gazetted the revenue and net expenditures for the eleven months of FY’2022/2023 ending 31 May 2023, highlighting that revenue collected as at the end of May 2023 amounted to Kshs 1,812.2 bn, equivalent to 82.7% of the revised estimates of Kshs 2,192.0 bn and 90.2% of the prorated estimates of Kshs 2,009.3 bn. For more information, please see our Cytonn Weekly #24/2023.
Weekly Highlights:
- Finance Act 2023
The Cabinet Secretary for the National Treasury tabled the Finance Bill 2023 to the parliament for discussion and was assented into law by the President of Kenya on 27 June 2023. As highlighted in our Cytonn Weekly #25/2023, the proposed tax measures in the Finance Bill 2023, were expected to add Kshs 379.2 bn to the exchequer for the fiscal year 2023/24. After discussion and consideration by the parliament, the bill was passed by Parliament following the third reading. Below, we highlight the key tax changes in the assented Finance Act as a follow up to our previous highlight;
Under the Income Tax Act;
- Introduction of withholding tax (WHT) on Payments made in respect of digital content monetization. The Finance Bill 2023 had proposed introduction of 15.0% WHT on collections made by digital content creators, however the finance committee made an amendment to the clause by capping the WHT at 3.0%. The government move to introduce the WHT on digital content is attributable to the growing popularity of digital content creation in Kenya due to increase access to internet, digital marketing and the growing youthful population, as such it will enable the government to widen its tax base,
- The Finance Bill 2023, introduced a new contribution to the National Housing Development Fund (NHDF). Initially, the bill had proposed a 3.0% deduction from employees’ basic monthly salary with the employer matching the contribution. However, the finance committee recommended a downward revision of the rate to 1.5% deduction from employees’ basic monthly salary, with the employer matching the contribution. Additionally, the committee proposed the removal of the maximum limit of individual contributions, and the contributors will not access their contributions at the end of the 7 years as earlier proposed,
- Introduction of a new tax at a rate of 15.0% for repatriated profit for non-residents who do not distribute dividends in Kenya, equivalent to the rate charged on dividend paid to non-residents,
- The Finance Bill 2023 proposed to change the bands for Turnover Tax (ToT) to a range of Kshs 500,000.0 to Kshs 25.0 mn from the current Kshs 1.0 mn to Kshs 50.0 mn. Additionally, the bill proposes to increase the turnover tax to 3.0%, from the current 1.0%. The move by the government to increase the turnover tax is mainly to increase its revenue,
- The bill also proposed reduction of the rate of Residential Rental Income tax to 7.5% from the current 10.0% in a bid to promote compliance of property owners and boost the government’s revenue collection,
- The Finance bill 2023 proposed to introduce a 5.0% WHT on payments made to residents’ persons or permanent establishments in respect to sales promotions, marketing and services. The move is to enhance compliance in the industry by tracking the revenues earned by the respective service providers and enhance compliance, and,
- The Finance Bill 2023, proposed to introduce two new tax band; i) 32.5% for monthly incomes between Kshs 500,000.0 and 800,000.0, and, ii) 35.0% for monthly incomes above Kshs 800,000.0. A move aimed at increasing the tax revenue to support the fiscal budget. However, with majority of Kenyans earning less than Kshs 100,000.0 per month, its impact on the tax revenue will be very negligible.
Under the Excise Duty Act;
- The Finance Bill 2023 proposed to repeal annual inflation adjustment, which currently the commissioner general has the power to adjust the specific rate of excise duty once per year to consider inflation. The proposal is a welcomed move since it will provide much-needed certainty for business planning,
- The finance bill 2023 proposed the introduction of excise duty on imported sugar at the rate of Kshs 5.0 per kg excluding the sugar imported or purchased locally for use in the manufacture of pharmaceutical products,
- The Finance bill 2023, proposed an introduction of 15.0% excise duty on fees charged on the advertisement on alcoholic beverages, betting, gaming, and lottery and prize competition, a move aimed at discouraging consumption of the services deemed inimical to citizens,
- The Finance bill 2023 proposed the introduction of excise duty on imported fish at Kshs 100,000.0 per metric ton or 10.0% of the value, a move aimed at protecting the local fishing industry,
- The bill proposed to introduce a fine of Kshs 5.0 mn or a jail term not exceeding 3 years upon conviction to offenses relating to excise stamps. A proposal aimed at curbing illicit trade in excisable goods and encourage compliance that may support revenue collection by the government, and,
- The bill proposed to decrease excise duty on telephone, internet, and fees charged on money transfer services agencies and other financial services to 15.0% from the current 20.0%. This proposal is aimed at increasing the affordability of mobile devices and promote accessibility to these services.
Under the Value Added Tax Act;
- The Finance Bill 2023 proposed to subject petroleum products excluding liquid petroleum gas (LPG) to a VAT at a standard rate of 16.0%, up from the 8.0% introduced in 2018, this was after a transition clause that provided for an exemption of VAT for such products for a period of 2 years expired. The proposed move is expected to increase the cost of production, given that fuel is a major input in most businesses. As such the cost of living is expected to rise given that producers will pass the cost to consumers through hike in consumer prices. On the other hand, the bill proposed the zero rate on LPG products to lower their cost, and,
- The bill also proposed the removal of VAT for Aircraft, parts and engines as part of the government's bid to support the aviation sector and improve the profitability of the airlines
Given the tight fiscal space, the Finance Bill 2023 aims to shore tax revenue which is expected to support the 3.7 tn budget for FY’2023/2024. The government intends to mobilize ordinary revenue of Kshs 2.6 tn, 17.3% increase from the 2.2 tn in FY’2022/23. As such, the government will have a fiscal deficit inclusive of grants of Kshs 718.0 bn. However, we expect the increase and introduction of additional taxes in addition to the changes in National Health Insurance Fund (NHIF) contributions and the new contribution requirement in the National Social Security Fund (NSSF) to severely impact households’ disposable income.
- Fuel Prices
During the week, the Energy and Petroleum Regulatory Authority (EPRA) released their addendum to monthly statement on the maximum retail fuel prices in Kenya that was released on 14 June 2023. The move was in line with the expected implementation of the Finance Act 2023 which has revised the VAT on Petroleum products to 16.0% from 8.0% effective 1 July 2023. Notably, fuel prices for Super petrol, Diesel, and Kerosene increased to Kshs 195.5, Kshs 179.7 and Kshs 173.4, from Kshs 182.0, Kshs 167.3, and Kshs 161.5 respectively.
Fuel prices in the country remain elevated, despite global fuel prices dropping by 11.6% to USD 74.3 per barrel as of 29 June 2023, from a high of USD 84.1 per barrel recorded on 1 April 2023 and the average landed costs declining during the month of May except for Diesel. Notably, the elevated fuel prices are mainly on the back of the government’s decision to completely remove the fuel subsidy program which cushioned consumers against the high fuel prices, coupled with the continued currency depreciation being experienced in the economy, hence elevating the cost of fuel importation.
Going forward, we maintain the view that the government needs to implement long term strategies to resuscitate the currently weakening Kenyan shilling given that the global fuel prices and the average landing cost of fuel are dropping yet the effect is not reflecting the fuel prices in the country as the fuel prices continue to rise. Additionally, the rise in fuel prices in the country is expected to underpin inflationary pressures in the country, as fuel is a major input in most businesses
Money Markets, T-Bills Primary Auction:
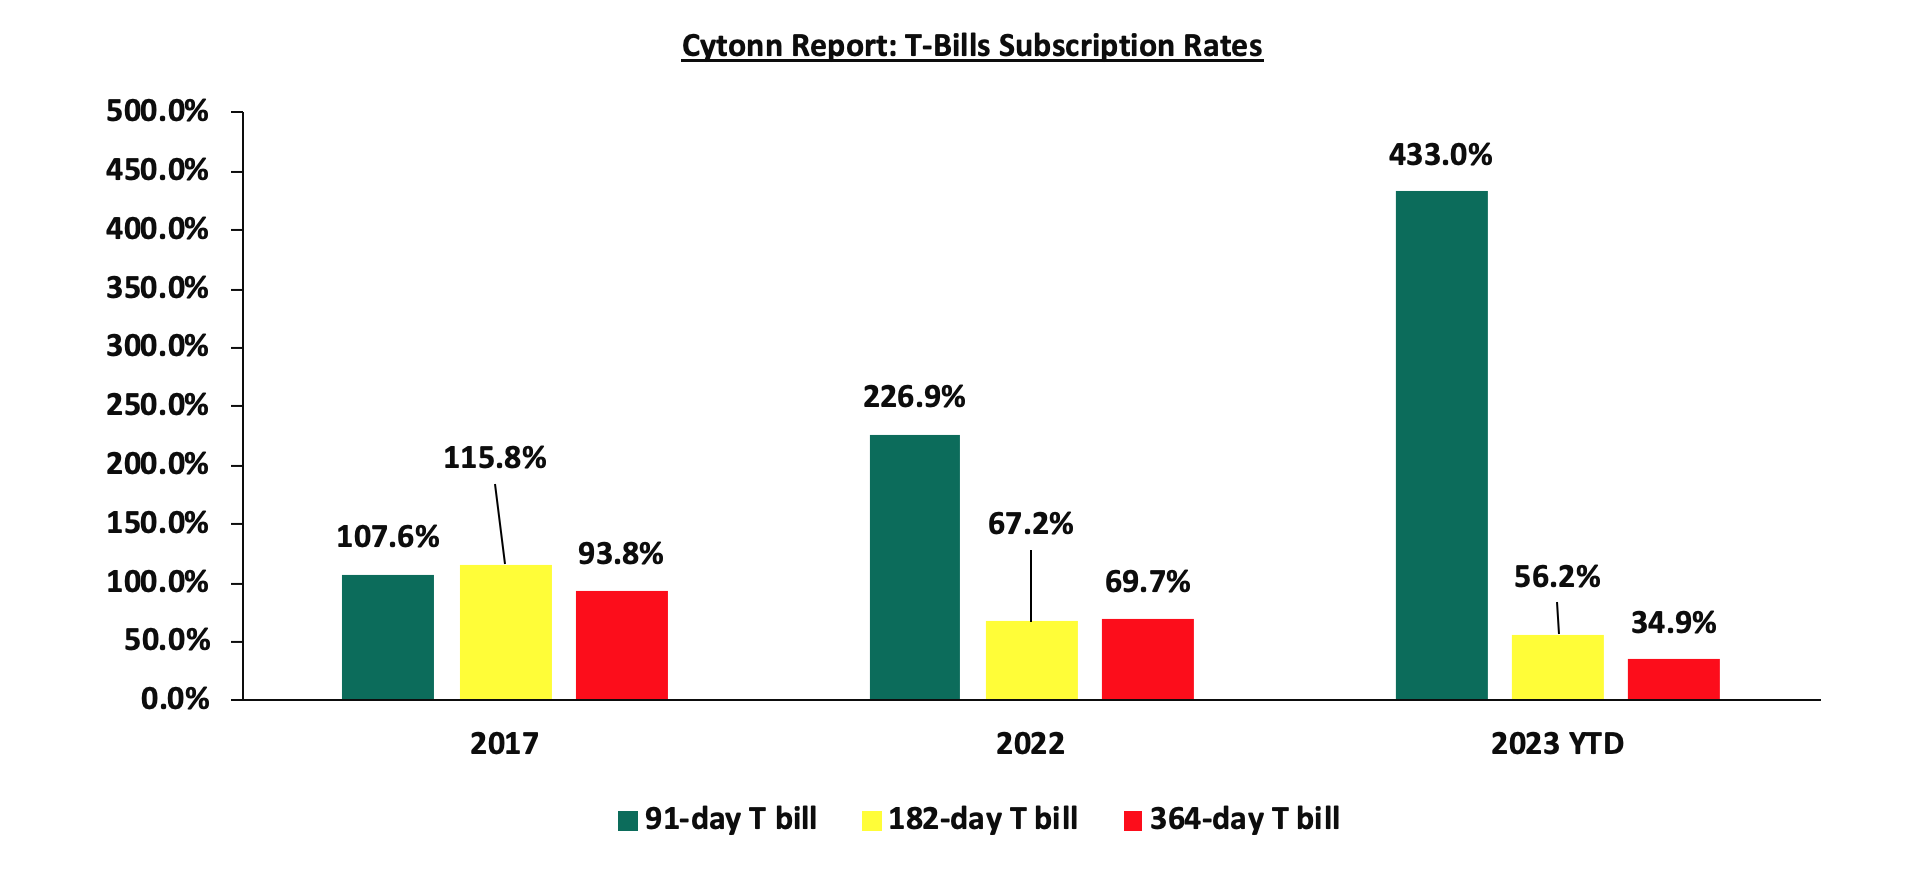
During H1’2023, T-bills were oversubscribed, with the overall subscription rate coming in at 121.7%, up from 89.3% in H1’2022. Investors’ preference for the 91-day paper persisted as they sought to avoid duration risk, with the paper receiving bids worth Kshs 481.8 bn against the offered Kshs 100.0 bn, translating to an oversubscription rate of 481.8%, higher than the oversubscription rate of 109.0% recorded in H1’2022. Overall subscription rates for the 364-day and 182-day papers came in at 37.9% and 61.3%, lower than the 101.7% and 69.0%, respectively, recorded in H1’2022. The average yields on the 364-day, 182-day, and 91-day papers increased by 1.2% points, 2.1% points and 2.7% points to 11.0%, 10.5%, and 10.2% in H1’2023, respectively, from 9.7%, 8.4%, and 7.5%, respectively, in H1’2022. The upward trajectory in yields is mainly on the back of investors attaching higher risks amid high inflation, currency depreciation, and tight liquidity positions, hence the need to demand higher returns to cushion against the possible loss. The acceptance rate during the period came in at 91.6%, albeit lower than the 92.7% recorded in H1’2022, with the government accepting a total of Kshs 668.3 bn out of the Kshs 730.0 bn worth of bids received;
During the week, T-bills remained undersubscribed for the third consecutive week, with the overall subscription rate coming in at 39.5 %, a decrease from the under-subscription rate of 63.9% recorded the previous week. Investors’ preference for the shorter 91-day paper persisted as they sought to avoid duration risk, with the paper receiving bids worth Kshs 5.8 bn against the offered Kshs 4.0 bn, translating to an oversubscription rate of 144.5%, albeit lower than the 275.3% recorded the previous week. The subscription rate for the 364-day paper declined to 15.1%, from 23.4% recorded the previous week, while the subscription rate for the 182-day paper increased to 22.0%, from 19.9% recorded the previous week. The government rejected expensive bids, accepting a total of Kshs 5.5 bn worth of bids out of Kshs 9.5 bn bids received, translating to an acceptance rate of 58.2%. The yields on the government papers continued to rise, with the yields on the 364-day, 182-day and 91-day papers increasing by 22.3 bps, 8.4 bps, and 11.9 bps to 12.2%, 11.9%, and 11.9%, respectively. The chart below compares the overall average T- bills subscription rates obtained in 2017, 2022 and 2023 Year to Date (YTD):
Primary T-Bond Auctions in H1’2023
During H1’2023, the Government issued four new bonds, reopened five, and issued nine bonds on tap-sale, seeking to raise Kshs 375.0 bn. The bonds were generally oversubscribed, receiving total bids worth Kshs 477.7 bn translating to an overall subscription rate of 127.4%. The government rejected expensive bids and only accepted bids worth Kshs 442.0, translating to an acceptance rate of 92.5%. The table below provides more details on the bonds issued during the period:
|
Cytonn Report: Bonds Issued in H1’2023 |
|||||||||
|
Issue Date |
Bond Auctioned |
Tenor to Maturity (Years) |
Coupon |
Amount offered (Kshs bn) |
Actual Amount Raised/Accepted (Kshs bn) |
Total bids received (Subscription) |
Average Accepted Yield |
Subscription Rate |
Acceptance Rate |
|
16/01/2023 |
FXD1/2020/005 (re-opened) |
2.4 |
11.7% |
50.0 |
31.5 |
41.6 |
12.9% |
83.3% |
75.7% |
|
FXD1/2022/015 (re-opened) |
14.3 |
13.9% |
14.3% |
||||||
|
20/01/2023 |
FXD1/2020/005 - Tapsale |
2.4 |
11.7% |
10.0 |
17.6 |
18.0 |
12.9% |
180.2% |
97.8% |
|
FXD1/2022/015 - Tapsale |
14.3 |
13.9% |
14.2% |
||||||
|
13/02/2023 |
FXD1/2017/10 (re-opened) |
4.4 |
13.0% |
50 |
16.7 |
19.5 |
13.9% |
38.9% |
86.1% |
|
FXD1/2023/10 |
10.0 |
14.2% |
14.2% |
||||||
|
20/02/2023 |
FXD1/2017/10 - Tapsale |
4.4 |
13.0% |
10 |
12.2 |
12.5 |
13.9% |
124.6% |
97.9% |
|
FXD1/2023/10 - Tapsale |
10.0 |
14.2% |
14.2% |
||||||
|
03/08/2023 |
IFB1/2023/017 |
17.0 |
14.4% |
50.0 |
50.9 |
59.8 |
14.4% |
119.5% |
85.1% |
|
|
IFB1/2023/017-Tapsale |
17.0 |
14.4% |
20.0 |
12.7 |
12.7 |
14.4% |
63.6% |
100.0% |
|
05/04/2023 |
FXD2/2018/10 (Re-opened) |
5.7 |
12.5% |
20.0 |
3.4 |
3.6 |
14.4% |
17.9% |
94.1% |
|
17/04/2023 |
IFB1/2023/017-Tapsale |
17.0 |
14.4% |
10.0 |
5.1 |
5.1 |
14.4% |
51.2% |
100.0% |
|
24/04/2023 |
FXD1/2022/03-Re-opened |
2.1 |
11.8% |
30.0 |
1.8 |
7.3 |
14.4% |
24.4% |
24.0% |
|
15/05/2023 |
FXD1/2023/003 |
3.0 |
14.2% |
20.0 |
20.3 |
20.7 |
14.2% |
103.7% |
97.8% |
|
22/05/2023 |
FXD1/2023/003-Tapsale |
3.0 |
14.2% |
10.0 |
10.6 |
10.6 |
14.2% |
106.0% |
100.0% |
|
29/05/2023 |
FXD1/2023/03 - Tapsale |
3.0 |
14.2% |
20.0 |
27.2 |
27.2 |
14.2% |
136.0% |
100.0% |
|
19/06/2023 |
IFB1/2023/07 |
7.0 |
15.8% |
60.0 |
213.4 |
220.5 |
15.8% |
367.5% |
96.8% |
|
26/06/2023 |
FXD1/2023/03 - Tapsale |
2.9 |
14.2% |
15.0 |
18.6 |
18.6 |
14.2% |
123.7% |
100.0% |
|
H1’2023 Total |
|
|
375.0 |
442.0 |
477.7 |
|
|
|
|
|
H1'2022 Total |
|
|
456.5 |
406.2 |
487.6 |
|
|
|
|
|
H1'2023 Average |
8.1 |
13.8% |
|
|
|
14.2% |
127.4% |
92.5% |
|
|
H1'2022 Average |
12.1 |
12.9% |
|
|
|
13.3% |
106.8% |
86.9% |
|
Secondary Bond Market Activity:
- Bond Turnover:
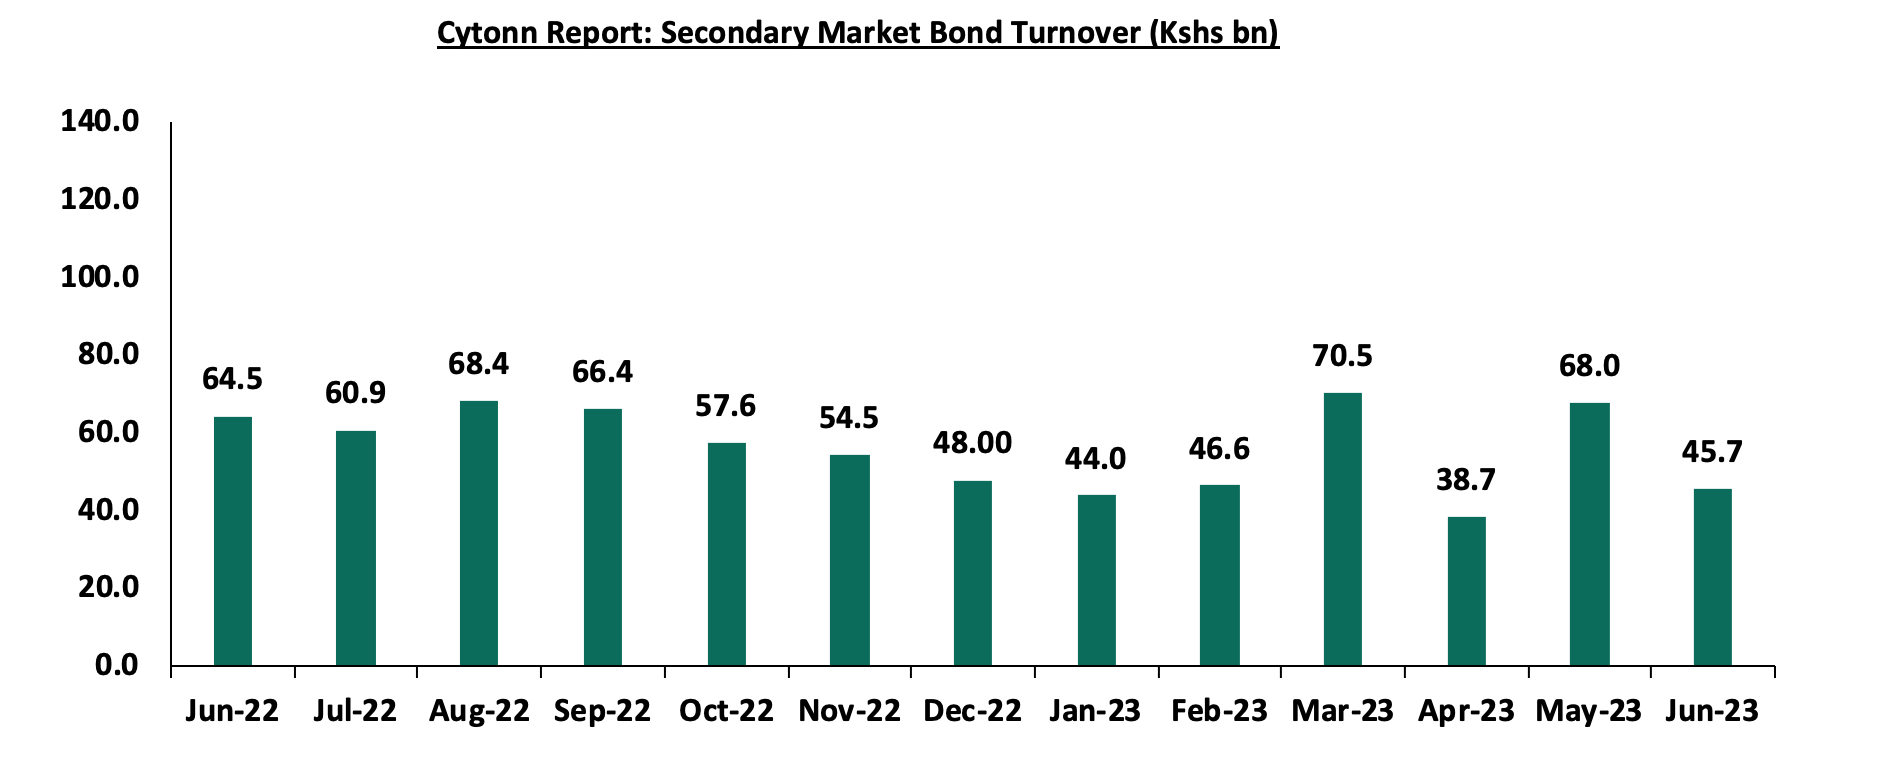
The secondary bond market recorded decreased activity, with the turnover decreasing by 17.7% to Kshs 313.6 bn from Kshs 381.1 bn in H1’2022, pointing towards decreased activities by commercial banks in the secondary bond market. The chart below shows the bond turnover over the past 12 months;
- Yield Curve:
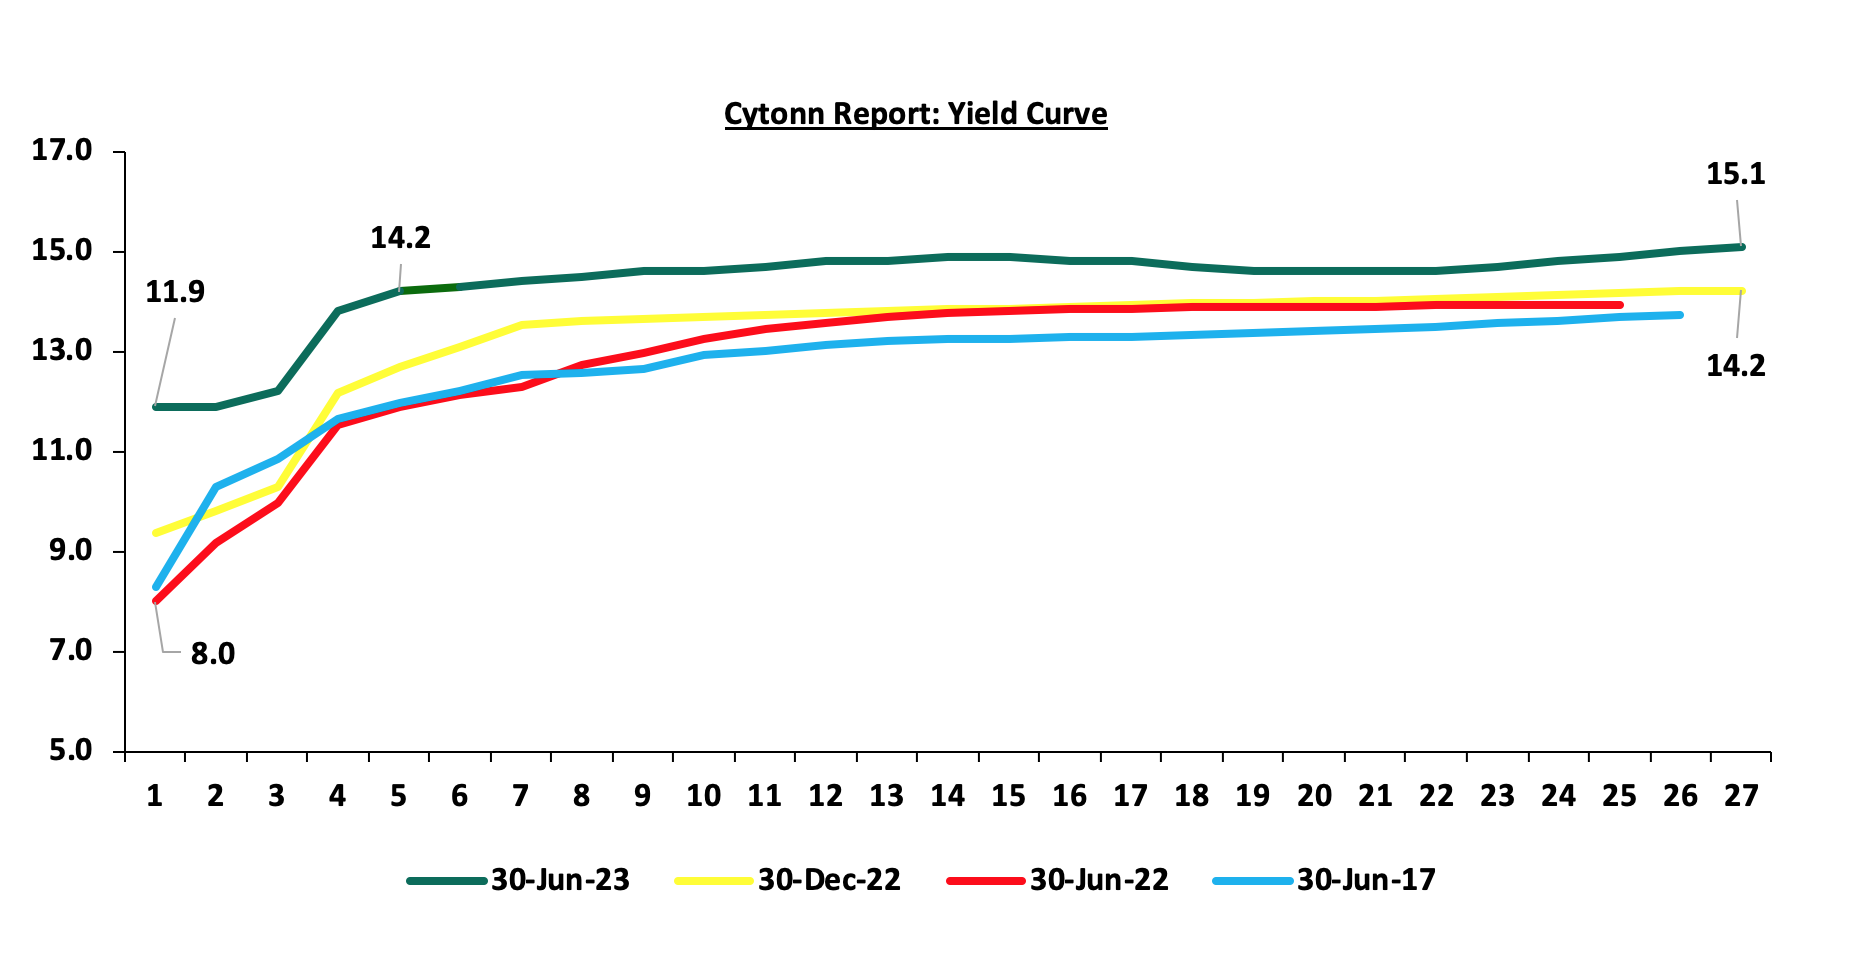
During H1’2023, the yields on government securities were on an upward trajectory as a result of the elevated inflationary pressures, leading to investors attaching higher risk premiums. Additionally, Short-term rates have climbed mainly on the back of rising interest rates. The chart below shows the yield curve movement during the period:
Money Market Performance
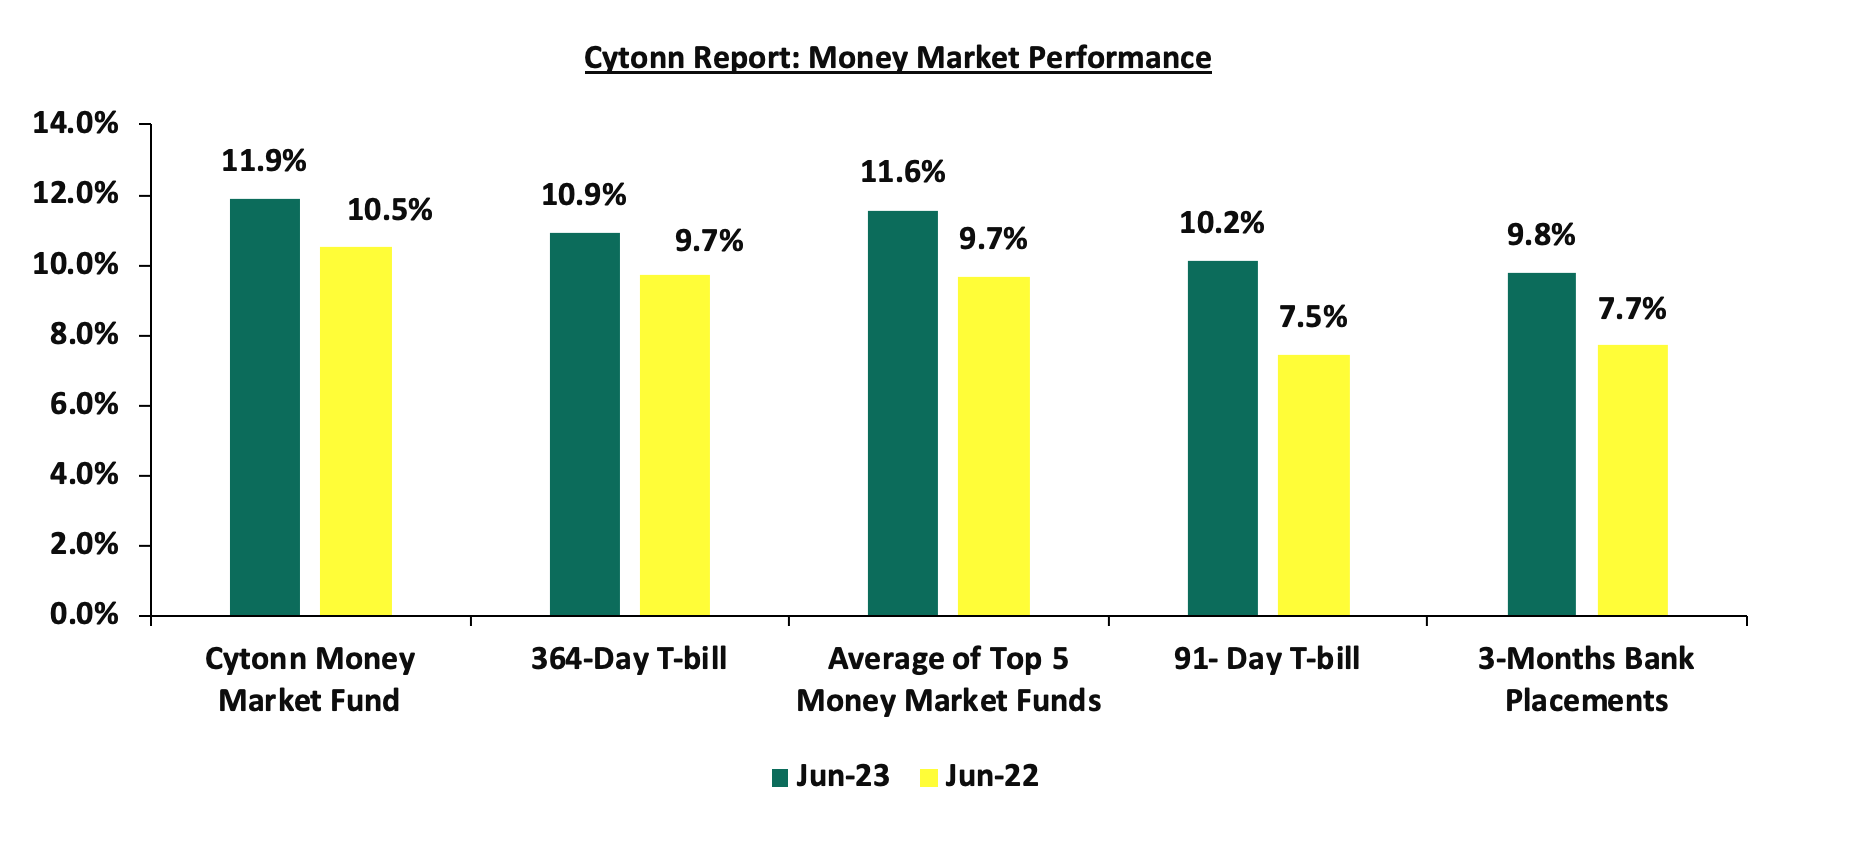
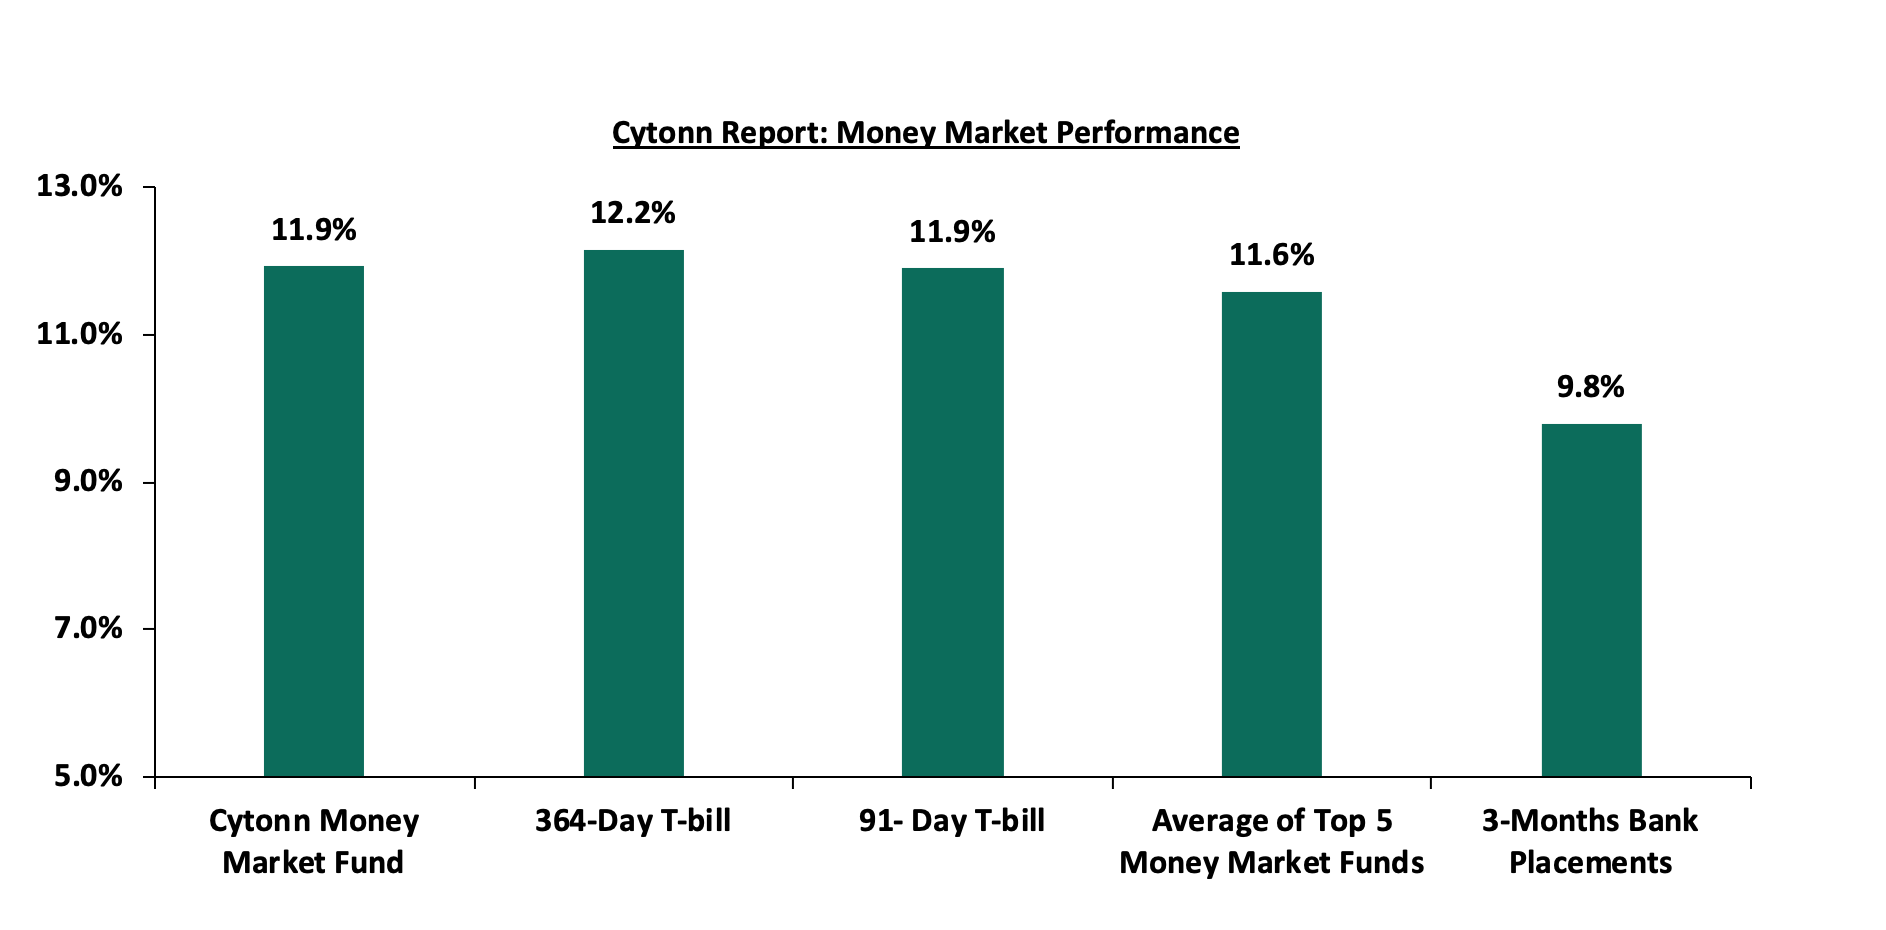
The 3-month bank placements recorded 9.8% at the end of H1’2023, 2.1% points higher than the 7.7% recorded at the end of H1’2022 (based on what we have been offered by various banks). The average 91-day T-bill rate increased by 2.7% points to 10.2% in H1’2023 from 7.5% in H1’2022, and the average Top 5 Money Market Funds increased by 1.9% points to 11.6%, from 9.7% in H1’2022. The yield on the Cytonn Money Market (CMMF) increased by 1.4% points to 11.9% in H1’2023, from 10.5% recorded at the end of H1’2022.
During the week, 3-month bank placements ended the week at 9.8% (based on what we have been offered by various banks), and the yields on the 364-day and 91-day T-bill increased by 22.3 bps and 11.9 bps to 12.2% and 11.9%, respectively. The yields of the Cytonn Money Market Fund increased by 14.0 bps to 11.9% from 11.8% recorded the previous week, and the average yields on the Top 5 Money Market Funds increased by 3.8 bps to remain relatively unchanged at 11.6% from what was recorded the previous week.
The table below shows the Money Market Fund Yields for Kenyan Fund Managers as published on 30th June 2023:
|
Cytonn Report: Money Market Fund Yield for Fund Managers as published on 30th June 2023 |
||
|
Rank |
Fund Manager |
Effective Annual Rate |
|
1 |
Etica Money Market Fund |
12.0% |
|
2 |
Enwealth Money Market Fund |
11.9% |
|
3 |
Cytonn Money Market Fund (dial *809# or download the Cytonn app) |
11.9% |
|
4 |
Jubilee Money Market Fund |
11.1% |
|
5 |
GenAfrica Money Market Fund |
11.0% |
|
6 |
Dry Associates Money Market Fund |
10.9% |
|
7 |
Kuza Money Market fund |
10.8% |
|
8 |
Apollo Money Market Fund |
10.7% |
|
9 |
GenCap Hela Imara Money Market Fund |
10.7% |
|
10 |
AA Kenya Shillings Fund |
10.6% |
|
11 |
Co-op Money Market Fund |
10.5% |
|
12 |
KCB Money Market Fund |
10.5% |
|
13 |
Old Mutual Money Market Fund |
10.3% |
|
14 |
Sanlam Money Market Fund |
10.3% |
|
15 |
NCBA Money Market Fund |
10.2% |
|
16 |
Nabo Africa Money Market Fund |
10.1% |
|
17 |
ICEA Lion Money Market Fund |
10.1% |
|
18 |
Zimele Money Market Fund |
9.9% |
|
19 |
Madison Money Market Fund |
9.9% |
|
20 |
CIC Money Market Fund |
9.6% |
|
21 |
British-American Money Market Fund |
9.6% |
|
22 |
Absa Shilling Money Market Fund |
9.5% |
|
23 |
Orient Kasha Money Market Fund |
9.2% |
|
24 |
Mali Money Market Fund |
8.8% |
|
25 |
Equity Money Market Fund |
8.2% |
Source: Business Daily
Liquidity:
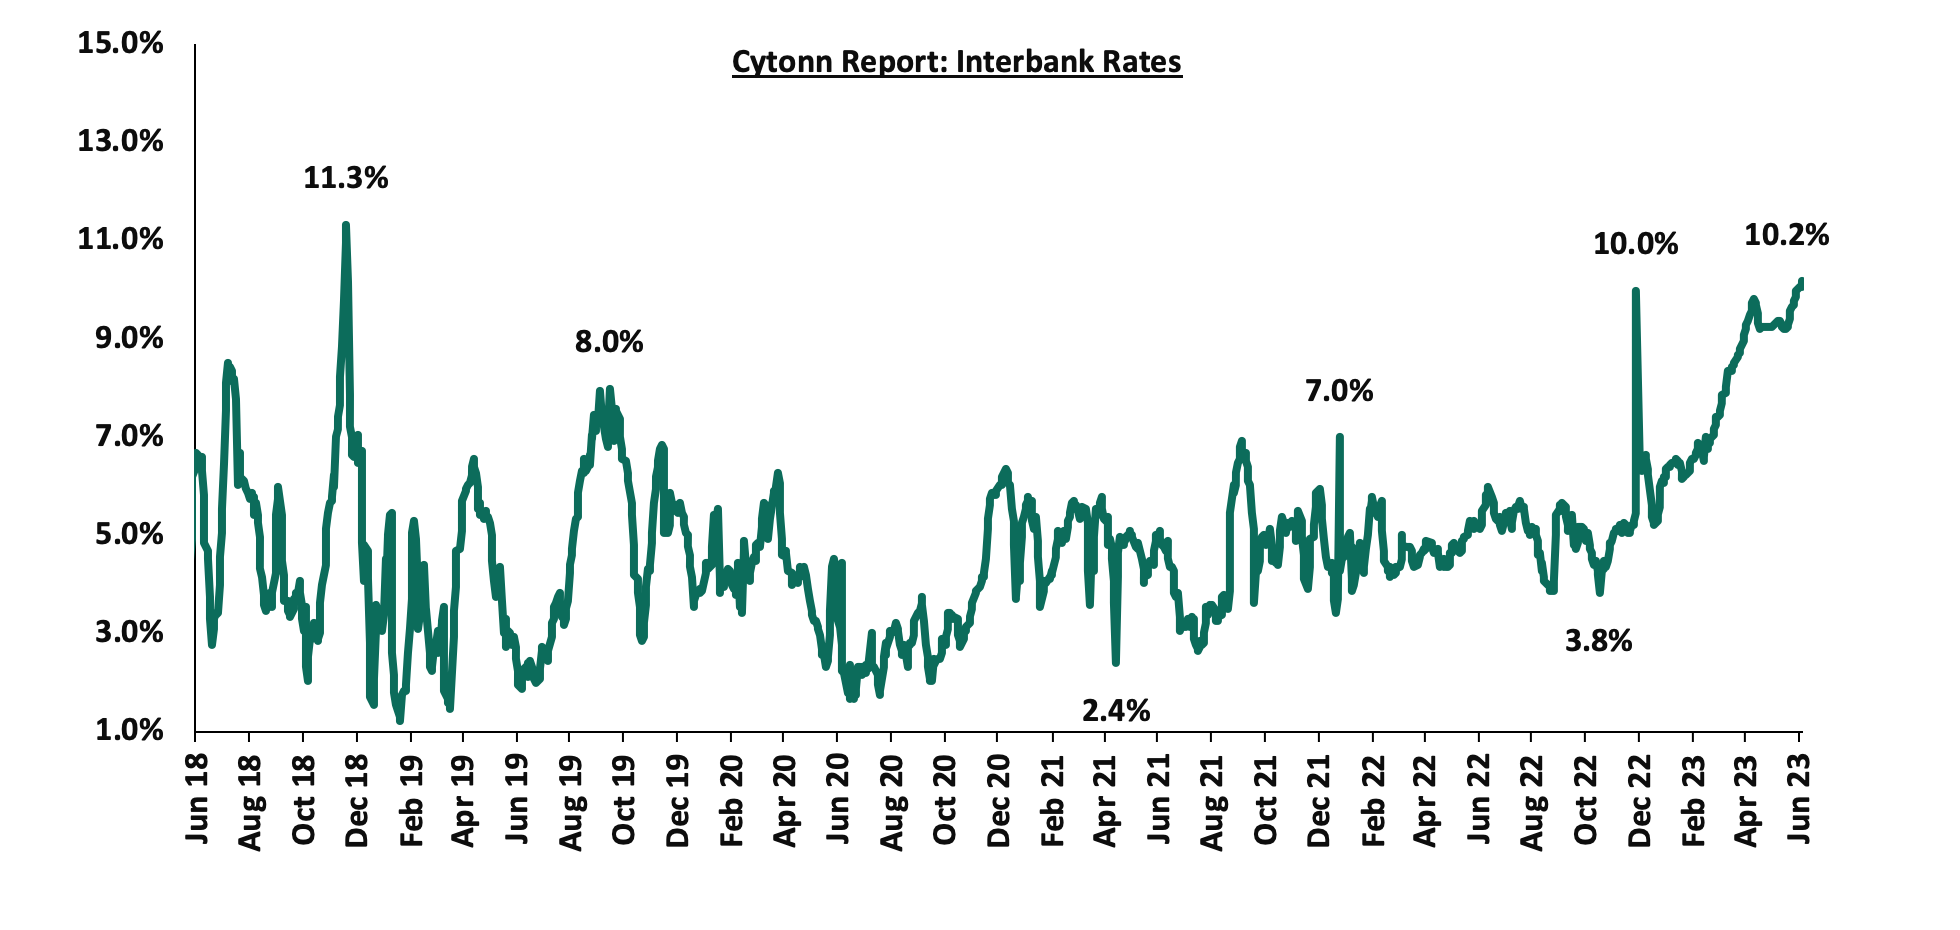
In H1’2023, liquidity in the money markets tightened, as evidenced by the increase in the interbank rate to 7.8%, from 4.7% H1’2022, partly attributable to tax remittances that offset government payments. Additionally, the average volumes traded in the interbank market increased by 34.3% to Kshs 21.1 bn, from Kshs 15.7 bn recorded in H1’2022.
Similarly, during the week, liquidity in the money markets tightened, with the average interbank rate rising to 10.1% from 9.8% recorded the previous week, partly attributable to tax remittances that offset government payments. The average interbank volumes traded increased by 34.4% to Kshs 17.1 bn from Kshs 12.7 bn recorded the previous week. The chart below shows the interbank rates in the market over the years:
Kenya Eurobonds:
During H1’2023, the yields on Eurobonds recorded mixed performance, with the yield on the 10-Year Eurobond issued in 2014 declining by 0.3% points to 12.6% from 12.9% recorded at the beginning of the year, while the yields on the 10-year Eurobond issued in 2018 gained the most by 0.6% points to 11.1% from 10.5% recorded at the beginning of the year. On a year on Year basis, the yields on all Eurobonds were on a downward trajectory, with the yield of the 7-year Eurobond issued in 2019 declining the most having declined by 4.7% points to 11.4% from 16.1% recorded at the end of H1’2022. The downward trajectory of the yields is mainly on the back of improved investors’ confidence in the international bond market, amid the government commitment to strong austerity measures and assurance to investors of its capacity to meet its obligations.
Similarly, during the week, the yields on Eurobonds recorded mixed performance, with the yield on the 10-Year Eurobond issued in 2014 declining by 0.1% points to 12.6% from 12.7% recorded the previous week. The table below shows the summary of the performance of the Kenyan Eurobonds as of 29 June 2023;
|
Cytonn Report: Kenya Eurobond Performance |
||||||
|
|
2014 |
2018 |
2019 |
2021 |
||
|
Date |
10-year issue |
10-year issue |
30-year issue |
7-year issue |
12-year issue |
12-year issue |
|
Amount Issued (USD) |
2.0 bn |
1.0 bn |
1.0 bn |
0.9 bn |
1.2 bn |
1.0 bn |
|
Years to Maturity |
1.1 |
4.8 |
24.8 |
4.0 |
9.0 |
11.1 |
|
Yields at Issue |
6.6% |
7.3% |
8.3% |
7.0% |
7.9% |
6.2% |
|
30-Jun-22 |
17.0% |
14.7% |
13.7% |
16.1% |
13.8% |
12.7% |
|
02-Jan-23 |
12.9% |
10.5% |
10.9% |
10.9% |
10.8% |
9.9% |
|
22-Jun-23 |
12.7% |
11.1% |
11.0% |
11.3% |
11.0% |
10.3% |
|
23-Jun-23 |
12.5% |
11.1% |
11.0% |
11.4% |
11.1% |
10.3% |
|
26-Jun-23 |
12.5% |
11.1% |
11.1% |
11.4% |
11.1% |
10.4% |
|
27-Jun-23 |
12.6% |
11.1% |
11.1% |
11.3% |
11.1% |
10.3% |
|
28-Jun-23 |
12.6% |
11.1% |
11.1% |
11.3% |
11.1% |
10.3% |
|
29-Jun-23 |
12.6% |
11.1% |
11.1% |
11.4% |
11.1% |
10.3% |
|
Weekly Change |
(0.1%) |
0.0% |
0.1% |
0.1% |
0.1% |
0.0% |
|
Y/Y change |
(4.4%) |
(3.6%) |
(2.6%) |
(4.7%) |
(2.7%) |
(2.4%) |
|
YTD change |
(0.3%) |
(0.6%) |
(0.2%) |
(0.5%) |
(0.3%) |
(0.4%) |
Source: Central Bank of Kenya (CBK)
Rates in the Fixed Income market have been on an upward trend given the continued government demand for cash and the highly tightened liquidity in the money market. The government closed FY’2022/2023 34.3% above of its domestic net borrowing target of Kshs 428.3 bn, having a net borrowing position of Kshs 568.7 bn. Revenue collections are lagging behind, with total revenue as of May 2023 coming in at Kshs 1.8 tn in FY’2022/2023, equivalent to 82.7% of its revised target of Kshs 2.2 tn and 90.2% of the prorated target of Kshs 2.0 tn. Therefore, we expect a continued upward readjustment of the yield curve in the short and medium term, with the government looking to bridge the fiscal deficit through the domestic market. Due to this, our view is that investors should be biased towards short-term fixed-income securities to reduce duration risk.
Market Performance:
During Q2’2023, the equities market was on a downward trajectory, with NASI, NSE 20 and NSE 25 declining by 5.1%, 2.9% and 8.0%, respectively, taking their H1’2023 to losses of 16.0%, 6.0% and 13.0% for NASI, NSE 20 and NSE 25 respectively. The equities market performance during the quarter was driven by losses recorded by large caps such as KCB Group, Equity Group and Bamburi of 17.5%, 15.9% and 10.3%, respectively.
Equities turnover declined by 2.7% in H1’2023 to USD 453.4 mn, from USD 466.0 mn in H1’2022. Foreign investors remained net sellers in H1’2023 with a net selling position of USD 52.0 mn, from a net selling position of USD 105.9 mn recorded in H1’2022.
During the week, the equities market recorded mixed performance with NASI and NSE 20 declining by 0.2% and 0.5%, while NSE 25 gained by 0.4%, taking their YTD performance to losses of 16.0%, 6.0% and 13.0% for NASI, NSE 20 and NSE 25 respectively. The equities market performance was mainly driven by losses recorded by large-cap stocks such as Co-operative Bank and Standard Chartered bank of 0.8% each, while KCB Group and NCBA Bank declined by 0.7% and 0.3% respectively. The losses were however mitigated by gains recorded by East African Breweries Limited (EABL) and Equity Group of 2.0% each, while British American Tobacco gained by 1.8%.
During the week, equities turnover declined by 41.1% to USD 4.2 mn from USD 7.1 mn recorded the previous week, taking the YTD turnover to USD 453.4 mn. Foreign investors remained net buyers, with a net buying position of USD 1.1 mn, from a net buying position of USD 0.5 mn recorded the previous week, taking the YTD net selling position to USD 52.0 mn.
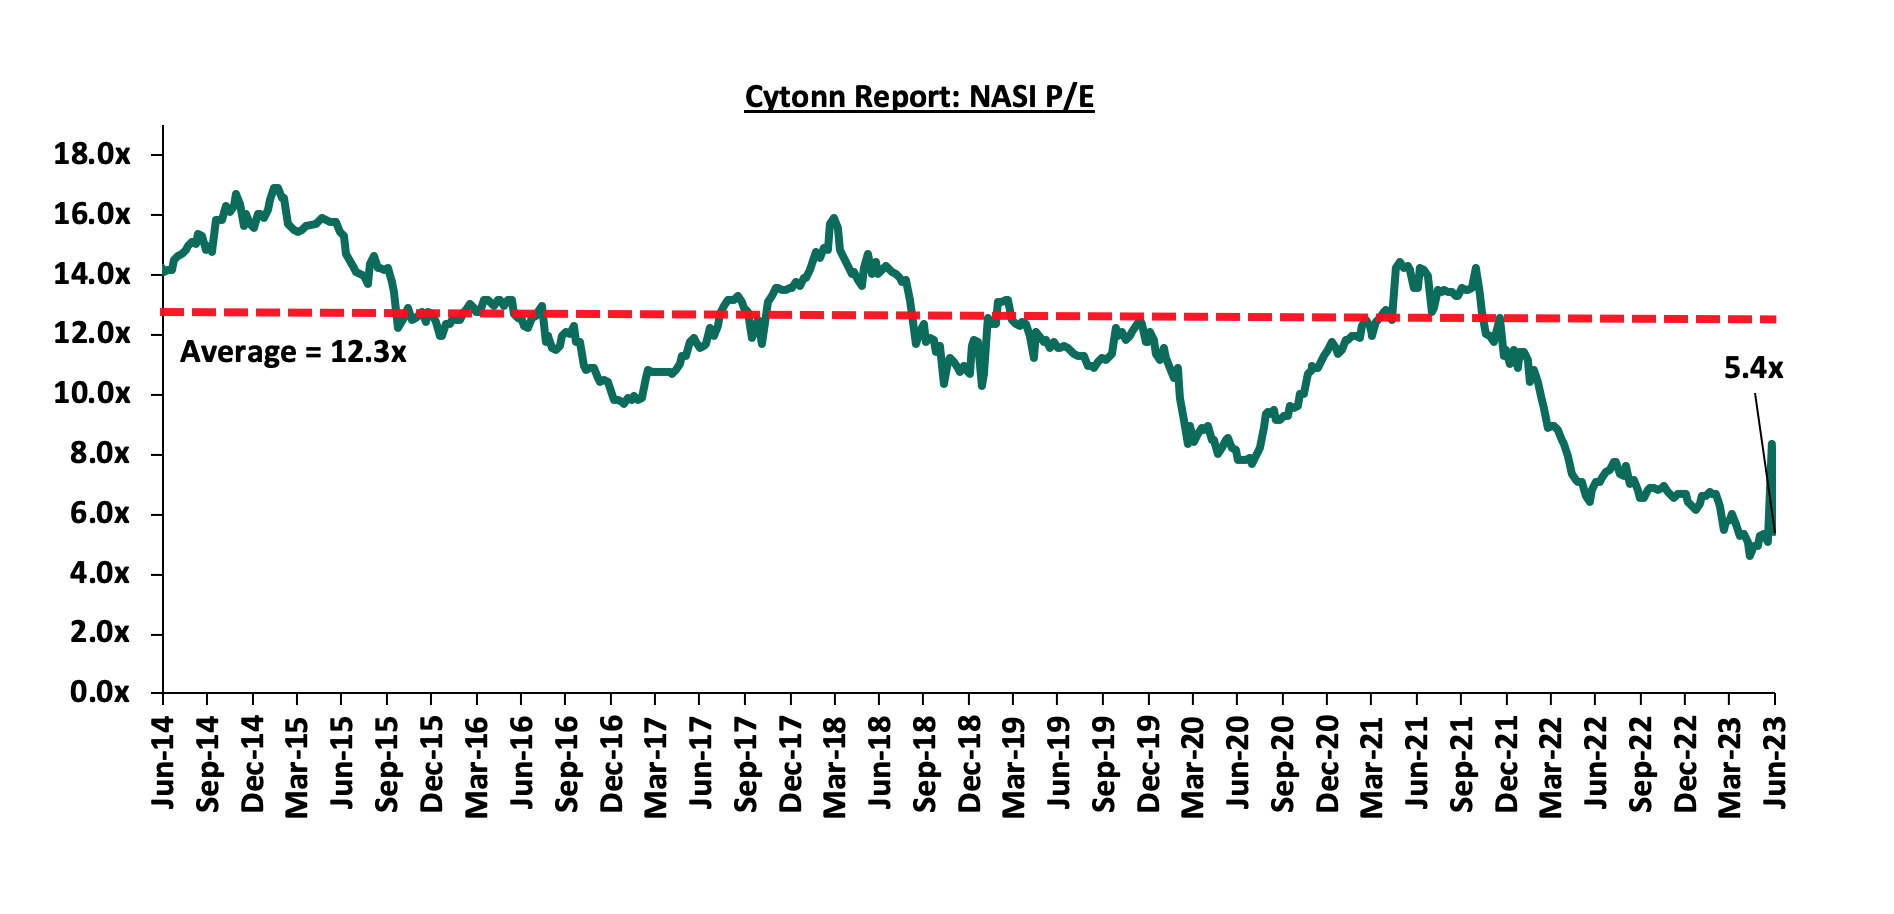
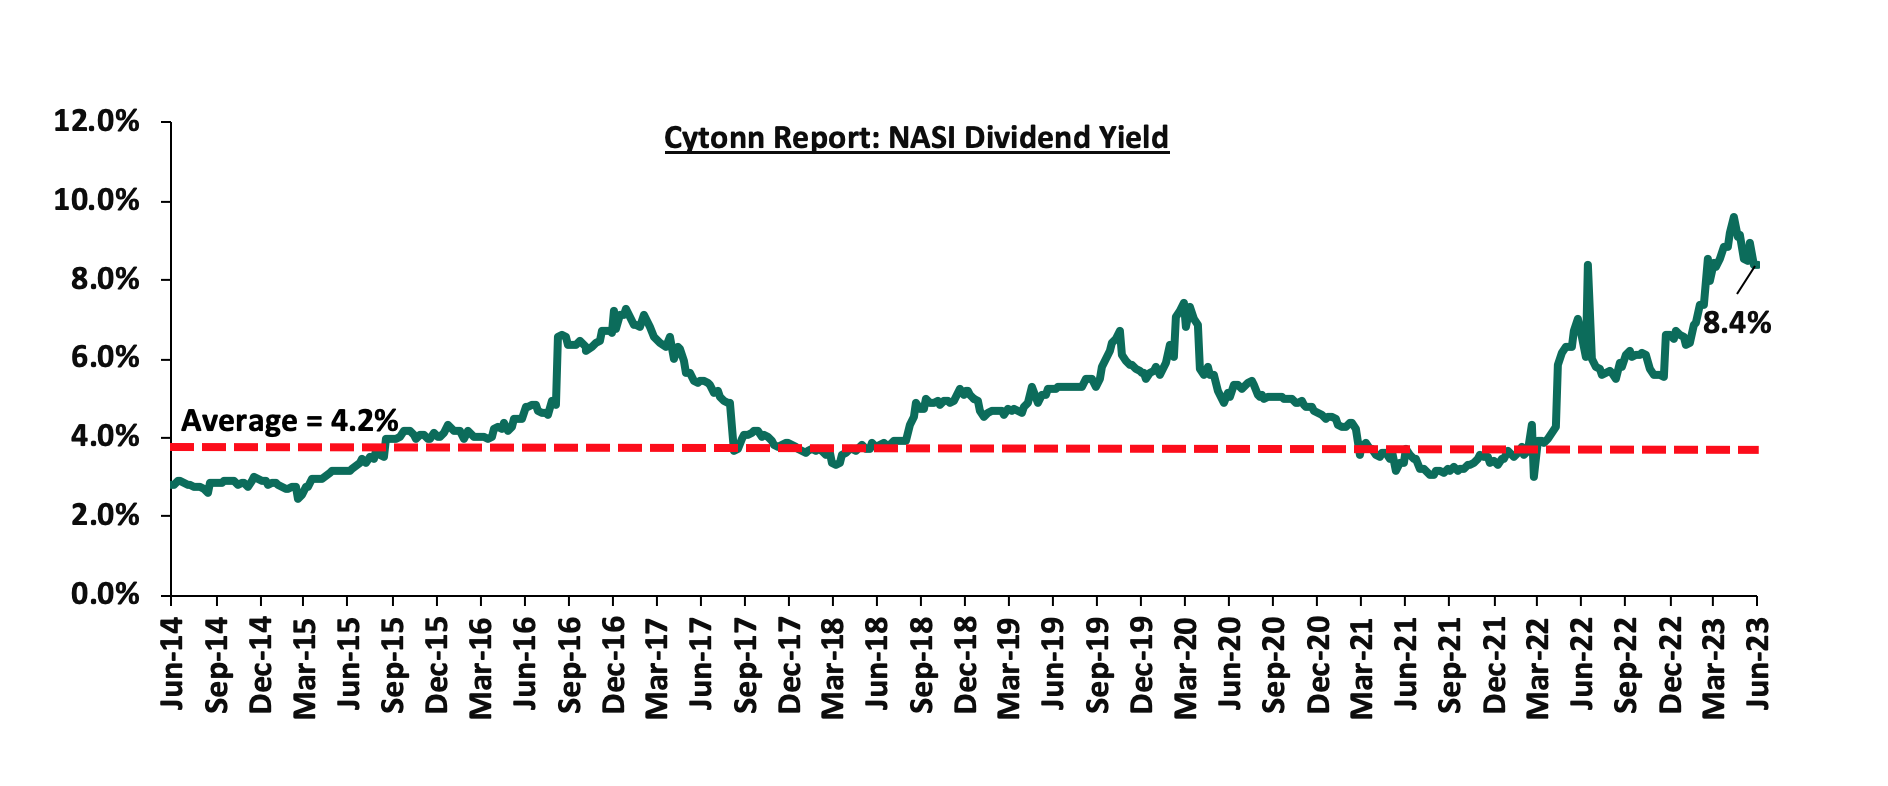
The market is currently trading at a price to earnings ratio (P/E) of 5.4x, 56.3% below the historical average of 12.3x, and a dividend yield of 8.4%, 4.2% points above the historical average of 4.2%. Key to note, NASI’s PEG ratio currently stands at 0.7x, an indication that the market is undervalued relative to its future growth. A PEG ratio greater than 1.0x indicates the market may be overvalued while a PEG ratio less than 1.0x indicates that the market is undervalued.
The charts below indicate the historical P/E and dividend yields of the market;
Listed Banks’ FY’2022 and Q1’2023 Performance
During the first half of 2023, the listed banking sector released their FY’2022 and Q1’2023 results, recording y/y earnings growth of 26.6% and 25.0% in their core EPS in FY’2022 and Q1’2023, respectively. For more information, please see our FY’2022 and Q1’2023 Banking Sector Reports.
Kenya Listed Insurance FY’2022 Performance
During the first half of 2023, the listed insurance sector released their FY’2022 results, recording weighted Core EPS growth of 377.4%, compared to a weighted growth of 89.2%, in FY’2021. The sustained growth in earnings was attributable to increased premiums during the period following continued recovery by the sector from the impacts of the COVID-19 pandemic, coupled with higher yields from government papers. For more information, please see our Kenya Listed Insurance FY’2022 Report.
Key Half-Year Highlights:
During the first half of 2023;
- Centum Investment Plc announced that it had terminated the Share Purchase Agreement (SPA) to sell its 83.4% stake in Sidian Bank Limited to Access Bank Plc. The termination was due to the lapse of time arising from expiry of the Long Stop Date and the two parties could not agree to extend the duration, as well as the set conditions between the two parties having not been met. For more information, please see our Cytonn Weekly #02/2023,
- The Insurance Regulatory Authority of Kenya (IRA) released the Quarterly Insurance Industry Report for the period ending 30 September 2022 highlighting that the industry’s profits after tax declined by 3.3% to Kshs 6.2 bn in Q3’2022, from Kshs 6.4 bn recorded in Q3’2021. For more information, please see our Cytonn Weekly #03/2023,
- East African Breweries Plc (EABL) released their H1’2023 financial results for the period ending 31st December 2022, recording a stagnation in the Profits After Tax (PAT) at Kshs 8.7 bn as was recorded in a similar period last year. For more information, please see our Cytonn 2023 Markets Outlook,
- Equity Group Holdings Plc, through Equity Bank Kenya Limited (EBKL) announced that it had completed the acquisition of certain assets and liabilities of Spire Bank Limited after obtaining all the required regulatory approvals. For more information, please see our Cytonn Monthly January 2023,
- The Nairobi Stock Exchange (NSE) amended the trading rules for equity securities to allow for block trades, aimed at boosting liquidity in the bourse, after receiving approval from the Capital Markets Authority (CMA). For more information, please see our Cytonn Monthly January 2023,
- The Central Bank of Kenya (CBK) released the Commercial Banks’ Credit Survey Report for the quarter ended December 2022, highlighting that the banking sector’s loan book recorded a 15.6% y/y growth, with gross loans increasing to Kshs 3.7 tn in Q4’2022, from Kshs 3.2 tn in Q4’2021. For more information, please see our Cytonn Weekly #06/2023,
- British American Tobacco Kenya Plc released their FY’2022 financial results, recording a 6.3% growth in Profits after Tax (PAT) to Kshs 6.9 bn, from Kshs 6.5 bn recorded in FY’2021, majorly attributed to the 5.5% increase in Gross Sales to Kshs 42.2 bn in FY’2022 from Kshs 40.0 bn recorded in FY’2021. For more information, please see our Cytonn Weekly #07/2023,
- The Central Bank of Kenya (CBK) announced that Premier Bank Limited Somalia (PBLS) had completed acquisition of 62.5% shareholding of First Community Bank Limited (FCB) effective 27 March 2023 For more information, please see our Cytonn Weekly #11/2023,
- Diageo UK, through its wholly-owned indirect subsidiary Diageo Kenya, announced that it had successfully completed the partial tender offer to acquire an additional 15.0% stake in East African Breweries Plc (EABL). For more information, please see our Cytonn Weekly #12/2023,
- Safaricom Plc released its FY’2023 financial performance for the year ended 31 March 2023, recording a 22.2% decline in Profit After Tax (PAT) to Kshs 52.5 bn from Kshs 67.5 bn in FY’2022, majorly attributed to a 34.2% increase in operating expenses to Kshs 74.1 bn in FY’2023, up from Kshs 55.2 bn in FY’2022. The increase in operating expenses was mainly driven by injection of Kshs 55.8 bn capital investment expenditure into Safaricom’s subsidiary in Ethiopia during the fourth quarter of FY’2023. For more information, please see our Cytonn Weekly #19/2023,
- The Central Bank of Kenya (CBK) released the Commercial Banking Sector Credit Survey report for the quarter ended March 2023, highlighting that the banking sector’s loan book recorded a 13.9% y/y growth, with gross loans increasing to Kshs 3.9 tn in Q1’2023, from Kshs 3.1 tn in Q1’2022. For more information, please see our Cytonn Weekly #19/2023,
- The Central Bank of Kenya (CBK) announced the acquisition of 20.0% stake of Credit Bank Plc by Shorecap III, LP a Private Equity fund registered under the laws of Mauritius effective 15 June 2023. For more information, please see our Cytonn Weekly #21/2023,
- Equity Group Holdings Plc (EGH) announced that it had entered into a binding agreement with Government of Rwanda, Rwanda Social Security Board and other investors of Compagnie Generale De Banque (Cogebanque) Plc Limited to acquire a 91.9% stake in the Rwanda based lender. For more information, please see our Cytonn Weekly #24/2023, and,
- The Central Bank of Kenya (CBK) released the Quarterly Economic Review for the period ending 31 March 2023, highlighting that the banking sector remained stable and resilient during the period on the back of strong liquidity and capital adequacy, with the total assets increased by 2.7% to Kshs 6.8 tn in March 2023, from Kshs 6.6 tn in December 2022. For more information, please see our Cytonn Weekly #25/2023.
Universe of Coverage:
|
Company |
Price as at 23/06/2023 |
Price as at 30/06/2024 |
w/w change |
YTD Change |
Target Price* |
Dividend Yield |
Upside/ Downside** |
P/TBv Multiple |
Recommendation |
|
Jubilee Holdings |
180.0 |
180.0 |
0.0% |
(9.4%) |
260.7 |
6.7% |
51.5% |
0.3x |
Buy |
|
Kenya Reinsurance |
1.8 |
1.8 |
(0.6%) |
(3.7%) |
2.5 |
11.1% |
50.6% |
0.1x |
Buy |
|
KCB Group*** |
29.5 |
29.3 |
(0.7%) |
(23.6%) |
41.3 |
6.8% |
47.6% |
0.5x |
Buy |
|
Liberty Holdings |
3.6 |
4.1 |
12.5% |
(19.6%) |
5.9 |
0.0% |
46.2% |
0.3x |
Buy |
|
Equity Group*** |
37.5 |
38.3 |
2.0% |
(15.1%) |
51.2 |
10.5% |
44.2% |
0.8x |
Buy |
|
Sanlam |
8.0 |
7.3 |
(8.5%) |
(23.8%) |
10.3 |
0.0% |
41.0% |
2.1x |
Buy |
|
CIC Group |
1.9 |
1.9 |
0.0% |
(0.5%) |
2.5 |
6.8% |
38.4% |
0.6x |
Buy |
|
NCBA*** |
39.0 |
38.9 |
(0.3%) |
(0.3%) |
48.9 |
10.9% |
36.7% |
0.8x |
Buy |
|
ABSA Bank*** |
11.8 |
11.8 |
0.4% |
(3.3%) |
14.7 |
11.4% |
35.8% |
1.0x |
Buy |
|
Co-op Bank*** |
12.3 |
12.2 |
(0.8%) |
0.8% |
15.0 |
12.3% |
34.8% |
0.6x |
Buy |
|
Standard Chartered*** |
161.8 |
160.5 |
(0.8%) |
10.7% |
183.9 |
13.7% |
28.3% |
1.1x |
Buy |
|
I&M Group*** |
17.0 |
17.1 |
0.9% |
0.3% |
19.5 |
13.2% |
27.0% |
0.4x |
Buy |
|
Stanbic Holdings |
112.0 |
111.3 |
(0.7%) |
9.1% |
127.9 |
11.3% |
26.3% |
0.8x |
Buy |
|
Diamond Trust Bank*** |
49.6 |
49.9 |
0.6% |
0.0% |
54.6 |
10.0% |
19.5% |
0.2x |
Accumulate |
|
Britam |
5.2 |
5.0 |
(3.5%) |
(3.5%) |
6.0 |
0.0% |
18.9% |
0.7x |
Accumulate |
|
HF Group |
5.0 |
5.0 |
0.4% |
59.4% |
5.8 |
0.0% |
15.7% |
0.2x |
Accumulate |
|
*Target Price as per Cytonn Analyst estimates **Upside/ (Downside) is adjusted for Dividend Yield ***For Disclosure, these are stocks in which Cytonn and/or its affiliates are invested in |
|||||||||
We are “Neutral” on the Equities markets in the short term due to the current adverse operating environment and huge foreign investor outflows, and, “Bullish” in the long term due to current cheap valuations and expected global and local economic recovery.
With the market currently trading at a discount to its future growth (PEG Ratio at 0.7x), we believe that investors should reposition towards value stocks with strong earnings growth and that are trading at discounts to their intrinsic value. We expect the current high foreign investors sell-offs, the upcoming Kenyan general elections and the slow vaccine rollout to continue weighing down the economic outlook in the short term.
In H1’2023, the Real Estate sector in Kenya witnessed increased activity in terms of developments and property transactions, in comparison to the similar period in 2022, attributable to continued investments flowing into the sector. In light of this, the year-on-year (y/y) gross loans advanced to the Real Estate sector increased by 4.6% to Kshs 481.0 bn in Q1’2023, from Kshs 460.0 bn in Q1’2022, attributable to increased construction activities in the sector according to the Central Bank of Kenya (CBK). This was supported by various factors such as;
- There has been continued focus by both the government and the private sector to provide decent housing to Kenyans through the Affordable Housing Program (AHP). Currently, the AHP pipeline boasts about 15 housing projects by the government and 10 projects by the private sector, with an estimated total of 98,012 affordable housing units under construction,
- Implementation of various infrastructure projects, such as the Kenol-Marua Highway, which are aimed at improving the country's economic status. These have opened up new areas for investment, thereby boosting the performance of the Real Estate sector,
- The government has continued to make efforts to provide affordable mortgages through the Kenya Mortgage Refinance Company (KMRC) aimed at making home ownership more accessible to Kenyans. This is through offering sustainable financing to primary mortgage lenders (PMLs) such as banks and SACCOS,
- The retail sector has continued to grow, with local and international retailers such as Naivas, QuickMart and Carrefour pursuing aggressive expansion strategies in a bid to increase their dominance in the market, replacing distressed retailers such as Nakumatt, Tuskys, and Uchumi,
- The hospitality sector has seen resumed investor confidence with the reopening of hotels, mergers and acquisitions, as the number of international arrivals into the country registered a 70.5% increase to 1,483,752 persons in 2022 compared to 870,465 persons in 2021, and,
- Kenya enjoys positive national demographics, with relatively high urbanization and population growth rates of 3.7% p.a and 1.9% p.a, respectively, against the global average of 1.6% p.a and 0.9% p.a, respectively, as at 2021, that continue to drive demand for Real Estate developments.
However, some of the challenges impeding the performance of the sector include;
- Lenders have tightened their lending requirements as they demand more collateral from developers due to the high credit risk in the Real Estate sector on the back of the tough economic environment. This is evidenced by 12.2% increase in Gross Non-Performing Loans (NPLs) in the Real Estate sector to Kshs 88.1 bn in Q1’2023, from Kshs 78.5 bn in Q1’2022. In addition, on a q/q basis, the increase in NPLs represented a 9.7% increase from Kshs 80.3 bn realized in Q4’2022,
- Construction costs have been increased steadily, averaging Kshs 41,600 per square metre in 2023, a 20.1% increase from Kshs 34,650 per square metre in 2022. The rise is primarily due to the hike in prices of key construction materials such as cement, steel, paint, aluminum, and PVC on the back of inflation. These higher costs are expected to impede development activities in the sector,
- Existing oversupply of physical space in select sectors, with approximately 5.8 mn SQFT in the NMA commercial office market, approximately 3.0 mn SQFT in the NMA retail market, with the rest of the Kenyan retail market having an oversupply of approximately 1.7 mn SQFT, leading to prolonged vacancy rates in the respective Real Estate sectoral themes, and,
- The REITs market in Kenya continues to be subdued owing to various challenges such as the large capital requirements of Kshs 100.0 mn for trustees which limits the role to banks, prolonged approval process for REITs, only a few entities capable of incorporating REITs, and high minimum investment amounts set at Kshs 5.0 mn which discourage investments and lack of knowledge of the financial asset class by investors.
Despite these limitations, the Kenyan Real Estate sector has continued to witness increased activities over the years. According to the Economic Survey 2023 by the Kenya National Bureau of Statistics (KNBS), the sector’s contribution to the country’s real GDP recorded a 5-year CAGR of 5.7% to Kshs 993.6 mn in 2022 from Kshs 753.4 mn in 2017. The chart below shows the Real Estate sector’s contribution to GDP from 2017 to 2022;
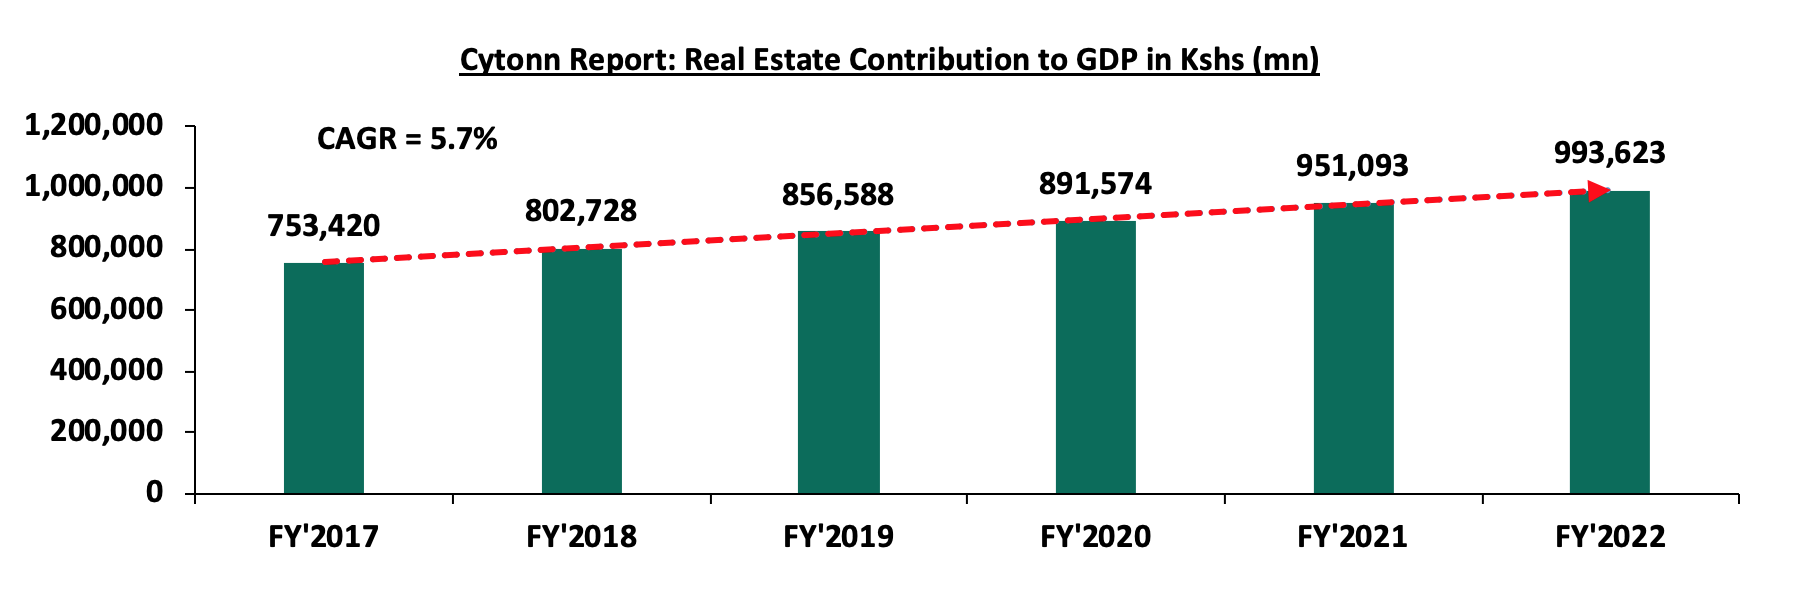
Source: Kenya National Bureau of Statistics (KNBS)
Additionally, the sector contributed 10.5% to the total GDP in FY’2022, coming in as the second largest contributor to Kenya’s GDP, only behind the Agricultural sector that contributed 17.0%. The graph below shows the trend of Real Estate contribution to GDP between FY’2017 and FY’2022;
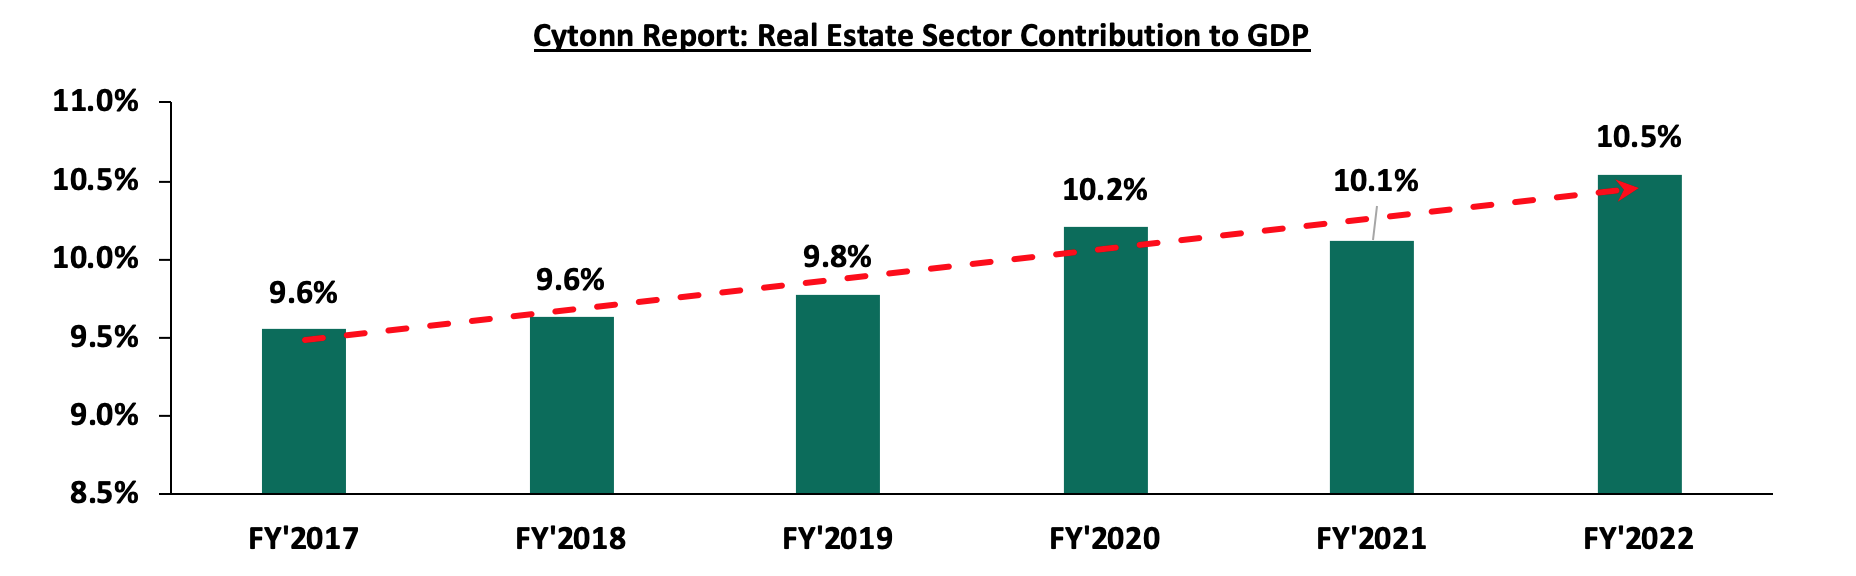
Sectoral Market Performance:
- Residential Sector
During H1’2023, the NMA residential sector recorded an improvement in performance with average y/y total returns to investors coming in at 6.0%, a 0.2%-points increase from 5.8% recorded in H1’2022. The performance was attributed to an improvement in the residential average y/y rental yield which came in at 5.0% in H1’2023, 0.1% points higher compared to the 4.9% rental yield recorded in H1’2022. However, on q/q basis the market softened, registering a 0.1% points decline from the 6.1% average total returns recorded in Q1’2023. In addition, the price appreciation came in at 1.0% in H1’2023, a 0.1%-points increase from 0.9% price appreciation recorded in H1’2022. The table below shows the NMA residential sector’s performance during H1’2022 and H1’2023;
All values in Kshs unless stated otherwise
|
Cytonn Report: Nairobi Metropolitan Area (NMA) Residential Sector Summary - H1’2023/H1’2022 |
|||||||||||
|
Segment |
Average of Price per SQM H1'2023 |
Average of Rent per SQM H1'2023 |
Average of Rental Yield H1'2023 |
Average of Price Appreciation H1'2023 |
Average of Total Returns H1'2023 |
Average of Rental Yield H1'2022 |
Average of Price Appreciation H1'2022 |
Average of Total Returns H1'2022 |
y/y ∆ in Rental Yield |
y/y ∆ in Price Appreciation |
y/y ∆ in Total Returns |
|
Detached Units |
|||||||||||
|
High End |
186,222 |
731 |
4.6% |
1.2% |
5.8% |
4.0% |
1.5% |
5.5% |
0.6% |
(0.3%) |
0.3% |
|
Upper Middle |
140,794 |
596 |
4.5% |
1.1% |
5.6% |
4.5% |
0.9% |
5.4% |
0.0% |
0.2% |
0.2% |
|
Lower Middle |
72,213 |
310 |
4.7% |
1.2% |
5.9% |
5.0% |
0.8% |
5.8% |
(0.3%) |
(0.4%) |
0.1% |
|
Detached Units Average |
133,077 |
546 |
4.6% |
1.2% |
5.8% |
4.5% |
1.1% |
5.6% |
0.1% |
0.1% |
0.2% |
|
Apartments |
|||||||||||
|
Upper Mid-End |
119,362 |
637 |
5.2% |
0.3% |
5.5% |
5.3% |
0.3% |
5.6% |
(0.1%) |
0.0% |
(0.1%) |
|
Lower Mid-End Suburbs |
90,844 |
517 |
5.7% |
0.7% |
6.4% |
5.4% |
0.3% |
5.7% |
0.3% |
0.4% |
0.7% |
|
Lower Mid-End Satellite Towns |
76,582 |
407 |
5.5% |
1.4% |
6.9% |
5.3% |
1.4% |
6.7% |
0.2% |
0.1% |
0.2% |
|
Apartments Average |
95,596 |
520 |
5.5% |
0.8% |
6.3% |
5.4% |
0.7% |
6.0% |
0.1% |
0.1% |
0.3% |
|
Residential Market Average |
114,336 |
533 |
5.0% |
1.0% |
6.0% |
4.9% |
0.9% |
5.8% |
0.1% |
0.2% |
0.2% |
Source: Cytonn Research
- Detached Units Performance
The table below shows the NMA residential sector detached units’ performance during H1’2023;
All values in Kshs unless stated otherwise
|
Cytonn Report: Residential Sector Detached Units Summary H1’2023 |
||||||||
|
Area |
Average of Price per SQM H1'2023 |
Average of Rent per SQM H1'2023 |
Average of Occupancy H1'2023 |
Average of Uptake H1'2023 |
Average of Annual Uptake H1'2023 |
Average of Rental Yield H1'2023 |
Average of Price Appreciation H1'2023 |
Total Returns |
|
High End |
||||||||
|
Rosslyn |
187,976 |
907 |
90.5% |
98.2% |
12.0% |
5.3% |
1.6% |
6.9% |
|
Karen |
177,390 |
675 |
83.4% |
91.6% |
9.9% |
4.8% |
1.4% |
6.2% |
|
Kitisuru |
216,800 |
810 |
94.6% |
94.9% |
11.6% |
4.6% |
1.1% |
5.7% |
|
Runda |
183,111 |
690 |
95.3% |
97.0% |
7.6% |
4.6% |
0.9% |
5.5% |
|
Lower Kabete |
165,834 |
575 |
96.0% |
90.8% |
11.0% |
4.0% |
0.9% |
4.9% |
|
Average |
186,222 |
731 |
92.0% |
94.5% |
10.4% |
4.6% |
1.2% |
5.8% |
|
Upper Middle |
||||||||
|
Redhill & Sigona |
92,918 |
449 |
88.3% |
97.2% |
12.2% |
4.9% |
1.6% |
6.5% |
|
Ridgeways |
170,601 |
697 |
85.7% |
88.5% |
8.5% |
4.4% |
1.8% |
6.2% |
|
Loresho |
169,182 |
793 |
80.5% |
82.5% |
11.7% |
4.8% |
1.2% |
6.0% |
|
Runda Mumwe |
141,228 |
672 |
91.2% |
92.5% |
10.2% |
5.1% |
0.6% |
5.7% |
|
South B/C |
103,761 |
440 |
88.1% |
86.4% |
9.5% |
4.1% |
1.4% |
5.5% |
|
Lavington |
187,314 |
683 |
87.2% |
91.6% |
11.1% |
4.0% |
0.6% |
4.6% |
|
Langata |
120,556 |
441 |
88.5% |
90.5% |
9.7% |
4.0% |
0.4% |
4.4% |
|
Average |
140,794 |
596 |
87.1% |
89.9% |
10.4% |
4.5% |
1.1% |
5.6% |
|
Lower Middle |
||||||||
|
Ruiru |
69,305 |
348 |
87.4% |
83.7% |
14.7% |
5.6% |
1.8% |
7.4% |
|
Ngong |
53,239 |
317 |
94.0% |
97.7% |
14.4% |
5.9% |
0.8% |
6.7% |
|
Juja |
72,843 |
300 |
86.9% |
85.2% |
15.3% |
5.6% |
1.0% |
6.6% |
|
Kitengela |
64,345 |
306 |
86.0% |
86.2% |
11.8% |
5.0% |
1.3% |
6.3% |
|
Syokimau/Mlolongo |
74,311 |
320 |
88.8% |
90.8% |
15.0% |
4.4% |
1.4% |
5.8% |
|
Athi River |
86,844 |
341 |
86.8% |
95.0% |
10.7% |
4.2% |
1.5% |
5.7% |
|
Thika |
63,309 |
223 |
83.3% |
86.9% |
11.6% |
4.0% |
1.2% |
5.2% |
|
Rongai |
81,348 |
253 |
96.0% |
97.5% |
14.3% |
3.8% |
0.9% |
4.7% |
|
Donholm/Komarock |
84,376 |
380 |
85.6% |
95.6% |
9.8% |
3.5% |
1.0% |
4.5% |
|
Average |
72,213 |
310 |
88.3% |
91.0% |
13.1% |
4.7% |
1.2% |
5.9% |
|
Detached Average |
133,077 |
546 |
89.1% |
91.8% |
11.3% |
4.6% |
1.2% |
5.8% |
Source: Cytonn Research
The key take-outs from the table include;
- Average Total Returns – The average y/y total returns to investors came in at 5.8%, a 0.2%-points increase from the 5.6% recorded in H1’2022, driven by an increase in both rental yield and price appreciation by 0.1% points each to 4.6% and 1.2% respectively, from the 4.5% and 1.1%, respectively, recorded in H1’2022. The improved performance was attributable to a 1.7% increase in the average rents per SQM to Kshs 546 in H1’2023, from Kshs 537 recorded in H1’2022,
- Segment Performance – The best performing segment was the lower-middle segment offering an average total return of 5.9%, attributable to relatively high rental yields of 4.7%, 0.1%-points higher than the detached market average rental yield of 4.6%. The impressive performance of the segment is driven by returns from well-performing nodes such as Ruiru, Ngong, and Juja that have continued to offer relatively high returns to investors, and,
- Nodal Performance – Overall, Ruiru was the best performing node, offering the highest returns at 7.4% driven by the relatively high rental yield of 5.6% and price y/y price appreciation of 1.8%. Ruiru has continued to attract residential investments due to its convenient accessibility from the Nairobi CBD through key infrastructure developments such as the Eastern Bypass and Thika Superhighway. Rosslyn followed with an average total return of 6.9%, while the worst performing node was Langata which recorded an average total return of 4.5%, 1.3% points lower than the detached market average of 5.8%.
- Apartments Performance
The table below shows the NMA residential sector apartments’ performance during H1’2023;
All values in Kshs unless stated otherwise
|
Cytonn Report: Residential Sector Apartments Summary H1’2023 |
||||||||
|
Area |
Average of Price per SQM H1'2023 |
Average of Rent per SQM H1'2023 |
Average of Occupancy H1'2023 |
Average of Uptake H1'2023 |
Average of Annual Uptake H1'2023 |
Average of Rental Yield H1'2023 |
Average of Price Appreciation H1'2023 |
Total Returns |
|
Upper Mid-End |
||||||||
|
Westlands |
123,355 |
768 |
83.1% |
87.3% |
15.3% |
6.1% |
0.3% |
6.4% |
|
Kileleshwa |
116,455 |
618 |
88.0% |
91.2% |
12.2% |
5.6% |
0.4% |
6.0% |
|
Kilimani |
105,850 |
573 |
86.0% |
89.9% |
17.5% |
5.7% |
0.2% |
5.9% |
|
Parklands |
112,174 |
587 |
86.7% |
90.8% |
11.8% |
5.7% |
0.1% |
5.8% |
|
Loresho |
123,336 |
543 |
88.0% |
97.2% |
9.4% |
4.7% |
1.0% |
5.7% |
|
Upperhill |
135,001 |
733 |
83.6% |
88.1% |
11.6% |
5.7% |
(0.1%) |
5.6% |
|
Average |
119,362 |
637 |
85.9% |
90.7% |
13.0% |
5.2% |
0.3% |
5.5% |
|
Lower Mid-End Suburbs |
||||||||
|
South C |
112,472 |
733 |
80.4% |
87.8% |
15.2% |
6.3% |
1.1% |
7.4% |
|
Kahawa West |
72,741 |
369 |
89.0% |
86.2% |
8.1% |
6.4% |
0.5% |
6.9% |
|
Waiyaki Way |
79,051 |
480 |
83.8% |
87.3% |
15.1% |
6.2% |
0.6% |
6.8% |
|
Imara Daima |
67,938 |
353 |
86.2% |
86.6% |
8.9% |
5.5% |
1.2% |
6.7% |
|
Langata |
107,317 |
567 |
84.2% |
86.6% |
11.2% |
5.3% |
1.3% |
6.6% |
|
RaceCourse/Lenana |
100,398 |
624 |
84.0% |
91.1% |
15.8% |
6.4% |
0.0% |
6.4% |
|
Donholm/Komarock |
76,696 |
465 |
92.6% |
91.4% |
10.1% |
5.2% |
1.1% |
6.3% |
|
South B |
111,301 |
528 |
88.7% |
95.4% |
14.1% |
5.1% |
0.6% |
5.7% |
|
Dagoretti |
89,679 |
535 |
88.3% |
81.2% |
11.1% |
5.2% |
0.3% |
5.5% |
|
Average |
90,844 |
517 |
86.4% |
88.2% |
12.2% |
5.7% |
0.7% |
6.4% |
|
Lower Mid-End Satellite Towns |
||||||||
|
Ngong |
73,648 |
452 |
86.5% |
85.7% |
10.6% |
5.5% |
1.9% |
7.4% |
|
Ruiru |
89,416 |
492 |
87.0% |
83.6% |
14.1% |
5.8% |
1.5% |
7.3% |
|
Ruaka |
108,765 |
600 |
77.1% |
83.8% |
16.5% |
5.1% |
2.1% |
7.2% |
|
Kikuyu |
81,348 |
443 |
86.9% |
92.0% |
16.1% |
5.8% |
1.3% |
7.1% |
|
Thindigua |
100,195 |
444 |
87.0% |
83.4% |
14.8% |
4.7% |
2.3% |
7.0% |
|
Syokimau |
67,048 |
338 |
86.3% |
90.8% |
12.7% |
5.3% |
1.3% |
6.6% |
|
Athi River |
57,677 |
302 |
88.9% |
95.1% |
13.4% |
5.6% |
0.8% |
6.4% |
|
Kitengela |
57,108 |
293 |
85.5% |
87.5% |
8.3% |
5.4% |
0.9% |
6.3% |
|
Rongai |
54,036 |
295 |
86.8% |
80.4% |
16.1% |
5.7% |
0.5% |
6.2% |
|
Average |
76,582 |
407 |
85.8% |
86.9% |
13.6% |
5.5% |
1.4% |
6.9% |
|
Apartment Average |
95,596 |
520 |
86.0% |
88.6% |
12.9% |
5.6% |
0.8% |
6.3% |
Source: Cytonn Research
The key take-outs from the table include;
- Average Total Returns – The average y/y total returns came in at 6.3%, a 0.3%-points increase from the 6.0% recorded in H1’2022. The improved performance was driven by a 0.1% points increase in price appreciation to 0.8% in H1’2023, from the 0.7% recorded in H1’2022. In addition, the average rental yield increased by 0.2% points to 5.6%, from 5.4% recorded in H1’2022, majorly attributable to a 2.0%-points increase in average occupancy rates to 86.0%, from the 84.0% recorded in H1’2022,
- Segment Performance – The best performing segment was the lower mid-end satellite towns with average total return of 6.9%, attributed to an average rental yield of 5.5% and relatively high price appreciation of 1.4%. The impressive performance of the segment was driven by returns from well-performing nodes such as Ngong, Ruiru, and Ruaka that have continued to offer competitive returns to investors in comparison to other segments, and
- Nodal Performance – Overall, the best performing nodes were Ngong and South C, tied in with average rental yields of 7.4%, 1.1%-points higher than the apartment market average total returns of 6.3%. Ngong has seen increased investments with increased residents owing to increased accessibility to the CBD with the completion of the Ngong-Lang’ata Link road. The worst performing node was Dagoretti, which recorded an average total return of 5.5%, 0.8%-points lower than the detached market average of 6.3%.
For notable highlights during H1’2023, please see our Cytonn Q1’2023 Markets Review, and Cytonn Monthly - May 2023 reports. For the month of June;
- Housing Finance Company (HFC), the banking subsidiary of HF Group, announced a partnership deal with Kigutha Farmers Limited, to develop a Kshs 1.4 bn gated community housing project dubbed ‘Barista Gardens’ located in Kamiti Corner, Kiambu County. The Joint-Venture (JV) deal will see the farmers holding provide a 58-acre piece of land, which will consist of serviced plots for buyers to develop 180 housing units within the gated community. For more information, see Cytonn Weekly #24/2023.
We have a NEUTRAL outlook for the NMA residential sector, as we as we expect the supply and demand of housing to grow, supported by several factors such as; i) infrastructural development leading to more development activities, ii) provision of affordable housing by the government and private sector, iii) focus on mortgage financing through the KMRC, and, iv) Kenya's positive demographics in terms of urbanization and population growth rates compared to global rates. However, various setbacks such as the continued increase in construction costs on the back of the high inflation, low penetration rate of mortgage financing to buyers, and constrained financing to developers with underdeveloped capital markets are expected to remain weighing down the optimum performance of the sector.
- Commercial Office Sector
The table below highlights the performance of the Nairobi Metropolitan Area (NMA) Commercial Office sector from H1’2022 to H1’2023;
|
Cytonn Report: Nairobi Metropolitan Area (NMA) Commercial Office Returns Over Time H1’2022 – H1’2023 |
||||||
|
Year |
H1'2022 |
Q3'2022 |
FY'2022 |
Q1'2023 |
H1'2023 |
∆ H1'2022/H1'2023 |
|
Occupancy (% ) |
77.9% |
78.2% |
79.4% |
79.8% |
80.8% |
2.9% points |
|
Asking Rents (Kshs/SQFT) |
95 |
96 |
96 |
97 |
98 |
3.2% |
|
Average Prices (Kshs/SQFT) |
12,142 |
12,221 |
12,223 |
12,238 |
12,238 |
0.8% |
|
Average Rental Yields (% ) |
7.4% |
7.4% |
7.6% |
7.6% |
7.8% |
0.4% points |
The key take-outs from the table include;
- Average Asking Rents – In H1’2023, average asking rents per SQFT in the NMA increased by 3.2% to Kshs 98 from Kshs 95 per SQFT recorded in H1’2022. On a q/q basis, the performance registered a 1.0% increase to Kshs 98, from Kshs 97 per SQFT recorded in Q1’2023. The improvement in performance was occasioned by a surge in supply of Grade A offices commanding higher rents such as The Piano, The Cube, The Rock, Principal Place, TDB Towers among others,
- Average Occupancy Rates – The overall occupancy rates in H1’2023 increased by 2.9% points to 80.8%, from 77.9% realized in H1’2022 attributed to; i) the absence of major developments entering the market during the review period, which allowed for absorption rates to stabilize thus boosting occupancy rates, ii) gradual resurgence in the demand for physical office space as more companies resumed in-person work policies post COVID-19, and, iii) growing popularity in co-working spaces which continue to bolster occupancies. On a q/q basis, occupancy rates in the NMA increased by 1.0% points to 80.8% recorded in H1’2023, from 79.8% realized in Q1’2023, and,
- Average Rental Yields – The average rental yields improved by 0.4% points increase to 7.8% in H1’2023 from 7.4% recorded in H1’2022, due to improved asking rents and occupancy rates. On a q/q basis, average rental yields in the NMA increased by 0.2% points to 7.8% in H1’2023, from 7.6% recorded in Q1’2023;
For the submarket performance, Karen, Gigiri and Wetlands were the best performing nodes realizing average rental yields of 8.8%, 8.7% and 8.6% respectively in H1’2023, compared to the market average of 7.8%. Their performance was on the back of; i) high concentration of Grade A office spaces attracting prime rents thus resulting in attractive yields for investors, ii) low supply of commercial office spaces within the markets thus creating demand, coupled with the presence of international organizations, multinational companies and embassies in the areas further enhancing demand, iii) relatively good infrastructure and amenities providing ease of accessibility and convenience, which has made them popular choices for businesses, and, iv) serene environment offered by these locations, situated away from the bustling city center which provides excellent office settings that are highly valued by businesses. Conversely, Mombasa Road was the least performing node with an average rental yield of 5.2%, 2.6% points lower than the market average of 7.8%. This was attributed to; i) the presence of lower quality offices fetching lower average rents at Kshs 71 per SQFT, ii) its recognition as an industrial zone, making it less appealing to office-centric businesses, and, iii) stiff competition from other sub-markets in the NMA that offer superior quality office spaces. The table below shows the Nairobi Metropolitan Area (NMA) sub-market performance;
All values in Kshs unless stated otherwise
|
Cytonn Report: NMA Commercial Office Submarket Performance H1'2023 |
|||||||||||
|
Area |
Price /SQFT H1'2023 |
Rent/SQFT H1'2023 |
Occupancy H1'2023 |
Rental Yields H1'2023 |
Price/SQFT H1'2022 |
Rent/SQFT H1'2022 |
Occupancy H1'2022 |
Rental Yields H1'2022 |
∆ in Rental Rates |
∆ in Occupancy (% points) |
∆ in Rental Yields (% points) |
|
Karen |
13,431 |
117 |
83.5% |
8.8% |
12,385 |
107 |
83.0% |
7.9% |
9.7% |
0.5% |
0.8% |
|
Gigiri |
13,500 |
118 |
81.8% |
8.7% |
13,500 |
118 |
81.0% |
8.6% |
0.0% |
0.8% |
0.1% |
|
Westlands |
12032 |
110 |
78.2% |
8.6% |
11,853 |
105 |
74.6% |
8.1% |
4.4% |
3.7% |
0.4% |
|
Parklands |
11,662 |
93 |
83.6% |
8.1% |
11,662 |
90 |
82.8% |
7.6% |
4.4% |
0.8% |
0.5% |
|
Kilimani |
12,260 |
93 |
84.6% |
8.0% |
12,385 |
92 |
80.2% |
7.3% |
1.4% |
4.4% |
0.7% |
|
Nairobi CBD |
11,971 |
87 |
85.0% |
7.6% |
11,812 |
82 |
83.9% |
6.9% |
6.8% |
1.2% |
0.7% |
|
Upperhill |
12,605 |
97 |
78.8% |
7.3% |
12,409 |
94 |
76.2% |
6.9% |
3.2% |
2.5% |
0.4% |
|
Thika Road |
12,571 |
79 |
80.1% |
6.0% |
12,571 |
78 |
77.6% |
5.7% |
1.4% |
2.6% |
0.3% |
|
Mombasa Road |
11,325 |
71 |
67.9% |
5.2% |
11,225 |
73 |
65.0% |
5.1% |
-2.8% |
2.9% |
0.1% |
|
Average |
12,238 |
98 |
80.8% |
7.8% |
12,142 |
95 |
77.9% |
7.4% |
3.3% |
2.9% |
0.5% |
Source: Cytonn Research
Notable highlights in H1’2023 include (please see our Q1’2023 Markets Review report);
- Actis Limited, a global private equity firm, announced that it had shut down two offices located in Nairobi, Kenya and Cape Town, South Africa. However, Actis has maintained that the closure of these branches does not imply an exit from the respective markets. For more information, please see our Cytonn Weekly #21/2023, and,
- The United Nations (UN) announced plans to relocate the United Nations Office for Project Services (UNOPS) Africa regional office to Nairobi, Kenya. Previously, the UNOPS Africa regional headquarters had its base in Denmark, while maintaining country offices in Liberia, Tunisia, Sudan, South Sudan, Kenya, the Democratic Republic of Congo (DRC), Nigeria, Ethiopia, Cote d'Ivoire, and Tunisia. For more information please see Cytonn Weekly #18/2023.
We have a NEUTRAL outlook for the NMA commercial office sector whose performance is supported by gaining traction in co-working spaces, and, reduced developments in the pipeline which we expect will help curb the oversupply challenge. However, the existing oversupply of office spaces at 5.8 mn SQFT in the NMA is expected to weigh down optimum performance of the sector by stifling the overall demand for physical space. Investment opportunity lies in Karen, Gigiri and Westlands which offer relatively high returns compared to the market average.
- Retail Sector
The table below shows the performance of the retail sector performance in Nairobi Metropolitan Area from Q1’2022 to H1’2023;
|
Cytonn Report: Nairobi Metropolitan Area (NMA) Retail Performance Q1’2022 – H1’2023 |
|||||||
|
Year |
Q1'2022 |
H1'2022 |
Q3'2022 |
FY'2022 |
Q1'2023 |
H1’2023 |
H1’2023/ H1’2022 ∆ |
|
Average Asking Rents (Kshs/SQFT) |
170 |
173 |
171 |
174 |
176 |
177 |
2.1% |
|
Average Occupancy (%) |
77.2% |
75.9% |
76.1% |
77.6% |
78.0% |
79.2% |
3.3% points |
|
Average Rental Yields |
7.9% |
7.8% |
7.6% |
7.9% |
8.0% |
8.2% |
0.4% points |
The key take-outs from the table include;
- Average Occupancy Rate – The average occupancy rates came in at 79.2%, a 3.3% points increase from 75.9% recorded in H1’2022. The positive growth is attributed to; i) continuous expansion by local and foreign retailers such as Naivas, Carrefour, Quickmart, Optica Limited, Kentucky Fried Chicken (KFC), Cleanshelf, and, Simbisa Kenya that owns Chicken and Pizza Inn over the period, ii) an improved business environment following the continuous gradual recovery of the economy in the post COVID-19 era and post-electioneering season , iii) positive demographics which continues to sustain demand for consumable goods and services hence triggering expansion by several existing retailers, and, iv), continuous improvement of infrastructure developments enhancing accessibility to retail centres and opening up other regions in NMA for newer opportunities. On a q/q basis, average occupancy rate in the NMA increased by 1.2% points to 79.2% in H1’2023, from 79.2% recorded in Q1’2023,
- Asking Rents – The average asking rents per SQFT increased by 2.1% to Kshs 177 in H1’2023 from Kshs 173 recorded in H1’2022, driven by an increased presence of quality retail spaces which continue to fetch higher rents in several nodes of NMA such as Karen, Kilimani, Westlands, and, along Kiambu and Limuru roads. The presence of foreign businesses in the retail spaces within the aforementioned areas continue to become attractive due to their proximity to multinational organizations and embassies aimed at serving the consumer needs and interests of foreign clients working in those entities. As a result, property owners of these retail spaces have allowed rental transactions to be quoted in dollars. This practice has contributed to the increase in rental rates, especially considering the ongoing depreciation of the Kenyan currency against the dollar. The combination of foreign business attraction and the quoting of rents in dollars has led to a notable increase in rental prices in these areas. On a q/q basis, average asking rents in the NMA increased by 0.8% to Kshs 177 in H1’2023, from Kshs 176 recorded in Q1’2023, and,
- Average Rental Yield – The average rental yield for the NMA retail sector improved by 0.4% points to 8.2% in H1’2023, from 7.8% in H1’2022 attributed to improved asking rents and occupancy rates. On a q/q basis, average rental yields in the NMA increased by 0.2% points to 8.2% in H1’2023, from 8.0% recorded in Q1’2023
Regarding sub-market performance, Kilimani, Karen, and Westlands stood out as the best performing nodes with average rental yields of 10.1%, 9.7%, and 9.1% respectively, surpassing other nodes. The exceptional performance of was attributed to the availability of high-quality retail spaces that command high rents, as well as the presence of quality infrastructure services in those areas. Conversely, Eastlands continued to register the least average rental yield of 6.0% due to; i) lower rents of Kshs 128 per SQFT, as compared to the market average of Kshs 177 per SQFT, ii) poor quality infrastructure which is unsustainable for the retail spaces and hindering sufficient accessibility, iii) heavy presence of informal retail spaces that quickly adapt to market trends and service stations with value added amenities offering opportunities for better quality retail spaces, one-stop-shop approach, convenience and cheaper rates for price sensitive clients increasingly cause stiffer competition, and, iv) relatively lower demand shown by a low occupancy rate of 75.6%, compared to the market average of 79.2%. Additionally, prime retail spaces in the satellite towns have exhibited the highest occupancy rate and rental yield attributed to population growth in the regions prompting retailers to extend their services beyond the city centre and tap opportunities in satellite towns. This shift of focus aims to bring convenience to residents in the nearest and most accessible way. This is also at the back of reduced rents by the retail space owners to attract more clients in the region amid increased demand for consumer goods, services and entertainment facilities. The table below shows the submarket performance of nodes in the Nairobi Metropolitan Area (NMA) H1’2023;
(All values in Kshs unless stated otherwise)
|
Cytonn Report: Nairobi Metropolitan Area Retail Market Performance H1’2023 |
|||||||||
|
Area |
Rent /SQFT H1’2023 |
Occupancy% H1’2023 |
Rental Yield H1’2023 |
Rent/SQFT H1’2022 |
Occupancy% H1’2022 |
Rental Yield H1’2022 |
∆ in Rental Rates |
∆ in Occupancy (% points) |
∆ in Rental Yield (% points) |
|
Kilimani |
190 |
84.7% |
10.1% |
182 |
85.0% |
9.7% |
4.6% |
(0.3%) |
0.4% |
|
Karen |
217 |
82.4% |
9.7% |
205 |
78.6% |
8.9% |
5.6% |
3.8% |
0.8% |
|
Westlands |
216 |
77.6% |
9.1% |
215 |
72.9% |
9.0% |
0.5% |
4.7% |
0.1% |
|
Kiambu road & Limuru Road |
202 |
74.0% |
8.7% |
187 |
73.3% |
8.1% |
8.0% |
0.7% |
0.6% |
|
Ngong Road |
170 |
81.0% |
7.8% |
169 |
78.0% |
7.5% |
0.4% |
3.0% |
0.3% |
|
Mombasa road |
165 |
80.7% |
7.5% |
165 |
74.8% |
7.3% |
0.0% |
5.9% |
0.2% |
|
Thika Road |
156 |
79.9% |
7.5% |
150 |
78.5% |
7.3% |
3.8% |
1.4% |
0.2% |
|
Satellite towns |
138 |
78.8% |
6.8% |
138 |
70.7% |
6.0% |
(0.2%) |
8.1% |
0.8% |
|
Eastlands |
128 |
75.6% |
6.0% |
133 |
74.2% |
5.9% |
(3.8%) |
1.4% |
0.1% |
|
Average |
177 |
79.2% |
8.2% |
173 |
75.9% |
7.8% |
2.1% |
3.3% |
0.4% |
Source: Cytonn Research
For notable highlights during the H1’2023, please see our Cytonn Q1’2023 Markets Review, Cytonn Monthly- April 2023, and Cytonn Monthly- May 2023 reports.
We have a NEUTRAL outlook on the performance of retail sector as we anticipate that the sector will be influenced by various factors. On the positive side, growth and expansion efforts by both local and international retailers, increased infrastructure development enhancing accessibility in satellite towns, and positive demographics supporting demand for space, goods, and services in NMA in other parts of NMA and satellite towns expanding to its environs are expected to drive performance. On the negative side, the continuous oversupply of retail space in the NMA and Kenyan retail sectors (excluding NMA) at approximately 3.0 mn and 1.7 mn SQFT respectively, and the ongoing closure of retail spaces by exiting retailers will hinder the optimum performance of the sector. Additionally, the rapid growth of e-commerce in the retail landscape with an expected Compound Annual Growth Rate (CAGR 2023-2027) of 6.7% driven by change in consumer behaviours and preferences could intensively limit the optimal utilization of physical retail spaces.
- Hospitality Sector
In H1’2023, two hospitality sector related industry reports were released and the key-take outs were as follows;
|
Cytonn Report: Released Industry Report related to Hospitality Sector H1’2023 |
||
|
# |
Report |
Key Take-outs |
|
1 |
The Leading Economic Indicators (LEI) March 2023 Report, by Kenya National Bureau of Statistics (KNBS) |
· Overall international arrivals through Jomo Kenyatta International Airport (JKIA) and Moi International Airport (MIA) increased by 0.2% to 114,295 in February 2023, from the 114,048 recorded in January 2023 · On a y/y basis, the performance represented a 58.7% increase to 228,343 persons recorded for the months of January and February 2023 compared to the 114,882 persons recorded in January and February 2022. The improved performance is attributable to; i) increased international marketing of Kenya’s tourism market by the Ministry of Tourism in collaboration with the Kenya Tourism Board, through platforms such as the Magical Kenya platform, ii) the tourism board alignment of its marketing initiatives towards targeting emerging and established source markets, and, iii) an increase in corporate and business Meetings, Events, and Conferences (MICE) from both the public and private sectors. For more information, please see Cytonn Weekly #25/2023. |
|
2 |
FY’2023/2024 Budget Statement by the National Treasury |
· The tourism, sports and culture sector received a total allocation of Kshs 22.1 bn, with the Tourism Promotion Fund (TPF) receiving Kshs 2.0 bn and Tourism Fund receiving Kshs 4.1 bn respectively in FY’2023/24 · The allocation for the TPF increased by 11.1%, to Kshs 2.0 bn in FY’2023/224, from Kshs 1.8 bn in FY’2022/23 · Additionally, allocation for the Tourism Fund increased by 28.1% to Kshs 4.1 bn in FY’2023/24, from Kshs 3.2 bn in FY’2022/23. |
For notable highlights in H1’2023, please see our Cytonn Q1’2023 Markets Review report. Other notable highlights include;
- Pan Pacific Hotels Group, a subsidiary of Singapore-listed UOL Group Limited, one of Asia’s most established hotel and property companies, opened a luxurious hotel facility dubbed ‘Pan Pacific Serviced Suites Nairobi’ located at the Global Trade Centre (GTC) in Westlands, Nairobi. Marking the first entry by the global hospitality brand in Africa, the facility comprises of 175 high-end one-to-four-bedroom penthouse suites ranging from 82.0 SQM to 309.0 SQM, and various amenities for residents. For more information, please see Cytonn Weekly #25/2023, and,
- JW Marriot, a subsidiary of the Marriot Bonvoy global portfolio of 30 extraordinary hotel brands officially opened a luxurious safari lodge in River Masai Mara, Talek, within Masai Mara National Reserve dubbed ‘JW Marriott Masai Mara’. The high-end property consists of a restaurant, lounge bar, spa, fitness centre, photographic studio, garden, and outdoor pool. Additionally, the hotel entails 20 private tented rooms and suites which offer different kind of high-end amenities and at different rates. The rooms and suites are categorized into; Deluxe, Deluxe Sunset, Executive, and Ambassadorial. For more information, see Cytonn Weekly #14/2023.
We have a NEUTRAL outlook for the sector as we expect the hospitality sector’s performance to continue on an upward trajectory moving forward in terms of overall hotels in operations, hotel bookings, and hotel occupancies. We expect performance to be supported by factors such as: i) increased budgetary allocation towards the sector through the Tourism Fund and Tourism Promotion Fund (TPF) in FY’2023/24, ii) increased international tourism arrivals into the country gearing towards pre-COVID levels as highlighted by the Annual Tourism Sector Performance Report 2022 Report, iii) intensive and ambitious marketing of Kenya’s tourism market by the Ministry of Tourism, in collaboration with the Kenya Tourism Board, through platforms such as Magical Kenya towards targeting emerging and established source markets, iv) concerted efforts to promote local tourism highlighted under the Ministry of Tourism Strategy 2021-2025, v) increased corporate and business Meetings, Incentives, Conferences and Events (MICE) from both the public and private sectors owing to the revamping of the economy during the post-COVID-19 and electioneering periods, vi) increased leisure and sporting activities with the hosting of Annual World Rally Championship (WRC) competition in Naivasha until 2026, vii) resumption of daily direct flights from Nairobi to New York which we expect will contribute to an increase in international arrivals, viii) continued recognition of Kenya’s hospitality industry by international hospitality agencies such as Henley and Partners Real Estate in their Africa Wealth Report 2023 and through positive accolades awarded to several local and foreign hotel brands based in Kenya such as the World Travel Awards 2022, MICE Awards, Fodor Finest Hotels Awards, among others, which have boosted investors’ confidence in the sector, and, ix) continuous opening, expansions, acquisitions and mergers by local and international hotel brands in the country. However, the recent issuance of travel advisories regarding insecurity in certain regions of the country by the United Kingdom (UK), United States of America (USA), Irish, and Canadian governments in February 2023 and the current government’s austerity measures to indefinitely suspend hotel meetings, conferences and trainings by Ministries, Departments and Agencies (MDAs) will curtail optimum performance of the sector.
- Land Sector
The average selling prices for land in the Nairobi Metropolitan Area (NMA) recorded an overall improvement in performance in H1’2022, with the y/y average capital appreciation coming in at 4.5%. Additionally, average prices per acre in the NMA came in at Kshs 128.5 mn in H1’2023, from Kshs 128.4 mn recorded in H1’2022. The performance was mainly attributed to;
- Government’s continued focus on the development of infrastructure such as roads, railways, water and sewer lines which has improved and opened up areas for investment, ultimately increasing property prices,
- Limited supply of land especially in urban areas which has contributed to exorbitant prices,
- Increased construction activities particularly in the residential sector fueled by the government’s affordable housing agenda which has boosted demand for land, and,
- Positive demographics driving demand for land upwards, facilitated by high population and urbanization growth rates of 1.9% and 3.7%, above the global averages of 0.9% and 1.6% respectively.
Overall Performance: Un-serviced land in the satellite towns of Nairobi recorded the highest y/y capital appreciation of 9.1% mainly due to; i) the areas improved accessibility benefitting from infrastructural developments such as the Nairobi Expressway and the recent expansion of the Eastern Bypass, ii) affordability of land prices enticing buyers and investors. The average asking land prices per acre for un-serviced land in satellite towns came in at Kshs 15.4 mn, significantly lower than Kshs 397.3 mn per acre in Nairobi suburbs, and, iii) presence of a notable quantity of affordable housing development initiatives in the satellite towns, in contrast to other regions within the Nairobi Metropolitan Area (NMA) which has additionally amplified the demand for land. The table below shows the overall performance of the sector across all land sub-sectors during H1’2023;
All Values in Kshs Unless Stated Otherwise
|
Summary of the Performance Across All regions H1’2023 |
|||
|
H1'2022 |
H1'2023 |
Annualized Capital Appreciation |
|
|
Un-serviced land - Satellite Towns |
14.7 mn |
15.4 mn |
9.1% |
|
Serviced Land - Satellite Towns |
17.0 mn |
18.3 mn |
8.5% |
|
Nairobi High End Suburbs (Low- and High-Rise Areas) |
130.5 mn |
135.5 mn |
5.3% |
|
Nairobi Middle End Suburbs- High Rise Residential Areas |
76.3 mn |
76.1 mn |
1.1% |
|
Nairobi Suburbs- Commercial Areas |
403.4 mn |
397.3 mn |
(1.4%) |
|
Average |
128.4 mn |
128.5 mn |
4.5% |
Sub-markets Performance: For satellite towns, Syokimau, Athi River, Juja and Utawala were the best performing nodes with y/y capital appreciations of 23.9%, 19.2%, 18.9% and 18.4% respectively, owing to: i) improved infrastructural developments such as the Nairobi Expressway, Juja Farm Road, Katani Road and Eastern Bypass which have expanded investment opportunities by opening up new areas, consequently driving up land prices, ii) convenient transportation links and connectivity facilitating seamless commute benefitting homebuyers seeking to settle away from the city and, iii) a presence notable number of higher learning institutions particularly within Juja Sub-County, which have exacerbated the demand for land to develop student housing.
For Nairobi suburbs, Spring Valley recorded the highest y/y appreciation from H1’2023 at 9.2% due to; i) increased demand for land in the region owing to adequate infrastructure and amenities such as Sarit Centre, and Westgate Shopping Malls, ii) proximity to the CBD and other prime and rising urban nodes such as Parklands and Westlands thus making it easily accessible and convenient, iii) a higher population of affluent residents with higher purchasing power and disposable incomes, and, iv) serene environment appealing to aforementioned high end buyers.
Land in Nairobi Suburbs Commercial Zones recorded a 1.4% price correction mainly on the back of declined demand owing to high land prices. The average asking prices per acre coming in at Kshs 397.3 mn, which is significantly higher than the market average of Kshs 128.5 mn. Furthermore, these areas are increasingly becoming congested due to relaxed zoning regulations in areas such as Kilimani, occasioning frequent traffic snarl-ups rendering them inconvenient and difficult to access. The table below shows NMA’s land performance by submarkets in H1’2023;
Price in Kshs per Acre
|
Cytonn Report: Nairobi Metropolitan Area Land Performance By Submarkets – H1’2023 |
|||
|
Location |
Price H1'2022 |
Price H1'2023 |
Capital Appreciation |
|
Satellite Towns - Unserviced Land |
|||
|
Athi River |
4.4 mn |
5.2 mn |
19.2% |
|
Juja |
12.2 mn |
14.5 mn |
18.9% |
|
Utawala |
14.1 mn |
16.7 mn |
18.4% |
|
Limuru |
24.1 mn |
23.5 mn |
(2.6%) |
|
Rongai |
18.9 mn |
17.3 mn |
(8.5%) |
|
Average |
14.7 mn |
15.4 mn |
9.1% |
|
Satellite Towns - Serviced Land |
|||
|
Syokimau |
13.9 mn |
17.2 mn |
23.9% |
|
Ruiru & Juja |
25.9 mn |
28.1 mn |
8.6% |
|
Athi River |
13.3 mn |
14.4 mn |
8.2% |
|
Ruai |
11.6 mn |
12.5 mn |
7.7% |
|
Rongai |
20.4 mn |
19.1 mn |
(6.1%) |
|
Average |
17.0 mn |
18.3 mn |
8.5% |
|
Nairobi High End Suburbs (Low and High Rise Areas) |
|||
|
Spring Valley |
161.7 mn |
176.5 mn |
9.2% |
|
Runda |
81.7 mn |
87.9 mn |
7.6% |
|
Ridgeways |
81.4 mn |
87.0 mn |
6.8% |
|
Kitisuru |
90.3 mn |
95.0 mn |
5.2% |
|
Karen |
62.0 mn |
64.5 mn |
4.2% |
|
Kileleshwa |
305.8 mn |
301.9 mn |
(1.3%) |
|
Average |
130.5 mn |
135.5 mn |
5.3% |
|
Nairobi Middle End Suburbs – High Rise Residential Areas |
|||
|
Embakasi |
66.9 mn |
71.5 mn |
6.9% |
|
Kasarani |
66.9 mn |
71.3 mn |
6.6% |
|
Dagoretti |
95.2 mn |
85.6 mn |
(10.1%) |
|
Average |
76.3 mn |
76.1 mn |
1.1% |
|
Nairobi Suburbs - Commercial Zones |
|||
|
Riverside |
343.1 mn |
342.1 mn |
(0.3%) |
|
Kilimani |
380.4 mn |
375.9 mn |
(1.2%) |
|
Westlands |
418.3 mn |
413.2 mn |
(1.2%) |
|
Upperhill |
471.9 mn |
458.1 mn |
(2.9%) |
|
Average |
403.4 mn |
397.3 mn |
(1.4%) |
Source: Cytonn Research
We retain a POSITIVE outlook for the land sector in the NMA which has continued to remain resilient affirming its position as a reliable investment opportunity. We expect that the sector's performance will be propelled by several key factors including; i) heightened demand for land for development facilitated by positive population demographics, ii) ongoing efforts by the government to streamline land transactions creating a more efficient and accessible market, iii) notable increase in the initiation and completion of affordable housing projects owing to both government and private sector involvement, and, iv) rapid expansion of satellite towns, accompanied by substantial infrastructural developments resulting in elevated property prices.
- Infrastructure
Notable highlights during H1’2023 included;
- Tatu City, a mixed use development located in Ruiru municipality and Kenya’s first operational special economic zone completed the final phase of infrastructure for Kijani Ridge valued at Kshs 1.0 bn. The works mainly included horizontal infrastructural works including; i) 6 kilometres of tarmacked roads which forms part of a wider network of more than 50 kilometres of tarmacked roads within Tatu city, ii) 12 kilometres of footpath, iii) 5 kilometres of underground piped storm water network, iv) 5 kilometres of water supply, v) 2.7 kilometres of sewer line, vi) 12 kilometres of fiber-optic cabling, and, vii) 9.5 kilometres of 11Kv medium voltage underground power lines. For more information, see our Cytonn Q1’2023 Markets Review,
- Northern Corridor Transit and Transport Coordination Authority (NCTTCA) announced a partnership with Superior Homes Kenya, a housing developer where Cytonn Investments is the second largest shareholder, to construct roadside stations along major highways. Superior Homes Kenya will develop the service and rest point areas along various transit routes within the country, which will feature self-contained facilities for long-distance truckers such as; i) safe parking spaces, ii) driver accommodation features, iii) convenience stores for food and beverage options, iv) health facilities, v) truck maintenance and refueling, and, vi) cargo handling. For more information, see our Cytonn Monthly – February 2023 report,
- Kenya Railways Corporation (KRC) commenced construction of the first phase of the Kshs 30.0 bn Railway City project which was launched in by President William Ruto in December 2022. For more information, see our Cytonn Weekly #07/2023, and,
- The Kenya National Highways Authority (KeNHA) announced plans to begin rehabilitation and improvement of sections of Mombasa road which were damaged during the construction of the Nairobi Expressway. Additionally, two major roads; Murang’a-Kangema and Murang’a-Kiriaini-Othaya located in Murang’a County were upgraded to national status for the purpose of rehabilitation and other maintenance works. For more information, see our Cytonn Weekly #06/2023.
We expect the infrastructure sector in Kenya to continue to play a crucial role in promoting economic activities, which in turn will drive the growth and performance of the Real Estate sector, with better and improved road, railway and air transport networks, and other support facilities that make it easier for delivery of people, goods, and services efficiently, thereby increasing demand for Real Estate properties. Additionally, the government has increased budget allocation to the infrastructure sector by 16.9%, to Kshs 286.6 bn in FY’2023/2024 from Kshs 245.1 bn in FY’2022/2023, with key focus in development and maintenance of major roads and bridges across the country, extension of the Standard Gauge Railway (SGR) to Kisumu and Isiolo, development of Dongo Kundu Special Economic Zone, development of Nairobi Railway City, and construction of airports, airstrips and a Kshs 1.3 bn modern cruise ship terminal in Mombasa. Additionally, the government is actively pursuing the completion of major infrastructure projects that were previously halted by the current regime, signalling a renewed commitment to infrastructural developments. Such projects include the dualling of Rironi- Mau Summit Highway at a cost of Kshs 180.0 bn, Kenol-Sagana-Marua highway Phase 3 and 4 at a cost of Kshs 8.0 bn, and the Eastern Bypass Highway Phase 2, that have received financial injection by the African Development Bank (AfDB). As a result, we expect boost in development of more habitable areas for settlements and increased developments of Real Estate in the new upcoming regions across the country. However, it is likely that alternative financing strategies such as Public-Private Partnerships (PPPs) and joint ventures will be explored to ensure the successful execution of more infrastructure projects in the country.
- Industrial Sector
During H1’2023, notable highlights in the sector included;
- Rogers Group Limited, a Mauritanian investment group disclosed that it recorded a Kshs 113.6 mn gain in a bargain purchase acquisition deal of Rongai Workshop and Transport Limited, a renowned transport and logistics company in Kenya, through its logistics subsidiary Velogic Limited. Additionally, Turkish based manufacturing conglomerate, Turkish Industry Holdings, committed Kshs 48.0 bn towards the construction of five industries situated within the Naivasha Industrial Park, Mai Mahiu, Nakuru County. The project which is valued at Kshs 90.0 bn, was commissioned by President Uhuru Kenyatta in July 2022 during the official opening of the 1,000-acre Special Economic Zone (SEZ), and consists of six manufacturing industries set across 400 acres within the SEZ. For more information, see our Cytonn Weekly #16/2023,
- Improvon, a South African based logistics and industrial developer, announced ongoing expansion efforts to set up mini-warehouse units at Nairobi Gate Industrial Park in Northlands City, Ruiru. The facility targets medium-sized firms seeking specialized logistics solutions and already hosts two 5,000 SQM depots. For more information, see our Cytonn Weekly #15/2023, and,
- Logistics firm Mitchell Cotts Freights Kenya Limited, in partnership with two other logistics firms; Perishable Movements Kenya Limited and Fresh Handing Kenya Limited, unveiled a dry cargo and cold storage facilities worth Kshs 30.0 mn, within Jomo Kenyatta International Airport (JKIA). The cold storage occupies 1,943 SQM whereas the dry cargo storage will take up 4,174 SQM summing up to 7,609 SQM of total space occupied by the facilities in JKIA at the landslide of the air-cargo terminal. For more information, see Cytonn Weekly #02/2023 report.
We expect Kenya’s industrial sector to continue realizing growth and development activities supported by; i) the government's accelerated focus on exporting agricultural and horticultural products to the international market, with an aim to improve the quantity, quality, efficiency, and reliability of Kenya-farmed produce thereby increasing the country’s competitiveness, ii) increased commitment by both the private and public sectors in development of industrial parks, with the recent gazattement of Two Rivers Special Economic Zone (SEZ) in Kiambu County by Centum Investment, development of Olkaria Industrial Park in Nakuru County by Kenya Electricity Generating Company (KENGEN), and Dongo Kundu SEZ in Mombasa County by the Kenya Ports Authority in partnership with Japan International Cooperation Agency (JICA), iii) Kenya being recognized as a regional hub hence attracting investments, iv) increased demand for data centres by both the government and private-sector firms driven by continued increase in demand for data protection services with the Data Protection Act 2019 requiring personal data to be stored in servers or data centres located within Kenya’s borders, v) increased demand for cold storage facilities for drugs and vaccines whose demand is driven by the Universal Health Coverage program by the government and accelerated campaign in provision of better and cheaper health services by private and Non-Governmental health organisations, vi) increased focus by foreign companies in setting up production factories and storage facilities in efforts to localise sourcing of raw materials and production of goods at the back of depreciating value of the currency against foreign currencies that has drastically increased cost of importing inputs, vii) improvement of infrastructure such as the SGR project, the Eastern and Northern Bypasses connecting Jomo Kenyatta International Airport (JKIA) and other regions in NMA which are expected to increase the output of Special Economic Zones and Inland Container Depots (ICDs), and, viii) increased demand of e-commerce warehouses in the retail sector driven by the rising demand for space to store goods meant for delivery to clients across the country, as more people shift towards home delivery as a convenient and efficient way to purchase goods.
- Statutory Review
During the week, the Finance Bill 2023 was assented to law by President William Ruto into the Finance Act 2023 on 26 June 2023. The Act amends laws relating to various taxes and duties policies affecting the Real Estate sector in Kenya. This Effective 1 July 2023, the Third Schedule of The Income Tax Act paragraph 5 (ja) was amended to reduce the rate of Monthly Rental Income (MRI) tax to 7.5% from 10.0%. MRI tax is a deduction on the gross monthly rents collected by the residential property owners or their appointed property managers who handle the remittance of these amounts on behalf. rate has been reduced to boost the government’s revenue collection by encouraging tax compliance of residential property owners.
Additionally, the under the act, the Tax Procedures Act, 2015 was amended by inserting a new section 42(C), which assigns the Commissioner-General of the Kenya Revenue Authority powers to appoint withholding tax agents for the purpose of collection and remittance of rental income tax to the commissioner. The main objectives of this amendment is to; i) expand the government's capabilities of collecting revenue, ii) reduce loopholes of property owners who try to evade payment of the tax, iii) empower the Commissioner to bring landlords, whose rent is handled by estate agents, into the tax net, and, iv) provide the Commissioner with better oversight of transactions conducted through Real Estate property managers. Moreover, the Act amended Section 35 of the Income Tax Act by inserting new subsections immediately after subsection (3A), highlighting that the appointed tax agents will be given the authority to deduct rental income tax at a rate of 7.5% on gross rental income collected by the residential property owners or property managers who will be assigned to them. They shall as well remit the amount to the Commissioner, a return in writing suggesting the amount deducted, and any other information the Commissioner may deem necessary within five working days. Upon receipt of the tax, the Commissioner will be authorized to furnish certificates to individuals or companies who have remitted the withheld amounts, which shall state the amount of the rent and tax deducted from the rental income collected.
Upon implementation, we expect the policy will positively boost the Real Estate regulation taxation systems by the government through; i) encouraging more property owners to comply with their tax obligations through reduced MRI tax, ii) expanding government tax bases by bringing more property owners into the tax bracket and increasing its capabilities in collection of the required amounts, and, iii) increasing oversight and transparency through appointment of more withholding tax agents who will directly handle the collection and remittance of the tax amounts and issuance of remittance certificate by the commissioner. However, it is important to note that property owners will continue to experience increased financial burden due to the deduction of MRI tax at a rate of 7.5%, impacting on their profitability and efficiency of managing the properties. The appointment of tax agents and the associated reporting requirements will as well introduce additional administrative and financial burdens on the government, adding to its already demanding operational obligations from other institutions and debt repayment pressures. Additionally, the compliance with the regulations and timely submission of information and payments could pose challenges, especially for smaller landlords, or those without robust administrative systems in place, especially in the informal settlement setups.
Another key amendment in the Finance Act 2023 is to the Employment Act, 2007 which introduced sub clause 31B on creation of an Affordable Housing Levy, which is change from the Affordable Housing Fund previously contained in the proposed Finance Bill 2023. The levy will be a monthly mandatory deduction of 1.5% on gross monthly salary of every formal employee in both the private and public sectors in Kenya, with the respective employer matching the same amount in the contribution. Under the Act, employers are required to deduct the amounts from their employee(s) gross monthly salary and remit the amount together with the employer’s contribution within nine days from the end of the month in with the payment is due. The mandatory requirement also institutes a 2.0% penalty on the employers who will fail remit the total deducted amounts from them and their employees. The Act further specifies that the Affordable Housing Levy shall only be utilized in the development of affordable housing and supporting social and physical infrastructure which will also create conducive environment for the private sector to also deliver their affordable housing projects effectively. Whereas the initial bill proposed for the contributing members to access their funds after seven years of contribution, the change of name from a fund to a levy implies that the contribution will not be accessible to the contributing party for any other purpose and no returns will be available in any way whatsoever. The Act also does not specify any contribution limit based on the amount individuals are paid, unlike the previous Finance Bill which had set a maximum contribution of Kshs 5,000 from both employee and employer. This change is meant to bring about a sense of equality in the amounts contributed across he low-income, middle-income and high-income earning employees.
Key to note is that, according to Economic Survey 2023 by Kenya National Bureau of Statistics (KNBS), there are approximately 3.0 mn wage employees in the formal public and private sector. Additionally, as the end of 2022, the average monthly gross income for Kenyan wage employees in the formal public and private sector came in at Kshs 72,130. Therefore, with the proposed 1.5% deduction from gross income, the government expects to collect Kshs 1,082 from each employee and the same amount from the employer every month adding up to Kshs 2,164 from every individual and a total of Kshs 25,967 annually. Therefore, the government expects to collect up to Kshs 78.3 bn annually, which is set to increase onwards with regards to growth in the average monthly gross income and the wage employment annually.
Other notable highlights during H1’2023 included;
- The Finance Act 2022, became effective as of 1 January 2023, with the Capital Gains Tax (CGT) chargeable on net gains upon transfer of property tripling to 15.0% from the 5.0% previously chargeable. For more information, see Cytonn Weekly #01/2023 report.
We anticipate that both the national and county governments will continue to make adjustments to their legal policies and introduce new regulations to enhance transparency, efficiency, compliance, and increased transactions in the Real Estate sector. These efforts aim to strengthen Kenya's competitive advantage in the region for Real Estate investments. Furthermore, the recently assented Finance Act 2023 to law, is expected to stimulate activities in the residential sector such as; i) the government will have the much-needed capital to finance affordable housing projects across the country, aiming to address the significant housing deficit, which currently stands at around 80.0%, ii) incentives outlined in the act will also support the private sector's efforts to construct affordable housing units and price them within reach of Kenyan homeowners, iii) encouraging collaborations and partnerships between the government and private developers, further boosting the supply of affordable housing in the country, iv) generating employment opportunities, increase incomes of those in the construction sector and development, and overall economic growth of both individuals and the country as a whole, and, v) help reducing housing inequalities and improving social equity by bridging the gap between different income groups by providing housing options for low- and middle-income individuals and families
However, it is important to note that some provisions in the act, such as the deduction of amounts from the incomes of employees and employers without benefits or return, starting from 1 July, 2023, may have negative consequences. This, along with other increased taxable deductions, prevailing inflationary pressures, and a high cost of living, will reduce the disposable incomes of formal employees, employers in the private sector, and civil servants in the public sector. On the other hand, employers may resort to reduce the number of employees to help them maintain financial stability and adapt to the new financial obligations imposed by the deductions on their incomes. As a result, individuals may have limited to no funds available to pursue their homeownership goals or service their mortgage loans, which could impact investments in Real Estate. Additionally, there are some of the key concerns that the government has deliberately not addressed, which include;
- The Act does not explicitly address how the affordable houses will be allocated after being constructed using the levy, considering that the contributed funds will not be accessible to the contributors. It is not clear if the houses will be allocated to the contributors, the homeless, those in slums, or a loophole will be design for the senior government officials to take advantage of the program and allocate themselves the housing units,
- There is ambiguity in how the government will handle employers who pay their employees after the 9th of the following month, while the Act requires remittance of the levy before the 9th of the next month. This issue could create confusion and may require further clarification or guidelines from the government authorities, and,
- Regarding the government's role as an employer to civil servants, the Act does not provide information or any penalties on the consequences if the government defaults or fails to remit the deducted funds to the Affordable Housing Levy.
Therefore, there is need for supplementary regulations or provisions to address these and many more arising legality, constitutionality and compliance concerns and establish appropriate long-lasting frameworks.
Moreover, policies such as the new CGT rates may have negative effects on the attractiveness of Kenya's Real Estate sector, such as reduced property transaction volumes, limited investments due to increased merger and acquisition costs, and a slight decrease in foreign investments. With such, some investors may opt to shift their investments to other countries in the region with lower Capital Gains Tax (CGT) rates. Ultimately, the decision to raise the Value Added Tax (VAT) on petroleum products to 16.0% through the Finance Act 2023 is also expected to have a detrimental impact on the Real Estate sector, specifically in terms of increased construction costs. This increase in VAT will lead to a surge in the production costs of key construction inputs such cement, steel and paint as manufacturers will be compelled to pass on the burden of increased production expenses to their clients. Consequently, the overall cost of construction is expected to rise considerably. Additionally, the escalated prices of fuel products due to the VAT increase will result to higher transportation costs for construction materials to project sites, further adding to the overall cost burden faced by developers in investing in Real Estate projects.
- Regulated Real Estate Funds
- Real Estate Investment Trusts (REITs)
In the Nairobi Securities Exchange, ILAM Fahari I-REIT closed the week trading at an average price of Kshs 6.0 per share. The performance represented a 3.2% decline from Kshs 6.2 per share recorded the previous week, taking it to a 10.9% Year-to-Date (YTD) decline from Kshs 6.8 per share recorded on 3 January 2023. In addition, the performance represented a 69.8% Inception-to-Date (ITD) loss from the Kshs 20.0 price. The dividend yield currently stands at 10.8%. The graph below shows Fahari I-REIT’s performance from November 2015 to 30 June 2023;
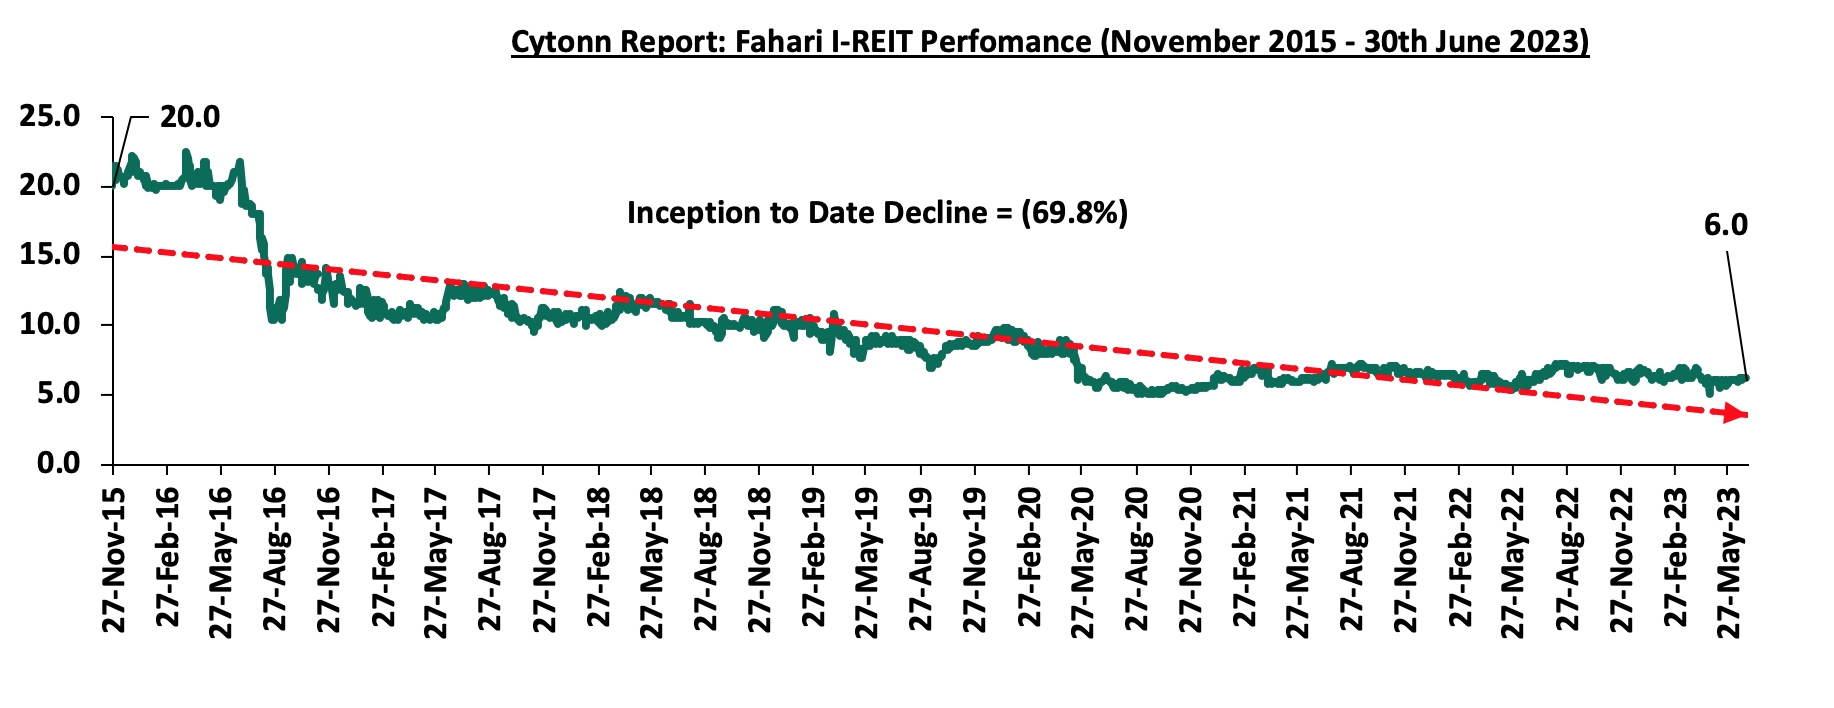
In the Unquoted Securities Platform, Acorn D-REIT and I-REIT traded at Kshs 23.9 and Kshs 21.6 per unit, respectively, as at 23 June 2023. The performance represented a 19.4% and 8.0% gain for the D-REIT and I-REIT, respectively, from the Kshs 20.0 inception price. The volumes traded for the D-REIT and I-REIT came in at 12.3 mn and 30.1 mn shares, respectively, with a turnover of Kshs 257.5 mn and Kshs 620.7 mn, respectively, since inception in February 2021.
Notable highlights during H1’2023 included;
- ILAM Fahari and Acorn Holdings released their FY’2022 financial results highlighting that both Acorn D-REIT and I-REIT recorded profits of Kshs 384.2 mn and Kshs 504.9 mn, respectively. Additionally, ILAM Fahari I-REIT recorded a significant improvement in performance with its net earnings for the period FY’2022 improving by 77.1% to a Kshs 28.4 mn loss, from the Kshs 124.0 mn loss recorded in FY’2021. For more information, see our Q1’2023 Markets Review,
- Local Authorities Pension Trust (LAPTRUST), the oldest pension scheme in Kenya, listed the LAPTRUST Imara I-REIT on the Nairobi Securities Exchange (NSE) at a bell-ringing ceremony officiated by President William Ruto. This comes four months after the Capital Markets Authority (CMA) announcedthe approval for the listing of the Imara I-REIT on the NSE's Main Investment Market, under the Restricted Sub-Segment. For more information see our Cytonn Weekly #12/2023 report, and,
- The Capital Markets Authority (CMA) in collaboration with the Sanduku Investment Initiative, the Association of Pension Trustees and Administrators of Kenya (APTAK) and the Nairobi Securities Exchange (NSE) announced ongoing plans to create a Kenya National REIT (KNR) as an accreditation body for REITs and their stakeholders within the Kenyan REITs market. For more information, see our Cytonn Weekly #06/2023 report.
The inclusion of LAPTRUST Imara I-REIT on the Nairobi Securities Exchange (NSE), the establishment of the Kenya National REIT (KNR), and the introduction of the Vuka Investment Platform towards the end of 2022 are expected to spur positive developments to the capital markets in Kenya. In addition to the existing REIT institutions, these initiatives provide numerous advantages, such as accessing additional capital pools, creating diversified portfolios, generating consistent and long-term returns, enjoying tax exemptions, ensuring transparency, promoting liquidity, and offering flexibility as an asset class. Despite these benefits and the gradual growth in the sector, REITs have struggled to achieve significant performance due to various obstacles such as; i) lack of sufficient investor awareness regarding the potential of REITs as an investment tool, ii) lengthy approval procedures for establishing REITs have hindered their formation and deployment in the market, iii) high minimum capital requirement of Kshs 100.0 mn for trustees which restricts the involvement of non-bank entities in the role of trustees, and, iv) steep minimum investment amount of Kshs 5.0 mn discourages potential investors from engaging in REITs.
- Cytonn High Yield Fund (CHYF)
Cytonn High Yield Fund (CHYF) closed the week with an annualized yield of 13.6% which was 0.1% point decline from 13.7% recorded the previous week. The performance also represented a 0.3% points Year-to-Date (YTD) decline from 13.9% yield recorded on 1 January 2023, and 2.1% points Inception-to-Date (ITD) loss from the 15.7% yield. The graph below shows Cytonn High Yield Fund’s performance from November 2019 to 30 June 2023;
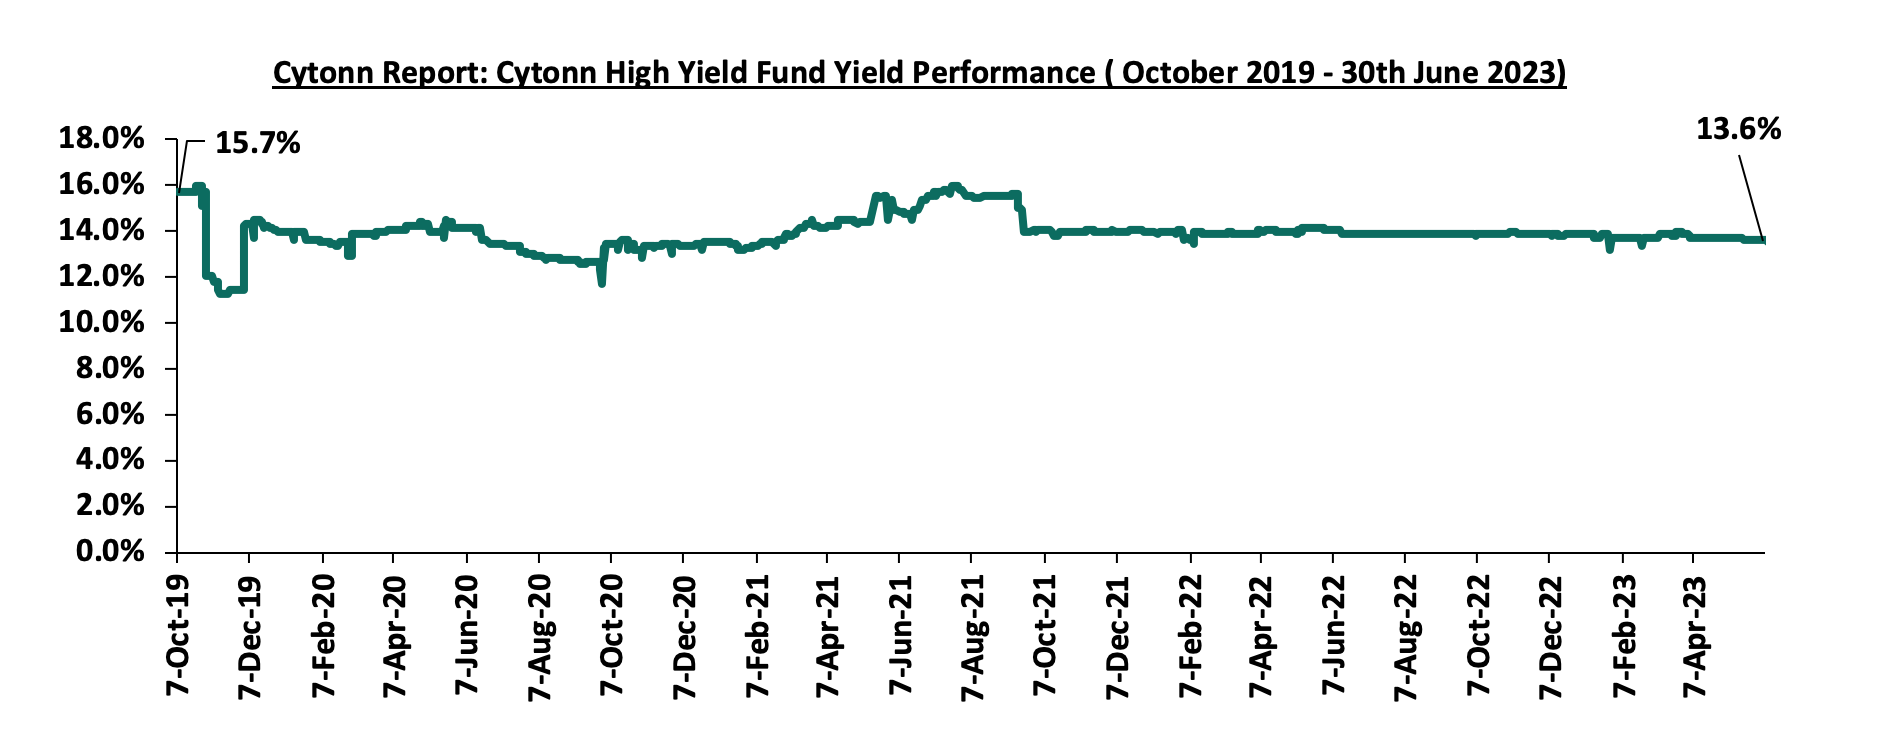
Notably, the CHYF has outperformed other regulated Real Estate funds with an annualized yield of 13.6%, as compared to Fahari I-REIT and Acorn I-REIT with yields of 10.8%, and 6.8% respectively. As such, the higher yields offered by CHYF makes the fund one of the best alternative investment resource in the Real Estate sector. The graph below shows the yield performance of the Regulated Real Estate Funds;
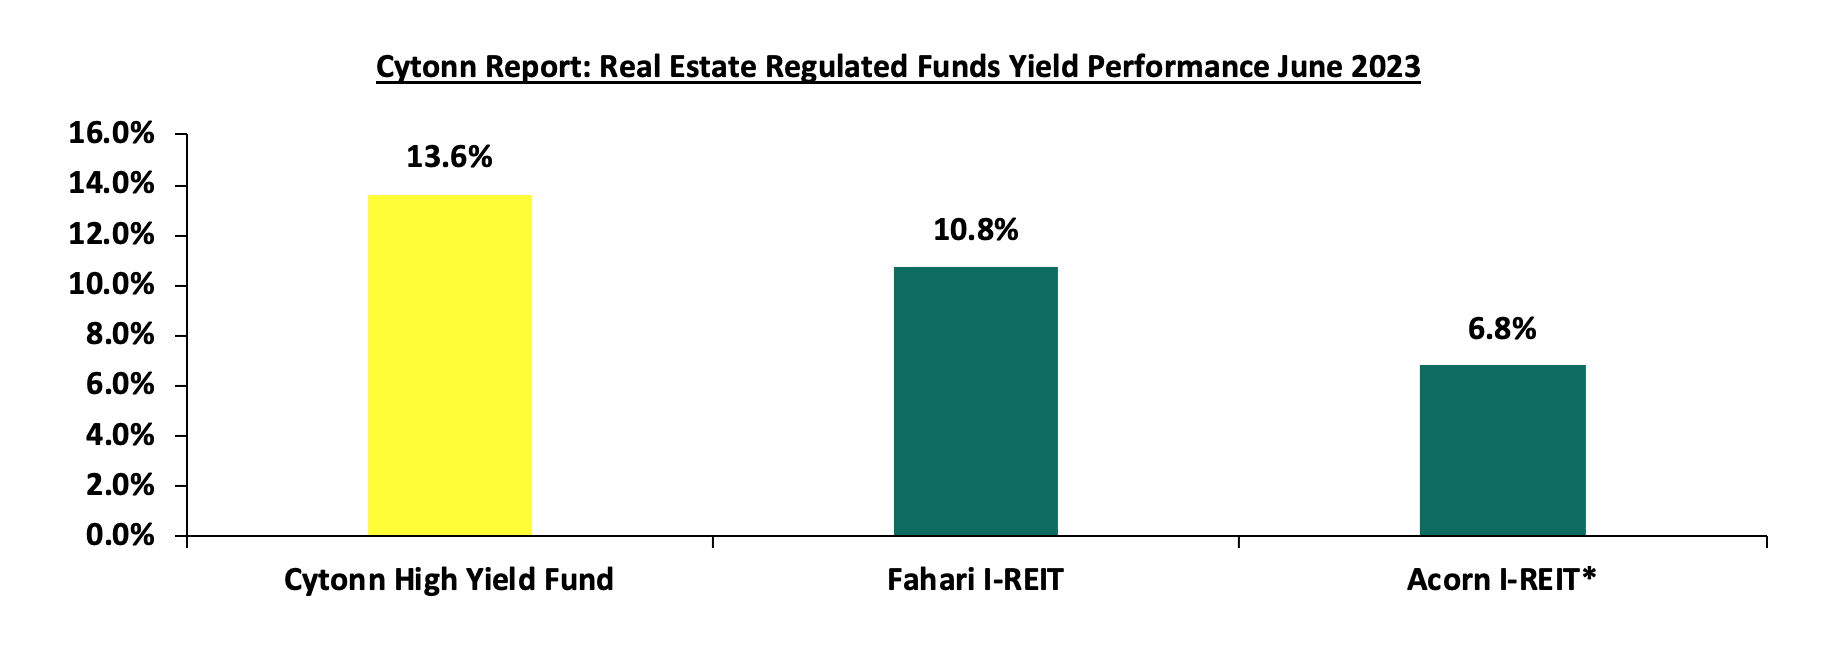
*FY’2022
Source: Cytonn Research
Real Estate Performance Summary and Outlook
Below is a summary of the sectorial performance in H1’2023 and investment opportunities:
|
Theme |
Cytonn Report: Thematic Performance and Outlook H1’2023 |
Outlook |
|
Residential |
· Apartments registered relatively higher average total returns to investors at 6.3% compared to detached markets at 5.8%, while prices recorded an uptick at 0.8% and 1.2% y/y appreciation, respectively, owing to continued property transactions amid continued investments in the sector |
Neutral |
|
· We expect continued increase in activity within the sector to boost performance in terms of improved rental rates and capital appreciation of properties · The investment opportunity for apartments lies in areas such as Ngong, South C and Ruiru which continued to post high returns. For detached units, opportunity lies in submarkets such as Ruiru, Rosslyn and Ngong which offer higher returns compared to the market averages |
||
|
Commercial Office |
· The commercial office sector recorded average rental yields of 7.8% in H1’2023, representing a 0.4% points y/y increase from 7.4% recorded in H1’2022 |
Neutral |
|
· We expect performance to be supported by gaining traction in co-working spaces, and, reduced developments in the pipeline which we expect will help curb the oversupply challenge. However, the existing oversupply of office spaces at 5.8 mn SQFT in the NMA is expected to weigh down optimum performance of the sector by stifling the overall demand for physical space · Investment opportunity lies in Karen, Gigiri, and Westlands which offer relatively high returns compared to the market average |
||
|
Retail |
· The retail sector recorded average rental yields of 8.2% in H1’2023, representing a 0.4% points y/y increase from 7.8% recorded in H1’2022 |
Neutral |
|
· We expect performance to be mainly supported by the positive demographics, rapid expansion drive by local and international retailers, and, increased infrastructure development enhancing accessibility. However, e-commerce still being adopted by some retailers, ongoing closure of retail spaces by exiting retailers, and the existing oversupply of retail spaces in the market by approximately 3.0 mn SQFT, are expected to weigh down the overall performance of the sector · Investment opportunity In terms of the sub markets performance lies in Kilimani, Karen, and Westlands which offer higher returns compared to the market average |
||
|
Hospitality |
· We expect performance to be supported by gaining traction in co-working spaces, and, reduced developments in the pipeline which we expect will help curb the oversupply challenge. However, the existing oversupply of office spaces at 5.8 mn SQFT in the NMA is expected to weigh down optimum performance of the sector by stifling the overall demand for physical space |
Neutral |
|
• The hospitality sector has been on a recovery path following increased international arrivals boosting tourism, and, improved hotel operations, bookings and occupancies · This is attributed to factors such as; i) intensive and ambitious marketing of Kenya’s tourism market by the Ministry of Tourism, in collaboration with the Kenya Tourism Board, through platforms such as Magical Kenya towards targeting emerging and established source markets, ii) concerted efforts to promote local tourism, iii) increased corporate and business Meetings, Incentives, Conferences and Events (MICE) from both the public and private sectors owing to the revamping of the economy during the post-COVID-19 and electioneering periods, and, iv) increased leisure and sporting activities with the hosting of annual rally competition in Naivasha until 2026 |
||
|
Land |
• The average selling prices for land in the Nairobi Metropolitan Area (NMA) recorded an overall improvement in performance in H1’2023, with the y/y average capital appreciation coming in at 4.5%. Additionally, average prices per acre in the NMA came in at Kshs 128.5 mn in H1’2023, from Kshs 128.4 mn recorded in H1’2022 · Un-serviced land prices in satellite towns realized the highest y/y capital appreciation at 9.1% |
Positive |
|
· We expect that the sector's performance will be propelled by several key factors; i) heightened demand for land for development facilitated by positive population demographics, ii) ongoing efforts by the government to streamline land transactions creating a more efficient and accessible market. iii) notable increase in the initiation and completion of affordable housing projects owing to both government and private sector involvement, and, iv) rapid expansion of satellite towns, accompanied by substantial infrastructural developments resulting in elevated property prices. |
||
|
Listed Real Estate |
· The Fahari I-REIT closed the H1’2023 trading at Kshs 6.0, representing a 3.2% Year-to-Date (YTD) decline per having opened the year trading at Kshs 6.8 per share. In addition, the performance represented a 69.8% Inception-to-Date (ITD) loss from the Kshs 20.0 price. The dividend yield currently stands at 10.8% |
Negative |
Disclaimer: The views expressed in this publication are those of the writers where particulars are not warranted. This publication, which is in compliance with Section 2 of the Capital Markets Authority Act Cap 485A, is meant for general information only and is not a warranty, representation, advice or solicitation of any nature. Readers are advised in all circumstances to seek the advice of a registered investment advisor.

- Talk to us
- Kenya
- P.O Box 20695 - 00200, Nairobi, Kenya
- Cell +254709101200
- Tel +254709101200
- WhatsApp +254741676635
- United States
- +254709101200
- DOWNLOAD OUR APP
-


- Kenya
- 8th Floor, Pinetree Plaza, Kaburu Drive, Ngong Road, Nairobi, Kenya
- USA
- Suite 1150, 1775 Eye Street NW, USA, Washington DC 20006, USA
- Investments
- High Yield
- Private Equity
- Real Estate
- Real Estate
- RiverRun Estates
- Cytonn Towers
- The Ridge
- Taraji Heights
- The Alma