Nairobi Metropolitan Area Residential Sector Q3'2021 Markets Review Note
By Research Team, Oct 10, 2021
For detached units, the top markets were Ngong, Syokimau/Mlolongo, Karen and Kitengela, and for apartments, the top markets were Dagoretti, South C and South B.
During Q3’2021, the residential sector recorded improved performance from increased activities supported by; i) the continued focus on the affordable housing initiative by the government, ii) availability of relatively affordable mortgages through the Kenya Mortgage Refinance Company (KMRC) and select lending institutions working in conjunction with developers to offer mortgage financing to a diverse number of clients with flexible repayment terms, iii) increased transactional volumes among buyers signifying a rise of investor confidence into the property market, and, iv) continued activities in the student housing sector.
In terms of performance, the residential sector recorded improved performance with a 0.7% points y/y increase in average total returns to 5.5% from the 4.8% recorded in Q3’2020. The average total returns remained flat compared to H1’2021 which also recorded an average total return of 5.5%. The average y/y price appreciation came in at 0.7% representing a 0.8% points increase from the 0.1% average price correction recorded in Q3’2020. The average rental yield in Q3’2021 was 4.8% compared to 4.9% recorded in Q3’2020 indicating a 0.1% points decline as landlords continued to lower asking rents marginally in order to maintain and lure more occupants and offset the effects of Covid-19 pandemic on real estate investment income.
The graph below shows the performance summary of average rental yields in the last five years;
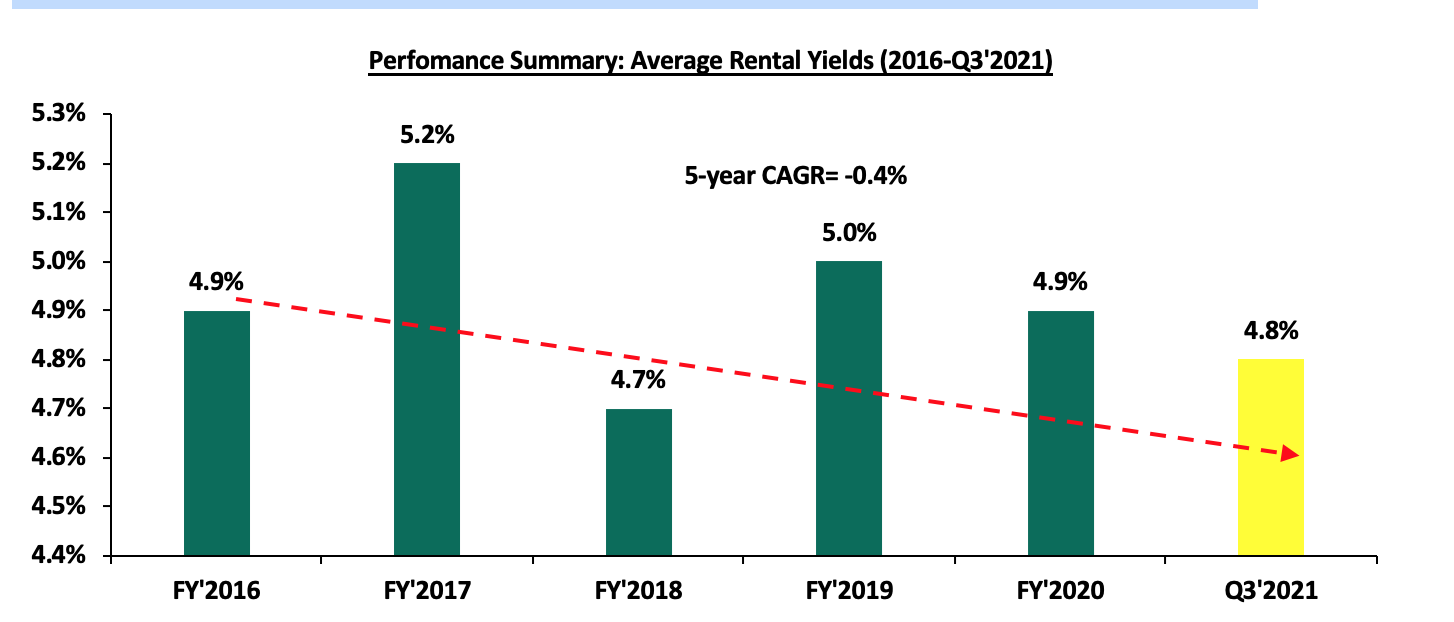
Source: Cytonn Research
A. Detached Units Performance
In Q3’2021, detached units recorded an improved y/y performance with average total returns coming in at 4.8% compared to 4.2% in Q3’2020. However, the performance was a 0.6% points q/q decline from the 5.4% total return recorded in H1’2021. The average rental yield came in at 4.2% while the average y/y price appreciation was 0.6%.
|
Segment |
Average of Rental Yield Q3'2021 |
Average of Price Appreciation Q3'2021 |
Average of Total Returns Q3'2021 |
Average of Rental Yield Q3'2020 |
Average of Price Appreciation Q3'2020 |
Average of Total Returns Q3'2020 |
y/y change in Rental Yield (% points) |
y/y change in Price Appreciation (% points) |
y/y change in Total Returns (% points) |
|
Detached Units |
|||||||||
|
High End |
3.7% |
0.2% |
3.9% |
3.7% |
0.0% |
3.7% |
0.1% |
0.1% |
0.2% |
|
Upper Mid-End |
4.5% |
0.2% |
4.7% |
4.7% |
0.2% |
4.9% |
(0.2%) |
0.1% |
(0.1%) |
|
Satellite Towns |
4.5% |
1.5% |
6.0% |
4.3% |
(0.4%) |
3.9% |
0.1% |
1.9% |
2.0% |
|
Detached Average |
4.2% |
0.6% |
4.8% |
4.2% |
(0.1%) |
4.2% |
0.0% |
0.7% |
0.6% |
Source: Cytonn Research 2021
Satellite towns were the best performing segment with an average total return of 6.0% attributable to an average rental yield of 4.5% and a 1.5% y/y price appreciation compared to the high end and upper mid-end segments with average total returns at 3.9% and 4.7%, respectively. The overall best performing node was Ngong with an average total return of 7.1% attributable to a relatively high average rental yield of 5.3%. Syokimau came in second with an average total return at 6.6% while Karen and Kitengela tied in third position with a total return 5.9%. Runda was the lowest performing node with an average total return of 1.3%, 3.5% points lower than the detached market average of 4.8%.
(All values in Kshs unless stated otherwise)
|
Detached Units Performance |
||||||||
|
Area |
Average of Price per SQM Q3'2021 |
Average of Rent per SQM Q3'2021 |
Average of Occupancy Q3'2021 |
Average of Uptake Q3'2021 |
Average of Annual Uptake Q3'2021 |
Average of Rental Yield Q3'2021 |
Average of Price Appreciation Q3'2021 |
Average of Total Returns Q3’2021 |
|
High-End |
||||||||
|
Karen |
204,668 |
714 |
84.9% |
90.4% |
16.7% |
3.5% |
2.4% |
5.9% |
|
Rosslyn |
173,402 |
880 |
77.3% |
93.1% |
14.5% |
4.5% |
0.9% |
5.4% |
|
Lower Kabete |
152,536 |
433 |
85.0% |
87.6% |
18.3% |
2.9% |
1.0% |
3.9% |
|
Kitisuru |
214,795 |
625 |
92.4% |
92.6% |
15.4% |
3.6% |
(0.6%) |
3.0% |
|
Runda |
241,080 |
820 |
95.0% |
97.0% |
11.1% |
4.2% |
(2.9%) |
1.3% |
|
Average |
197,296 |
694 |
86.9% |
92.1% |
15.2% |
3.7% |
0.2% |
3.9% |
|
Upper Mid-End |
||||||||
|
Lavington |
175,804 |
621 |
88.1% |
81.5% |
11.8% |
3.7% |
2.0% |
5.7% |
|
Ridgeways |
149,153 |
761 |
87.9% |
87.8% |
13.4% |
5.4% |
(0.4%) |
5.0% |
|
South B/C |
119,452 |
336 |
83.8% |
87.6% |
14.1% |
2.9% |
2.1% |
5.0% |
|
Loresho |
144,180 |
725 |
93.3% |
93.3% |
13.3% |
5.4% |
(0.8%) |
4.6% |
|
Langata |
136,381 |
660 |
92.6% |
93.6% |
11.7% |
5.2% |
(1.9%) |
3.3% |
|
Average |
144,994 |
620 |
89.1% |
88.8% |
12.9% |
4.5% |
0.2% |
4.7% |
|
Lower Mid-End |
||||||||
|
Ngong |
59,487 |
298 |
86.0% |
89.1% |
13.4% |
5.3% |
1.8% |
7.1% |
|
Syokimau/Mlolongo |
75,778 |
360 |
86.7% |
88.3% |
17.9% |
5.0% |
1.6% |
6.6% |
|
Kitengela |
71,019 |
319 |
81.6% |
89.1% |
15.1% |
4.2% |
1.7% |
5.9% |
|
Athi River |
74,863 |
319 |
78.2% |
99.5% |
21.7% |
4.0% |
1.7% |
5.7% |
|
Ruiru |
79,138 |
336 |
87.7% |
84.7% |
23.1% |
5.1% |
0.5% |
5.7% |
|
Rongai |
86,356 |
233 |
90.2% |
80.3% |
14.1% |
3.2% |
1.7% |
4.8% |
|
Average |
74,440 |
311 |
85.1% |
88.5% |
17.6% |
4.5% |
1.5% |
6.0% |
Source: Cytonn Research 2021
B. Apartments Performance
In Q3’2021, apartments recorded a significant improvement in performance with the average total returns coming in at 6.1%, a 0.7% points y/y increase from the 5.4% recorded in Q3’2020, and 0.5% points q/q increase from 5.6% recorded in H1’2021. The average y/y price appreciation came in at 0.8% compared to a price correction of 0.1% in Q3’2020, while the average rental yield came in at 5.3%, a 0.2% points decline compared to 5.5% recorded during a similar period last year.
|
Segment |
Average of Rental Yield Q3'2021 |
Average of Price Appreciation Q3'2021 |
Average of Total Returns Q3'2021 |
Average of Rental Yield Q3'2020 |
Average of Price Appreciation Q3'2020 |
Average of Total Returns Q3'2020 |
y/y change in Rental Yield (% points) |
y/y change in Price Appreciation (% points) |
y/y change in Total Returns (% points) |
|
Apartments |
|||||||||
|
Upper Mid-End |
5.2% |
0.9% |
6.2% |
5.1% |
(0.3%) |
4.7% |
0.1% |
1.3% |
1.4% |
|
Lower Mid-End Suburbs |
5.3% |
0.8% |
6.1% |
5.7% |
0.1% |
5.8% |
(0.4%) |
0.7% |
0.3% |
|
Satellite Towns |
5.3% |
0.5% |
5.8% |
5.6% |
0.0% |
5.7% |
(0.3%) |
0.5% |
0.1% |
|
Apartments Average |
5.3% |
0.8% |
6.1% |
5.5% |
(0.1%) |
5.4% |
(0.2%) |
0.9% |
0.6% |
Source: Cytonn Research 2021
In terms of segments, the upper mid-end segment was the best performing, with an average total return of 6.2% attributable to an average rental yield of 5.2% and an average y/y price appreciation of 0.9%. This was followed closely by the lower mid-end suburbs and satellite towns with an average total return of 6.1% and 5.8%, respectively. Overall, Dagoretti was the best performing node with an average total return of 8.6% while South C and South B followed with average total returns at 8.2% and 7.8%, respectively. Loresho was the lowest performing node with an average total return of 2.3% attributable to a relatively low average rental yield of 4.6% and an average y/y price correction of 2.3%.
(All values in Kshs unless stated otherwise)
|
Apartments Performance |
||||||||
|
Area |
Average of Price per SQM Q3'2021 |
Average of Rent per SQM Q3'2021 |
Average of Occupancy Q3'2021 |
Average of Uptake Q3'2021 |
Average of Annual Uptake Q3'2021 |
Average of Rental Yield Q3'2021 |
Average of Price Appreciation Q3’2021 |
Average of Total Returns Q3’2021 |
|
Upper Mid-End |
||||||||
|
Westlands |
145,951 |
833 |
70.0% |
92.3% |
27.9% |
4.6% |
3.0% |
7.6% |
|
Upperhill |
143,085 |
868 |
79.3% |
85.8% |
11.8% |
5.5% |
1.5% |
7.0% |
|
Kilimani |
107,179 |
594 |
85.7% |
91.3% |
23.9% |
5.7% |
1.2% |
6.9% |
|
Parklands |
117,893 |
616 |
77.3% |
87.6% |
20.7% |
4.6% |
1.9% |
6.6% |
|
Kileleshwa |
131,915 |
754 |
89.8% |
83.2% |
16.8% |
6.3% |
0.3% |
6.6% |
|
Loresho |
119,778 |
514 |
89.3% |
88.5% |
10.4% |
4.6% |
(2.3%) |
2.3% |
|
Average |
127,634 |
696 |
81.9% |
88.1% |
18.6% |
5.2% |
0.9% |
6.2% |
|
Lower Mid-End Suburbs |
||||||||
|
Dagoretti |
87,004 |
554 |
82.2% |
95.7% |
20.9% |
6.1% |
2.5% |
8.6% |
|
South C |
110,586 |
721 |
87.0% |
62.6% |
15.0% |
6.8% |
1.4% |
8.2% |
|
South B |
95,063 |
503 |
90.3% |
94.6% |
19.0% |
5.8% |
2.0% |
7.8% |
|
Langata |
114,187 |
491 |
89.9% |
85.7% |
15.4% |
4.7% |
2.2% |
6.9% |
|
Waiyaki Way |
84,604 |
480 |
76.7% |
79.0% |
19.9% |
5.2% |
1.5% |
6.7% |
|
Kahawa West |
77,057 |
333 |
74.5% |
86.3% |
10.2% |
4.0% |
2.2% |
6.2% |
|
Donholm & Komarock |
71,971 |
327 |
92.8% |
88.7% |
13.8% |
5.1% |
0.5% |
5.7% |
|
Imara Daima |
82,690 |
423 |
77.8% |
82.0% |
12.8% |
5.0% |
(0.7%) |
4.3% |
|
Race Course/Lenana |
98,784 |
615 |
77.3% |
84.7% |
23.6% |
5.6% |
(1.5%) |
4.0% |
|
Lower Kabete |
109,863 |
493 |
84.0% |
84.4% |
24.4% |
4.7% |
(1.9%) |
2.9% |
|
Average |
93,181 |
494 |
83.3% |
84.4% |
17.5% |
5.3% |
0.8% |
6.1% |
|
Lower Mid-End Satellite Towns |
||||||||
|
Rongai |
97,664 |
344 |
86.5% |
89.3% |
19.6% |
5.6% |
2.1% |
7.7% |
|
Thindigua |
94,549 |
468 |
80.5% |
88.8% |
21.1% |
5.1% |
2.3% |
7.4% |
|
Kikuyu |
82,114 |
460 |
74.8% |
82.4% |
18.3% |
5.0% |
2.3% |
7.4% |
|
Ngong |
63,446 |
346 |
73.7% |
74.5% |
12.2% |
5.0% |
2.1% |
7.1% |
|
Ruaka |
107,629 |
522 |
92.4% |
84.1% |
23.8% |
5.5% |
1.1% |
6.6% |
|
Ruiru |
89,249 |
493 |
84.3% |
82.1% |
20.7% |
5.6% |
0.5% |
6.1% |
|
Syokimau |
64,953 |
334 |
84.2% |
81.3% |
11.9% |
5.5% |
(1.8%) |
3.7% |
|
Kitengela |
59,394 |
242 |
93.0% |
83.1% |
10.0% |
4.7% |
(1.3%) |
3.4% |
|
Athi River |
58,769 |
353 |
70.0% |
89.0% |
10.9% |
5.7% |
(2.7%) |
3.0% |
|
Average |
79,752 |
396 |
82.2% |
83.8% |
16.5% |
5.3% |
0.5% |
5.8% |
Source: Cytonn Research 2021
Our outlook for the residential sector is NEUTRAL as we expect the sector to continue recording increased activities supported by the affordable housing initiative, and availability of affordable mortgages through the Kenya Mortgage Refinance Company (KMRC) and lending institutions such as banks and SACCOs working in conjunction with developers to a diverse number of clients with flexible repayment terms. However, the sector continues to be weighed down by factors such as; i) the sluggishness in the affordable housing initiative since we are yet to see a significant number of the targeted 500,000 units by 2022 availed, ii) low mortgage uptake from the high interest rates and the increase in the sector non-performing loans, iii) under-developed capital markets making it hard to develop pools of capital focused on housing development or mortgage financing, and, iv) high property prices in the midst of a tough economic environment. Investment opportunity for detached units lie in Ngong, Syokimau, Karen and Kitengela and for apartments, the top markets were Dagoretti, South C and South B which posted highest total returns.
For more information, please see our Cytonn Q3’2021 Markets Review.

- Talk to us
- Kenya
- P.O Box 20695 - 00200, Nairobi, Kenya
- Cell +254709101200
- Tel +254709101200
- WhatsApp +254741676635
- United States
- +254709101200
- DOWNLOAD OUR APP
-


- Kenya
- 8th Floor, Pinetree Plaza, Kaburu Drive, Ngong Road, Nairobi, Kenya
- USA
- Suite 1150, 1775 Eye Street NW, USA, Washington DC 20006, USA
- Investments
- High Yield
- Private Equity
- Real Estate
- Real Estate
- RiverRun Estates
- Cytonn Towers
- The Ridge
- Taraji Heights
- The Alma