Cytonn Q3’2021 Markets Review
By Research Team, Oct 3, 2021
Executive Summary
Global Markets Review:
According to the July 2021 World Economic Outlook Report by the International Monetary Fund (IMF), the global economy is projected to expand by 6.0% in 2021, unchanged from the April 2021 projections. IMF projects that the new COVID-19 variants as well as the slow vaccine distribution continue to pose a risk on the global economic recovery. Advanced Economies are projected to expand by 5.6%, while Developing and Emerging Markets are projected to expand by 6.3% in 2021;
Sub-Saharan Africa Regional Review
The International Monetary Fund (IMF) projects that the Sub-Saharan GDP growth rate for 2021 will come in at 3.4%, unchanged from their earlier projections in April. The region’s growth will largely be supported by the improved global control of the COVID-19 pandemic as well as the improved business conditions. However, SSA remains prone to a third wave of the pandemic given the resurgence in the number of infections and rising COVID-19 death tolls in some countries;
The select currencies recorded mixed performance against the US Dollar with the Zambian Kwacha being the largest gainer YTD, gaining by 20.6% against the dollar, while the Nigerian Naira was the largest decliner, depreciating by 7.7% YTD. During the third quarter of 2021, Africa’s appetite for foreign-denominated debt continued, with the latest issue being from Nigeria, which raised a total of USD 4.0 bn;
Kenya Macroeconomic Review
According to the 2021 Economic Survey Report by the Kenya National Bureau of Statistics (KNBS), the Kenyan economy contracted by 0.3% in 2020, from the restated 5.0% growth recorded in 2019 due to the lockdowns following the emergence of the COVID-19 pandemic. Economic growth for Kenya is expected to rebound in 2021, with the IMF projecting a 7.6% growth while the National Treasury projects a 6.2% growth. The average inflation rate for Q3’2021 increased to 6.7%, compared to 6.0% in Q2’2021 and 4.3% in Q3’2020. The increase is attributable to the sharp increase in food and fuel prices with super petrol, diesel and kerosene prices increasing by 5.9%, 7.3% and 12.1%, respectively in September, 2021;
Fixed Income
During the third quarter of 2021, T-bills were undersubscribed, with the overall subscription rate coming in at 87.8%, down from 115.3% recorded in Q2’2021, as investors shifted their interest to the bond market in search for higher yields. The average yields for the 364-day, 182-day and 91-day papers declined to 7.6%, 7.1% and 6.7% in Q3’2021, from 9.0%, 7.8% and 6.9%, respectively, recorded in Q2’2021. The secondary bond market recorded increased activity, with the turnover increasing by 11.5% to Kshs 289.2 bn, from Kshs 259.4 bn in Q2’2021;
During the week, T-bills remained undersubscribed, with the overall subscription rate coming in at 42.2%, a marginal decline from 42.3% recorded the previous week. The 91-day paper recorded the highest subscription rate, receiving bids worth Kshs 2.6 bn against the offered Kshs 4.0 bn, translating to a subscription rate of 66.0%, a decrease from 119.8% recorded the previous week. The subscription rate for the 182-day and the 364-day papers increased to 53.4% and 21.6%, from 46.7% and 7.0%, respectively, recorded the previous week. The yields on the 91-day and 364-day papers increased by 0.9 bps and 5.9 bps, to 6.9% and 7.9%, respectively, while the yield on the 182-day paper remained unchanged at 7.3%. The government accepted Kshs 9.6 bn out of the 10.1 bn bids received, translating to an acceptance rate of 94.9%;
Equities
During Q3’2021, the equities market was on an upward trajectory, with NASI, NSE 20 and NSE 25 gaining by 2.8%, 3.8% and 5.4%, respectively. The equities market performance during the quarter was driven by gains recorded by large cap stocks such as Equity Group, KCB, Bamburi and ABSA Bank, which gained by 13.4%, 9.6%, 6.7% and 6.4%, respectively. The gains were however weighed down by losses recorded by other large cap stocks such as EABL and Cooperative Bank, which declined by 5.5% and 3.3%, respectively. During the third quarter of 2021, listed banks in Kenya released their H1’2021 results, recording an increase in their earnings growth, with their average core Earnings per share (EPS) recording a weighted average growth of 136.0%, compared to a weighted average decline of 33.6% in H1’2020. The performance is however largely skewed by the strong EPS growth from ABSA, KCB and Equity Group of 846.0%, 101.9% and 97.7%, respectively;
Real Estate
The real estate sector performance generally improved in Q3’2021 attributable to the continued reopening of the economy. In the Nairobi Metropolitan Area (NMA), the residential sector recorded improved performance with a 0.7% points y/y increase in average total returns to 5.5% from the 4.8% recorded in Q3’2020. The commercial office sector recorded average rental yields of 6.9%, representing a 0.1% points decline from 7.0% recorded in FY’2020, and 0.3% points y/y decline from 7.2% recorded in Q3’2020. The retail market recorded average rental yields of 7.5%, similar to FY’2020. Land sector recorded an average annualized capital appreciation of 1.7% in Q3’2021, with land prices in the satellite towns realizing the highest capital appreciation at 4.5% as a result of the availability and affordability of land in the areas at Kshs 13.3 mn per acre against the market average of Kshs 134.6 mn per acre thereby leading to increased demand as well.
Investment Updates:
- Weekly Rates:
- Cytonn Money Market Fund closed the week at a yield of 10.62%. To invest, just dial *809#;
- Cytonn High Yield Fund closed the week at a yield of 13.98% p.a. To invest, email us at sales@cytonn.com and to withdraw the interest you just dial *809#;
- We continue to offer Wealth Management Training Monday through Saturday, from 9:00 am to 11:00 am, through our Cytonn Foundation. The training aims to grow financial literacy among the general public. To register for any of our Wealth Management Trainings, click here;
- If interested in our Private Wealth Management Training for your employees or investment group, please get in touch with us through wmt@cytonn.com;
- As of 1st of September 2021, Cytonn CHYS and CPN Investors have converted Kshs 2.5 billion of their investment funds from the two illiquid funds into real estate, translating to a 20.0% resolution of the debt owed by the two funds. For more information, please see the Cytonn CHYS and CPN Conversion 2.5 bn Real Estate article;
- Any CHYS and CPN investors still looking to convert is welcome to consider one of the five projects currently available for conversion, click here for the latest conversion term sheet;
- Cytonn Insurance Agency acts as an intermediary for those looking to secure their assets and loved ones’ future through insurance namely; Motor, Medical, Life, Property, WIBA, Credit and Fire and Burglary insurance covers. For assistance, get in touch with us through insuranceagency@cytonn.com;
- Cytonnaire Savings and Credit Co-operative Society Limited (SACCO) provides a savings and investments avenue to help you in your financial planning journey. To enjoy competitive investment returns, kindly get in touch with us through clientservices@cytonn.com;
Real Estate Updates:
- For an exclusive tour of Cytonn’s real estate developments, visit: Sharp Investor's Tour, and for more information, email us at sales@cytonn.com;
- Phase 3 of The Alma is now ready for occupation. To rent please email properties@cytonn.com;
- We have 8 investment-ready projects, offering attractive development and buyer targeted returns; See further details here: Summary of Investment-ready Projects;
- For recent news about the group, see our news section here;
Hospitality Updates:
- We currently have promotions for Staycations. Visit cysuites.com/offers for details or email us at sales@cysuites.com;
- Share a meal with a friend during the Sunday Brunch at The Hive Restaurant at Cysuites Hotel and Apartment. Every Sunday from 11.00 AM to 4.00 PM at a price of Kshs 2,500 for Adults and Kshs 1,500 for children under 12 years;
Introduction
According to the July 2021 World Economic Outlook Report by the International Monetary Fund (IMF), the global economy is projected to expand by 6.0% in 2021, unchanged from the April 2021 projections. IMF projects that the new COVID-19 variants as well as the slow vaccine distribution continue to pose a risk on the global economic recovery. Advanced Economies are projected to expand by 5.6%, while Developing and Emerging Markets are projected to expand by 6.3% in 2021. The recovery of the Advanced Economies has been revised up to 5.6% from 5.1% due to the continued expected fiscal support especially in the US while that of the Developing and Emerging Markets has been revised downwards from 6.7% to 6.3% due to the lower speed of the vaccine rollout. Close to 40.0% of the population in advanced economies has been vaccinated, compared to less than 20.0% of the Developing and Emerging economies’ population. Some of the key challenges facing global growth include; increase in food prices, increasing energy prices, supply shortages and logistical bottlenecks, and, currency volatility.
Commodity Prices:
Global commodity prices registered a mixed performance, with the prices for energy and fertilizers increasing by 84.2% and 76.8% respectively, in Q3’2021, driven by the mismatch of supply and demand. The prices of precious metals however registered muted growth during the quarter, as investors participated in other attractive asset classes like long-term bonds. Below is a summary performance of various commodities:
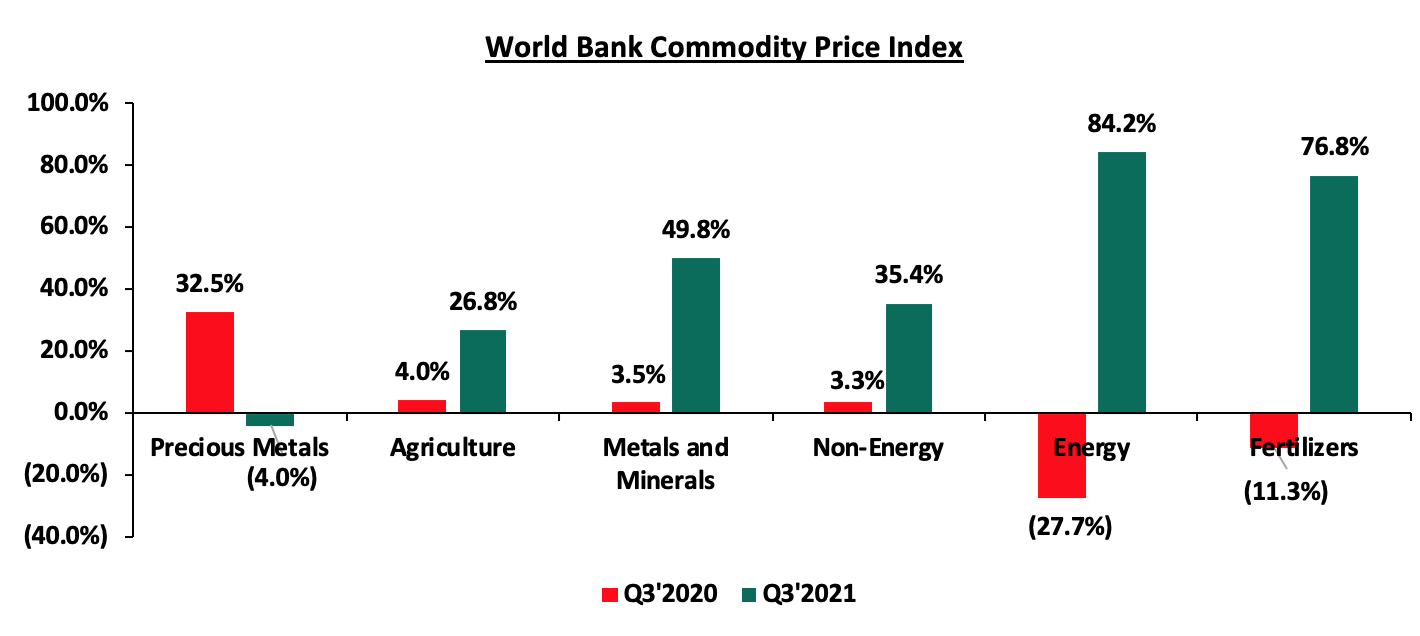
Source: World Bank
The Stock Markets Performance
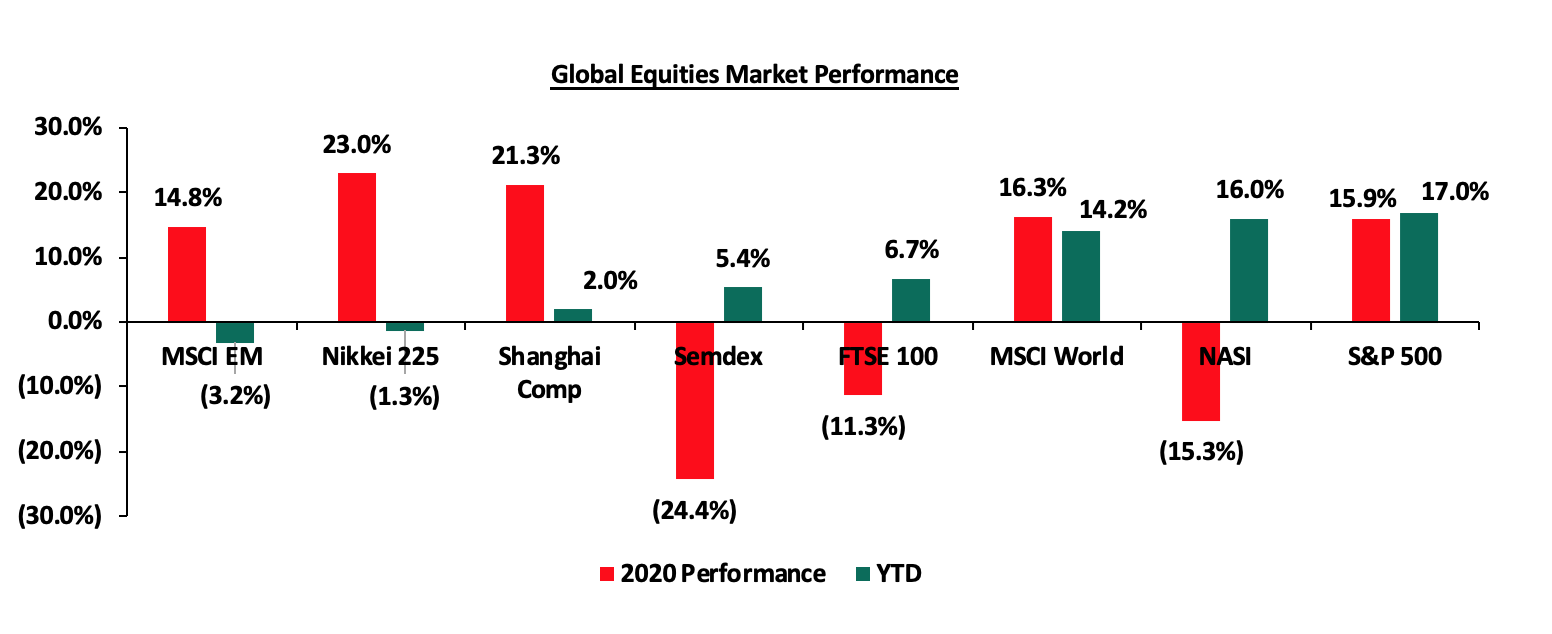
Global stock markets recorded mixed performance in Q3’2021, with most of the markets recording positive returns, attributable to the improved investor confidence in the stock markets. The S&P 500 index was largest gainer, recording a 17.0% year to date gain as at 30th September, while the MSCI EM index was the worst-performing index with losses of 3.2% YTD. Below is a summary of the performance of key indices:
According to the International Monetary Fund (IMF), the Sub Saharan economy is projected to grow at a rate of 3.4% in 2021, a significant improvement from the 1.8% contraction recorded in 2020. This projection comes on the back of the increased rollout of vaccines in the region which has resulted to most countries re-opening their economies. However, SSA remains prone to a third wave of the pandemic, given the resurgence in the number of infections and the rising COVID-19 death tolls in some countries.
Currency Performance
In the third quarter of 2021, we have seen most Sub-Saharan currencies depreciate against the US Dollar with Nigerian Naira being the largest loser, losing 7.7% on YTD. The Zambian kwacha registered significant recovering gaining by 20.6% compared to the 42.2% depreciation recorded in Q3’2020. The strong performance of the Kwacha is mainly attributable to the strong recovery in global copper prices which led to improved foreign exchange flows from the mining sector. The Malawian Kwacha is the largest decliner over the last twelve months, having lost 9.6%, attributable to changes in government policy including the removal of currency swap mechanisms which had previously held the Kwacha steady in times of low foreign exchange reserves. Going forward, the increase in commodity prices will see commodity driven economies perform better due to increased dollar inflows from the higher prices which will support their currencies.
Below is a table showing the performance of select African currencies:
|
Select Sub Saharan Africa Currency Performance vs USD |
|||||
|
Currency |
Sep-20 |
Dec-20 |
Sep-21 |
Last 12 Months change (%) |
YTD change (%) |
|
Zambian Kwacha |
20.0 |
21.1 |
16.7 |
16.3% |
20.6% |
|
Ugandan Shilling |
3,712.0 |
3,647.0 |
3,543.6 |
4.5% |
2.8% |
|
Tanzanian Shilling |
2,315.0 |
2,314.0 |
2,303.9 |
0.5% |
0.4% |
|
Kenyan Shilling |
108.4 |
109.2 |
110.5 |
(2.0%) |
(1.2%) |
|
South African Rand |
16.7 |
14.7 |
15.0 |
10.1% |
(2.2%) |
|
Ghanaian Cedi |
5.7 |
5.8 |
6.0 |
(6.0%) |
(4.2%) |
|
Botswana Pula |
11.7 |
10.8 |
11.3 |
3.3% |
(4.8%) |
|
Malawian Kwacha |
743.9 |
763.2 |
815.2 |
(9.6%) |
(6.8%) |
|
Mauritius Rupee |
39.7 |
39.6 |
42.4 |
(6.9%) |
(7.1%) |
|
Nigerian Naira |
380.6 |
380.7 |
410.2 |
(7.8%) |
(7.7%) |
African Eurobonds
Africa’s appetite for foreign-denominated debt has increased in recent times with the latest issuer during the third quarter of 2021 being Nigeria who raised a total of USD 4.0 bn in September after receiving bids worth USD 12.2 bn, translating to a subscription rate of 3.1x. The oversubscription is mainly driven by the yield hungry investors and also the positive outlook of Nigeria’s economic recovery.
Below is a 5 year graph showing the Eurobond secondary market performance of select 10-year Eurobonds issued by the respective countries:
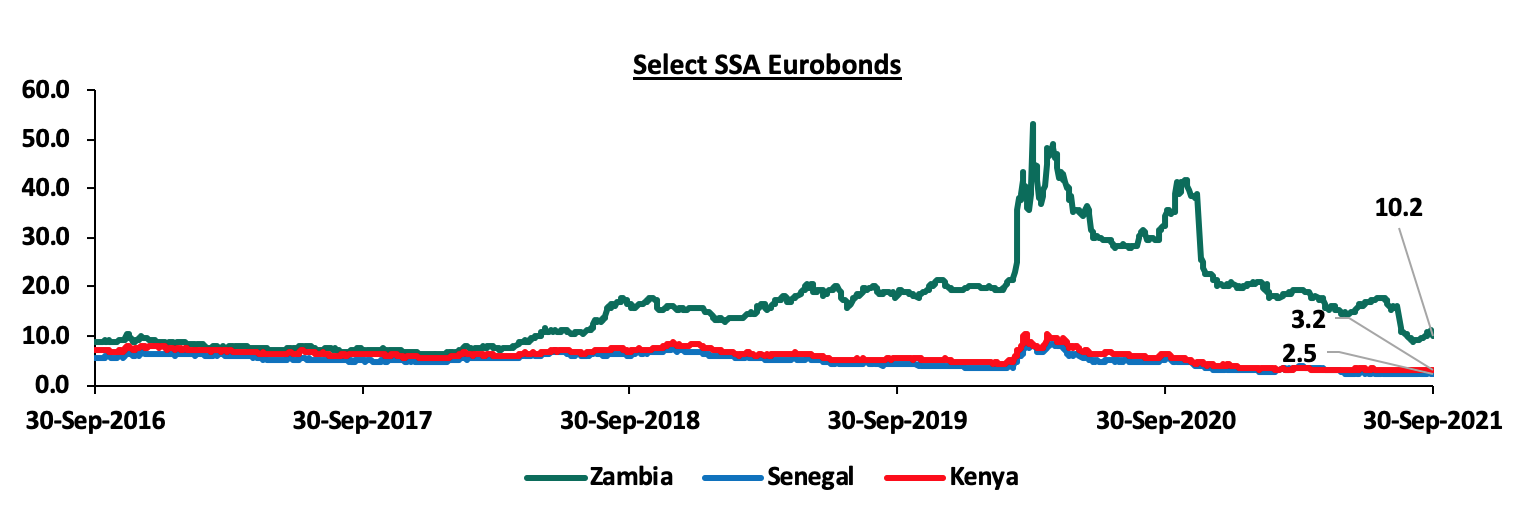
It is good to note that there was a general decline in the yields of the various bonds from different countries due to general improvement in investor sentiment as the economy recovers and the demand for commodities increase. The Zambian Eurobond registered the highest decline of 6.6%, moving from 16.8% to 10.2% as the government took measures on debt sustainability and as copper prices increased. Investor confidence was also supported by the smooth transition of power observed as the country underwent successful elections in the month of August.
Equities Market Performance
Sub-Saharan Africa (SSA) stock markets recorded mixed performance in Q3’2021, with most of the markets recording positive returns, attributable to the improved investor sentiments in the region. The Zambia Stock market (LASILZ) was the best performing index with a 59.0% YTD gain, while Nigeria’s NGSEASI was the worst-performing index with losses of 7.3% YTD. Below is a summary of the performance of key indices:
|
Equities Market Performance (Dollarized*) |
||||||
|
Country |
Index |
Sep-20 |
Dec-20 |
Sep-21 |
Last 12 Months change (%) |
YTD change (%) |
|
Zambia |
LASILZ |
190.2 |
185.2 |
294.5 |
54.8% |
59.0% |
|
Ghana |
GGSECI |
323.6 |
332.5 |
472.4 |
46.0% |
42.1% |
|
Tanzania |
DARSDEI |
0.7 |
0.7 |
0.8 |
20.8% |
27.4% |
|
Kenya |
NASI |
1.3 |
1.4 |
1.6 |
24.1% |
15.2% |
|
Uganda |
USEASI |
0.4 |
0.4 |
0.4 |
6.6% |
6.6% |
|
South Africa |
JALSH |
3,242.8 |
4,069.0 |
4,280.2 |
32.0% |
5.2% |
|
Rwanda |
RSEASI |
0.2 |
0.2 |
0.1 |
(28.1%) |
(4.2%) |
|
Nigeria |
NGSEASI |
70.5 |
105.8 |
98.1 |
39.1% |
(7.3%) |
|
*The index values are dollarized for ease of comparison |
||||||
GDP growth in Sub-Saharan Africa region is expected to recover gradually in 2021, in line with the rest of the global economy. Key risks remain tough business conditions brought about by the COVID-19 pandemic, poor infrastructure, reliance on commodity exports, political tension in some countries and debt sustainability due to the high levels of public debt in most economies in the region.
According to the 2021 Economic Survey Report by the Kenya National Bureau of Statistics (KNBS), the Kenyan economy contracted by 0.3% in 2020, from the restated 5.0% growth recorded in 2019 due to the lockdowns following the emergence of the COVID-19 pandemic. The contraction was spread across all sectors of the economy but the sectors that were hard hit included the accommodation and food serving activities, education, and professional and administrative services. Notably, the tourism and hospitality sector recorded reduced activities following the containment measures leading to a 47.7% decline in food and accommodation services in 2020.
In 2021, the Kenyan economy is projected to grow at an average of 5.3% as the economy opens up but the largest challenge remains how fast the vaccination rollout shall be done and how fast business shall take to recover. The table below shows the projections by various organizations:
|
No. |
Organization |
2021 Projections |
|
1. |
International Monetary Fund |
7.6% |
|
2. |
National Treasury |
6.2% |
|
3. |
World Bank |
4.5% |
|
4. |
S&P Global |
4.4% |
|
5. |
Cytonn Investments Management PLC |
4.0% |
|
Average |
5.3% |
|
Source: Cytonn Research
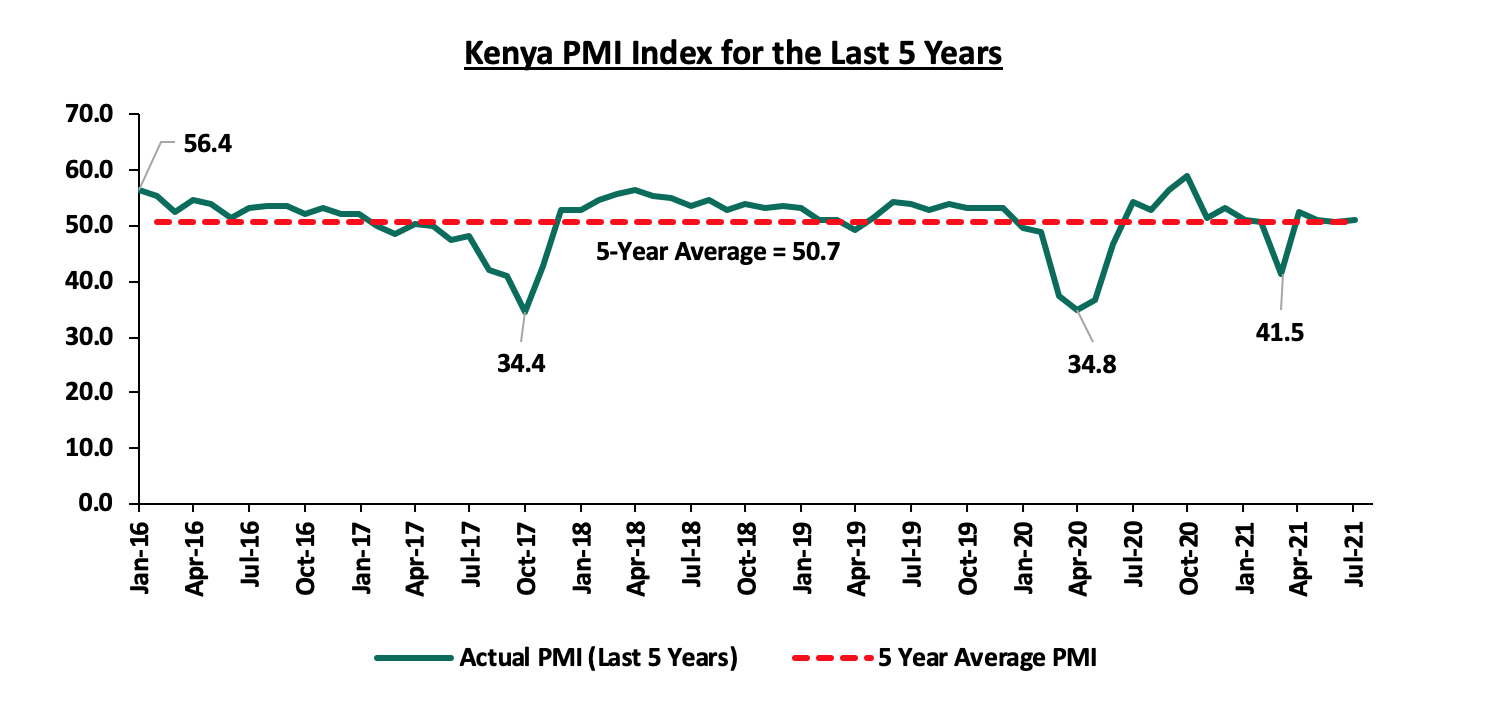
Business conditions in the Kenyan private sector recorded solid improvement in the third quarter, with the average Stanbic Bank Monthly Purchasing Managers’ Index (PMI) for the first eight months averaging 50.2, higher than the 45.2 recorded during a similar period in 2020, and the 50.0 recorded at the end of Q2’2021. For the month of August 2021, the index increased to 51.1 from the 50.6 recorded in July 2021 partially driven by an acceleration in new order growth and a rise in sales in four of the five monitored sectors. Below is the PMI chart for the last five years:
Inflation:
The overall inflation has been on the rise with the inflation ending the quarter at 6.9% in September. The increase in the inflation rate is attributable to the rising food and fuel prices since the start of the year. Below is the inflation chart for the last five years:
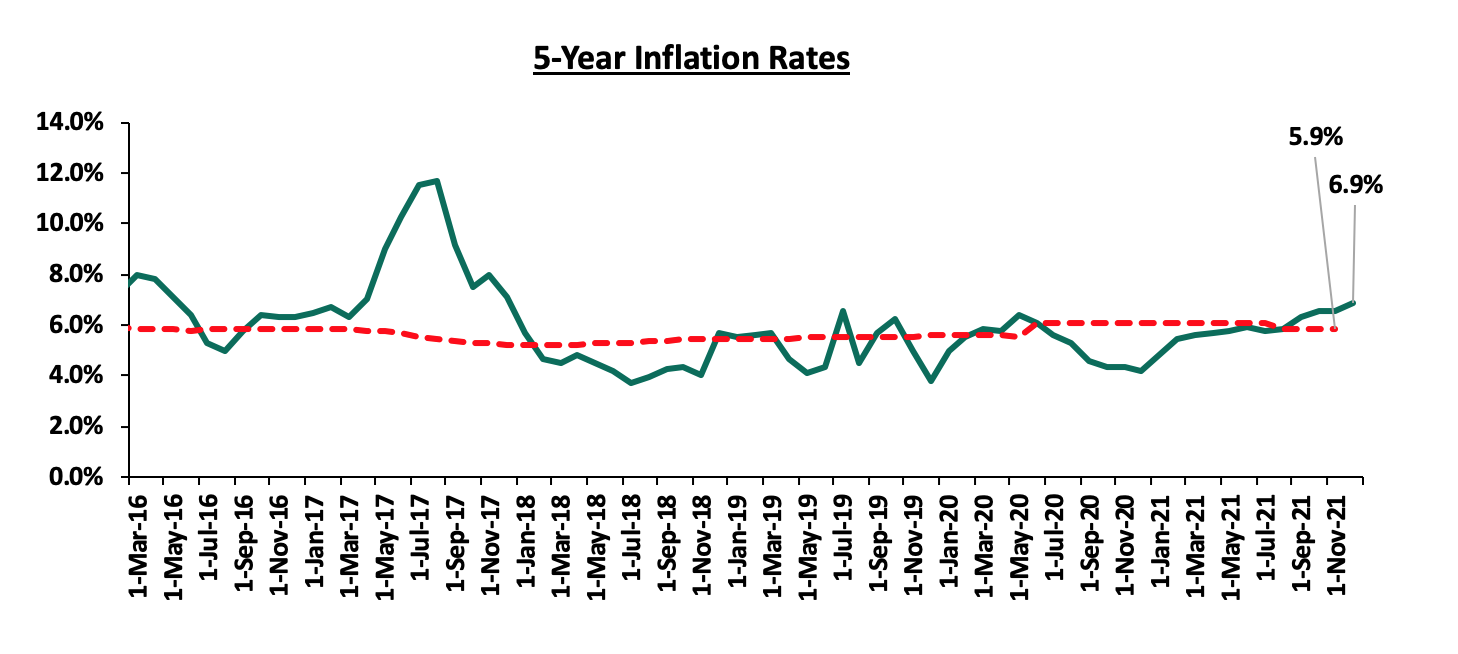
September Inflation
The y/y inflation for the month of September increased to 6.9%, from the 6.6% recorded in August, in line with our expectations. This is the highest reading since the pandemic begun. The increase was mainly attributable to the increase in the y/y food and non-alcoholic beverages, transport, Housing, water, electricity, gas and other Fuels inflation prices which increased by 10.6%, 9.2 and 6.1% respectively. Food and non-alcoholic beverages index has had the greatest increase year on year attributable to supply constraints following the erratic weather while the transport index increased the most on a m/m basis attributable to the increase in fuel prices witnessed in September.
The table below shows a summary of both the year on year and month on month commodity groups’ performance;
|
Major Inflation Changes – September 2021 |
|||
|
Broad Commodity Group |
Price change m/m (September-21/August-21) |
Price change y/y (September-21/September-20) |
Reason |
|
Food & Non-Alcoholic Beverages |
0.1% |
10.6% |
The m/m increase was mainly contributed by increase in prices of carrots, oranges and cabbages among other food items. The increase was however mitigated by a decline in prices of tomatoes, sifted maize flour and spinach |
|
Housing, Water, Electricity, Gas and other Fuel |
0.9% |
6.1% |
The m/m increase was as a result of increase in the price electricity and cooking gas despite the slight decline in the price of single room house rent
|
|
Transport Cost |
1.2% |
9.2% |
The m/m increase was as a result of the increase in prices of super petrol and diesel in the month of September after the fuel subsidy that was introduced in April was lifted |
|
Overall Inflation |
0.3% |
6.9% |
The m/m increase was due to a 1.2% increase in the transport index as compared to the 0.3% decline in the month of August |
Source: KNBS
Going forward, we expect the inflation pressures to remain elevated but within the government’s set range of 2.5% - 7.5%. The key drivers remain the high fuel and food prices as well as the impact of the increase in tariffs and taxes following the recent communication by KRA on inflation adjustment on Specific Rates of Excise Duty effective from 1st October 2021. The rising inflation remains a concern as the IMF has already cautioned the government against exceeding the set target rate as this will increase the risk of an inability to access further credit facilities from the international lender. We anticipate continued pressure on the government to keep the inflation under control before the next IMF evaluation test date which is in December 2021.
The Kenya Shilling:
The Kenya Shilling depreciated against the US Dollar by 2.4% in Q3’2021, to close at Kshs 110.5, from Kshs 107.9 in Q2’2021, marking a 9-months low. The depreciation is partly attributable to increased import activities by local traders as well as increased dollar demand across various sectors including energy amidst weak inflows. During the week, the Kenya Shilling depreciated marginally against the US Dollar by 0.1% to close at 110.5, from 110.4 the previous week. We expect the shilling to remain under pressure as a result of:
- Rising uncertainties in the global market due to the Coronavirus pandemic, which has seen investors continue to prefer holding their investments in dollars and other hard currencies and commodities,
- Increased demand from merchandise traders as they beef up their hard currency positions in anticipation for more trading partners reopening their economies globally, and,
- Rising global crude oil prices on the back of supply constraints at a time when demand is picking up with the easing of COVID-19 restrictions and as economies reopen.
The shilling is however expected to be supported by:
- The Forex reserves, currently at USD 9.4 bn (equivalent to 5.8-months of import cover), which is above the statutory requirement of maintaining at least 4.0-months of import cover, and the EAC region’s convergence criteria of 4.5-months of import cover. In addition, the reserves were boosted by the USD 1.0 bn proceeds from the Eurobond issued in July, 2021 coupled with the USD 407.0 mn IMF disbursement and the USD 130.0 mn World Bank loan financing received in June, 2021, and
- Improving diaspora remittances evidenced by a 14.2% y/y increase to USD 312.9 mn in August 2021, from USD 274.1 mn recorded over the same period in 2020, which has continued to cushion the shilling against further depreciation.
Monetary Policy:
During the quarter, the Monetary Policy Committee (MPC) met twice and in both sittings, maintained the Central Bank Rate (CBR) at 7.0% after concluding that the accommodative stance implemented in April 2020 was having the intended effects on the economy.
However, during the 28th September 2021 sitting, the committee raised concerns on the rising inflation noting that there was need to monitor the inflation and respond to any second round effects in a bid to maintain price stability. Below are some of the key highlights from the meeting:
- Overall inflation stood at 6.6% in August 2021 compared to 6.5% in July, 2021 mainly attributable to increase in food and fuel prices which rose by 10.7% and 9.2%, respectively. Despite the increase, inflation remains within the Government’s target range of 2.5%-7.5% but pressure abides in the short term following the rise in fuel and food prices coupled with the recently implemented tax measures,
- Private sector credit growth has been recovering, having grown by 7.0% in the twelve months to August 2021, an increase from the 6.1% recorded in July 2021. The key sectors supporting this growth include Consumer Durables (20.1%), Transport and Communication (11.8%) and Manufacturing (9.3%), and,
- The current account deficit to GDP is estimated at 5.5% in the 12-months to August 2021, a 0.8% points increase, from 4.7% recorded over a similar period in 2020. Exports of goods remained strong, growing by 11.5% in the eight months to August 2021, compared to a similar period in 2020. Receipts from exports of horticulture and manufactured goods increased by 25.0% and 39.1%, respectively, in the period January to August compared to a similar period in 2020. However, receipts from tea exports declined by 5.8 %, partly attributable to the impact of accelerated purchases in 2020.
The MPC concluded that the current accommodative monetary policy stance remains appropriate and therefore decided to retain the Central Bank Rate (CBR) at 7.00%, in line with our expectations. The Committee will meet again in November 2021, but remains ready to re-convene earlier if necessary.
Q3’2021 Highlights;
- The World Bank Board of Executive Directors approved a USD 130.0 mn (Kshs 14.0 bn) additional loan financing for the Kenya COVID-19 Health Emergency Response Project to facilitate affordable and equitable access to COVID-19 vaccines for Kenyans. The funding will enable Kenya to procure more vaccines through the African Vaccine Acquisition Task Team (Avatt) and the COVID-19 Vaccines Global Access (Covax) facilities in addition to supporting the deployment of the vaccines by boosting the country’s cold-storage capacity. For more information, see our Cytonn Weekly #26/2021,
- The Kenya Revenue Authority (KRA) released the FY’2020/2021 revenue performance, highlighting that the total revenue collected was Kshs 1.67 tn, against the revised target of Kshs 1.65 tn, representing a performance rate of 101.0%. This is despite the challenges posed by the COVID-19 pandemic on business conditions and people’s income. For more information, see our Cytonn Weekly #27/2021,
- The National Treasury gazetted the revenue and net expenditures for the first two months of FY’2021/2022, highlighting that total revenue collected as at the end of August 2021 amounted to Kshs 272.4 bn, equivalent to 15.3% of the original estimates of Kshs 1,775.6 bn and is 84.1% ahead of the prorated estimates of Kshs 148.0 bn. The performance is mainly attributable to enhanced compliance enforcement efforts, introduction of new taxes such as digital services tax and reopening of the economy as more people continue to get vaccinated leading to improved domestic consumption and external demand. On the other hand, the total expenditure amounted to Kshs 407.5 bn, equivalent to 12.8% of the original estimates of Kshs 3,193.0 bn, and is 76.6% of the prorated expenditure estimates of Kshs 532.2 bn. For more information, see our Cytonn Weekly #37/2021, and,
- The Energy and Petroleum Regulatory Authority (EPRA) released their monthly statement on the Maximum wholesale and retail petroleum prices effective 15th September 2021 to 14th October 2021, highlighting that the prices of Super Petrol, Diesel and Kerosene had increased to Kshs 134.7, Kshs 115.6 and Kshs 110.8 respectively, attributable to the lifting of the fuel subsidy introduced in April, 2021. For more information, see our Cytonn Weekly #37/2021.
Going forward, we expect Kenya’s economy to record a gradual recovery in 2021, growing at a rate of 4.0%, from the 0.3% contraction recorded in 2020. However, we foresee the emergence of new COVID-19 variants, slow vaccine distribution, rising inflation coupled with the high debt appetite to slow down the recovery.
Money Markets, T-Bills & T-Bonds Primary Auction:
During the third quarter of 2021, T-bills were undersubscribed, with the overall subscription rate coming in at 87.8%, down from 115.3% recorded in Q2’2021, as investors shifted their interest to the bond market in search for higher yields. The subscription rate for the 91-day and 182-day papers increased to 163.1% and 92.1%, respectively, from 94.2% and 56.1%, recorded in Q2’2021. On the other hand, the subscription rate for the 364-day paper declined to 39.0%, from 183.0% recorded in Q2’2021. The average yields for the 364-day, 182-day and 91-day papers declined to 7.6%, 7.1% and 6.7% in Q3’2021, respectively, from 9.0%, 7.8% and 6.9%, recorded in Q2’2021. The acceptance rate in Q3’2021 increased to 94.7%, from 66.7% in Q2’2021, with the government accepting a total of Kshs 237.0 bn, of the Kshs 252.8 bn worth of bids received.
During the week, T-bills remained undersubscribed, with the overall subscription rate coming in at 42.2%, a marginal decline from 42.3% recorded the previous week. The 91-day paper recorded the highest subscription rate, receiving bids worth Kshs 2.6 bn against the offered Kshs 4.0 bn, translating to a subscription rate of 66.0%, a decrease from 119.8% recorded the previous week. The subscription rate for the 182-day and the 364-day papers increased to 53.4% and 21.6%, from 46.7% and 7.0%, respectively, recorded the previous week. The yields on the 91-day and 364-day papers increased by 0.9 bps and 5.9 bps, to 6.9% and 7.9%, respectively, while the yield on the 182-day paper remained unchanged at 7.3%. The government accepted Kshs 9.6 bn, out of the 10.1 bn bids received, translating to an acceptance rate of 94.9%.
Primary T-Bond Auctions in Q3’2021
During Q3’2021, the Government issued nine Treasury bonds seeking to raise Kshs 245.0 bn and they were generally oversubscribed, receiving bids totaling Kshs 411.3 bn. The government was keen on maintaining low rates and thus accepted only Kshs 304.4 bn of the Kshs 411.3 bn worth of bids received, translating to an acceptance rate of 78.2%. The table below provides more details on the bonds issued during the quarter:
|
Issue Date |
Bond Auctioned |
Effective Tenor to Maturity (Years) |
Coupon |
Amount offered (Kshs bn) |
Actual Amount Raised (Kshs bn) |
Total bids received |
Average Accepted Yield |
Subscription Rate |
Acceptance Rate |
|
5/7/2021 |
FXD1/2019/20 - Tap Sale |
17.9 |
12.9% |
50.0 |
29.0 |
29.8 |
13.3% |
77.0% |
97.2% |
|
FXD1/2012/20 - Tap Sale |
11.4 |
12.0% |
8.4 |
8.6 |
12.5% |
||||
|
19/07/2021 |
FXD1/2012/15 |
6.2 |
11.0% |
60.0 |
30.1 |
48.8 |
11.5% |
194.9% |
68.4% |
|
FXD1/2018/15 |
11.9 |
12.7% |
27.2 |
28.2 |
12.7% |
||||
|
FXD1/2021/25 |
24.9 |
13.9% |
22.6 |
39.9 |
13.9% |
||||
|
16/08/2021 |
FXD3/2019/10 |
8.1 |
11.5% |
60.0 |
23.0 |
38.3 |
12.2% |
174.4% |
76.7% |
|
FXD1/2018/20 |
16.7 |
13.2% |
17.8 |
22.8 |
13.2% |
||||
|
FXD1/2021/20 |
20.0 |
13.4% |
39.5 |
43.5 |
13.4% |
||||
|
13/09/2021 |
IFBI/2021/021 |
21.0 |
12.7% |
75.0 |
106.8 |
151.3 |
12.7% |
201.7% |
70.6% |
|
Q3'2021 Average |
15.3 |
12.6% |
61.3 |
33.8 |
45.7 |
12.8% |
162.0% |
78.2% |
|
|
Q2'2021 Average |
17.6 |
13.0% |
35.0 |
20.4 |
31.0 |
13.2% |
152.7% |
67.3% |
|
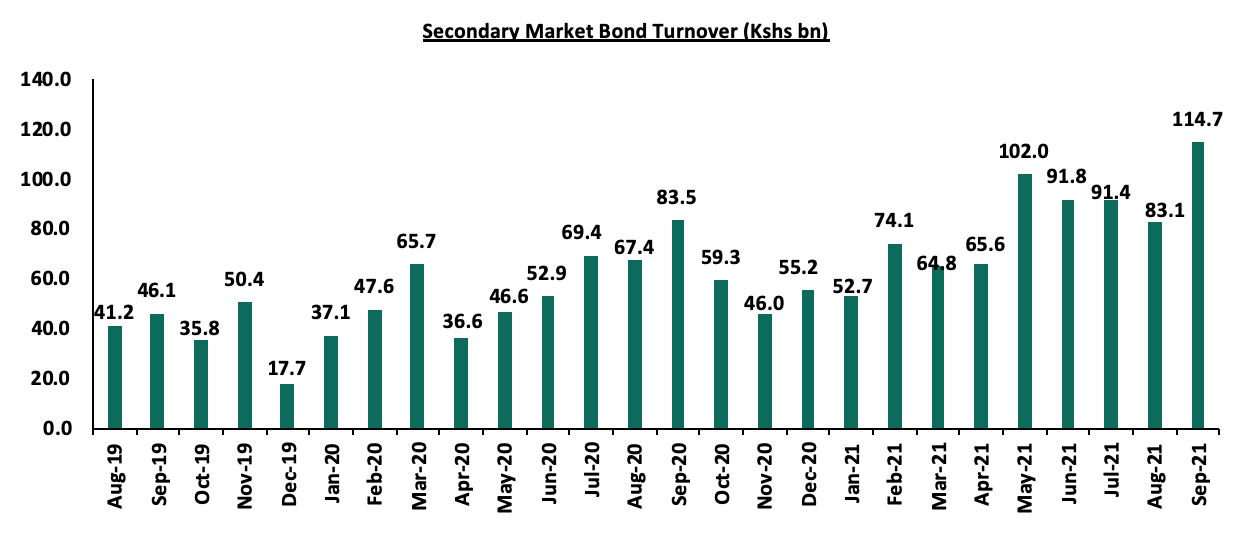
Secondary Bond Market Activity:
I. Bond Turnover
The secondary bond market recorded increased activity, with the turnover increasing by 11.5% to Kshs 289.2 bn, from Kshs 259.4 bn in Q2’2021, partially attributable to the high liquidity and increased allocation to treasury bonds by local institutional investors as they sought for higher yields in the market.
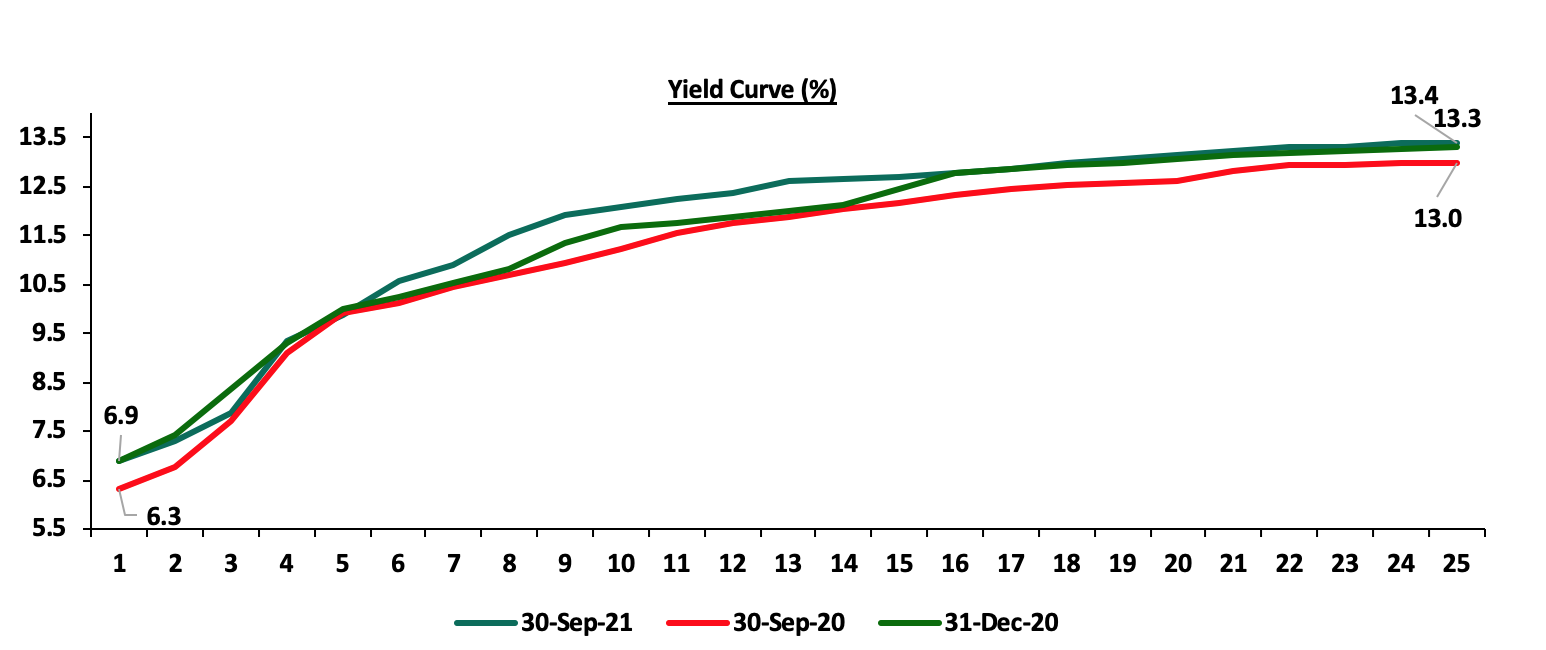
II. Yield Curve
The yields on government securities in the secondary market remained relatively stable during the quarter, which saw the FTSE bond index decline marginally of 0.2% to close at Kshs 96.8, from Kshs 97.0 recorded in Q2’2021 and bringing the YTD performance to a 1.4% decline. We expect the rise in the yield curve to be sustained in the coming quarter, mainly driven by increased borrowing appetite by the government coupled with investors’ hunt for higher yields. The chart below shows the yield curve movement during Q3’2021:
III. Money Market Performance
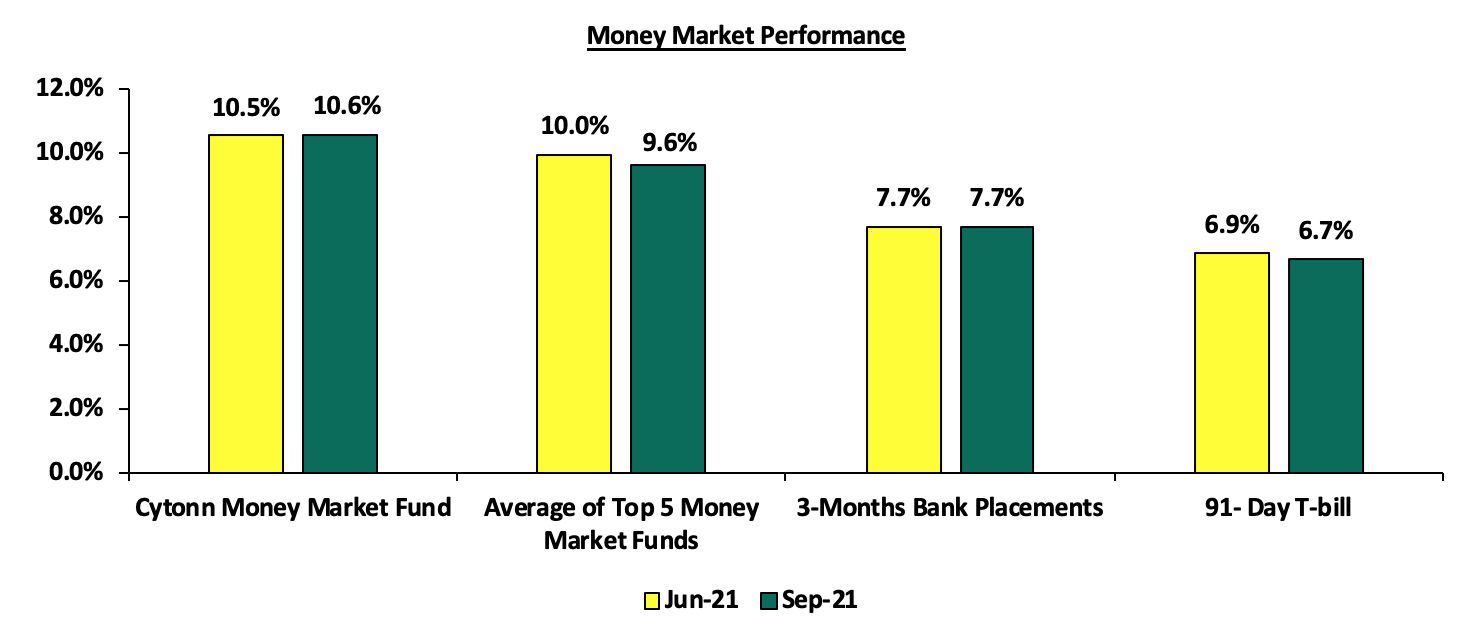
In the money market, during the quarter, the 3-month bank placements remained unchanged at 7.7% (based on what we have been offered by various banks). The average yield on the 91-day T-bill decreased to 6.7%, from 6.9% in Q2’2021, while the average yield of the Top 5 Money Market Funds decreased to 9.6%, from 10.0% in Q2’2021. The yield on the Cytonn Money Market (CMMF) increased marginally to 10.6%, from 10.5% recorded in Q2’2021.
The table below shows the Money Market Fund Yields for Kenyan Fund Managers as published on 1st October 2021:
|
Money Market Fund Yield for Fund Managers as published on 1st October 2021 |
|||
|
Rank |
Fund Manager |
Daily Yield |
Effective Annual Rate |
|
1 |
Cytonn Money Market Fund |
10.09% |
10.62% |
|
2 |
Zimele Money Market Fund |
9.56% |
9.91% |
|
3 |
Madison Money Market Fund |
9.00% |
9.42% |
|
4 |
Sanlam Money Market Fund |
8.76% |
9.15% |
|
5 |
CIC Money Market Fund |
8.71% |
9.01% |
|
6 |
Apollo Money Market Fund |
9.10% |
8.95% |
|
7 |
Dry Associates Money Market Fund |
8.48% |
8.82% |
|
8 |
GenCapHela Imara Money Market Fund |
8.42% |
8.79% |
|
9 |
Co-op Money Market Fund |
8.29% |
8.64% |
|
10 |
Nabo Africa Money Market Fund |
8.15% |
8.49% |
|
11 |
British-American Money Market Fund |
8.16% |
8.47% |
|
12 |
ICEA Lion Money Market Fund |
8.00% |
8.33% |
|
13 |
NCBA Money Market Fund |
8.01% |
8.33% |
|
14 |
Old Mutual Money Market Fund |
6.89% |
7.12% |
|
15 |
Orient Kasha Money Market Fund |
6.80% |
7.03% |
|
16 |
AA Kenya Shillings Fund |
6.55% |
6.75% |
Source: Business Daily
Liquidity:
During the quarter, liquidity in the money market remained relatively stable, with the average interbank rate increasing marginally by 0.1% points to 4.9%, from 4.8% recorded the previous quarter. Additionally, the average volumes traded in the interbank market increased by 3.6% to Kshs 10.3 bn, from Kshs 9.9 bn recorded in the previous quarter.
During the week, liquidity in the money market tightened, with the average interbank rate increasing to 6.7%, from 6.1% recorded the previous week, attributable to build-up of bank balances ahead of the quarter end reporting as well as anticipatory quarterly tax remittances. The average interbank volumes traded declined by 32.1% to Kshs 8.3 bn, from Kshs 16.9 bn recorded the previous week.
Kenya Eurobonds:
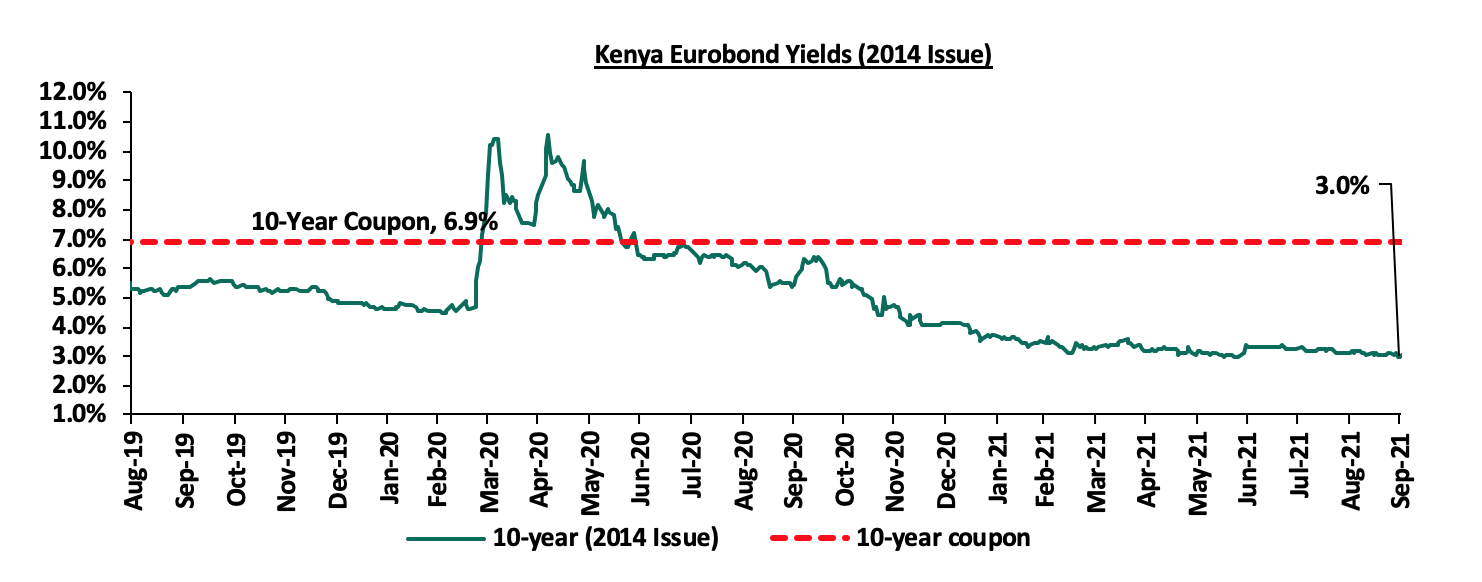
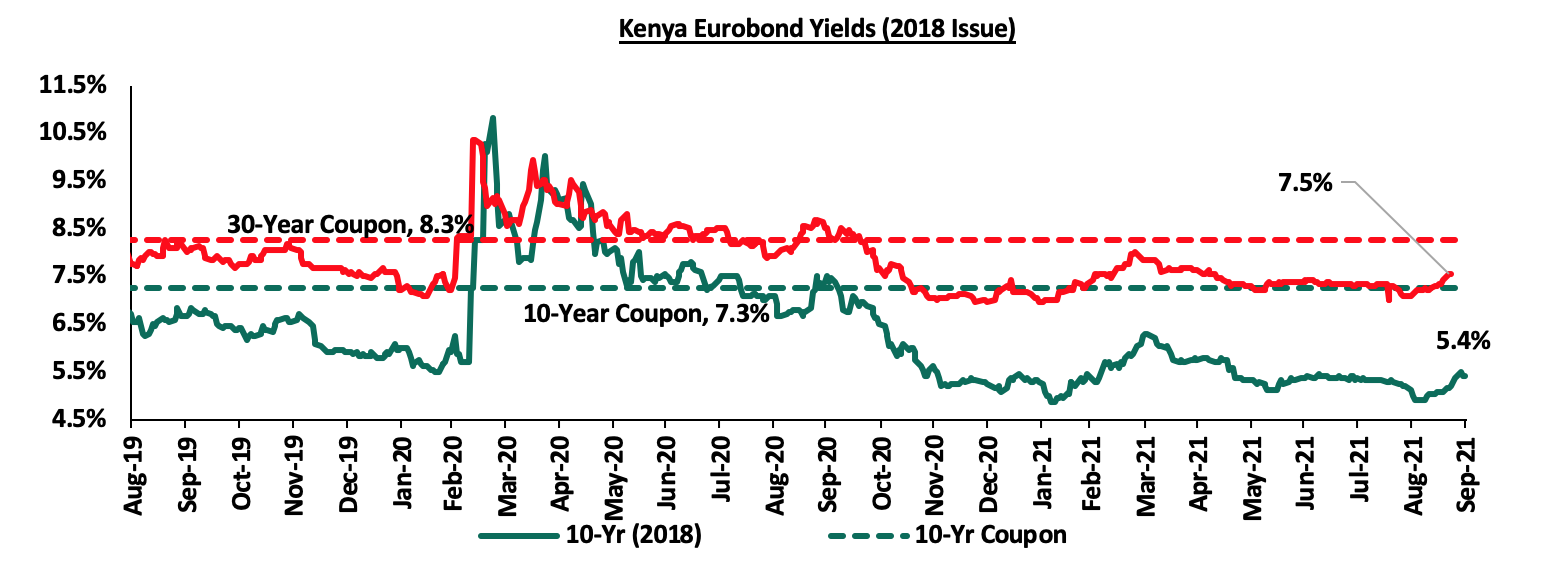
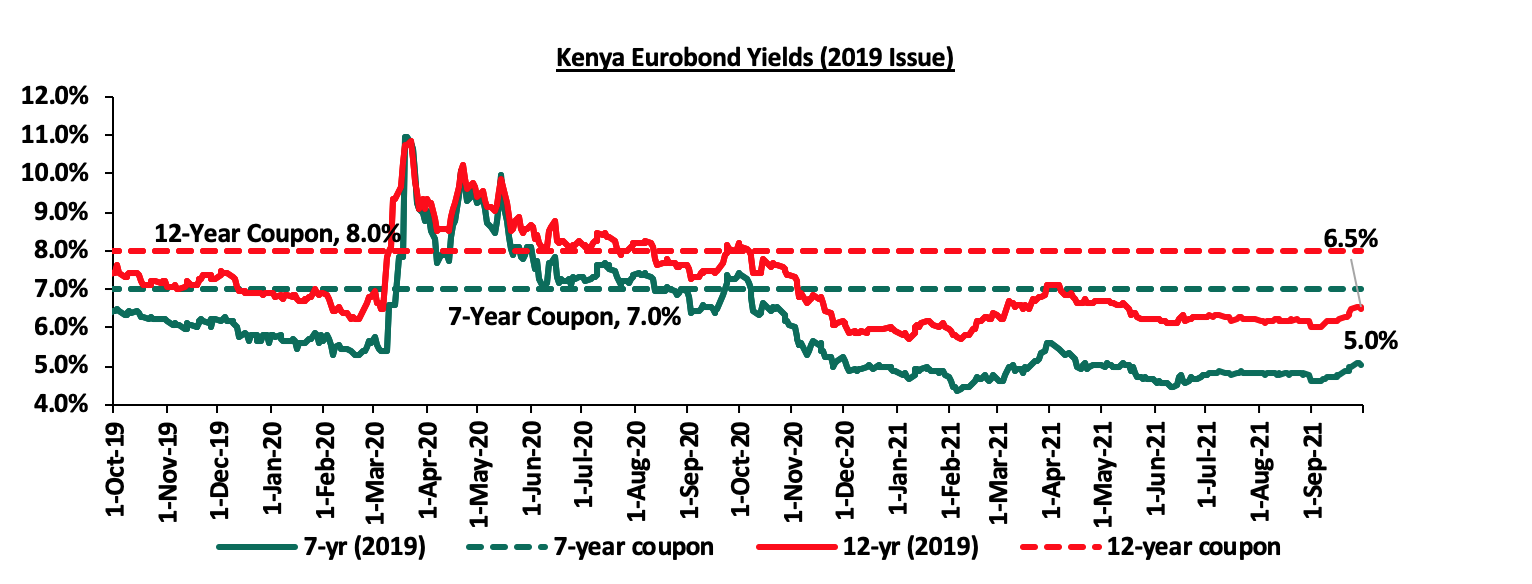
Yields on the Kenyan Eurobonds recorded a mixed performance during the quarter, with the yields in the 12-year Eurobond issued in 2019, 7-year Eurobond issued in 2019 and the 12-year Eurobond issued in 2021 all increasing by 0.2% points, while the 10-year Eurobonds issued in 2014 and 2018 declined by 0.3% and 0.03% points, respectively. The mixed performance points to the fact that investors are still seeking direction as they try to assess Kenya’s economic recovery amidst the uncertainty brought about by the ongoing pandemic coupled with slow vaccine roll out in the country.
During the quarter, the yield on the 10-year Eurobond issued in 2014, decreased by 0.3% points to close at 3.0%, from 3.3% recorded in Q2’2021. During the week, the yield on the 10-year Eurobond issued in 2014 decreased by 0.1% points to 3.0%, from 3.1% recorded last week.
During the Quarter, the yield on the 30-year Eurobond issued in 2018 increased by 0.1% points close at 7.5%, from 7.4% at the end of Q2’2021, while the 10-year Eurobond issued in 2018, declined marginally by 0.03% points to close at 5.40% in Q3’2021, from 5.37% at the end of Q2’2021. During the week, the yield on the 30-year Eurobond issued in 2018 increased by 0.1% points to 7.5%, from 7.4% recorded last week, while the yield on the 10-year Eurobond increased marginally by 0.04% points to 5.40%, from the 5.36% recorded last week.
During the Quarter, the yield on the 7-year Eurobond issued in 2019, increased by 0.2% points to close at 5.0%, from 4.8% at the end of Q2’2021. During the week, the yield on the 7-year Eurobond issued in 2019 and the 12-year Eurobond issued in 2019 remained unchanged at 5.0% and 6.5%, respectively, as was recorded the previous week.
Markets Performance
During Q3’2021, the equities market was on an upward trajectory, with NASI, NSE 20 and NSE 25 gaining by 2.8%, 3.8% and 5.4%, respectively. The equities market performance was driven by gains recorded by large cap stocks such as Equity Group, KCB, Bamburi and ABSA Bank, which gained by 13.4%, 9.6%, 6.7% and 6.4%, respectively. The gains were however weighed down by losses recorded by other large cap stocks such as EABL and Cooperative Bank, which declined by 5.5% and 3.3%, respectively.
During the week, the equities market recorded a mixed performance, with NASI and NSE 25 gaining by 1.9% and 0.9%, respectively, while NSE 20 recorded a marginal decline of 0.1%, taking their YTD performance to gains of 19.1%, 15.7% and 9.1% for NASI, NSE 25 and NSE 20, respectively. The NASI performance was driven by gains recorded by large cap stocks such as Safaricom, Co-operative Bank and BAT which gained by 3.3%, 1.5% and 1.1%, respectively. The gains were however weighed down by losses recorded by other large-cap stocks such as NCBA which declined by 3.9%.
During Q3’2021, equities turnover declined by 18.9% to USD 286.2 mn, from USD 352.7 mn in Q2’2021. Foreign investors turned net buyers during the quarter, with a net buying position of USD 8.7 mn, from a net selling position of USD 18.7 mn in Q2’2021. During the week, equities turnover declined by 49.6% to USD 14.7 mn, from USD 29.2 mn recorded the previous week, taking the YTD turnover to USD 928.7 mn. Foreign investors remained net sellers, with a net selling position of USD 3.4 mn, from a net selling position of USD 7.7 mn recorded the previous week, taking the YTD to a net selling position to USD 18.2 mn.
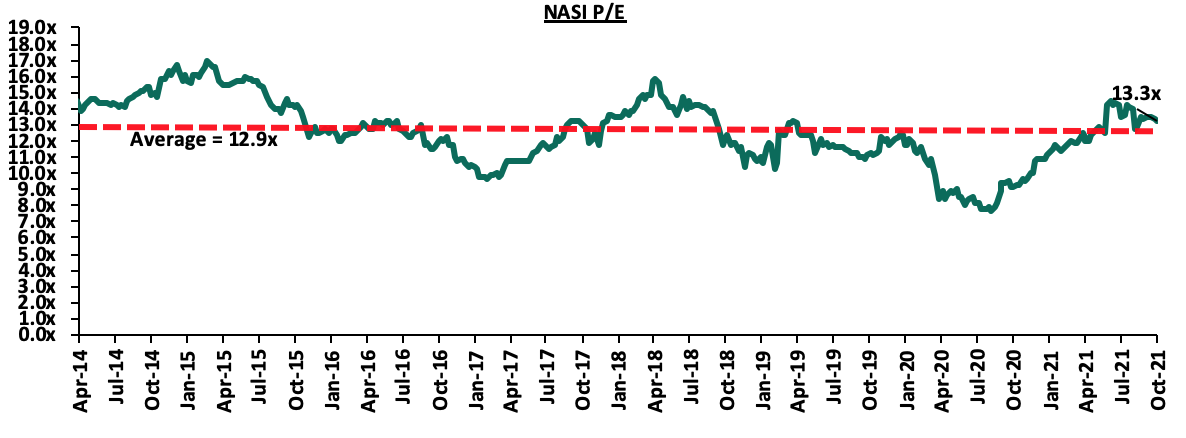
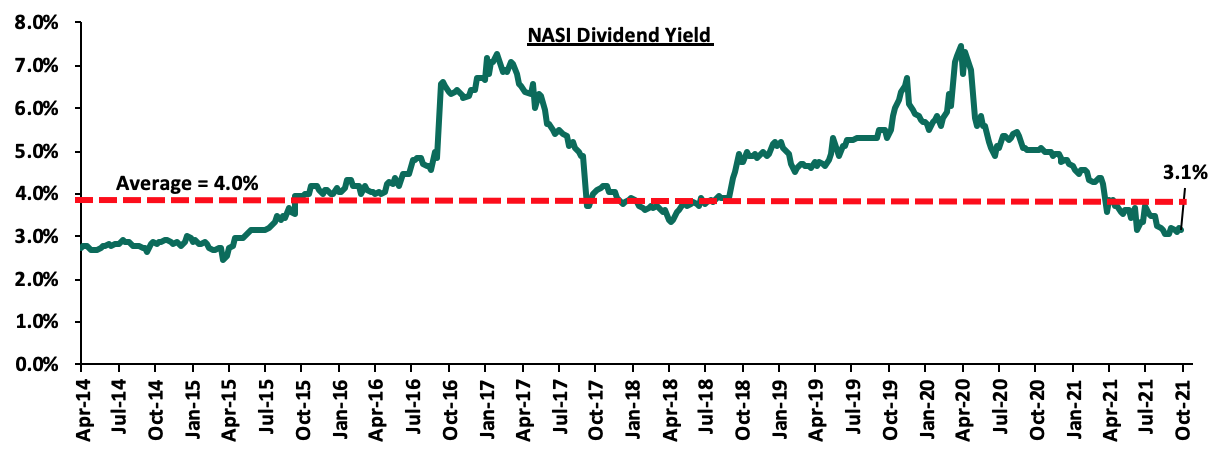
The market is currently trading at a price to earnings ratio (P/E) of 13.3x, 2.8% above the historical average of 12.9x, and a dividend yield of 3.1%, 0.9% points below the historical average of 4.0%. Key to note, NASI’s PEG ratio currently stands at 1.5x, an indication that the market is trading at a premium to its future earnings growth. Basically, a PEG ratio greater than 1.0x indicates the market may be overvalued while a PEG ratio less than 1.0x indicates that the market is undervalued. Excluding Safaricom, which is currently 62.1% of the market, the market is trading at a P/E ratio of 11.7x and a PEG ratio of 1.3x. The current P/E valuation of 13.3x is 72.6% above the most recent trough valuation of 7.7x experienced in the first week of August 2020. The charts below indicate the historical P/E and dividend yields of the market.
Listed Banks H1’2021 Results:
During the third quarter of 2021, listed banks in Kenya released their H1’2021 results, recording an increase in their earnings growth, with their average core EPS recording a weighted average growth of 136.0%, compared to a weighted average decline of 33.6% in H1’2020. The good performance can be attributed to an improving business environment which led to a decline in the overall provisions. The performance is however largely skewed by the strong performance from ABSA Bank, KCB Group and Equity Group which reported increases in their EPS of 846.0%, 101.9% and 97.7%, respectively. For more information, see our H1’2021 Banking Sector Report;
Quarterly Highlights;
During the quarter;
- The Ethiopian Communications Authority (ECA) announced the formal issuance of a Telecommunications Operator License to the Global Partnership for Ethiopia (GPE) consortium which had successfully bid USD 850.0 mn (Kshs 91.8 bn) for the telco license. The GPE consortium consists of Safaricom, Sumitomo Corporation, CDC Group Plc and Vodacom with shareholdings of 55.7%, 27.2%, 10.9% and 6.2%, respectively. GPE, which has been incorporated as Safaricom Telecommunications Ethiopia PLC, has been granted a nationwide full-service Telecommunications Service License valid for a period of 15 years, effective 9th July 2021, and is renewable for an additional term of 15 years subject to the fulfilment of all license obligations. For more information, see our Cytonn Weekly 28/2021,
- The Central Bank of Kenya (CBK) released the Quarterly Economic Review for the period ending 31st March 2021, highlighting that the banking sector remained stable and resilient in the midst of a pandemic. According to the report, the sector’s total assets increased by 2.0% to Kshs 5.5 tn in March 2021, from Kshs 5.4 tn in December 2020. The increase was mainly attributable to an 8.1% increase in placements coupled with a 5.2% increase in loans and advances in March 2021. For more information, see our Cytonn Weekly 29/2021,
- KCB Group announced that it had completed the 62.1% acquisition of Banque Populaire du Rwanda Plc (BPR) using a Price to Book Value (P/Bv) of 1.1x, after receiving all the required regulatory approvals. According to the latest BPR financials released as of June 2021, the bank had a book value of Rwf 52.9 bn (Kshs 5.8 bn), and thus at the trading multiple of 1.1x, we expect KCB Group to have spent an estimated Kshs 6.3 bn to acquire BPR Rwanda. Additionally, KCB Group will take over 135 branches from BPR, taking its total branches to 489, from 354 branches as of June 2021. For more information, please see our Cytonn Weekly #34/2021,
- The Insurance Regulatory Authority (IRA), released the Q2'2021 Insurance Industry Report highlighting that the industry’s gross premiums rose by 19.0% to Kshs 144.0 bn, from Kshs 121.0 bn recorded in Q2’2020, with the general insurance business contributing to 59.3% of the industry’s premium income, an 8.5% points increase from the 50.8% contribution witnessed in Q2’2020. For more information, please see our Cytonn Weekly #36/2021,
- The Cabinet Secretary for the National Treasury and Planning, through the Capital Markets Authority (CMA), published two draft regulations; the Capital Markets (Collective Investment Schemes) Regulations 2021and the Capital Markets (Collective Investment Schemes) (Alternative Investment Funds) Regulations 2021. The proposed regulations seek to update the current Collective Investment Scheme regulations given the change in market dynamics since the last published Regulations in 2001, as well as address emerging issues. For more information, please see our Cytonn Weekly #37/2021 and our topical, and,
- Liberty Holdings Limited (Liberty), a financial services and property holding company completed the acquisition of 84.2 mn shares in Liberty Kenya Holdings Plc (Liberty Kenya), which represents 15.7% of the company’s issued share capital. This follows the June 2021 announcement of Liberty Holdings intention to buy 49.5 mn ordinary shares from the Conrad N. Hilton Foundation, Kimberlite Frontier Africa Master Fund, L.P. and Vanderbilt University (the KFAMF Acquisition), and a further 34.7 mn ordinary shares from Coronation Africa Frontiers Fund and Coronation All Africa Fund (the Coronation Acquisition), which represented 9.3% and 6.5% of the company’s shareholding, respectively. For more information, please see Cytonn Weekly #37/2021.
Weekly Highlight:
During the week, Nation Media Group (NMG) PLC, announced the results of the share buyback offer which saw the company acquire 17.1 mn ordinary shares out of the targeted 20.7 mn ordinary shares, representing an 82.5% success rate. The share buyback of up to 10.0% of its issued and paid-up share capital ran from 28th June 2021 to 24th September 2021. The issued ordinary shares of the Company available for trading have now decreased by 9.0% to 190.3 mn, from 207.4 mn as at 31st May 2021. The repurchased shares will be classified as treasury stock meaning that the shares will no longer earn dividends, lack voting rights and are not included in the calculation of earnings per share. NMG’s share price has rallied on the back of the share buyback, gaining by 71.6% to Kshs 23.0, with a P/E multiple of 115.0x as of 1st October 2021, from Kshs 13.4, with a P/E multiple of 67.0x on 24th February 2021 when the company released a cautionary statement on the intended share buyback. In our view, the share buyback by NMG has been largely successful, and is expected to set precedence for other companies in the bourse whose prices and valuations are currently low. Key to note, NMG is the first company in the NSE to undertake a share repurchase program. For more information on the NMG share buyback, please see our Cytonn Monthly May 2021 and NMG Share Buyback Note.
Universe of Coverage:
|
Company |
Price as at 24/09/2021 |
Price as at 01/10/2021 |
w/w change |
YTD Change |
Year Open 2021 |
Target Price* |
Dividend Yield |
Upside/ Downside** |
P/TBv Multiple |
Recommendation |
|
I&M Group*** |
23.0 |
22.8 |
(1.1%) |
(49.3%) |
44.9 |
32.0 |
9.9% |
50.5% |
0.6x |
Buy |
|
Kenya Reinsurance |
2.5 |
2.5 |
0.0% |
8.2% |
2.3 |
3.1 |
8.0% |
32.0% |
0.3x |
Buy |
|
ABSA Bank*** |
10.6 |
10.5 |
(0.5%) |
10.3% |
9.5 |
13.8 |
0.0% |
31.4% |
1.2x |
Buy |
|
NCBA*** |
27.1 |
26.0 |
(3.9%) |
(2.3%) |
26.6 |
31.0 |
5.8% |
25.0% |
0.6x |
Buy |
|
Standard Chartered*** |
130.0 |
130.8 |
0.6% |
(9.5%) |
144.5 |
145.4 |
8.0% |
19.2% |
1.0x |
Accumulate |
|
KCB Group*** |
47.1 |
46.8 |
(0.7%) |
21.7% |
38.4 |
53.4 |
2.1% |
16.4% |
1.0x |
Accumulate |
|
Equity Group*** |
50.5 |
50.5 |
0.0% |
39.3% |
36.3 |
57.5 |
0.0% |
13.9% |
1.4x |
Accumulate |
|
Co-op Bank*** |
13.2 |
13.4 |
1.5% |
6.8% |
12.6 |
14.1 |
7.5% |
12.7% |
0.9x |
Accumulate |
|
Sanlam |
11.9 |
11.5 |
(3.4%) |
(11.5%) |
13.0 |
12.4 |
0.0% |
7.8% |
1.0x |
Hold |
|
Stanbic Holdings |
92.0 |
92.0 |
0.0% |
8.2% |
85.0 |
96.6 |
1.8% |
6.8% |
0.9x |
Hold |
|
Diamond Trust Bank*** |
63.5 |
63.5 |
0.0% |
(17.3%) |
76.8 |
67.3 |
0.0% |
6.0% |
0.3x |
Hold |
|
Liberty Holdings |
8.1 |
8.1 |
(0.2%) |
5.5% |
7.7 |
8.4 |
0.0% |
3.4% |
0.6x |
Lighten |
|
Jubilee Holdings |
368.8 |
350.0 |
(5.1%) |
26.9% |
275.8 |
330.9 |
2.6% |
(2.9%) |
0.7x |
Sell |
|
Britam |
8.1 |
8.1 |
0.0% |
15.4% |
7.0 |
6.7 |
0.0% |
(17.1%) |
1.5x |
Sell |
|
HF Group |
4.1 |
4.0 |
(2.9%) |
26.1% |
3.1 |
3.1 |
0.0% |
(21.7%) |
0.2x |
Sell |
|
CIC Group |
2.7 |
3.0 |
8.4% |
40.3% |
2.1 |
1.8 |
0.0% |
(39.2%) |
1.0x |
Sell |
|
Target Price as per Cytonn Analyst estimates **Upside/ (Downside) is adjusted for Dividend Yield ***For Disclosure, these are stocks in which Cytonn and/or its affiliates are invested in Key to note, I&M Holdings YTD share price change is mainly attributable to the counter trading ex-bonus issue |
||||||||||
We are “Neutral” on the Equities markets in the short term. With the market currently trading at a premium to its future growth (PEG Ratio at 1.5x), we believe that investors should reposition towards companies with a strong earnings growth and are trading at discounts to their intrinsic value. Additionally, we expect the recent discovery of new strains of COVID-19 coupled with the introduction of strict lockdown measures in major economies to continue dampening the economic outlook.
The real estate sector recorded increased activities in Q3’2021 attributable to the continued reopening of the economy. The sector saw improved business activities as evidenced by;
- Affordable housing projects such as Changamwe Estate in Mombasa County and other affordable housing developments in various parts of Kiambu County such as Ruiru currently being undertaken by the National Housing Corporation. The government also signed two partnerships that is; the Yaoundé Declaration partnership with 24 other African countries and another with the United Kingdom (UK), both aimed at developing affordable houses in the country,
- Lending institutions such as banks and SACCOs continued efforts to support home ownership through affordable mortgage schemes with bespoke terms to clients. Some of these institutions include Gulf African Bank, Standard Chartered Bank, NCBA Bank, Kenya Co-operative Bank and Stima SACCO,
- Aggressive expansions by local retailers such as Naivas and international retailers such as Carrefour taking up prime retail spaces left by beleaguered retailers such as Tuskys,
- The continued infrastructural developments in the country such as the Nairobi Expressway expected to be completed in February 2022, the Western Bypass and Lamu Port-South Sudan-Ethiopia Transport (LAPSSET) corridor, and,
- The reopening of many hotels following lifting of travels restrictions, the aggressive international marketing of the Kenyan hospitality industry and the return of international flights to the country that had initially stalled.
Despite the notable factors accelerating growth, there were several factors impeding the performance of the real estate sector. They include;
- Continued oversupply for commercial office space in the Nairobi Metropolitan Region (NMA) currently at 7.3 mn of SQFT as businesses have incorporated work from home measures as a continuing norm,
- Existing oversupply of retail space in the NMA currently at 3.0 mn SQFT attributable to rise in e-commerce, exit of some international retailers from the Kenyan market and the financial constraints by retailers limiting expansion,
- Tough economic times which has brought about reduced consumer purchasing power,
- Kenya being in the UK ‘Red-List’ for a significant period of Q3’2021 before the removal in mid-September 2021, reducing the number of international arrivals since UK nationals were not allowed to travel to ‘Red-List’ countries, and,
- The signing of the Finance Bill, 2021 into law bringing the re-introduction of a 20.0% excise duty on fees and other commissions earned on loans by financial institutions which risks making credit costly for home owners and developers as lenders will transfer the burden to borrowers.
Despite the setbacks the real estate sector made tremendous improvement during the period, and we expect this to be maintained going forward as a return to normalcy slowly sets in, thanks to the mass Covid-19 vaccinations that are currently underway. The government has also reiterated its support towards real estate including; i) continued development of infrastructure projects in the pipeline, ii) hospitality sector through international marketing of the industry in countries such as Ukraine, iii) progressive real estate related legislations such as the published the Draft National Land Surveying and Mapping Policy, 2021 to guide the practice of land surveying and mapping in various sectors of the economy , and, iv) residential sector by supporting affordable housing projects and the issuance affordable mortgages through the Kenyan Mortgage Refinance Company (KMRC).
Sectoral Market Performance:
- Residential Sector
During Q3’2021 the residential sector recorded improved performance with a 0.7% points y/y increase in average total returns to 5.5% from the 4.8% recorded in Q3’2020. The average total returns remained flat compared to H1’2021 which also recorded an average total return of 5.5%. The average y/y price appreciation came in at 0.7% in Q3’2021 representing a 0.8% points increase from the 0.1% average price correction recorded in Q3’2020. This signified a rise of investor confidence into the property market thereby creating a favorable operating environment that boosted property transactions. The average rental yield in Q3’2021 came in at 4.8% compared to 4.9% recorded in Q3’2020 indicating a 0.1% points decline as landlords continued to lower asking rents marginally in order to maintain and lure more occupants and offset the effects of Covid-19 pandemic on real estate investment income.
|
Residential Performance Summary |
|||||||||
|
Segment |
Average of Rental Yield Q3'2021 |
Average of Price Appreciation Q3'2021 |
Average of Total Returns Q3'2021 |
Average of Rental Yield Q3'2020 |
Average of Price Appreciation Q3'2020 |
Average of Total Returns Q3'2020 |
Change in Rental Yield |
Change in Price Appreciation |
Change in Total Returns |
|
Detached Units |
|||||||||
|
High End |
3.7% |
0.2% |
3.9% |
3.7% |
0.0% |
3.7% |
0.1% |
0.1% |
0.2% |
|
Upper Mid-End |
4.5% |
0.2% |
4.7% |
4.7% |
0.2% |
4.9% |
(0.2%) |
0.1% |
(0.1%) |
|
Satellite Towns |
4.5% |
1.5% |
6.0% |
4.3% |
(0.4%) |
3.9% |
0.1% |
1.9% |
2.0% |
|
Detached Average |
4.2% |
0.6% |
4.8% |
4.2% |
(0.1%) |
4.2% |
0.0% |
0.7% |
0.6% |
|
Apartments |
|||||||||
|
Upper Mid-End |
5.2% |
0.9% |
6.2% |
5.1% |
(0.3%) |
4.7% |
0.1% |
1.3% |
1.4% |
|
Lower Mid-End Suburbs |
5.3% |
0.8% |
6.1% |
5.7% |
0.1% |
5.8% |
(0.4%) |
0.7% |
0.3% |
|
Satellite Towns |
5.3% |
0.5% |
5.8% |
5.6% |
0.0% |
5.7% |
(0.3%) |
0.5% |
0.1% |
|
Apartments Average |
5.3% |
0.8% |
6.1% |
5.5% |
(0.1%) |
5.4% |
(0.2%) |
0.9% |
0.6% |
|
Residential Market Average |
4.8% |
0.7% |
5.5% |
4.9% |
(0.1%) |
4.8% |
(0.1%) |
0.8% |
0.7% |
|
· Average total returns registered a 0.7% points increase to 5.5% from the 4.8% registered in Q3’2020 with average rental yield and price appreciation coming in 4.8% and 0.7%, respectively. |
|||||||||
Source: Cytonn Research 2021
- Detached Units Performance
In Q3’2021, detached units recorded an improved y/y performance with average total returns coming in at 4.8% compared to 4.2% in Q3’2020. However, the performance was a 0.6% points q/q decline from the 5.4% total return recorded in H1’2021. Satellite towns were the best performing segment with an average total return of 6.0% attributable to an average rental yield of 4.5% and a 1.5% y/y price appreciation compared to the high end and upper mid-end segments with average total returns at 3.9% and 4.7%, respectively. The overall best performing node was Ngong with an average total return of 7.1% attributable to a relatively high average rental yield of 5.3%. Syokimau/Mlolongo came in second with an average total return at 6.6% while Karen and Kitengela tied in third position with a total return 5.9%. Runda was the lowest performing node with an average total return of 1.3%, 3.5% points lower than the detached market average of 4.8%.
(All values in Kshs unless stated otherwise)
|
Detached Units Performance |
||||||||
|
Area |
Average of Price per SQM Q3'2021 |
Average of Rent per SQM Q3'2021 |
Average of Occupancy Q3'2021 |
Average of Uptake Q3'2021 |
Average of Annual Uptake Q3'2021 |
Average of Rental Yield Q3'2021 |
Average of Price Appreciation Q3'2021 |
Average of Total Returns Q3’2021 |
|
High-End |
||||||||
|
Karen |
204,668 |
714 |
84.9% |
90.4% |
16.7% |
3.5% |
2.4% |
5.9% |
|
Rosslyn |
173,402 |
880 |
77.3% |
93.1% |
14.5% |
4.5% |
0.9% |
5.4% |
|
Lower Kabete |
152,536 |
433 |
85.0% |
87.6% |
18.3% |
2.9% |
1.0% |
3.9% |
|
Kitisuru |
214,795 |
625 |
92.4% |
92.6% |
15.4% |
3.6% |
(0.6%) |
3.0% |
|
Runda |
241,080 |
820 |
95.0% |
97.0% |
11.1% |
4.2% |
(2.9%) |
1.3% |
|
Average |
197,296 |
694 |
86.9% |
92.1% |
15.2% |
3.7% |
0.2% |
3.9% |
|
Upper Mid-End |
||||||||
|
Lavington |
175,804 |
621 |
88.1% |
81.5% |
11.8% |
3.7% |
2.0% |
5.7% |
|
Ridgeways |
149,153 |
761 |
87.9% |
87.8% |
13.4% |
5.4% |
(0.4%) |
5.0% |
|
South B/C |
119,452 |
336 |
83.8% |
87.6% |
14.1% |
2.9% |
2.1% |
5.0% |
|
Loresho |
144,180 |
725 |
93.3% |
93.3% |
13.3% |
5.4% |
(0.8%) |
4.6% |
|
Langata |
136,381 |
660 |
92.6% |
93.6% |
11.7% |
5.2% |
(1.9%) |
3.3% |
|
Average |
144,994 |
620 |
89.1% |
88.8% |
12.9% |
4.5% |
0.2% |
4.7% |
|
Lower Mid-End |
||||||||
|
Ngong |
59,487 |
298 |
86.0% |
89.1% |
13.4% |
5.3% |
1.8% |
7.1% |
|
Syokimau/Mlolongo |
75,778 |
360 |
86.7% |
88.3% |
17.9% |
5.0% |
1.6% |
6.6% |
|
Kitengela |
71,019 |
319 |
81.6% |
89.1% |
15.1% |
4.2% |
1.7% |
5.9% |
|
Athi River |
74,863 |
319 |
78.2% |
99.5% |
21.7% |
4.0% |
1.7% |
5.7% |
|
Ruiru |
79,138 |
336 |
87.7% |
84.7% |
23.1% |
5.1% |
0.5% |
5.7% |
|
Rongai |
86,356 |
233 |
90.2% |
80.3% |
14.1% |
3.2% |
1.7% |
4.8% |
|
Average |
74,440 |
311 |
85.1% |
88.5% |
17.6% |
4.5% |
1.5% |
6.0% |
Source: Cytonn Research 2021
- Apartments Performance
In Q3’2021, apartments recorded a significant improvement in performance with the average total returns coming in at 6.1%, a 0.7% points y/y increase from the 5.4% recorded in Q3’2020, and 0.5% points q/q increase from 5.6% recorded in H1’2021. The average y/y price appreciation came in at 0.8% compared to a price correction of 0.1% in Q3’2020, while the average rental yield came in at 5.3%, a 0.2% points decline compared to 5.5% recorded during a similar period last year. In terms of segments, the upper mid-end segment was the best performing, with an average total return of 6.2% attributable to an average rental yield of 5.2% and an average y/y price appreciation of 0.9%. Overall, Dagoretti was the best performing node with an average total return of 8.6% while South C and South B followed with average total returns at 8.2% and 7.8%, respectively. Loresho was the lowest performing node with an average total return of 2.3% attributable to a relatively low average rental yield of 4.6% and an average y/y price correction of 2.3%.
(All values in Kshs unless stated otherwise)
|
Apartments Performance |
||||||||
|
Area |
Average of Price per SQM Q3'2021 |
Average of Rent per SQM Q3'2021 |
Average of Occupancy Q3'2021 |
Average of Uptake Q3'2021 |
Average of Annual Uptake Q3'2021 |
Average of Rental Yield Q3'2021 |
Average of Price Appreciation Q3’2021 |
Average of Total Returns Q3’2021 |
|
Upper Mid-End |
||||||||
|
Westlands |
145,951 |
833 |
70.0% |
92.3% |
27.9% |
4.6% |
3.0% |
7.6% |
|
Upperhill |
143,085 |
868 |
79.3% |
85.8% |
11.8% |
5.5% |
1.5% |
7.0% |
|
Kilimani |
107,179 |
594 |
85.7% |
91.3% |
23.9% |
5.7% |
1.2% |
6.9% |
|
Parklands |
117,893 |
616 |
77.3% |
87.6% |
20.7% |
4.6% |
1.9% |
6.6% |
|
Kileleshwa |
131,915 |
754 |
89.8% |
83.2% |
16.8% |
6.3% |
0.3% |
6.6% |
|
Loresho |
119,778 |
514 |
89.3% |
88.5% |
10.4% |
4.6% |
(2.3%) |
2.3% |
|
Average |
127,634 |
696 |
81.9% |
88.1% |
18.6% |
5.2% |
0.9% |
6.2% |
|
Lower Mid-End Suburbs |
||||||||
|
Dagoretti |
87,004 |
554 |
82.2% |
95.7% |
20.9% |
6.1% |
2.5% |
8.6% |
|
South C |
110,586 |
721 |
87.0% |
62.6% |
15.0% |
6.8% |
1.4% |
8.2% |
|
South B |
95,063 |
503 |
90.3% |
94.6% |
19.0% |
5.8% |
2.0% |
7.8% |
|
Langata |
114,187 |
491 |
89.9% |
85.7% |
15.4% |
4.7% |
2.2% |
6.9% |
|
Waiyaki Way |
84,604 |
480 |
76.7% |
79.0% |
19.9% |
5.2% |
1.5% |
6.7% |
|
Kahawa West |
77,057 |
333 |
74.5% |
86.3% |
10.2% |
4.0% |
2.2% |
6.2% |
|
Donholm & Komarock |
71,971 |
327 |
92.8% |
88.7% |
13.8% |
5.1% |
0.5% |
5.7% |
|
Imara Daima |
82,690 |
423 |
77.8% |
82.0% |
12.8% |
5.0% |
(0.7%) |
4.3% |
|
Race Course/Lenana |
98,784 |
615 |
77.3% |
84.7% |
23.6% |
5.6% |
(1.5%) |
4.0% |
|
Lower Kabete |
109,863 |
493 |
84.0% |
84.4% |
24.4% |
4.7% |
(1.9%) |
2.9% |
|
Average |
93,181 |
494 |
83.3% |
84.4% |
17.5% |
5.3% |
0.8% |
6.1% |
|
Lower Mid-End Satellite Towns |
||||||||
|
Rongai |
97,664 |
344 |
86.5% |
89.3% |
19.6% |
5.6% |
2.1% |
7.7% |
|
Thindigua |
94,549 |
468 |
80.5% |
88.8% |
21.1% |
5.1% |
2.3% |
7.4% |
|
Kikuyu |
82,114 |
460 |
74.8% |
82.4% |
18.3% |
5.0% |
2.3% |
7.4% |
|
Ngong |
63,446 |
346 |
73.7% |
74.5% |
12.2% |
5.0% |
2.1% |
7.1% |
|
Ruaka |
107,629 |
522 |
92.4% |
84.1% |
23.8% |
5.5% |
1.1% |
6.6% |
|
Ruiru |
89,249 |
493 |
84.3% |
82.1% |
20.7% |
5.6% |
0.5% |
6.1% |
|
Syokimau |
64,953 |
334 |
84.2% |
81.3% |
11.9% |
5.5% |
(1.8%) |
3.7% |
|
Kitengela |
59,394 |
242 |
93.0% |
83.1% |
10.0% |
4.7% |
(1.3%) |
3.4% |
|
Athi River |
58,769 |
353 |
70.0% |
89.0% |
10.9% |
5.7% |
(2.7%) |
3.0% |
|
Average |
79,752 |
396 |
82.2% |
83.8% |
16.5% |
5.3% |
0.5% |
5.8% |
Source: Cytonn Research 2021
Notable residential sector highlights include (see our Cytonn Monthly August 2021 and Cytonn Monthly July 2021) and;
- National Housing Corporation (NHC) began the demolition of 792 detached units in Changamwe Estate in Mombasa County, to pave way for Phase II upgrade of the Estate valued at Kshs 0.4 bn. For more information, see Cytonn Weekly #38/2021, and,
- Gulf African Bank Limited launched a mortgage facility that will see home buyers access mortgage loans at 11.8% p.a, 1.2% points lower than the 13.0% interest rate currently offered by the bank. Additionally, Purple Dot International Limited, a local real estate developer, began the handing over of its Kshs 1.0 bn Marigold gated community development off Link Road in Lang’ata constituency. For more information, see Cytonn Weekly #36/2021.
Our outlook for the residential sector is NEUTRAL as we expect the sector to continue recording increased activities supported by the affordable housing initiative, and availability of affordable mortgages through the Kenya Mortgage Refinance Company (KMRC) and lending institutions such as banks and SACCOs working in conjunction with developers to a diverse number of clients with flexible repayment terms. However the sector continues to be weighed down by factors such as i) the sluggishness in the affordable housing initiative since we are yet to see a significant number of the targeted 500,000 units by 2022 availed, ii) low mortgage uptake from the high interest rates and the increase in the sector non-performing loans, iii) under-developed capital markets making it hard to develop pools of capital focused on housing development or mortgage financing, and, iv) high property prices in the midst of a tough economic environment.
- Commercial Office Sector
In Q3’2021 the Nairobi Metropolitan Area (NMA) commercial office sector recorded average rental yields of 6.9%, representing a 0.1% points decline from 7.0% recorded in FY’2020, and 0.3% y/y decline from 7.2% recorded in Q3’2020. This was mainly attributed to the subdued rental rates which came in at Kshs 92.7 per SQFT in Q3’2021, a 0.4% and 1.6% decline compared to the Kshs 93.1 and Kshs 94 per SQFT recorded in FY’2020 and Q3’2020, respectively. The average occupancy rates also realized a decline of 0.4% to 77.3% in Q3’2021 compared to the 77.7% recorded in FY’2020 attributable to the low but rising demand for physical office spaces which is as a result of businesses continuing to embrace the working from home strategy and may make it as permanent measure, coupled with the 7.3 mn SQFT office space oversupply as at 2020 hence developers halting their construction plans as they await absorption of the existing spaces. The average asking prices per SQFT also recorded a decline of 0.6% to Kshs 12,211 from Kshs 12,280 in FY’2020 attributed to landlords giving concessions with the aim of attracting tenants and corporate firms to take up commercial spaces with the aim of remaining competitive in the wake of declining demands.
The table below highlights the performance of the Nairobi Metropolitan Area Commercial Office sector over time:
All Values in Kshs unless stated otherwise
|
Nairobi Metropolitan Area (NMA) Commercial Office Returns Over Time |
||||||||
|
Year |
Q1'2020 |
H1’2020 |
Q3' 2020 |
FY'2020 |
Q1'2021 |
H1'2021 |
Q3’2021 |
∆ FY'2020/Q3'2021 |
|
Occupancy % |
81.7% |
80.0% |
79.9% |
77.7% |
76.3% |
75.8% |
77.3% |
(0.4%) Points |
|
Asking Rents (Kshs/SQFT) |
96.7 |
95.1 |
94.2 |
93.1 |
92.0 |
92.8 |
92.7 |
(0.4%) |
|
Average Prices (Kshs/SQFT) |
12,535 |
12,516 |
12,479 |
12,280 |
12,228 |
12,224 |
12,211 |
(0.6%) |
|
Average Rental Yields (%) |
7.8% |
7.3% |
7.2% |
7.0% |
6.8% |
6.9% |
6.9% |
(0.1%) Points |
Source: Cytonn Research 2021
Gigiri and Westlands were the best performing submarkets in Q3’2021 recording average rental yields of 8.4% and 7.9%, respectively, representing 1.5% and 1.0% points higher than the market average of 6.9%, respectively. This was attributed to their superior locations which recorded prime rental rates at Kshs 116 and Kshs 104 per SQFT, respectively against a market average of Kshs 93, due to the good infrastructure within the areas promoting accessibility, the availability of top quality grade A and B offices, and availability of amenities in the surrounding areas.
Mombasa road recorded the lowest rental yields of 4.7% against the market average of 6.9% due to the low average rental rates of Kshs 71 per SQFT against the market’s average at Kshs 93 per SQFT. This was mainly attributed to the zoning regulations as Mombasa Road is mainly considered as an industrial area hence minimal investor appetite for its commercial office sector, and, low quality office spaces and traffic snarl-ups affecting accessibility which has been worsened by the ongoing construction activities.
The table below shows the Nairobi Metropolitan Area (NMA) sub-market performance;
All values in Kshs unless stated otherwise
|
Nairobi Metropolitan Area Commercial Office Submarket Performance Q3’2021 |
|||||||||||
|
Area |
Price (Kshs) /SQFT Q3’2021 |
Rent (Kshs) /SQFT Q3’2021 |
Occupancy (%) Q3’2021 |
Rental Yields (%) Q3’2021 |
Price Kshs/ SQFT FY 2020 |
Rent Kshs/SQFT FY 2020 |
Occupancy FY 2020(%) |
Rental Yield (%) FY 2020 |
∆ in Rent |
∆ in Occupancy (% points) |
∆ in Rental Yields (% points) |
|
Gigiri |
13,375 |
116 |
81.3% |
8.4% |
13,400 |
116 |
82.5% |
8.5% |
0.2% |
(1.3%) |
(0.1%) |
|
Westlands |
12,038 |
104 |
75.6% |
7.9% |
11,975 |
104 |
74.4% |
7.8% |
0.5% |
1.2% |
0.1% |
|
Parklands |
10,963 |
94 |
79.1% |
7.9% |
10,958 |
93 |
79.9% |
7.6% |
1.1% |
(0.8%) |
0.3% |
|
Karen |
13,325 |
104 |
84.8% |
7.5% |
13,567 |
106 |
83.6% |
7.8% |
(1.8%) |
1.3% |
(0.3%) |
|
Kilimani |
12,293 |
92 |
79.8% |
7.1% |
12,233 |
93 |
79.1% |
6.8% |
(0.7%) |
0.7% |
0.3% |
|
Upperhill |
12,432 |
93 |
77.1% |
6.7% |
12,684 |
92 |
78.5% |
6.9% |
0.9% |
(1.3%) |
(0.2%) |
|
Nairobi CBD |
11,720 |
81 |
80.5% |
6.7% |
11,889 |
82 |
82.4% |
6.8% |
(1.6%) |
(1.9%) |
(0.1%) |
|
Thika Road |
12,500 |
79 |
76.7% |
5.6% |
12,500 |
80 |
76.1% |
5.8% |
(0.9%) |
0.5% |
(0.2%) |
|
Mombasa Road |
11,250 |
71 |
61.3% |
4.7% |
11,313 |
73 |
63.0% |
4.8% |
(2.7%) |
(1.8%) |
(0.2%) |
|
Average |
12,211 |
93 |
77.3% |
6.9% |
12,280 |
93 |
77.7% |
7.0% |
(0.5%) |
(0.4%) |
(0.1%) |
Source: Cytonn Research 2021
We retain a NEGATIVE outlook for NMA’s commercial office sector whose performance continues to be majorly affected by the existing oversupply at 7.3 mn SQFT, coupled with the working from home strategy which is still being embraced by various firms that may make it a permanent strategy thereby affecting demand.
- Retail Sector
In Q3’2021, the Nairobi Metropolitan Area (NMA) retail market recorded an average rental yield of 7.5%, similar to FY’2020. The average occupancy rates came in at 75.8%, a 0.6% increase from the 75.2% realized in FY’2020, attributed to; i) increased demand for retail spaces evidenced by retailers such as Naivas, Carrefour and Quickmart aggressively taking up new spaces and other spaces previously occupied by troubled retailers, ii) infrastructural developments opening up areas for retail investments, and iii) positive demographics with Kenya’s high urbanization and population growth rates at 4.0% p.a and 2.3% p.a, against the global average of 1.9% p.a and 1.1% p.a, respectively according to World Bank. Rental rates remained low at Kshs 168 per SQFT in Q3’2021 compared to Kshs 169 per SQFT recorded in FY’2020 as a result of landlords offering lower rental rates to attract new tenants as well as retain existing ones, and the growing e-commerce thereby causing reduced demand for physical retail spaces.
The performance of the retail sector in Nairobi over time is shown below;
|
Summary of Retail Sector Performance Over Time |
|||||||||
|
Item |
FY' 2019 |
Q1'2020 |
H1' 2020 |
Q3' 2020 |
FY' 2020 |
Q1' 2021 |
H1' 2021 |
Q3' 2021 |
∆ FY’ 2020 |
|
Average Asking Rents (Kshs/SQFT) |
176 |
173 |
170 |
169 |
169 |
166 |
168 |
168 |
(0.5) |
|
Average Occupancy (%) |
75.9% |
76.3% |
74.0% |
74.2% |
75.2% |
75.0% |
75.8% |
75.8% |
0.7% (Points) |
|
Average Rental Yields |
7.8% |
7.7% |
7.4% |
7.4% |
7.5% |
7.4% |
7.5% |
7.5% |
0.0% (Points) |
Source: Cytonn Research 2021
In terms of the sub markets performance, Westlands and Karen were the best performing nodes with average rental yields of 9.7% and 9.4% respectively, which is 2.2% and 1.9% points higher than the market average of 7.5%. This was mainly attributed to the higher average rental and occupancy rates which came in at Kshs 209 per SQFT and 80.4%, respectively in Westlands, and Kshs 214 per SQFT and 80.8%, respectively in Karen against the market average of Kshs 168 per SQFT and 75.8%, respectively. The performance is also attributed to the presence of affluent citizens who are mostly high income earners with high consumer purchasing power coupled with the presence of adequate amenities and infrastructure in the areas.
Eastlands ranked last, recording declines in the average rental yields by 0.2% points from 6.1% in 2020 to 5.9% in 2021 due to the low rental rates which declined by 1.5% from Kshs 137 per SQFT to Kshs 135 per SQFT against a market average of 168. The occupancy rates came in at 72.5%, 1.3% points lower than the market average of 75.8% as a result of the relatively high competition from the existing informal retail centers and stores. The table below shows the submarket performance of nodes in the Nairobi Metropolitan Area (NMA):
All Values in Kshs unless stated otherwise
|
Nairobi Metropolitan Area (NMA) Q3’2021 Retail Performance |
|||||||||
|
Area |
Rent (Kshs)/SQFT Q3’ 2021 |
Occupancy % Q3’ 2021 |
Rental Yield Q3’ 2021 |
Rent Kshs/SQFT FY’ 2020 |
Occupancy FY’ 2020 |
Rental Yield FY’ 2020 |
2021 ∆ in Rental Rates |
2021 ∆ in Occupancy (% points) |
2021 ∆ in Rental Yield (% points) |
|
Westlands |
209 |
80.4% |
9.7% |
209 |
81.5% |
9.9% |
(0.1%) |
(1.1%) |
(0.1%) |
|
Karen |
214 |
80.8% |
9.4% |
216.5 |
81.0% |
9.8% |
(1.4%) |
(0.2%) |
(0.4%) |
|
Kilimani |
172 |
83.6% |
9.0% |
171 |
82.5% |
8.5% |
0.6% |
1.1% |
0.5% |
|
Ngong Road |
175 |
78.0% |
7.8% |
178 |
80.3% |
8.2% |
(1.8%) |
(2.3%) |
(0.4%) |
|
Kiambu road |
178 |
70.4% |
7.2% |
176 |
67.5% |
6.9% |
0.7% |
2.9% |
0.2% |
|
Thika Road |
158 |
74.2% |
6.7% |
158 |
70.5% |
6.3% |
0.3% |
3.7% |
0.4% |
|
Satellite towns |
138 |
72.2% |
6.1% |
133 |
73.0% |
5.8% |
3.6% |
(0.8%) |
0.3% |
|
Mombasa road |
136 |
70.5% |
6.0% |
140 |
70.0% |
5.9% |
(2.6%) |
0.5% |
0.1% |
|
Eastlands |
135 |
72.5% |
5.9% |
137 |
70.2% |
6.1% |
(1.5%) |
2.3% |
(0.2%) |
|
Average |
168 |
75.8% |
7.5% |
169 |
75.2% |
7.5% |
(0.2%) |
0.7% |
0.0% |
Source: Cytonn Research 2021
Notable highlights in Q3’2021 include (See Cytonn H1’2021 Markets Review, Cytonn Monthly July 2021, and, Cytonn Monthly August 2021 highlights);
- French retailer Carrefour, announced plans to take up six new stores spaces in Uganda currently occupied by South African retailer Shoprite supermarket, in Uganda’s Acacia Mall, Village Mall, Victoria Mall, Lugogo Mall, Clock Tower, and Arena Mall, by the end of the year after Shoprite’s planned exit. For more analysis, please see Cytonn Weekly #37/2021,
- Naivas Supermarket, a local retailer, opened a new outlet in Juja City Mall taking up 37,000 SQFT of prime retail space that was previously occupied by Tuskys Supermarket. For more analysis see Cytonn Weekly #38/2021,
- During the week, QuickMart Supermarket, a local retail chain, opened a new outlet in Kisii’s Echiro Mall, taking up prime retail space previously occupied by Tuskys Supermarket. This brings QuickMart’s total operating outlets to 46 and the very first in Kisii County, with its decision supported by; i) need to step up competition with rivals such as Naivas that already has a presence in the county of focus, ii) increased population with Kisii having recorded 8.3% population increase from 1.2 mn in 2009 to 1.3 mn in 2019, thus creating need for more goods, services and retail spaces, and iii) availability of prime retail space left by troubled Tuskys, and,
- Additionally, during the week, Naivas supermarket announced plans to open two new stores in Nairobi’s Uchumi City Centre and in Malindi Mall, a move that will see it take prime retail spaces previously occupied by troubled Uchumi and Nakumatt supermarkets, respectively. This comes barely less than two weeks after the retailer opened a new outlet in Juja City Mall, signifying its rapid expansion drive to maintain its position as the top retailer in the country. The expected expansion is to occur in October 2021 hence will bring Naivas’ total operating outlets to 78, and 9 branches opened so far this year. Naivas’ decision is mainly supported by; i) exit of troubled retailers thereby leaving prime retail spaces for uptake, ii) stiff market competition from retailers such as Carrefour that has so far opened 5 branches this year hence need to defend its market leadership, and, iii) increased financial muscle having signed an agreement with Amethis Finance, a France-based private equity (PE) fund to sell a 30 percent stake last year.
In terms of performance, according to Kenya Retail Report 2021, Nairobi recorded rental yields of 7.5%, 0.7% points higher than the market average of 6.8%, thus presenting a good investment opportunity for the retailer.
The performance of the key urban centers in Kenya is as summarized below;
All values in Kshs unless stated otherwise
|
Summary of Retail Performance in Key Urban Cities in Kenya 2021 |
||||||||
|
Region |
Rent (Kshs) 2021 |
Occupancy Rate 2021 |
Rental yield 2021 |
Rent (Kshs) 2020 |
Occupancy Rate 2020 |
Rental yield 2020 |
Change in Occupancy Y/Y |
Change in Yield Y/Y |
|
Mount Kenya |
128 |
81.7% |
7.9% |
125 |
78.0% |
7.7% |
3.7% |
0.1% |
|
Nairobi |
168 |
75.8% |
7.5% |
169 |
74.5% |
7.5% |
1.3% |
0.0% |
|
Mombasa |
119 |
77.6% |
6.8% |
114 |
76.3% |
6.6% |
1.4% |
0.2% |
|
Kisumu |
101 |
74.6% |
6.4% |
97 |
74.0% |
6.3% |
0.6% |
0.1% |
|
Eldoret |
131 |
80.8% |
6.3% |
130 |
80.2% |
5.9% |
0.6% |
0.4% |
|
Nakuru |
59 |
80.0% |
6.1% |
58 |
76.6% |
5.9% |
3.4% |
0.2% |
|
Average |
118 |
78.4% |
6.8% |
115 |
76.6% |
6.7% |
1.8% |
0.1% |
Source: Cytonn Research 2021
The table below shows the summary of the number of stores of the Key local and international retailer supermarket chains in Kenya;
|
Main Local and International Retail Supermarket Chains |
|||||||||
|
Name of Retailer |
Category |
Highest number of branches that have ever existed as at FY’2018 |
Highest number of branches that have ever existed as at FY’2019 |
Highest number of branches that have ever existed as at FY’2020 |
Number of branches opened in 2021 |
Closed branches |
Current number of Branches |
Number of branches expected to be opened |
Projected number of branches FY’2021 |
|
Naivas |
Local |
46 |
61 |
69 |
7 |
0 |
76 |
6 |
82 |
|
QuickMart |
Local |
10 |
29 |
37 |
9 |
0 |
46 |
0 |
46 |
|
Chandarana |
Local |
14 |
19 |
20 |
1 |
0 |
21 |
2 |
23 |
|
Carrefour |
International |
6 |
7 |
9 |
5 |
0 |
16 |
0 |
16 |
|
Cleanshelf |
Local |
9 |
10 |
11 |
1 |
0 |
12 |
0 |
12 |
|
Tuskys |
Local |
53 |
64 |
64 |
0 |
61 |
3 |
0 |
3 |
|
Game Stores |
International |
2 |
2 |
3 |
0 |
0 |
3 |
0 |
0 |
|
Uchumi |
Local |
37 |
37 |
37 |
0 |
35 |
2 |
0 |
2 |
|
Choppies |
International |
13 |
15 |
15 |
0 |
13 |
2 |
0 |
2 |
|
Shoprite |
International |
2 |
4 |
4 |
0 |
4 |
0 |
0 |
0 |
|
Nakumatt |
Local |
65 |
65 |
65 |
0 |
65 |
0 |
0 |
0 |
|
Total |
257 |
313 |
334 |
23 |
178 |
181 |
8 |
186 |
|
Source: Online Search
Our outlook for the retail sector is NEUTRAL due to factors such as oversupply at 1.7 mn SQFT in the Kenyan retail sector and 3.0 mn SQFT in the NMA retail sector, online shopping and e-commerce strategy still being embraced, and, financial constraints still impeding performance of the sector. However, factors like increasing infrastructure developments opening areas for investments, rapid expansion moves by retailers such as Naivas, and positive demographics, are expected to cushion the performance of the market.
- Hospitality Sector
In Q3’2021, three hospitality related industrial reports were released and below are the key take outs;
|
# |
Report |
Key Take-outs |
|
1 |
· International arrivals through Jomo Kenyatta International Airport (JKIA) and Moi International Airport (MIA) registered an improvement from 1,177 visitors in Q2’2020 to 113,307 in Q2’2021. For more information, see Cytonn Weekly #33/2021. |
|
|
2 |
· The number of operational hotels in June 2021 increased by 2.0% points to 96.0% from the 94.0% recorded in the May 2021. For more information, see Cytonn Weekly #31/2021. |
|
|
3 |
Tourism Research Institute International Tourism Performance Report January to June 2021 |
· Kenya registered a 21.7% decline in the number of international arrivals to 305,635 persons between January and June 2021, when compared to a similar period in 2020. For more information, see Cytonn Weekly #28/2021. |
Some of the major highlights in Q3’2021 relating to the hospitality sector include;
- In September, the United Kingdom (UK) removed Kenya from the ‘Red List’ of countries banned from entering the UK. For more information, see Cytonn Weekly #38/2021,
- The Ministry of Tourism through the Tourism Fund Corporation announced plans to engage in Public Private Partnership (PPP) deal to complete the construction of Crab Utalii Hotel worth Kshs 5.9 bn, on a 20.0 are piece of land in Vipingo Kilifi County. For more information, see Cytonn Weekly #33/2021,
- In August, the United States of America (USA) raised Kenya’s travel advisory alert from level two to level three, amidst concerns of the increasing Covid 19-Delta variant. For more information, see Cytonn Weekly #32/2021, and,
- In July, the British government announced that the United Kingdom had retained Kenya in its ‘Red List’ of countries whose nationals are barred from entering the United Kingdom (UK) due to concerns of the Covid-19 Delta variant. For more information, see Cytonn Weekly #29/2021.
The hospitality sector is expected to return to pre-Covid normalcy levels in 2024 attributable to the slow monitoring of situations relating to the handling of the Covid-19 pandemic before the relaxation of measures that had initially been put in place.
We however maintain a NEUTRAL outlook attributable to the intensifying supporting activities such as i) the mass vaccination that has led to countries such as the UK to abate its travel restrictions, ii) the return of flights from major destinations that had initially stalled due to travel bans and Covid-19 regulatory guidelines, iii) the rise in confidence for the industry evidenced by increasing number of operational hotels and the rise in bed occupancies from H1’2021, and, iv) the aggressive marketing of Kenya as a tourist destination in International markets such as the Ukraine through the Magical Kenya platform.
- Land Sector
The Nairobi Metropolitan Area (NMA) land sector recorded an average annualized capital appreciation of 1.7% in Q3’2021, with land prices in the satellite towns realizing the highest capital appreciation at 4.5% as a result of the availability and affordability of land in the areas at Kshs 13.3 mn per acre against the market average of Kshs 134.6 mn per acre thereby leading to increased demand. Land in the commercial suburbs of the NMA recorded the highest price correction of 2.1%, attributed to minimal demand for land in the areas as developers withhold their construction plans awaiting the absorption of existing spaces such as the oversupplied office market by 7.3 mn SQFT, coupled with their high prices at Kshs 406.5 mn per acre against a market average of Kshs 134.6 mn per acre.
The table below shows the performance of the sector during the quarter:
All Values in Kshs Unless Stated Otherwise
|
Nairobi Metropolitan Area (NMA) Land Performance Q3'2021 |
|||
|
|
Price Per Acre Q3'2020 |
Price per acre Q3'2021 |
Annualized Capital Appreciation |
|
Satellite Towns-Unserviced Land |
12.7 mn |
13.3 mn |
4.5% |
|
Nairobi Suburbs- Low Rise Residential Areas |
94.1 mn |
96.8 mn |
3.3% |
|
Satellite Towns-Serviced land |
15.2 mn |
15.5 mn |
2.0% |
|
Nairobi Suburbs- High Rise Residential Areas |
140.9 mn |
141.0 mn |
0.6% |
|
Nairobi Suburbs- Commercial Areas |
415.2 mn |
406.5 mn |
(2.1%) |
|
Average |
135.6 mn |
134.6 mn |
1.7% |
Source: Cytonn Research 2021
Performance per node
- The asking prices for land in the satellite towns recorded an annual price appreciation of 4.5% in Q3’2021 mainly attributed to the availability of land, improving infrastructure developments opening areas for investments, and affordability of land in the areas at Kshs 13.3 mn per acre against the market average of Kshs 134.6 mn per acre thereby leading to increased demand as well. Juja was the best performing submarket with an annual price appreciation of 10.1% attributed to; i) affordability of land prices at Kshs 12.0 mn per acre against the market average of Kshs 13.3 mn per acre, ii) the availability of infrastructure with the area being served by roads such as Thika Superhighway, iii) increased demand as a result of an increased population in Ruiru constituency where Juja lies, by 35.1% to 371,111 in 2019 from 241,007 in 2009, and, iv) the rising student population in the area from institutions such as Jomo Kenyatta University of Agriculture and Technology. According to Kenya National Bureau of Statistics, the number of available student housing in Kenya was at 300,000 in 2020 against a university enrolment of 509,473, hence the investment opportunity in the market gap.
All Values in Kshs Unless Stated Otherwise
|
Satellite Towns-Unserviced Land |
|||
|
Location |
Price Per Acre Q3'2020 |
Price Per Acre Q3'2021 |
Annualized Capital Appreciation |
|
Juja |
10.9 mn |
12.0 mn |
10.1% |
|
Rongai |
12.8 mn |
13.5 mn |
5.1% |
|
Limuru |
19.2 mn |
20.0 mn |
4.2% |
|
Athi River |
4.8 mn |
4.9 mn |
2.1% |
|
Utawala |
15.8 mn |
16.0 mn |
1.0% |
|
Average |
12.7 mn |
13.3 mn |
4.5% |
Source: Cytonn Research 2021
- Land prices in the low rise residential areas of the NMA recorded an annual capital appreciation of 3.3% in Q3’2021 attributed to adequate amenities and infrastructure, high demand, and attractiveness due to their serenity and privacy as they are sparsely populated. Kitisuru was the best performing submarket with annual capital appreciation coming in at 5.7% as a result of a relatively high demand for land, whereas Spring Valley recorded the lowest capital appreciation at 1.2% due to unaffordability and reduced demand resulting from relatively high prices at Kshs 169.5 mn per acre when compared to a market average of Kshs 96.8 mn per acre.
All Values in Kshs Unless Stated Otherwise
|
Low Rise Residential Areas |
|||
|
Location |
Price Per Acre Q3'2020 |
Price Per Acre Q3'2021 |
Annualized Capital Appreciation |
|
Kitisuru |
82.2 mn |
86.9 mn |
5.7% |
|
Karen |
61.0 mn |
63.3 mn |
3.7% |
|
Runda |
78.7 mn |
81.2 mn |
3.2% |
|
Ridgeways |
81.0 mn |
83.0 mn |
2.5% |
|
Spring Valley |
167.5 mn |
169.5 mn |
1.2% |
|
Average |
94.1 mn |
96.8 mn |
3.3% |
Source: Cytonn Research 2021
- Serviced land in the satellite towns of Nairobi realized an annual capital appreciation of 2.0% in Q3’2021 with Thika being the best performing submarket with price appreciations of 4.6% against the market’s average of 2.0%, mainly attributed to; i) an increased demand, ii) ease of access to amenities, iii) adequate infrastructure with the area being served by Thika road, iv) its recognition as an institutional hub with some of the institutions being the Mount Kenya University and Kenya Medical Training College, thereby being attractive to masses and investors, and v) affordability of land in the area which recorded average prices of Kshs 11.0 mn per acre against the market’s Kshs 15.5 mn per acre. Ruai recorded the highest price correction of (1.0%) as result of minimal demand for land in the area.
All Values in Kshs Unless Stated Otherwise
|
Satellite Towns-Serviced Land |
|||
|
Location |
Price Per Acre Q3'2020 |
Price Per Acre Q3'2021 |
Annualized Capital Appreciation |
|
Thika |
10.5 mn |
11.0 mn |
4.6% |
|
Ruiru-Juja |
22.9 mn |
23.8 mn |
3.9% |
|
Syokimau |
14.7 mn |
15.2 mn |
3.1% |
|
Athi River |
13.8 mn |
14.1 mn |
2.1% |
|
Rongai |
17.1 mn |
17.0 mn |
(0.4%) |
|
Ruai |
12.3 mn |
12.2 mn |
(1.0%) |
|
Average |
15.2 mn |
15.5 mn |
2.0% |
Source: Cytonn Research
- The asking land prices in the high-rise residential areas recorded a 0.6% annualized capital appreciation in Q3’2021 with Embakasi being the best performing submarket with an appreciation of 3.4% mainly attributable to affordability of land prices averaging at Kshs 70.3 mn per acre compared to the node’s average at Kshs 141.0 mn leading to increased demand particularly by the middle income class, and availability of infrastructure with the area being served by the Airport Road and part of the Outer Ring Road.
All Values in Kshs Unless Stated Otherwise
|
High Rise Residential Areas |
|||
|
Location |
Price Per Acre Q3'2020 |
Price Per Acre Q3'2021 |
Annualized Capital Appreciation |
|
Embakasi |
68.0 mn |
70.3 mn |
3.4% |
|
Kasarani |
73.5 mn |
73.8 mn |
0.4% |
|
Kileleshwa |
319.7 mn |
318.5 mn |
(0.4%) |
|
Dagoretti |
102.4 mn |
101.5 mn |
(0.9%) |
|
Average |
140.9 mn |
141.0 mn |
0.6% |
Source: Cytonn Report 2021
- Land in the commercial suburbs of the NMA recorded the highest price correction of 2.1%, attributed to minimal demand for land in the areas as developers withhold their construction plans awaiting the absorption of existing spaces such as the oversupplied office market by 7.3 mn SQFT, coupled with their high prices at Kshs 406.5 mn per acre against a market average of Kshs 134.6 mn per acre limiting investment opportunities.
All Values in Kshs Unless Stated Otherwise
|
Nairobi Suburbs- Commercial Zones |
|||
|
Location |
Price Per Acre Q3'2020 |
Price Per Acre Q3'2021 |
Annualized Capital Appreciation |
|
Westlands |
451.4 mn |
447.1 mn |
(0.9%) |
|
Riverside |
337.6 mn |
329.2 mn |
(2.5%) |
|
Kilimani |
388.7 mn |
379.1 mn |
(2.5%) |
|
Upperhill |
483.2 mn |
470.8 mn |
(2.6%) |
|
Average |
415.2 mn |
406.5 mn |
(2.1%) |
Source: Cytonn Research
We hold a POSITIVE outlook for the NMA land sector which continues to show resilience despite the ongoing pandemic which has affected some of the real estate sectors supported by factors such as; i) positive demographics, ii) growing demand for land particularly in the satellite areas, iii) improving infrastructure thereby opening up areas for investment, and, iv) the continued focus on the affordable housing initiative.
- Infrastructure
Key highlights in Q3’2021 include;
- Kenya’s East African Community Principal Secretary, Dr. Kevit Desai, announced that the upgrading of the old 460 Km Naivasha-Malaba meter gauge railway linking Kenya to Uganda will be completed in October 2021. For more information, see Cytonn Weekly #37/2021,
- The national government through the Kenya Rural Roads Authority (KeRRA) began the tarmacking of the 55.0 Km Msau-Mbale-Werugha-Mgange-Bura road project at a cost of Kshs 2.0 bn in Taita Taveta County. Additionally, the Kenya Rural Roads Authority (KeRRA) announced plans to construct the 78.0 Km Kamukunji-Kisanana-Kipkitur-Lake Bogoria road worth Kshs 3.7 bn in Baringo County through Intex Construction Limited, a local contractor. For more information, see Cytonn Weekly #33/2021, and,
- The Kenya Roads Board (KRB), the agency overseeing development of roads in Kenya, announced that the estimated value of roads in Kenya is currently stands at Kshs 3.5 tn. Additionally, the Cabinet Secretary for Ministry of Transport, Infrastructure, Housing and Urban Development, Hon. James Macharia, announced that the 27.0 Km Nairobi Expressway project will be completed by February 2022 (six months ahead of its initial December 2022 completion date). For more information, see Cytonn Weekly #28/2021.
The government continues to facilitate provision, maintenance and management of infrastructure in support of Vision 2030 aspirations in order to provide safe, efficient, accessible and sustainable transportation services aimed at stimulating the economy which is now on the expansion stage following Covid-19 recession. Infrastructural developments are expected to open up areas for investments and enhance efficient real estate supply chains.
- Statutory Reviews
In Q3’2021, major policy reviews included;
- The government of Kenya, through the Ministry of Lands and Physical Planning, published the Draft National Land Surveying and Mapping Policy, 2021 to guide the practice of land surveying and mapping in various sectors of the economy. For more information, see Cytonn Weekly #34/2021, and,
- President Uhuru Kenyatta signed into law the Finance Bill, 2021. A key highlight in the real estate sector was the re-introduction of a 20.0% excise duty on fees and other commissions earned on loans by financial institutions which risks making credit costly for home owners and developers as lenders will transfer the burden to borrowers. For more information, see Cytonn Weekly #27/2021.
- Listed Real Estate
In the Nairobi Stock Exchange (NSE), the ILAM Fahari I-REIT closed the quarter trading at an average price of Kshs 6.8 per share, representing a 17.2% increase in the Year-to-Date (YTD) performance from Kshs 5.8 per share and a 1.5% Month-to-Date (MTD) increase from Kshs 6.7 per share. However, on an Inception-to-Date (ITD) basis, this was a 66.0% decline from Kshs 20.0 inception price in November 2015. In the Unquoted Securities Platform (USP), latest weekly data from the NSE indicated that the D-REIT and I-REIT were trading at Kshs 20.2 and Kshs 20.6 per unit representing a 0.9% and 3.1% increase in the inception to date performance, each having been issued at 20.0 per unit. The total issued units for the I-REIT and D-REIT were 167.0 mn units and 215.4 mn units with a market cap of Kshs 3.4 mn and 4.4 mn, respectively.
The graph below shows the REIT’s performance from November 2015 to September 2021:
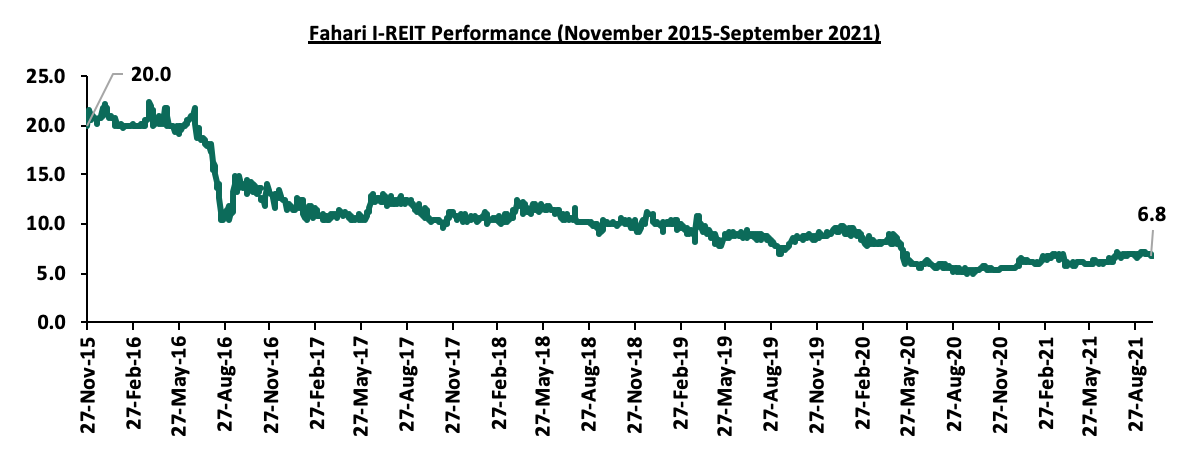
We have a NEUTRAL outlook for the sector whose performance is expected to continue being hindered by factors such as subdued performance of some real estate sectors due to the COVID-19 pandemic, general lack of knowledge and interest in the REIT, and the high minimum investment amounts set at Kshs 5.0 mn. Despite this, some of benefits of the REIT include low cost exposure to real estate, tax exemption, and diversification among many others.
Real Estate Performance Summary and Outlook
Below is a summary of the sectorial performance in H1’2020 and investment opportunities;
|
Theme |
Thematic Performance and Outlook Q3’2021 |
Outlook |
|
Residential |
· The residential sector recorded improved performance with a 0.7% points y/y increase in average total returns to 5.5% from the 4.8% recorded in Q3’2021. The average total returns remained flat compared to H1’2021 which also recorded total average returns of 5.5% |
Neutral |
|
· We expect total returns to investors to improve supported by improved rental rates and capital appreciation of properties given the economic expansion · Investment opportunity for detached units lies in Ngong, Syokimau/Mlolongo, Kitengela and Karen, while for apartment’s opportunity lies in Dagoretti, South B and South C which posted high returns. |
||
|
Office |
· In Q3’2021 the commercial office sector recorded average rental yields of 6.9%, representing a 0.1% points YTD decline from 7.0% recorded in FY’2020, and 0.3% y/y decline from 7.2% recorded in Q3’2020 attributed to reduced demand for office spaces and the existing office space oversupply at 7.3 mn SQFT |
Negative |
|
· Investment opportunity lies in Gigiri and Westlands which were the best performing submarkets recording average rental yields of 8.4% and 7.9%, respectively, representing 1.5% and 1.0% points, respectively higher than the market average of 6.9%. |
||
|
Retail |
· The NMA retail market recorded average rental yields of 7.5%, similar to FY’2020. The average occupancy rates came in at 75.8%, a 0.6% increase from the 75.2% realized in FY’2020 |
Neutral |
|
· We expect the sector to continue registering more developments and activities attributed to opening of the economy coupled with local and international retailers’ aggressiveness to take up space previously occupied by troubled retailers · Investment opportunity In terms of the sub markets performance lies in Westlands and Karen which were the best performing nodes with average rental yields of 9.7% and 9.4%, respectively which is 2.2% and 1.9% points higher than the market average of 7.5% |
||
|
Hospitality |
· The hospitality sector which heavily relies on tourism sector recorded improving performance evidenced by return of flights and industry confidence from the ongoing massive vaccination despite the travel bans by UK and USA travel advisory |
Neutral |
|
· We expect a return to pre-Covid normalcy levels in 2024 attributable to the slow monitoring of situations relating to the handling of the Covid-19 pandemic before the relaxation of measures that had initially been put in place |
||
|
Land |
· Land sector recorded an average annualized capital appreciation of 1.7% In Q3’ 2021, with land prices in the satellite towns realizing the highest capital appreciation at 4.5% |
Positive |
|
· We expect the performance of the land sector to continue being supported by factors such as; positive demographics, growing demand for land particularly in the satellite areas, improving infrastructure thereby opening up areas for investment and the continued focus on the affordable housing initiative |
||
|
Listed Real Estate |
· The ILAM Fahari I-REIT closed the quarter trading at an average price of Kshs 6.8 per share, representing a 17.2% Year-to-Date (YTD) increase from Kshs 5.8 per share and a 1.5% Month-to-Date (MTD) increase from Kshs 6.7 per share |
Neutral |
With the positive outlook for land sector, negative outlook for the commercial office sector and neutral outlook for the residential, retail, hospitality and REITs sectors, our overall outlook for the real estate sector is NEUTRAL with performance expected to be supported by; government support on affordable housing initiative, improving infrastructure, positive demographics, improving affordable mortgage availability, and aggressive retail space expansions. However, performance of the sector is likely to be constrained by reduced demand for office and retail spaces due to remote working and online shopping, reduced purchasing power of people due to the tough economic conditions and a non-supportive and under-developed capital markets hindering the pooling of funds for real estate developments.
Disclaimer: The views expressed in this publication are those of the writers where particulars are not warranted. This publication, which is in compliance with Section 2 of the Capital Markets Authority Act Cap 485A, is meant for general information only and is not a warranty, representation, advice or solicitation of any nature. Readers are advised in all circumstances to seek the advice of a registered investment advisor.

- Talk to us
- Kenya
- P.O Box 20695 - 00200, Nairobi, Kenya
- Cell +254709101200
- Tel +254709101200
- WhatsApp +254741676635
- United States
- +254709101200
- DOWNLOAD OUR APP
-


- Kenya
- 8th Floor, Pinetree Plaza, Kaburu Drive, Ngong Road, Nairobi, Kenya
- USA
- Suite 1150, 1775 Eye Street NW, USA, Washington DC 20006, USA
- Investments
- High Yield
- Private Equity
- Real Estate
- Real Estate
- RiverRun Estates
- Cytonn Towers
- The Ridge
- Taraji Heights
- The Alma