Nairobi Metropolitan Area Serviced Apartments Report 2019, & Cytonn Weekly #47/2019
By Cytonn Research, Nov 24, 2019
Executive Summary
Fixed Income
During the week, T-bills continued to be undersubscribed, with the subscription rate coming in at 56.2%, down from 57.7% the previous week. The undersubscription is attributable to the primary auction for the FXD 4/2019/10 treasury bond that closed on 19th November 2019, with market participants focusing on the primary Treasury bond market. The yield on the 91-day papers increased by 0.4% points to 7.1%, from 6.7% the previous week, while the 182-day paper increased by 0.4% points to 8.2%, from 7.8% recorded the previous week. The 364-day paper remained unchanged at 9.8%. In the money markets, 3-month bank placements ended the week at 8.4% (based on what we have been offered by various banks), the 91-day T-bill came in at 7.1%, while the average of Top 5 Money Market Funds came in at 9.9%, unchanged from the previous week. The Cytonn Money Market Fund closed the week at 10.6%, unchanged from the previous week. The 10-year November bond issue was undersubscribed, with the subscription rate coming in at 76.8% and the government accepted a bond yield of 12.5%. The Monetary Policy Committee is set to meet on Monday, 27th November, to review the prevailing macro-economic conditions and decide on the direction of the Central Bank Rate (CBR). We expect the MPC to cut the Central Bank Rate (CBR) by 50 bps to 8.5% from the current 9.0%, supported by the need to stimulate economic growth and private sector credit growth. We are projecting the Y/Y inflation rate for the month of November to come in within the range of 5.2% - 5.4%, compared to 5.0% recorded in October;
Equities
During the week, the equities market was on a downward trend with NASI, NSE 20, and NSE 25 declining by 0.7%, 1.3%, and 0.2%, respectively, taking their YTD performance to gains/(losses) of 10.3%, (7.6%), and 8.2%, respectively. The performance in NASI was driven by losses recorded by large-cap stocks with Bamburi, KCB, BAT, and Safaricom recording losses during the week of 9.8%, 2.1%, 2.0%, and 1.0%, respectively. In the listed banking sector, Barclays Bank, Standard Chartered Bank, and NIC Group released their Q3’2019 results, where the increase/(decrease) in their core earnings per share were 19.0%, (1.3%), and (3.3%), respectively;
Real Estate
During the week, in the residential sector, Nairobi County Government announced plans to kick off the redevelopment of Jevanjee/Bachelors Estate, located in Nairobi’s Eastlands, in one month’s time, and Belasi, a local real estate developer announced plans of putting up a 30-units project in Juja, which is to be acquired through a partial ownership plan. In the retail sector, Nakumatt closed its branch located at Mega City Mall in Kisumu, and in the infrastructure sector, construction of a 40-Kv power line set to power Konza City, as well as Kajiado, Makueni, and Machakos Counties was launched by the Ministry of Energy in partnership with China Aerospace Construction Group, while Kenya Urban Roads Authority (KURA) announced completion of Outer Ring Road’s interchange;
Focus of the Week
This week, we focus on the hospitality sector in Kenya, where we update our Nairobi Metropolitan Area Serviced Apartments Report, 2018. We shall cover the state of the serviced apartments market by looking into the drivers, challenges facing the sector, current and incoming supply, performance, and conclude by pointing out the investment opportunity. In terms of performance, serviced apartments within the Nairobi Metropolitan Area (NMA) recorded an average rental yield of 7.6% in 2019, 0.2% points higher than the 7.4% recorded in 2018, and this we attribute to a 2.3% increase in monthly charges per SQM, from Kshs 2,742 in 2018 to Kshs 2,806 in 2019, fueled by the continued demand for serviced apartments by both guests on business and leisure travels. The improved performance has mainly been supported by the stable political environment and improved security, making Nairobi an ideal destination for both business and holiday travelers.
- Shiv A. Arora, Head Private Equity and Real Estate Asst. Head of Investments, was on Metropol TV to talk about the Insurance Report released by Cytonn Investment Company. Watch Shiv here
- Shiv A. Arora, Head Private Equity and Real Estate Asst. Head of Investments, was on K24 TV to talk about the Insurance Report released by Cytonn Investment Company. Watch Shiv here
- David King’oo, Senior Risk and Compliance Associate was on Metropol TV to talk about Insurance Report released by Cytonn Investment Company. Watch David here
- David King’oo, Senior Risk and Compliance Associate was on CNBC to talk how the Kenyan Market is performing. Watch David here
- Phase 1 of The Alma is now 100% sold with early buyers having achieved up to 55% capital appreciation. We are now running a promotion in Phase 2: Buy a unit in Phase 2 with a 15-year payment plan and 0% deposit. For inquiries, please email us on clientservices@cytonn.com. The site is open between 8 am - 5 pm, 7-days a week for site visits;
- Cytonn Money Market Fund closed the week at an average yield of 10.6% p.a. To subscribe, just dial *809#;
- For an exclusive tour of Cytonn’s real estate developments, visit: Sharp Investor's Tour and for more information, email us at sales@cytonn.com;
- We continue to hold weekly workshops and site visits on how to build wealth through real estate investments. The weekly workshops and site visits target both investors looking to invest in real estate directly and those interested in high yield investment products to familiarize themselves with how we support our high yields. Watch progress videos and pictures of The Alma, Amara Ridge, and The Ridge;
- We continue to see very strong interest in our weekly Private Wealth Management Training (largely covering financial planning and structured products). The training is at no cost and is open only to pre-screened participants. We also continue to see institutions and investment groups interested in the training for their teams. Cytonn Foundation, under its financial literacy pillar, runs the Wealth Management Training. If interested in our Private Wealth Management Training for your employees or investment group, please get in touch with us through wmt@cytonn.com. To view the Wealth Management Training topics, click here;
- It's often easy to dream about a happy and comfortable retirement. The challenge lies in developing plans to bring those dreams to reality. A wealth of information from experts could go a long way in guiding you to actualizing your retirement dreams. Join our Head of Pensions on Tuesday 26th November from 9 am to 11 am and on Thursday 28th from 4:30 pm to 6:30 pm at The Chancery for more insights on how to retire on your own terms. To RSVP visit: com/pwmt
- For recent news about the company, see our news section here;
- We have 10 investment-ready projects, offering attractive development and buyer targeted returns. See further details here: Summary of Investment-Ready Projects
Money Markets, T-Bills & T-Bonds Primary Auction:
During the week, T-bills continued to be undersubscribed, with the subscription rate coming in at 56.2%, down from 57.7% the previous week. The undersubscription is attributable to the primary auction for the FXD 4/2019/10 treasury bond that closed on 19th November 2019, with market participants focusing on the primary Treasury bond market. The yield on the 91-day papers increased by 0.4% points to 7.1%, from 6.7% while the 182-day paper increased by 0.4% points to 8.2%, from 7.8% recorded the previous week. The 364-day paper, however, remained unchanged at 9.8%. The acceptance rate decreased to 88.4%, from 99.9% recorded the previous week, with the government accepting Kshs 11.9 bn of the Kshs 13.5 bn bids received.
The increase in yields on the 91-day and 182-day papers can be attributed to the expected increase in interest rates due to the recent interest rate cap repeal.
For the month of November, the National Treasury issued a 10-year Kshs 50.0 bn bond (FXD 4/2019/10) with market-determined coupon rates for Budgetary Support. The bond was undersubscribed, with the subscription rate coming in at 76.8%, on the back of an expected increase in private sector credit with banks now looking to lend to the private sector, due to the interest rate cap repeal, and the bond yield coming in at 12.5%. The acceptance rate on the bond was 73.9%, with the government accepting 28.4 bn of the 38.4 bn bids received.
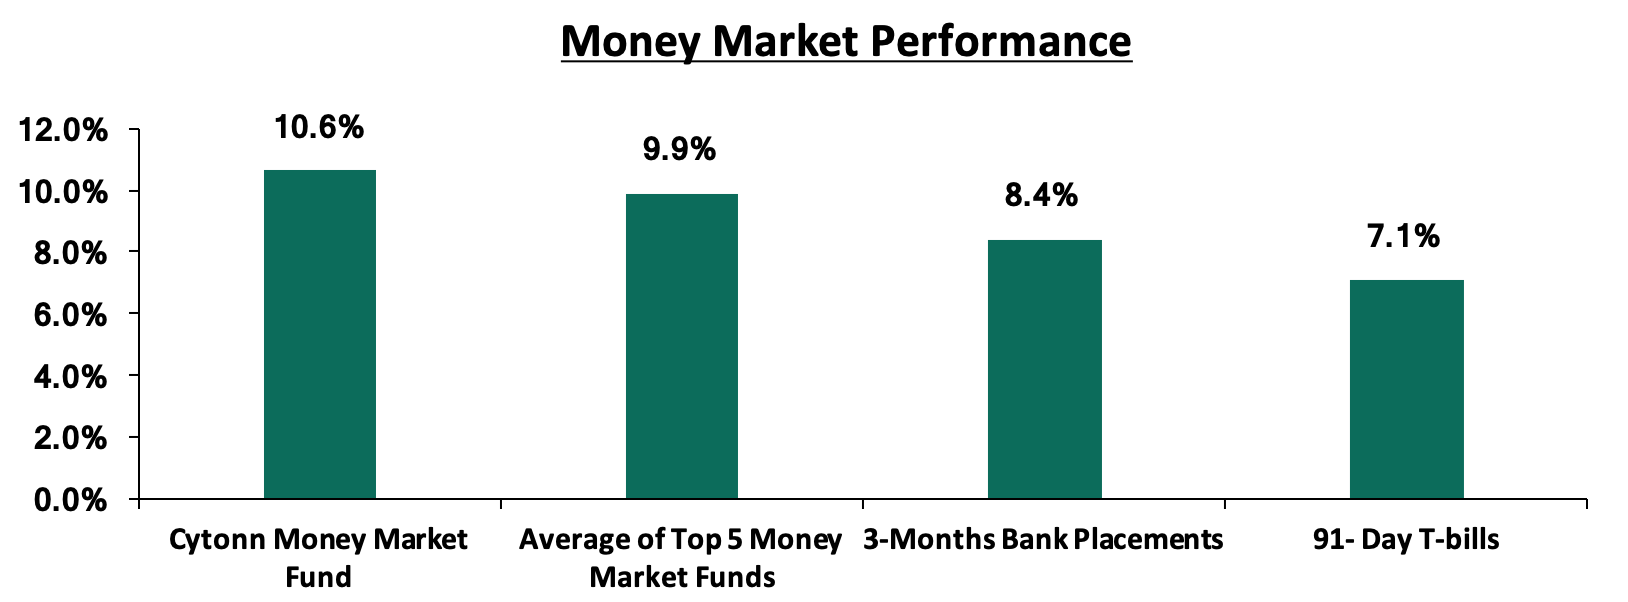
In the money markets, 3-month bank placements ended the week at 8.4% (based on what we have been offered by various banks), the 91-day T-bill came in at 7.1%, while the average of Top 5 Money Market Funds came in at 9.9%, unchanged from the previous week. The Cytonn Money Market Fund closed the week at 10.6%, unchanged from the previous week.
Liquidity:
During the week, the average interbank rate dropped to 3.4%, from 3.6% recorded the previous week, pointing to increasing liquidity in the money markets, supported by net redemption of government securities. This saw commercial banks excess reserves come in at Kshs 11.7 bn in relation to the 5.25% cash reserves requirement (CRR). The average interbank volumes increased by 42.0% to Kshs 18.0 bn, from Kshs 12.7 bn recorded the previous week.
Kenya Eurobonds:
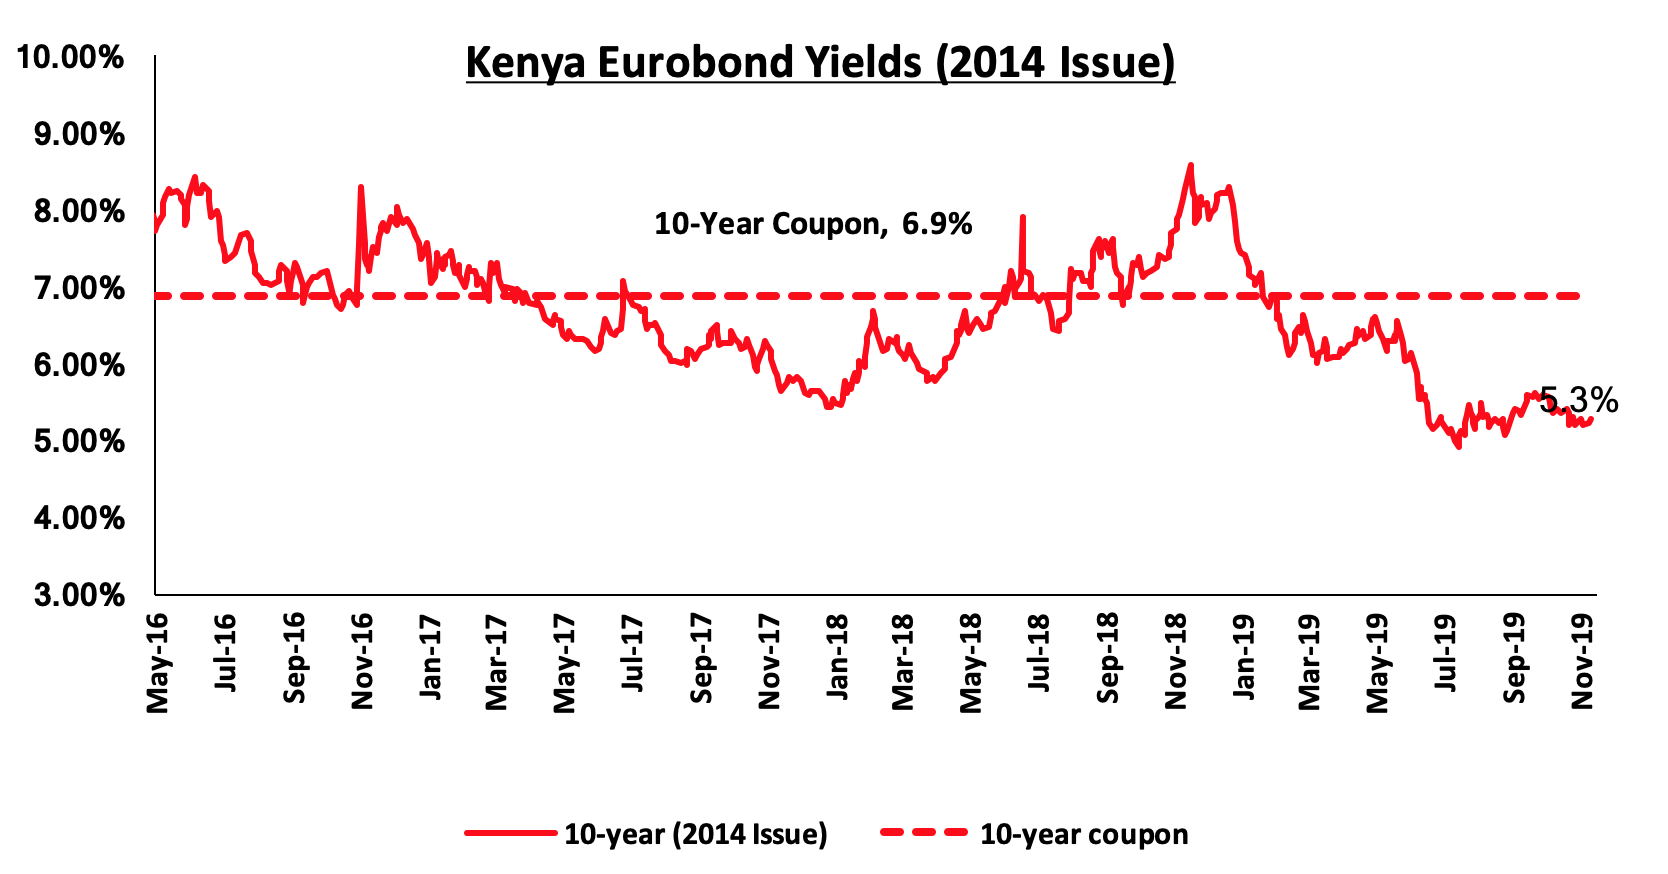
According to Reuters, the yield on the 10-year Eurobond issued in June 2014 increased by 10 bps to 5.3%, from 5.2% recorded the previous week. The rise in yields is attributable to the caution by the IMF during the week that Kenya’s rising debt levels were a concern and need to be contained to cushion the economy from unplanned shocks.
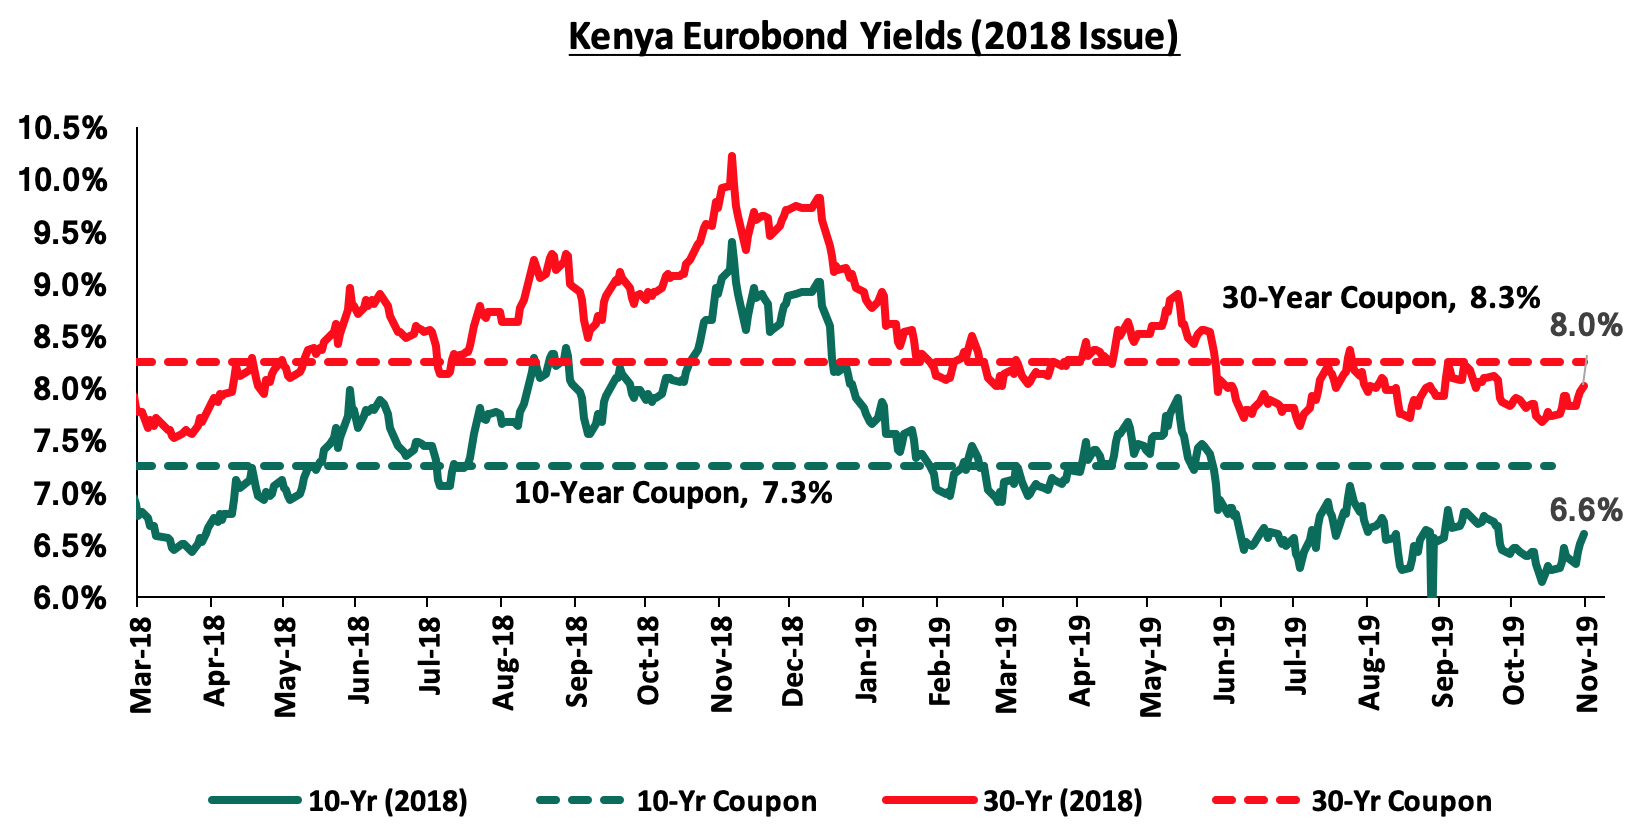
During the week, the yields on the 10-year Eurobond and the 30-year Eurobond both increased by 0.2% points to 6.6% and 8.0%, from 6.4% and 7.8%, respectively.
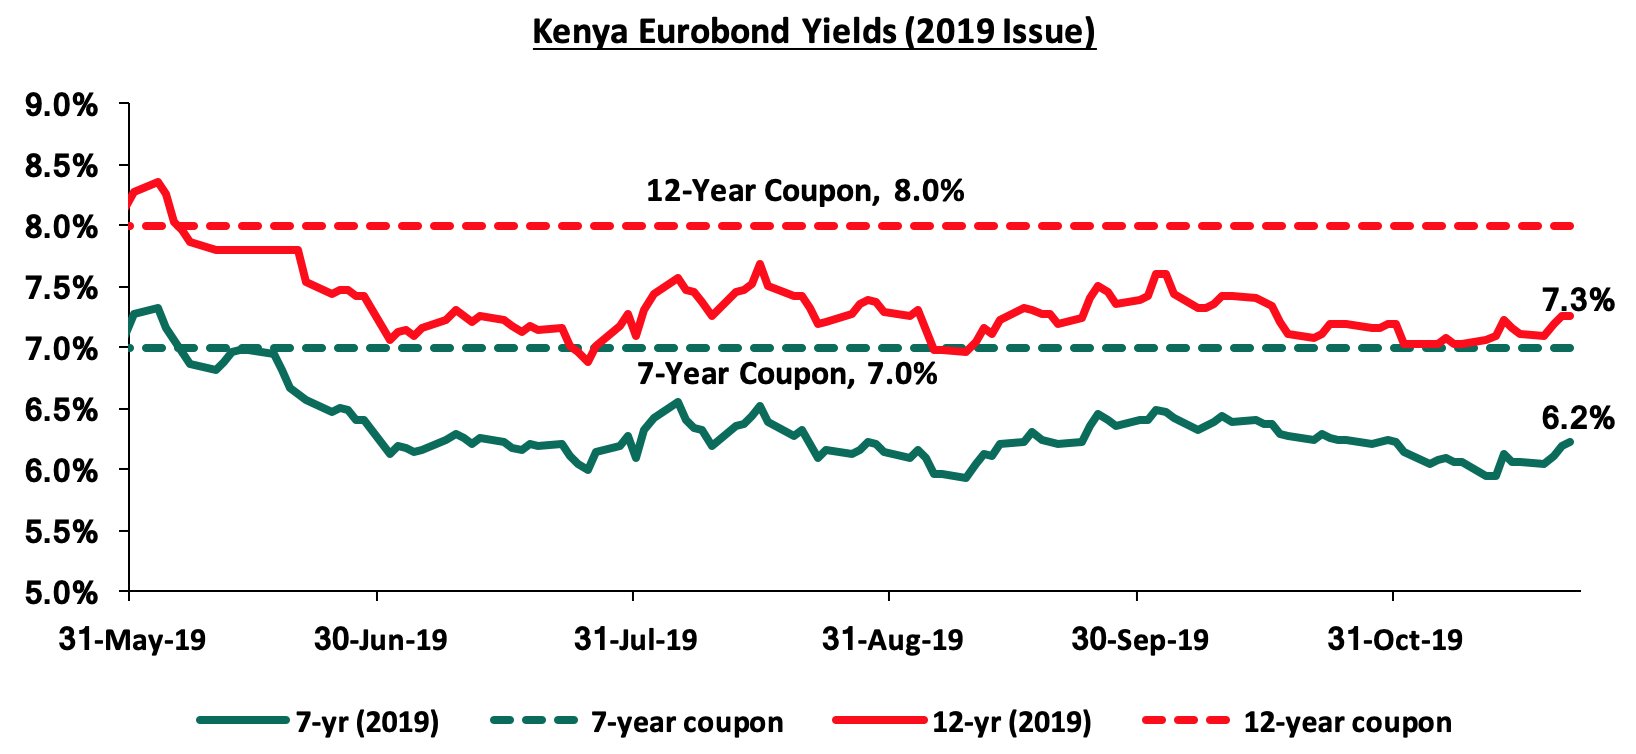
During the week, the yield on the 7-year Eurobond increased by 0.1% point to 6.2%, from 6.1% recorded the previous week, while the yield on the 12-year Eurobond increased by 0.2% points to 7.3%, from 7.1% recorded the previous week.
Kenya Shilling:
During the week, the Kenya Shilling appreciated by 0.7% against the US Dollar to close at Kshs 101.4, from 102.1 recorded the previous week, the highest it has been since June 14th of this year, when the shilling closed at Kshs 101.6. The surge was attributed to inflows from offshore investors buying banking stocks following the repeal of the interest rate cap. On an YTD basis, the shilling has appreciated by 0.5% against the dollar, in comparison to the 1.3% appreciation in 2018. In our view, the shilling should remain relatively stable against the dollar in the short term, supported by:
- The narrowing of the current account deficit, with preliminary data indicating that Kenya’s current account deficit improved by 11.8% during Q2’2019, coming in at a deficit of Kshs 107.6 bn, from Kshs 122.0 bn in Q2’2018, equivalent to 6.2% of GDP, from 7.6% recorded in Q2’2018. This was mainly driven by the narrowing of the country’s merchandise trade deficit by 1.7% and a rise in secondary income (transfers) balance by 5.1%,
- Improving diaspora remittances, which have increased cumulatively by 7.0% to USD 2.8 bn as at October 2019, from USD 2.6 bn recorded in a similar period of review in 2018,
- Foreign capital inflows, with investors looking to participate in the equities market,
- CBK’s supportive activities in the money market, such as repurchase agreements and selling of dollars, and,
- High levels of forex reserves, currently at USD 8.8 bn (equivalent to 5.4-months of import cover), above the statutory requirement of maintaining at least 4.0-months of import cover, and the EAC region’s convergence criteria of 4.5-months of import cover.
Monetary Policy:
The Monetary Policy Committee (MPC) is set to meet on Monday, 25th November 2019, to review the outcome of its previous policy decisions and recent economic developments, and to decide on the direction of the Central Bank Rate (CBR). In their previous meeting held on 23rd September 2019, the MPC maintained the CBR at 9.0%, citing that the economy was operating close to its potential and inflation expectations remained anchored within the target range.
We expect the MPC to cut the Central Bank Rate (CBR) by 50 bps to 8.5% from the current 9.0%, with their decision mainly being supported by:
- The need to stimulate growth, with GDP growth in 2019 having slowed down averaging 5.6% in H1’2019, lower than 6.4% in H1’2018, and below the CBK’s estimated growth at 6.3%,
- Inflation has remained contained and within the government set target of 2.5% - 7.5%, amid slowed economic growth, thus providing room for moderate stimulus through expansionary monetary policy, and,
- A further reduction of the Central Bank Rate (CBR), coupled up with the interest rate cap repeal would provide the requisite stimulus to private sector credit growth which has remained below the 5-year average, having grown by 6.3% in the 12-months to August 2019, below the 5-year average of 11.0%.
For our detailed MPC analysis, please see our MPC Note for the 25th November meeting here
Inflation Projections:
We are projecting the Y/Y inflation rate for the month of November to come in within the range of 5.2% - 5.4%, compared to 5.0% recorded in October.
The Y/Y inflation for the month of November is expected to rise due to the base effect. The M/M inflation is also expected to rise driven by:
- An increase in the food and non-alcoholic beverages index, which has a weighting of 36.0%, mainly driven by the higher food prices especially grain and flour prices, as well as milk prices,
- We also expect an increase in the transport index following the 2.4% and 2.6% increase in petrol and diesel prices, respectively, during the month, and,
- An increase in the housing, water, electricity, gas, and other fuels index following the 2.9% increase in kerosene prices to Kshs 104.1, from Kshs 101.1 in October.
Going forward, we expect the inflation rate to remain within the government set range of 2.5% - 7.5%.
Rates in the fixed income market have remained relatively stable as the government rejects expensive bids. The government is 15.6% behind its domestic borrowing target, having borrowed Kshs 107.3 bn against a pro-rated target of Kshs 127.1 bn. We expect an improvement in private sector credit growth considering the repeal of the interest rate cap. This will result in increased competition for bank funds from both the private and public sectors, resulting in upward pressure on interest rates. Owing to this, our view is that investors should be biased towards short-term fixed-income securities to reduce duration risk.
Market Performance
During the week, the equities market was on a downward trend with NASI, NSE 20 and NSE 25 declining by 0.7%, 1.3% and 0.2%, respectively, taking their YTD performance to gains/(losses) of 10.3%, (7.6%), and 8.2%, respectively. The performance in NASI was driven by losses recorded by large-cap stocks with Bamburi, KCB, BAT, and DTBK recording losses during the week of 9.8%, 2.1%, 2.0%, and 1.1%, respectively.
Equities turnover decreased by 81.2% during the week to USD 5.0 mn, from USD 26.4 mn the previous week, taking the YTD turnover to USD 1,331.8 mn. Foreign investors became net sellers for the week, with a net selling position of USD 0.3 mn, a 113.0% decrease from a net buying position of USD 2.3 mn recorded the previous week.
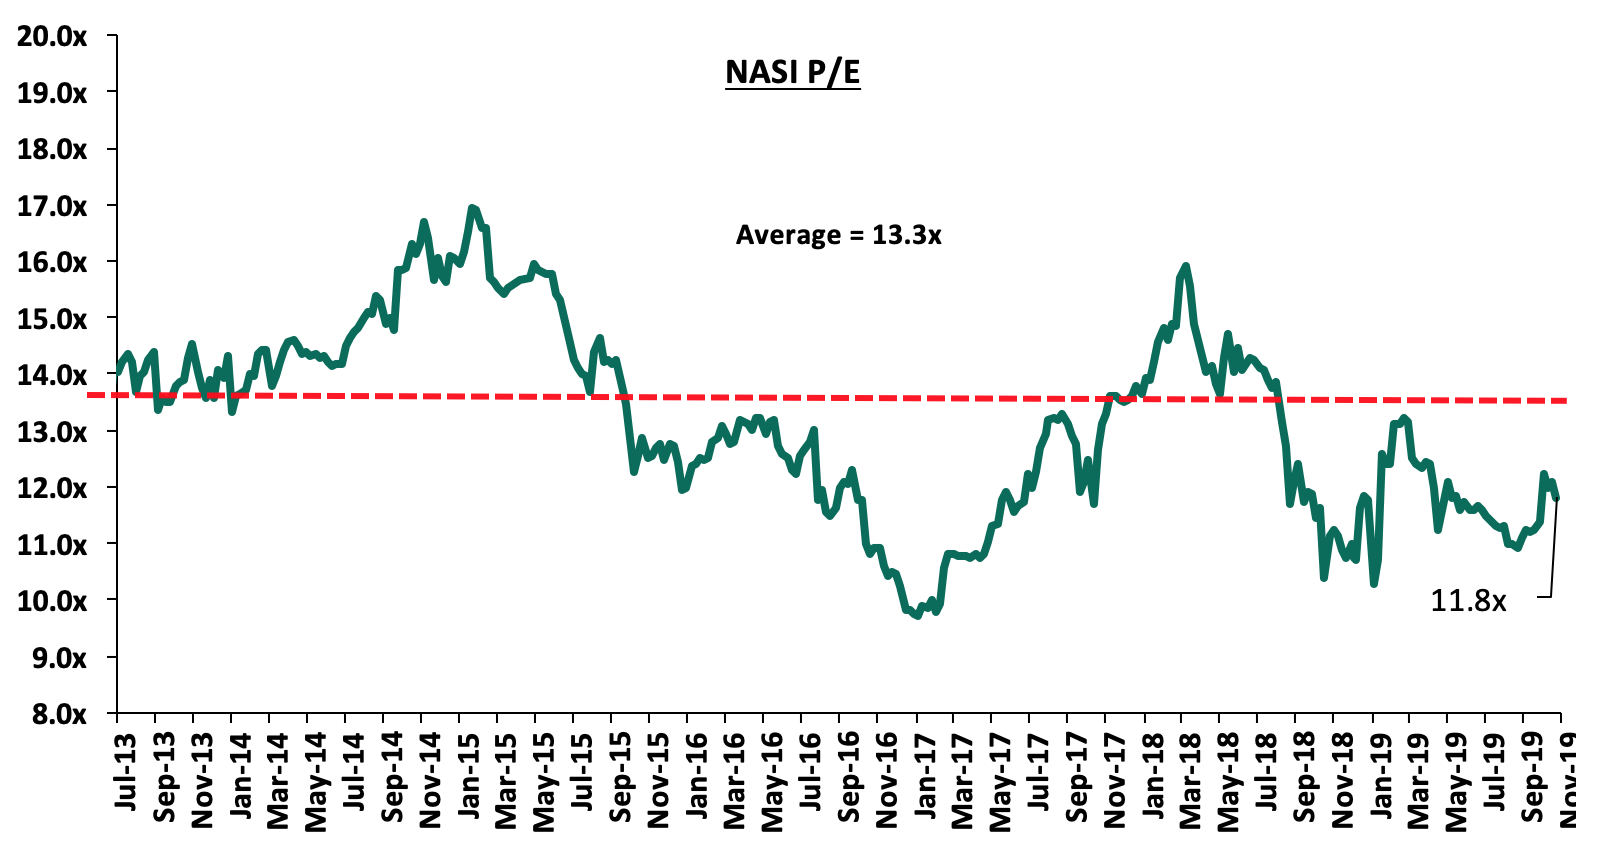
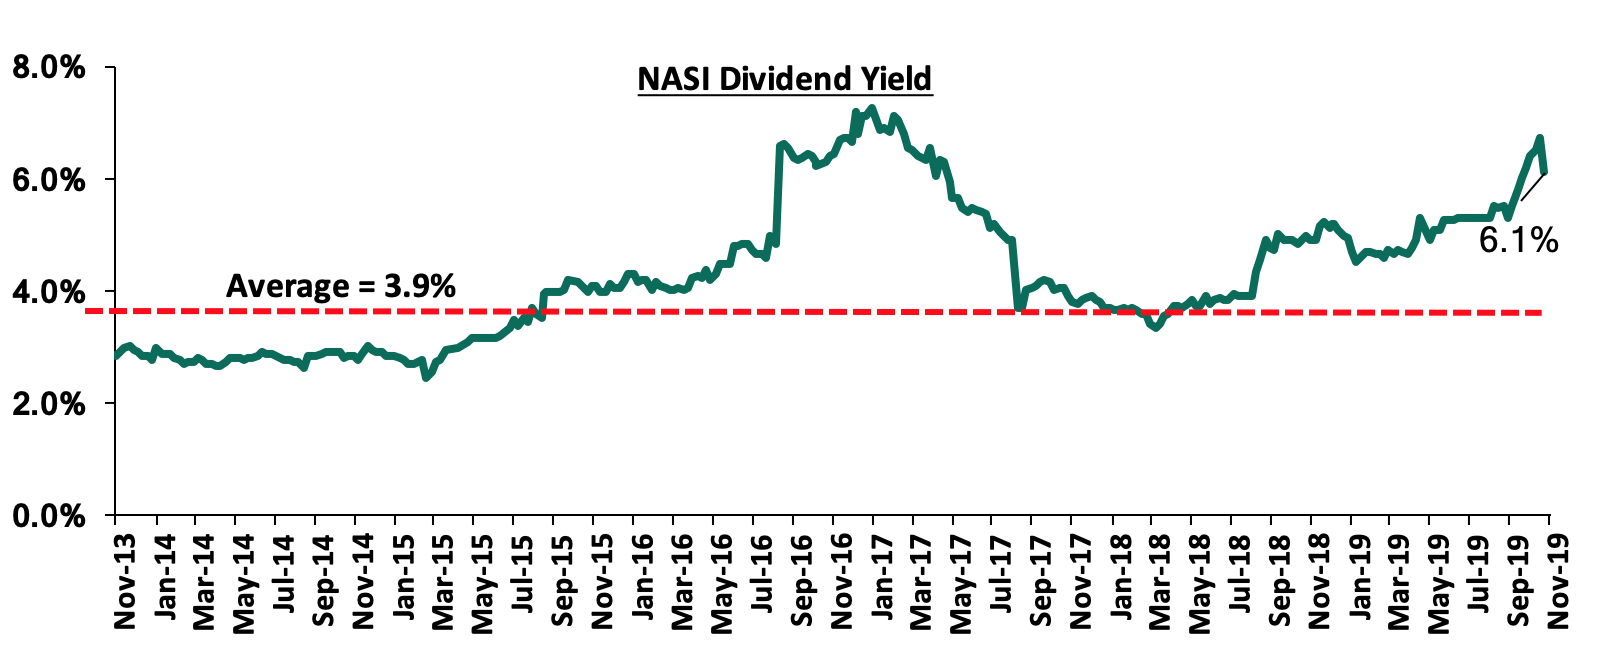
The market is currently trading at a price to earnings ratio (P/E) of 11.8x, 11.2% below the historical average of 13.3x, and a dividend yield of 6.1%, 2.2% points above the historical average of 3.9%. With the market trading at valuations below the historical average, we believe there is value in the market. The current P/E valuation of 11.8x is 21.6% above the most recent trough valuation of 9.7x experienced in the first week of February 2017, and 42.2% above the previous trough valuation of 8.3x experienced in December 2011. The charts below indicate the historical P/E and dividend yields of the market.
Weekly Highlights
Equity Bank Group (‘Equity’), in line with its regional expansion strategy, announced during the week that it is set to pay Kshs 107.8 bn to acquire a 66.5% stake in Banque Commerciale du Congo (BCDC), a top bank in the Democratic Republic of Congo owned by the George Arthur Forrest family. Equity is expected to acquire 625,354 shares in a deal that is inclusive of dividends that the bank will declare early next year. Equity is not new to the DRC market as it already acquired 86.0% stake in Pro Credit Bank in 2015. The bank is also seeking to acquire an additional 7.6% from German Development Bank (Kfw), thus, pushing its ownership in Pro Credit Bank to 93.6%. By acquiring an additional subsidiary in DRC and merging the two banks, Equity will create the second largest bank in the country, after Raw Bank, with an asset base of more than Kshs 100.0 bn. The country provides a large customer base having a population of around 80.0 mn people which is attractive to banks looking to grow in the continent. It is our view that the regional acquisitions by Equity will strengthen its footprint in the region. Equity has also signed a binding term sheet with Atlas Mara Ltd to acquire certain banking assets in Rwanda, Zambia, Tanzania and Mozambique. This highlights Kenyan banks’ continued pursuit for inorganic growth strategies, and moreover the strategy of Equity to enter markets where there exists a large underserved banking population.
Earnings Releases
Standard Chartered Bank of Kenya Plc released Q3’2019 results:
Standard Chartered Bank released their Q3’2019 results, recording a 1.3% decrease in core earnings per share to Kshs 18.1, from Kshs 18.4 in Q3’2018, attributed to a 0.9% increase in total operating expenses to Kshs 12.5 bn, from Kshs 12.4 bn in Q3’2018, with total operating income remaining flat at Kshs 21.6 bn. Key highlights of the performance from Q3’2018 to Q3’2019 include:
- Core earnings per share declined by 1.3% to Kshs 18.1, from Kshs 18.4 in Q3’2018, which was not in line with our expectation of a 4.0% increase to Kshs 19.1. The performance was driven by a 0.9% increase in total operating expenses to Kshs 12.5 bn from Kshs 12.4 bn, with total operating income remaining flat at Kshs 21.6 bn. The variance in core earnings per share growth was largely due to the 0.9% increase in total operating expenses, which was not in line with our expectations of a 4.5% decline,
- Total operating income remained flat at Kshs 21.6 bn, unchanged from Q3’2018. This was due to a 1.1% decline in Non-Funded Income (NFI) to Kshs 6.96 bn from Kshs 7.04 bn in Q3’2018, which offset the 0.6% increase in Net Interest Income (NII) to Kshs 14.7 bn, from Kshs 14.6 bn in Q3’2018,
- Interest income declined by 6.3% to Kshs 19.1 bn, from Kshs 20.3 bn in Q3’2018. This was driven by a 15.4% decline in interest income on government securities to Kshs 8.1 bn, from Kshs 9.5 bn in Q3’2018. Interest on loans and advances however increased marginally by 1.5% to Kshs 10.1 bn, from Kshs 9.9 bn in Q3’2018. Consequently, the yield on interest-earning assets declined to 9.9%, from 10.6% in Q3’2018,
- Interest expense declined by 23.7% to Kshs 4.4 bn from Kshs 5.8 bn in Q3’2018, following a 42.7% decline in other interest expenses to Kshs 442.2 mn from Kshs 771.5 mn in Q3’2018, coupled with a 20.4% decline in interest expense on customer deposits to Kshs 3.9 bn, from Kshs 4.9 bn in Q3’2018. Consequently, cost of funds declined to 3.0%, from 3.4% in Q3’2018, with the Net Interest Margin (NIM) also declining to 7.5%, from 7.8 in Q3’2018, owing to the faster 5.9% growth in average total interest earning assets that outpaced the 0.6% growth in the trailing net interest income,
- Non-Funded Income (NFI) declined by 1.1% to Kshs 6.96 bn, from Kshs 7.04 bn in Q3’2018. The decline was mainly driven by a 9.3% decline in other fees to Kshs 3.6 bn from Kshs 4.0 bn in Q3’2018. The decline in NFI was however mitigated by a 12.6% growth in foreign exchange trading income to Kshs 2.4 bn from Kshs 2.1 bn and a 7.0% rise in fees and commissions on loans and advances to Kshs 207.4 mn, from Kshs 193.9 mn in Q3’2018. The revenue mix shifted to 68:32 funded to non-funded income, from 67:33 in Q3’2018, largely due to the 1.1% decline in NFI despite net interest income (NII) increasing by 0.6%,
- Total operating expenses increased by 0.9% to Kshs 12.5 bn from Kshs 12.4 bn in Q3’2018, largely driven by a 9.8% increase in staff costs to Kshs 5.6 bn, from Kshs 5.1 bn in Q3’2018, and a 16.8% increase in other operating expenses to Kshs 4.9 bn from Kshs 4.2 bn in Q3’2018. The increases were however mitigated by a 61.2% decline in in loan loss provisions to Kshs 728.2 mn, from Kshs 1.9 bn in Q3’2018. Consequently, the Cost to Income Ratio (CIR) deteriorated to 57.7%, from 57.2% in Q3’2018. Without LLP, the cost to income ratio also deteriorated to 54.4%, from 48.5% in Q3’2018, and,
- Profit before tax declined by 1.2% to Kshs 9.1 bn, from Kshs 9.2 bn in Q3’2018. Profit after tax declined by 1.3% to Kshs 6.2 bn in Q3’2019, from Kshs 6.3 bn in Q3’2018, as the effective tax rate rose marginally to 31.9%, from 31.8% in Q3’2018,
- The balance sheet recorded an expansion as total assets increased by 0.7% to Kshs 290.6 bn, from Kshs 288.6 bn in Q3’2018. The increase was driven by a 6.8% expansion of the loan book to Kshs 118.5 bn from Kshs 111.0 bn in Q3’2018, and a 27.4% increase in cash and balances due from Central Bank of Kenya to Kshs 19.4 bn from Kshs 15.2 bn in Q3’2018. The increases were however mitigated by the 7.9% decline in government securities to Kshs 98.7 bn from Kshs 107.2 bn in Q3’2018,
- Total liabilities increased marginally by 0.3% to Kshs 242.7 bn from Kshs 241.8 bn in Q3’2018, mainly driven by a 2.4% increase in customer deposits to Kshs 224.8 bn from Kshs 219.5 bn in Q3’2018. Deposits per branch increased by 8.4% to Kshs 6.6 bn from Kshs 6.1 bn in Q3’2018, as the number of branches declined by 2 to 34 from 36 in Q3’2018,
- The faster growth in loans which outpaced the growth in deposits led to a rise in the loan to deposit ratio to 52.7%, from 50.6% in Q3’2018,
- Gross Non-Performing Loans (NPLs) increased by 12.0% to Kshs 19.9 bn in Q3’2019, from Kshs 17.8 bn in Q3’2018. The NPL ratio deteriorated to 14.9% in Q3’2019, from 14.2% in Q3’2018, due to the faster growth in gross Non-performing Loans (NPLs), which outpaced the growth in gross loans. General Loan Loss Provisions increased by 10.9% to Kshs 7.9 bn, from Kshs 7.2 bn in Q3’2018. The NPL coverage however deteriorated to 77.0% , from 81.4% in Q3’2018, due to the faster growth in gross Non-performing Loans (NPLs) that outpaced the growth in General Loan Loss Provisions,
- Shareholders’ funds increased by 2.4% to Kshs 47.9 bn in Q3’2019, from Kshs 46.8 bn in Q3’2018, supported by a 1.3% increase in retained earnings to Kshs 31.4 bn, from Kshs 31.0 bn in Q3’2018, coupled with an inclusion of Kshs 1.1 bn in Q3’2019 Statutory loan loss reserve, as the CBK provisions were higher than IFRS 9 provisions. As per the CBK guidance on the implementation of IFRS 9, where the CBK provisions are higher than IFRS 9, the excess provisions shall be treated as an appropriation of retained earnings and not expenses in determining profit and loss and thus the excess provision shall be credited to the statutory loan loss reserve,
- Standard Chartered Bank Kenya remains sufficiently capitalized with a core capital to risk-weighted assets ratio of 15.7%, 5.2% points above the statutory requirement of 10.5%. In addition, the total capital to risk-weighted assets ratio came in at 18.9%, exceeding the statutory requirement by 4.4% points. Adjusting for IFRS 9, the core capital to risk weighted assets stood at 15.8%, while total capital to risk-weighted assets came in at 18.9%, and,
- The bank currently has a Return on Average Assets (ROaA) of 2.8%, and a Return on Average Equity (ROaE) of 16.9%.
Key Take-Outs:
- The bank registered a weak deposit growth, following the 2.4% increase in customer deposits to Kshs 224.8 bn from Kshs 219.5 bn in Q3’2018. The deposit growth rate at 2.4% is lower than the industrial average of 11.7%,
- The bank registered a decline in operating revenue, following the 1.1% decline in NFI to Kshs 6.96 bn, from Kshs 7.04 bn in Q3’2018. This has bucked the trend of similar Tier I banks that have generally reported an expansion in NFI, with Standard Chartered bank’s NFI contribution to total revenue at 32%, lower than the industry average of 37.0%
- The bank’s asset quality deteriorated, with the NPL ratio increasing to 14.9% from 14.2% in Q3’2018. This was due to the faster 12.0% growth in gross Non-performing Loans (NPLs) that outpaced the 6.6% growth in gross loans.
Going forward, we expect the bank’s growth to be driven by:
- Continued focus on promoting the usage of the bank’s alternative channels is likely to boost the company’s Non-Funded Income (NFI) as well as aiding in improving operational efficiency levels, which deteriorated in Q3’2019 as evidenced by the worsening of the cost to income ratio to 57.7% from 57.2% in Q3’2018. Revenue expansion coupled with cost containment will be key in boosting the bank’s bottom line.
For more information, see our Standard Chartered Bank Kenya Q3’2019 Earnings Note
Barclays Bank Kenya released Q3’ 2019 results:
Barclays Bank released their Q3’2019 results, recording a 19.0% increase in core earnings per share to Kshs 1.2, from Kshs 1.0 in Q3’2018, attributed to a 3.9% increase in total operating income to Kshs 24.8 bn, from Kshs 23.9 bn in Q3’2018. Key highlights of the performance from Q3’2018 to Q3’2019 include:
- Core earnings per share increased by 19.0% to Kshs 1.2 from Kshs 1.0 in Q3’2018, driven by a 3.9% growth in total operating income to Kshs 24.8 bn from Kshs 23.9 bn in Q3’2018. The core earnings per share grew faster than our expectations of 12.7%, with the variance being attributable to the 2.7% decrease in total expenses to Kshs 15.7 bn from Kshs 16.1 bn in Q3’2018, which fell short of our expectations of a 2.0% increase,
- Total operating income increased by 3.9% to Kshs 24.8 bn from Kshs 23.9 bn in Q3’2018. This was due to a 8.1% increase in Non-Funded Income (NFI) to Kshs 8.0 bn, from Kshs 7.4 bn in Q3’2018, coupled with a 2.0% increase in Net Interest Income (NII) to Kshs 16.8 bn from Kshs 16.5 bn in Q3’2018,
- Interest income increased by 5.6% to Kshs 22.9 bn, from Kshs 21.7 bn in Q3’2018. This was driven by a 10.0% increase in interest income from government securities to Kshs 6.1 bn, from Kshs 5.6 bn in Q3’2018, coupled with a 3.0% increase in interest income on loans and advances to Kshs 16.5 bn from Kshs 16.0 bn in Q3’2018. The yield on interest-earning assets however declined to 11.5% from 11.8% in Q3’2018 attributed to the decline in yields on government securities,
- Interest expenses increased by 17.1% to Kshs 6.1 bn, from Kshs 5.2 bn in Q3’2018, following an 41.1% increase in interest expense on deposits and placements from banking institutions to Kshs 0.9 bn from Kshs 0.7 bn in Q3’2018, coupled with a 11.3% rise in interest expense on customer deposits to Kshs 5.0 bn from Kshs 4.5 bn in Q3’2018. The cost of funds thus increased to 3.4% from 3.1% in Q3’2018. The Net Interest Margin (NIM) declined to 6.4%, from 6.8% in Q3’2018,
- Non-Funded Income (NFI) increased by 8.1% to Kshs 8.0 bn, from Kshs 7.4 bn in Q3’2018. The increase was mainly driven by a 30.9% rise in fees and commissions on loans to Kshs 1.1 bn, from Kshs 0.8 bn in Q3’2018, coupled with a 4.1% and 7.5% increase in other fees and forex trading income to Kshs 3.6 bn and Kshs 2.7 bn from Kshs 3.4 bn and Kshs 2.5 bn, respectively. As a result, the revenue mix shifted to 68:32 from 69:31 funded to non-funded income, due to the faster growth in NFI compared to NII,
- Total operating expenses decreased by 2.7% to Kshs 15.7 bn, from Kshs 16.1 bn, largely driven by a 9.7% decrease in other expenses to Kshs 5.3 bn in Q3’2019, from Kshs 5.9 bn in Q3’2018, coupled with a 1.6% decrease in staff costs to Kshs 7.3 bn in Q3’2019, from Kshs 7.5 bn in Q3’2018,
- Due to the faster growth of operating income that outpaced the decline in total operating expenses, Cost to Income Ratio (CIR) improved to 63.3%, from 67.6% in Q3’2018. Also without LLP, the cost to income ratio improved, to 50.9%, from 55.8% in Q3’2018, and,
- Profit before tax increased by 17.8% to Kshs 9.1 bn, up from Kshs 7.7 bn in Q3’2018. Profit after tax grew by 19.0% to Kshs 6.5 bn in Q3’2019, from Kshs 5.4 bn in Q3’2018 with the effective tax rate remaining unchanged at 32.1%,
- The balance sheet recorded an expansion as total assets increased by 11.7% to Kshs 359.8 bn, from Kshs 322.2 bn in Q3’2018. This growth was largely driven by an 8.8% increase in the loan book to Kshs 194.2 bn from Kshs 178.4 bn in Q3’2018. Investment in government and other securities also recorded a 3.0% growth to Kshs 76.8 bn, from Kshs 74.6 bn in Q3’2018,
- Total liabilities rose by 13.0% to Kshs 315.8 bn, from Kshs 279.5 bn in Q3’2018, driven by a 6.9% increase in deposits to Kshs 235.4 bn, from Kshs 220.2 bn in Q3’2018. Deposits per branch increased by 8.0% to Kshs 2.7 bn from Kshs 2.5 bn in Q3’2018, with the number of branches has reduced to 88 from 89 in Q3’2018,
- The marginal growth in loans as compared to deposits led to a rise in the loan to deposit ratio to 82.5% from 81.0% in Q3’2018,
- Gross Non-Performing Loans (NPLs) decreased by 4.8% to Kshs 13.9 bn in Q3’2019 from Kshs 14.6 bn in Q3’2018. The NPL ratio thus improved to 6.8% from 7.7% in Q3’2018 due to the slower growth in Gross Non-Performing Loans (NPLs) which was slower than the growth in loans. General Loan Loss Provisions increased by 8.8% to Kshs 3.1 bn, from Kshs 2.8 bn in Q3’2018. The NPL coverage, however, increased to 78.6% from 70.5% in Q3’2018 due to the decline in Gross Non-Performing Loans (NPLs) relative to the 11.1% growth in General Loan Loss Provisions to Kshs 8.0 bn from Kshs 7.2 bn recorded in Q3’2018,
- Shareholders’ funds increased by 3.1% to Kshs 44.0 bn in Q3’2019, from Kshs 42.7 bn in Q3’2018, as retained earnings grew by 3.7% y/y to Kshs 5.6 bn, from Kshs 5.4 bn recorded in Q3’2018,
- Barclays Bank Group is currently sufficiently capitalized with a core capital to risk-weighted assets ratio of 14.2%, 3.7% above the statutory requirement. In addition, the total capital to risk-weighted assets ratio was 16.1%, exceeding the statutory requirement by 1.6%. Adjusting for IFRS 9, the core capital to risk-weighted assets stood at 14.7%, while total capital to risk-weighted assets came in at 16.7 %, and,
- The bank currently has a Return on Average Assets (ROaA) of 2.4%, and a Return on Average Equity (ROaE) of 17.4%.
Key Take-Outs:
- The bank’s asset quality improved, with the NPL ratio decreasing to 6.8% from 7.7% in Q3’2018 due to a 4.8% decrease in Gross Non-Performing Loans (NPLs) to Kshs 13.9 bn from Kshs 14.6 bn which was slower than the growth in loans,
- Barclays Bank benefited from the restructuring exercise it conducted in 2017, as it continues to record a decline in staff costs y/y, which reduced by 1.6% y/y, and, NFI supported the improvement in the top-line revenue, as it expanded by 8.1% y/y, largely supported by other fees and commissions, as well as the forex trading income segments, which recorded growths of 4.1% and 7.5%, respectively. Recovery in the fees and commissions on loans is presumably due to the low base of 2018, on the initial implementation of the Effective Interest Model (EIR) under IFRS 9, which required banks to amortize fees and commissions on loans over the tenor of the loan. As a result of the performance, the revenue mix shifted to 68:32 from 69:31 funded to non-funded income, due to the faster growth in NFI compared to NII and,
- There was an improvement in operational efficiency as evidenced by the decline in the Cost to Income Ratio (CIR) without LLP to 50.9% in Q3’2019, from 55.8% in Q3’2018.
Going forward, we expect the bank’s growth to be driven by:
- Increased Channel diversification, which is likely to help the bank to continue improving its operational efficiency. The benefits of this are already being felt with “Timiza” already recording accelerated growth, and consequently higher Non-Interest Revenue. This, coupled with the expansion of its agent banking network and product offerings such as bancassurance and fixed income trading will see the bank expand its top-line revenue, going forward.
For more information, see our Barclays Bank Kenya Q3’2019 Earnings Note
NIC Group released Q3’ 2019 results:
NIC Group released their Q3’2019 results, recording a 3.3% decrease in core earnings per share to Kshs 4.4, from Kshs 4.6 in Q3’2018, attributed to a 22.9% increase in total operating expenses to Kshs 8.2 bn, from Kshs 6.6 bn in Q3’2018, which was slightly mitigated by increase in total operating income by 15.2% to Kshs 12.6 bn, from Kshs 11.0 bn in Q3’2018. Key highlights of the performance from Q3’2018 to Q3’2019 include:
- Core earnings per share declined by 3.3% to Kshs 4.4 from Kshs 4.6 in Q3’2018. The performance was driven by a 22.9% increase in total operating expenses to Kshs 8.2 bn from Kshs 6.6 bn in Q3’2018, this was mitigated by the 15.2% increase in total operating income,
- Total operating income increased by 15.2% to Kshs 12.6 bn from Kshs 11.0 bn in Q3’2018. This was driven by both, a 10.6% increase in Net Interest Income (NII) to Kshs 8.4 bn from Kshs 7.6 bn in Q3’2018, and a 25.6% increase in Non-Funded Income (NFI) to Kshs 4.3 bn from Kshs 3.4 bn in Q3’2018,
- Interest income increased by 3.4% to Kshs 14.7 bn from Kshs 14.2 bn in Q3’2018. Interest income on government securities increased by 5.1% to Kshs 5.3 bn in Q3’2019 from Kshs 5.0 bn in Q3’2018, while that on loans and advances increased by 1.8% to Kshs 9.2 bn from Kshs 9.1 bn in Q3’2018. The yield on interest-earning assets, however, declined to 7.9% in Q3’2019 from 8.3% in Q3’2018,
- Interest expense decreased by 4.7% to Kshs 6.4 bn from Kshs 6.7 bn in Q3’2018, as interest expense on customer deposits decreased by 4.9% to Kshs 5.3 bn from Kshs 5.5 bn in Q3’2018. The cost of funds fell to 3.4% from 3.9% in Q3’2018, while the Net interest margin increased to 6.1% from 6.0% in Q3’2018,
- Non-Funded Income increased by 25.6% to Kshs 4.3 bn from Kshs 3.4 bn in Q3’2018. The increase in NFI was mainly driven by a 91.4% increase in Other Income to Kshs 1.1 bn from Kshs 0.6 bn in Q3’2018, coupled with a 19.4% increase in Fees & commissions on loans and advances to Kshs 1.3 bn from Kshs 1.1 bn in Q3’2018. Forex trading came in at Kshs 1.1 bn, compared to Kshs 1.0 bn in Q3’2018. The revenue mix shifted to 66:34 funded to non-funded income in Q3’2019 from 69:31 in Q3’2018, owing to the higher increase in NFI,
- Total operating expenses increased by 22.9% to Kshs 8.2 bn from Kshs 6.6 bn, largely driven by a 44.4% increase in loan loss provision (LLP) to Kshs 2.3 bn in Q3’2019 from Kshs 1.6 bn in Q3’2018. Staff costs, also increased by 10.8% to Kshs 2.9 bn in Q3’2019 from Kshs 2.6 bn in Q3’2018,
- The cost to income ratio deteriorated to 64.6% from 60.6% in Q3’2018. Without LLP, the cost to income ratio also deteriorated to 46.3% from 46.0% in Q3’2018,
- NIC Group incurred an exceptional item of Kshs 344.2 mn following the integration, advisory and legal expenses related to the merger with CBA,
- Profit before tax decreased by 4.5% to Kshs 4.1 bn from Kshs 4.3 bn in Q3’2018. Profit after tax decreased by 3.3% to Kshs 3.1 bn in Q3’2019 from Kshs 3.2 bn in Q3’2018, with the difference being a decline in the effective tax rate to 35.9% from 42.9% in Q3’2018,
- The balance sheet recorded an expansion with total assets growth of 7.0% to Kshs 215.9 bn from Kshs 201.8 bn in Q3’2018. This growth was largely driven by a 9.4% increase in government securities to Kshs. 65.8 bn from Kshs. 60.2 bn in Q3’2018,
- The loan book expanded by 4.3% to Kshs 119.9 bn in Q3’2019 from Kshs 114.9 bn in Q3’2018,
- Total liabilities rose by 5.6% to Kshs 177.4 bn from Kshs 167.9 bn in Q3’2018, driven by a 9.2% increase in customer deposits to Kshs 158.2 bn from Kshs 145.0 bn in Q3’2018. This was however mitigated by a 46.8% decline in borrowings to Kshs 8.4 bn from Kshs 15.8 bn in Q3’2018. Deposits per branch stood at Kshs. 3.8 bn with the bank operating 42 branches,
- The faster growth in deposits compared to the growth in loans led to a slight decline in the loan to deposit ratio to 75.8% from 79.3% in Q3’2018,
- Gross non-performing loans increased by 13.8% to Kshs 18.7 bn in Q3’2019 from Kshs 16.4 bn in Q3’2018. Consequently, the NPL ratio deteriorated to 14.6% in Q3’2019 from 13.3% in Q3’2018. General Loan loss provisions decreased by 19.2% to Kshs 5.3 bn from Kshs 6.6 bn in Q3’2018. Consequently, the NPL coverage deteriorated to 45.9% in Q3’2019 from 51.4% in Q3’2018,
- Shareholders’ funds increased by 14.4% to Kshs 38.3 bn in Q3’2019 from Kshs 33.5 bn in Q3’2018,
- NIC Group is currently sufficiently capitalized with a core capital to risk-weighted assets ratio of 19.6%, 9.1% above the statutory requirement. In addition, the total capital to risk-weighted assets ratio was 20.3%, exceeding the statutory requirement by 5.8%. Adjusting for IFRS 9, the core capital to risk-weighted assets stood at 20.4%, while total capital to risk-weighted assets came in at 21.9%, and,
- NIC Group currently has a return on average assets of 1.0% and a return on average equity of 5.4%.
Key Take-Outs:
- NIC Group’s operating income increased by 15.2% to Kshs 12.6 bn, from Kshs 11.0 bn in Q3’2018, mainly supported by the 25.6% increase in non-funded income for the period ending 30th September 2019. This shows improved diversification with the bank improving its alternative sources of income.
Going forward, we expect the bank’s growth to be further driven by:
- The merger with CBA will likely enable NIC to mobilize cheaper funding, leveraging on the scale and market reach of the combined entity as well as the digital channels. We expect NCBA Group Plc to focus on branding and increased consumer awareness campaigns in the near term, as they endeavor to minimize service disruptions to clientele as well as highlight the synergies and benefits expected to be reaped from the merger.
For more information, see our NIC Group Q3’2019 Earnings Note
The table below summarizes the performance of listed banks that have released their Q3’2019 results:
|
Bank |
Core EPS Growth |
Interest Income Growth |
Interest Expense Growth |
Net Interest Income Growth |
Net Interest Margin |
Non-Funded Income Growth |
NFI to Total Operating Income |
Growth in Total Fees & Commissions |
Deposit Growth |
Growth in Government Securities |
Loan to Deposit Ratio |
Loan Growth |
Return on Average Equity |
|
Equity Group |
10.4% |
11.2% |
16.8% |
9.5% |
8.4% |
13.7% |
41.1% |
15.0% |
18.9% |
7.8% |
73.0% |
21.0% |
22.8% |
|
KCB Group |
6.2% |
4.6% |
(0.8%) |
6.5% |
8.2% |
16.9% |
35.2% |
28.5% |
11.4% |
7.5% |
82.9% |
11.7% |
22.2% |
|
Co-operative Bank |
5.5% |
(1.6%) |
0.9% |
(2.7%) |
8.3% |
33.3% |
40.0% |
46.6% |
8.9% |
13.6% |
83.4% |
5.8% |
18.4% |
|
NBK |
(4.7%) |
4.7% |
(8.2%) |
11.6% |
7.2% |
(4.6%) |
23.8% |
4.5% |
(11.1%) |
(17.1%) |
58.0% |
(0.3%) |
5.5% |
|
BBK |
19.0% |
5.6% |
17.1% |
2.0% |
6.4% |
8.1% |
32.1% |
30.9% |
6.9% |
3.0% |
81.0% |
8.8% |
17.4% |
|
SCBK |
(1.3%) |
(6.3%) |
(23.7%) |
0.6% |
7.5% |
(1.1%) |
32.2% |
7.0% |
2.4% |
(7.9%) |
52.7% |
6.8% |
16.9% |
|
NIC Group |
(3.3%) |
3.4% |
(4.7%) |
10.6% |
6.1% |
25.6% |
34.0% |
19.4% |
9.2% |
9.4% |
75.8% |
4.3% |
5.4% |
|
Q3'2019 Mkt Weighted Average* |
7.5% |
4.5% |
4.1% |
5.1% |
7.9% |
15.6% |
37.0% |
24.3% |
11.7% |
6.2% |
75.8% |
12.5% |
19.9% |
|
Q3'2018 Mkt Weighted Average** |
16.2% |
6.1% |
12.5% |
3.8% |
8.0% |
5.9% |
34.5% |
0.6% |
7.4% |
17.8% |
75.3% |
4.2% |
18.8% |
|
*Market cap weighted as at 22/11/2019 |
|||||||||||||
|
**Market cap weighted as at 30/11/2018 |
|||||||||||||
Key takeaways from the table above include:
- The seven listed Kenyan banks that have released their results recorded a 7.5% average increase in core Earnings per Share (EPS), compared to an increase of 16.2% in Q3’2018 for all listed banks. Consequently, the Return on Average Equity (ROaE) increased to 19.9%, from 18.8% in Q3’2018,
- The banks recorded stronger deposit growth, which came in at 11.7%, faster than the 7.4% growth recorded in the sector in Q3’2018. Interest expenses increased at a slower pace of 4.1%, compared to 12.5% in Q3’2018, indicating the banks have been able to mobilize relatively cheaper deposits,
- Average loan growth came in at 12.5%, which was faster than the 4.2% recorded in the sector in Q3’2018, indicating that there was an improvement in credit extension by the banks. Government securities recorded a growth of 6.2% y/y, which was slower compared to the loans, and a decline from the 17.8% recorded in the sector in Q3’2018. This highlights that banks are beginning to adjust their business models back to private sector lending as opposed to investing in government securities, as the yields on government securities declined during the year. Interest income increased by 4.5%, lower than the 6.1% growth recorded in the sector in Q3’2018. Consequently, the Net Interest Income (NII) grew by 5.1% compared to a growth of 3.8% in the sector in Q3’2018,
- The banks recorded a Net Interest Margin of 7.9%, 10 bps lower than 8.0% the sector recorded in Q3’2018 and,
- Non-Funded Income grew by 15.6% y/y, faster than the 5.9% recorded in the sector in Q3’2018. The growth in NFI was boosted by the total fee and commission income which improved by 24.3%, compared to the 0.6% growth recorded in the sector Q3’2018, owing to the faster loan growth.
Universe of Coverage
Below is a summary of our universe of coverage:
(All values in Kshs unless stated otherwise)
|
Banks |
Price at 15/11/2019 |
Price at 22/11/2019 |
w/w change |
YTD Change |
Target Price* |
Dividend Yield |
Upside/ Downside** |
P/TBv Multiple |
Recommendation |
|
Sanlam |
17.0 |
16.5 |
(2.9%) |
(14.8%) |
29.0 |
0.0% |
75.8% |
0.7x |
Buy |
|
I&M Holdings*** |
49.1 |
50.0 |
1.9% |
5.9% |
79.8 |
7.8% |
67.3% |
0.8x |
Buy |
|
NCBA |
34.0 |
34.5 |
1.5% |
7.7% |
37.9 |
55.2% |
65.2% |
0.8x |
Buy |
|
Diamond Trust Bank |
115.3 |
114.3 |
(0.9%) |
(27.2%) |
175.6 |
2.3% |
56.0% |
0.6x |
Buy |
|
Kenya Reinsurance |
3.1 |
3.1 |
(1.6%) |
(17.2%) |
3.8 |
14.7% |
36.8% |
0.3x |
Buy |
|
KCB Group*** |
50.3 |
49.1 |
(2.4%) |
12.1% |
61.4 |
7.1% |
32.2% |
1.3x |
Buy |
|
CIC Group |
3.2 |
3.1 |
(1.3%) |
(20.5%) |
3.8 |
4.2% |
26.0% |
1.1x |
Buy |
|
Liberty Holdings |
10.5 |
9.6 |
(8.6%) |
(24.7%) |
11.3 |
5.2% |
22.9% |
0.6x |
Buy |
|
Barclays Bank*** |
11.9 |
12.0 |
1.3% |
0.0% |
12.6 |
16.7% |
21.5% |
0.5x |
Buy |
|
Jubilee holdings |
350.0 |
355.0 |
1.4% |
(13.5%) |
418.5 |
2.5% |
20.4% |
0.9x |
Buy |
|
Britam |
7.5 |
7.7 |
2.1% |
(30.2%) |
8.8 |
0.0% |
14.9% |
0.7x |
Accumulate |
|
Equity Group*** |
47.5 |
48.7 |
2.5% |
7.5% |
53.0 |
3.1% |
12.0% |
1.0x |
Accumulate |
|
Co-op Bank*** |
15.0 |
15.0 |
(0.3%) |
(16.8%) |
15.0 |
6.7% |
7.0% |
1.3x |
Hold |
|
Standard Chartered |
200.0 |
198.0 |
(1.0%) |
2.7% |
208.0 |
0.6% |
5.6% |
1.5x |
Hold |
|
Stanbic Holdings |
109.5 |
109.3 |
(0.2%) |
5.8% |
100.5 |
4.4% |
(3.6%) |
1.2x |
Sell |
|
HF Group |
6.7 |
6.4 |
(3.9%) |
27.1% |
2.8 |
0.0% |
(56.8%) |
0.3x |
Sell |
|
*Target Price as per Cytonn Analyst estimates **Upside / (Downside) is adjusted for Dividend Yield ***Banks in which Cytonn and/or its affiliates are invested in |
|||||||||
We are “Positive” on equities for investors as the sustained price declines has seen the market P/E decline to below its historical average. We expect increased market activity, and possibly increased inflows from foreign investors, as they take advantage of the attractive valuations, to support the positive performance.
- Residential Sector
During the week, Nairobi County Government held a meeting aimed at kicking off redevelopment of Jevanjee Estate as part of the Nairobi Urban Renewal Project. The redevelopment which is slated to start in a month will see 3,000 units put up at an estimated cost of Kshs 9.1 bn (timelines undisclosed), with the contract having been awarded to Jabavu Limited, a Ugandan-based real estate developer, in 2016. Upon completion, current tenants are guaranteed allocation priority while the rest of the 2,920 units will be acquired through a tenant purchase scheme at approximately Kshs 8,000 per month for a period of 30-years, equating to a total price per unit of Kshs 2.9 mn. This follows the completion of Phase I of the Ngara Project where 228 units were due for handover this month. However, according to Principal Secretary for Housing, Hon. Charles Hinga, a paltry sixty people have paid up the 12.5% of the home value required for unit allocation under Boma Yangu, which translates to 0.4% of the 14,800 Kenyans who are actively making contributions, through the National Housing Development Fund. In our view, Kenyans need increased access to home buying finance as this remains the key impediment to offtake. This we expect will be achieved through (i) the recent inclusion of collective investment schemes (CIS) under registered home ownership savings plan, which will allow homebuyers to save in Capital Markets Authority (CMA)-regulated savings vehicles such as money market funds that offer relatively high yields of up to 11%, and (ii) the Kenya Mortgage Refinancing Company (KMRC), which has begun operations and is set to refinance its first portfolio through Harambee Sacco, a local microfinancing institution, in a Kshs 3.0 bn loan facility for on-lending to the Sacco’s members, set to start by February 2020 at interest rates of below 10.0%, and this is expected to facilitate construction of 3,500 homes. Overall, KMRC is expected to provide a major boost for the state’s Affordable Housing agenda by helping lending institutions to offer affordable mortgages to low-income populations. So far, the institution has mobilized capital from local institutions and multinational institutions such as the World Bank and African Development Bank (AfDB) and it’s expected that the company will stimulate the local mortgage market by 4,000 new mortgages, directly impacting 24,000 beneficiaries.
Also during the week, local real estate developer, Belasi, announced plans of putting up a 30-unit project to be seated on two and a half acres, off Kenyatta Road, Juja. The project, dubbed Summer Green, will entail three-bedroom bungalows with a plinth area of 135 SQM, and will be acquired through a business model known as Partial Home Ownership (PHO), where groups of two to five investors will share the development cost, with initial contributions of Kshs 1.1 mn to Kshs 1.8 mn and each investor will acquire a home at least after four years. The homes are expected to have a value of Kshs 7.5 mn upon completion, which translates to a price per SQM of Kshs 55,556, 24.1% lower than the detached market average for Juja at Kshs 73,182 as at 2019. In our view, such models, where developers seek innovative project financing methods, are necessitated by the current financial environment in Kenya which is characterized by insufficient access to capital as well as high cost of funding. According to the Centre for Affordable Housing Finance in Africa, construction costs in Kenya continue to be among the highest in Africa at approximately Kshs 52,000 per SQM in comparison to countries like South Africa with Kshs 31,000 per SQM. Thus, the onus is on developers to seek alternative ways of financing projects as well as ways of reducing development costs such as investing in areas that exhibit high demand while offering affordable land for development and requisite infrastructure, such as Juja which recorded an average price per acre of Kshs 10.1 mn as at 2019, in comparison to Nairobi County’s average of Kshs 216.6 mn per acre.
Export Processing Zone Authority (EPZA) invited bids from developers for a planned mass housing project in Athi River. The project, which aims to deliver 5,000 units on its 71.7-acres, targets EPZ workers and incoming investors in a bid to promote a live and work concept. As per the directive, the developer will be tasked with master planning, providing building models and funding the project. In addition to having ready market demand from its working population, Athi River, as a real estate investment node, continues to be attractive owing to:
- Affordable land for development with a price per acre of Kshs 12.0 mn as at 2019, in comparison to other satellite towns such as Ruiru and Ruaka Kshs 22.0 mn and Kshs 84.0 mn, respectively,
- Improved infrastructure, especially with the Standard Gauge Railway, the incoming terminus in Mlolongo, and planned dualling of Mombasa Road,
- Demand for residential units from the working class based in Mombasa Road’s and Athi River’s huge industrial sector, and,
- Relatively sufficient sewerage systems in Mavoko County, in comparison to other satellite towns, thus attracting high-rise developments.
(All Values in Kshs Unless Stated Otherwise)
|
Satellite Towns Residential Performance 2018/2019 |
|||||||
|
Area |
Average Price per SQM |
Average Rent per SQM |
Annual Uptake |
Average Occupancy |
Average Price Appreciation |
Average Rental Yield |
Total Returns |
|
Ruaka |
98,098 |
454 |
20.6% |
91.9% |
2.4% |
5.6% |
8.0% |
|
Kitengela |
60,124 |
341 |
16.5% |
76.3% |
2.2% |
4.5% |
6.6% |
|
Thindigua |
99,270 |
499 |
21.1% |
88.4% |
1.8% |
4.2% |
6.1% |
|
Athi River |
66,156 |
356.4 |
17.6% |
84.8% |
0.7% |
5.0% |
5.7% |
|
Rongai |
63,064 |
350 |
19.1% |
68.5% |
1.1% |
4.6% |
5.7% |
|
Syokimau |
59,242 |
289 |
15.6% |
88.2% |
0.0% |
4.9% |
4.9% |
|
Kikuyu |
77,269 |
409 |
21.7% |
72.1% |
0.0% |
4.3% |
4.3% |
|
Lower Kabete |
96,876 |
449 |
20.8% |
86.5% |
(1.1%) |
4.3% |
3.3% |
|
Ruiru |
89,421 |
433 |
31.1% |
74.0% |
(0.8%) |
3.9% |
3.2% |
|
Thika |
46,722 |
331 |
24.2% |
71.0% |
(2.0%) |
4.6% |
2.6% |
|
Average |
75,624 |
391 |
20.8% |
80.2% |
0.4% |
4.6% |
5.0% |
|
|||||||
Source: Cytonn Research 2019
- Retail Sector
The Kenyan retail sector continues to experience turbulent times, reflected by the closure of business by some supermarket chains owing to liquidity challenges. During the week, financially troubled local retailer, Nakumatt, closed its Kisumu branch located at Megacity Mall, leaving the retailer with just five remaining branches countrywide. Such closures have led to increase in entry of international players who continue to make inroads in the country taking over locations operated by the cash-strapped local retailers. Nakumatt’s closure, follows the entry of South Africa-based retailer, Game, which set up shop at Mega City Mall earlier in 2019. To cushion themselves, mall developers are increasingly shifting from the traditional set up of anchoring footfall attraction on one anchor tenant and instead having multiple anchor tenants. This is amidst increased vacancy rates as retailers such as Nakumatt and Choppies continue to close shop due to poor governance and financial constraints. According to Cytonn Retail Report 2019, Kisumu’s retail sector recorded a 12.2% point decline in occupancy rates in 2019 to an average of 75.8% from 88.8% in 2018, consequently leading to a 4.1% points drop in rental yields from 9.7% to 5.6%, on average.
(all values in Kshs unless stated otherwise)
|
Retail Performance in Key Urban Cities in Kenya 2019 |
||||||||
|
Region |
Rent 2019 |
Occupancy Rate 2019 |
Rental Yield 2019 |
Rent 2018 |
Occupancy Rate 2018 |
Rental Yield 2018 |
Change in Occupancy Y/Y |
Change in Yield Y/Y |
|
Mt. Kenya |
129.8 |
80.0% |
8.6% |
130.1 |
84.5% |
9.9% |
(4.5%) |
(1.3%) |
|
Nairobi |
168.6 |
75.1% |
8.0% |
178.9 |
83.7% |
9.4% |
(8.6%) |
(1.4%) |
|
Eldoret |
131.0 |
82.3% |
7.9% |
134.1 |
78.5% |
7.6% |
3.8% |
0.3% |
|
Mombasa |
122.8 |
73.3% |
7.3% |
135.8 |
96.3% |
8.3% |
(22.9%) |
(0.9%) |
|
Kisumu |
96.9 |
75.8% |
5.6% |
106.3 |
88.0% |
9.7% |
(12.2%) |
(4.1%) |
|
Nakuru |
59.2 |
77.5% |
4.5% |
63.0 |
85.0% |
6.9% |
(7.5%) |
(2.4%) |
|
Average |
118.0 |
77.3% |
7.0% |
124.7 |
86.0% |
8.6% |
(8.7%) |
(1.6%) |
|
||||||||
Source: Cytonn Research 2019
Also during the week, an unfinished mall located along the Eastern Bypass was put up for sale at an asking price of Kshs 200.0 mn. The 116,000 SQFT development whose construction has stalled is set to have space for two anchor tenants as well as office space. In the past two years we have continued to see developers stalling projects owing to insufficient access to capital attributable to low private sector credit growth and high cost of financing This is evidenced by a 12.3% decline in cement consumption for the first eight months over the last three years to 3.9 mn metric tons in 2019 from 4.5 mn metric tons as at 2016, as shown below:
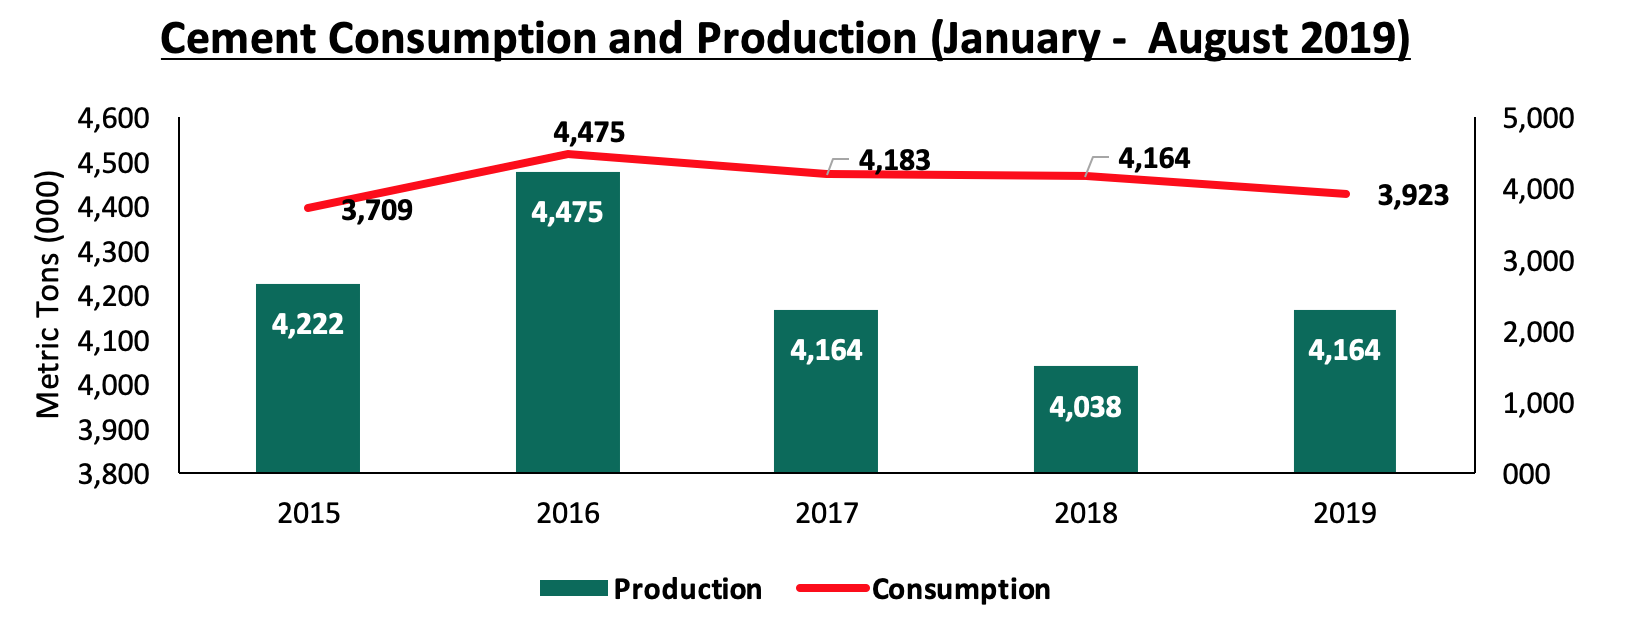
Source: KNBS
- Hospitality Sector
In a bid to promote Kenya’s business and conferencing tourism, Kenyatta International Conference Center was during the week marketed at the IBTM (Global Incentive and Business, Travel and Meetings) Event, a leading global event for the meetings, incentives, conferences and events industry, which takes place annually in Barcelona, Spain and attracts approximately 15,000 global conference industry players. The move follows the recent formation of the National Convention Bureau by the Kenya Tourism Board, whose main objective includes serving as the focal point of the Meetings, Incentives, Conventions, and Exhibitions (MICE) activities, as well as marketing and selling Kenya as a business events destination. This plays a testament to the government’s commitment towards promoting Kenya as the preferred business and conferencing destination, providing a major boost for the general hospitality industry. According to KNBS, the number of business travelers in Kenya has been growing at a four-year CAGR of 11.4% whereas in 2018 it grew by 23.0% to 257,000 from 2019,000 in 2017, attributable to a 6.8% increase in international conferences to 201 from 191 in 2017. In 2019, the country has continued to host high-profile meetings such as the International Conference on Population and Development (ICPD 25) which attracted more than 9,500 delegates. This has been a result of a conducive environment for tourism due to enhanced security and continued investment in key infrastructure such as roads, and quality rail and air infrastructure. This continues to attract local and international players into the hospitality industry seeking to tap into the growing international visitor arrivals, who according to KNBS increased by 14.0% overall in 2018 to 2.0 mn from 1.8 mn in 2017, consequently leading to a 31.3% increase in tourism earnings to Kshs 157.4 bn in 2018 from Kshs 119.9 bn in 2017, as shown below:
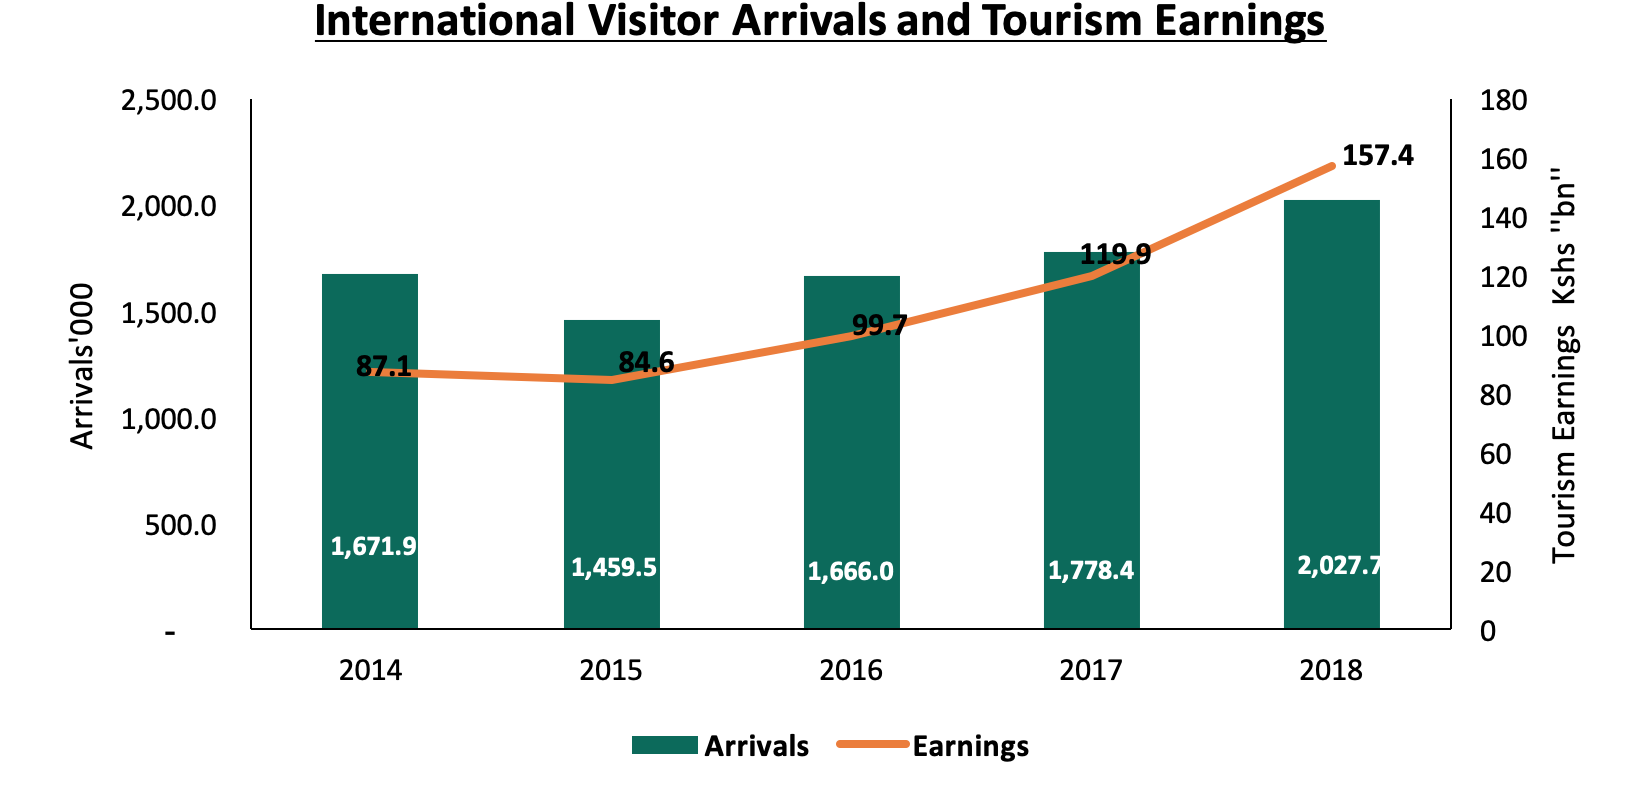
Source: KNBS
- Infrastructure Sector
In a bid to improve transport infrastructure in the region, Kenya Urban Roads Authority (KURA) announced the completion of the newly constructed Outer Ring Interchange, set to be commissioned in one month, and is aimed at creating a seamless link to Thika Road, hence, easing traffic snarl ups on the two highways. Investments in transport infrastructure continues to open up areas for development and boosting prices for existing properties, evidenced by growth prices in areas like Kasarani and Embakasi, where land prices have grown by an average 7-year CAGR of 11.1% since 2011, attributable to speculation stemming from expected infrastructural developments, namely Thika Road and the Outer Ring road, which were completed in 2012 and 2018, respectively.
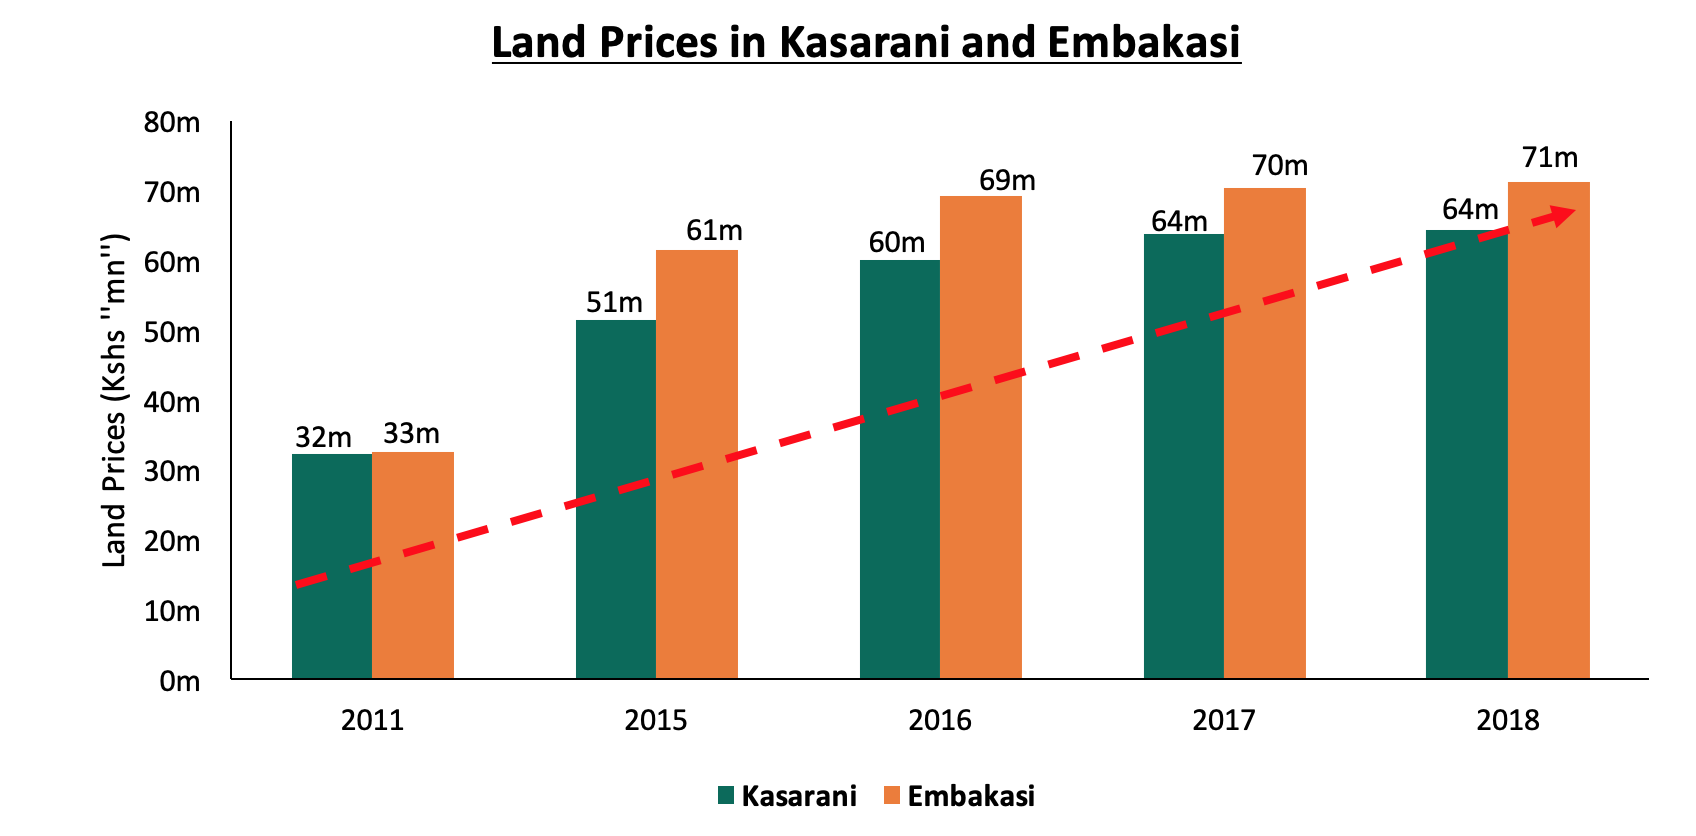
Source: Cytonn Research 2019
The government also launched the construction of a 40-km 400kv power line which is set to power Konza City, as well as Kajiado, Makueni, and Machakos Counties. The project is a partnership between the Ministry of Energy and China Aerospace Construction Group, a Chinese company and is aimed at ensuring a steady power supply, especially for the upcoming Konza City. Reliable power supply is identified as one of the key enablers for Kenya’s development agendas as approximately 55.0% of Kenya’s GDP comes from services, transport, finance, tourism, information and communications technology (ICT), and trade sectors. As such, the government has been keen on raising Kenya’s quality of electricity supply through similar projects. For instance, as part of the Kenya Electricity Modernization Project, Kenya Power Limited Company (KPLC) launched a live line maintenance service in Nairobi in October 2019, which is set to reduce scheduled electricity outages in the region by up to 40.0%. For more, see our infrastructure note update 2019
Our outlook for the real estate sector remains neutral to positive. We expect the sector to continue improving boosted by infrastructural improvements, increase in foreign direct investments, and a vibrant tourism sector.
In 2018, we published the Nairobi Metropolitan Area Serviced Apartments Report, 2018, which highlighted that serviced apartments within the Nairobi Metropolitan Area(NMA) recorded average rental yield and occupancy rates of 7.4% and 79.9%, respectively, supported by an improved political environment following the conclusion of the prolonged elections which spilled over from 2017 to early 2018, and increased marketing efforts of Kenya as a travel destination by the Kenyan Government. This year, we update our report findings on serviced apartments in NMA by focusing on:
- Overview of the Kenyan Hospitality Sector,
- Introduction to Serviced Apartments,
- Supply and Distribution of Serviced Apartments In the Nairobi Metropolitan Area,
- Performance of Serviced Apartments in the Nairobi Metropolitan Area,
- Serviced Apartments Performance by Node
- Comparative Analysis- 2018/2019 Market Performance
- Performance per Typology
- Recommendation and Outlook.
Section I: Overview of the Kenyan Hospitality Sector
The hospitality sector has continued being a key driver of the Kenyan economy evidenced by the continued contribution to GDP by accommodation and food services, whose growth expanded to 16.6% in 2018, compared to 14.4% in 2017, according to the KNBS Economic Survey 2019. The sector has continued to record entry and expansion of international players such as Radisson Hotel Group, driven by strong demand for hospitality services and facilities. According to the KNBS, the total number of visitors arriving through Jomo Kenyatta (JKIA) and Moi International Airports (MIA) increased by 5.4% to 1.2 mn between January and September 2019, from 1.1 mn persons during the same period in 2018.
Factors that have continued to drive the hospitality sector include:
- Improved Security - Kenya’s security has continued to improve evidenced mainly by the reduced terrorist attacks. This has boosted tourists’ confidence in the country, making it a preferred travel destination for both business and holiday travelers,
- Growth of Meetings, Incentives, Conferences and Exhibitions (MICE) Tourism - According to KNBS Economic Survey 2019, local conferences grew by 7.9% in 2018 to 4,147, from 3,844 in 2017, while international conferences grew by 6.8% to 204, from 191 in 2017, signaling a growth in the MICE tourism sector, which has continued to drive the hospitality sector. The growth in the sector has been largely enabled by the presence of conferencing facilities such as the Kenyatta International Convention Centre (KICC), which was crowned as the leading meetings and conference center in Africa at the World Travel Awards 2019. Notable conferences in 2019 included the International Conference on Population and Development (ICDP) Nairobi Summit that saw more than 6,000 world leaders converge in Nairobi. International conferences of such stature solidify the confidence of the international community to find Kenya as a preferred destination for business tourism,
- Travel Tourism - Holiday travelers are the main drivers of Kenya’s hospitality sector, accounting for approximately 71.2% of international arrivals over the last 5-years. In 2018, the number of holiday travelers came in at 1.5 mn, 61.5% higher than the 0.9 mn recorded in 2017 and we expect this to grow further in 2019, enhancing the continued demand for food and accommodation services, thus boosting the hospitality sector. The graph below shows the growth of tourist arrivals by purpose over the years:
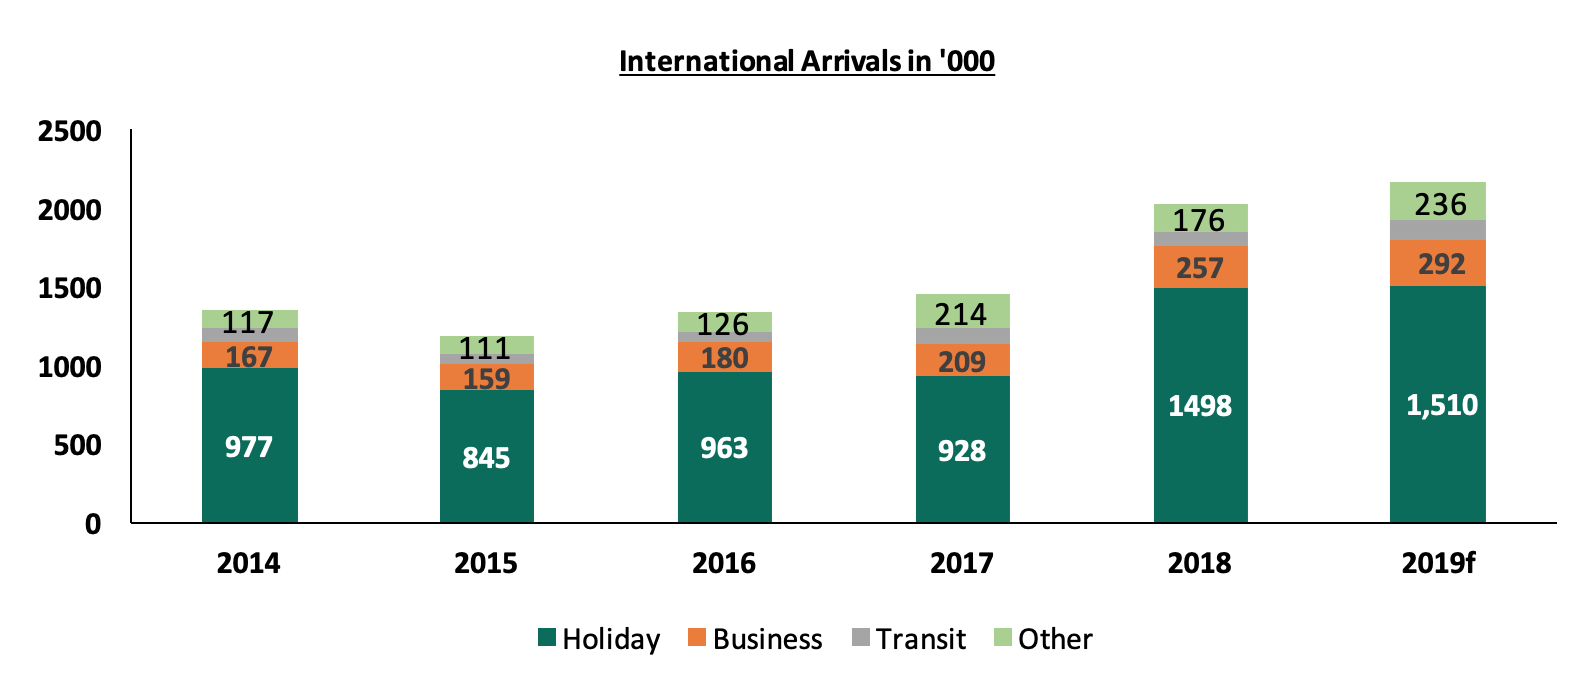
Source: Kenya National Bureau of Statistics
- Recognition of Nairobi as a Regional Hub - The strategic geo-positioning of Nairobi, in addition to the improving infrastructure, sets it up as a preferable regional hub for the East Africa Community, and this has thus continued to enhance the growth of business travelers into the region, and,
- Positive Accolades - Kenya’s hospitality facilities continue to receive global recognition, boosting the country’s status as a preferred travel destination globally while promoting it as an attractive investment opportunity for international players. Case in point, (i) Nairobi edged out notable cities like Johannesburg, and Kigali to be crowned as Africa’s leading business travel destination while Nairobi’s own KICC was awarded as the leading meetings and conference destination during the 2019 World Travel Awards, (ii) JKIA received the ‘Highly Acclaimed’, African Airport of the Year Award during the 4th edition of ACA 2019 Conference held in Johannesburg, South Africa, and (iii) seven Kenyan hotels received various awards at the World Luxury Hotel Awards 2019 in Finland, see the list on Cytonn Weekly#43/2019
Nevertheless, the sector continues to face challenges, mainly;
- Travel Advisories - Despite an elongated prevalence of peace in the country, Kenya still suffers from risk-prone travel advisories. With the United States of America travel advisory highlighting some areas in Kenya such as Kilifi, Lamu, Kibera, Eastleigh, and the Somali border as high-risk crime and terrorism prone areas, and,
- Delayed Infrastructural Projects - This continues to cripple access to areas, for example with the dragging expansion of Malindi Airport, which continues to result in a reduced number of tourist arrivals at the East African coast due to lack of direct flights to the airport.
Section II: Introduction to Serviced Apartments
To reiterate our 2018 Topical, a serviced apartment is a fully furnished apartment, available for both short-term and long-term stays, providing amenities for daily use, housekeeping and a range of other services, all included within the rental price. The concept has gained popularity in recent years also outside the business travel space, as more leisure travelers are finding that serviced apartments are easily available and offer a credible and cost-effective alternative. They are especially economical for longer stays and for group and family travel. According to the KNBS statistics, the average length of stay of guests improved slightly by 0.1% points to 13.1% in 2018, from 13.0% in 2017, and these long term stays have continued to drive the demand for serviced apartments in Kenya with an occupancy rate of up to 88.0% in some submarkets.
The advantages of a serviced apartment include;
- They offer more space than a traditional hotel room, with the former having units of up to 140 SQM, while a standard hotel room size ranges between 30- 50 SQM, within the Nairobi market,
- Substantially cheaper than a hotel room when staying for a longer period of time. For example, a standard 3-star hotel in Nairobi charges on average Kshs 10,700 per night for a suite, while a studio serviced apartments charges on average Kshs 8,000 per night within the same location,
- Compared to hotels, a serviced apartment is more of a home, with utilities that enable more freedom and comfort,
- Offers the ease of integration, as the concept offers guests a chance to integrate with the larger community as they are located within or in close proximity to other residential developments,
- It resembles the culture of the specific area. This gives insight into what a real local apartment would look like, giving a more comprehensive immersion of the culture and values compared to hotel rooms, which usually all look alike, and
- The easy conversion, as serviced apartments can easily be converted into furnished or normal apartments in the case where the former is not performing well.
However, as the concept continues to gain traction, competition on local players continues to heighten with renowned international brands such as Radisson Hotel Group and Mövenpick Hotels & Resorts joining the market.
Section III: Supply and Distribution of Serviced Apartments in the Nairobi Metropolitan Area
Serviced apartments in the Nairobi Metropolitan Area (NMA) increased by a 5-Year CAGR of 10.4% to 5,593 in 2019, from 3,414 in 2015. Some of the developments introduced in the market during the year include 122-room Radisson Hotel and Residency by Radisson Hotel Group in Kilimani, which opened in October, and CySuites by Cytonn Investments, a 40-unit development in Church Road, Westlands, set to begin operations in November 2019.
In terms of distribution, Westlands and Kilimani recorded the largest market share of serviced apartments within the Nairobi Metropolitan Area, recording market shares of 37.6% and 26.7%, respectively, of the total developments. This is attributed to the attractiveness of the areas due to; (i) proximity to the Nairobi CBD and other major business nodes such as Upperhill and Westlands, (ii) good security as the nodes serve as United Nations (UN) Blue Zone areas offering a conducive and favorable environment for expatriates to reside, and (iii) high presence of international organizations such as International Committee of the Red Cross (ICRC), Oxfam and Save the Children International.
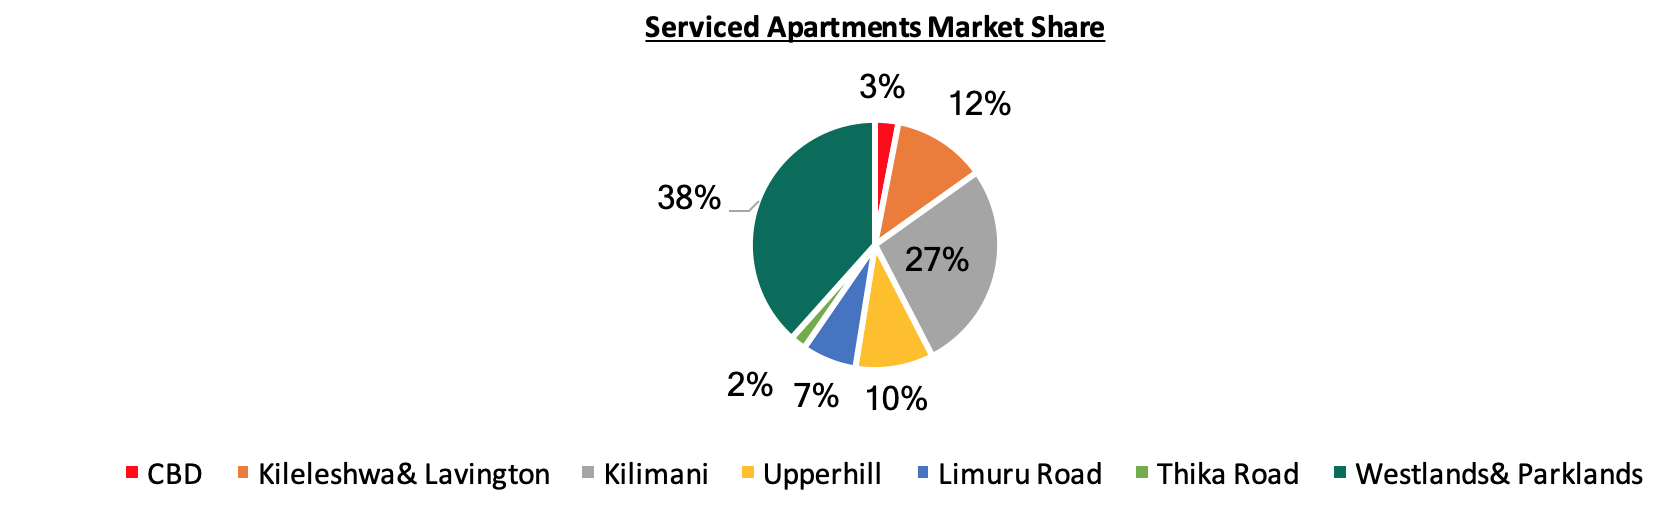
Source: Cytonn Research 2019
Currently, there are at least 824 apartments in the development pipeline set for completion by 2020. Some of the developments in the pipeline include:
|
Serviced Apartments Developments in the Pipeline |
||||
|
Name |
Developer |
Location |
Number of Units |
Completion |
|
Skynest |
Elegant Properties |
Westlands |
250 |
2020 |
|
Britam |
Britam |
Kilimani |
163 |
2020 |
|
Sun Africa Luxury Apartments |
Sun Africa Hotels Group |
Kilimani |
20 |
2020 |
|
9 Oak |
Mifta Holdings |
Kilimani |
120 |
2020 |
|
Avic |
Avic |
Westlands |
51 |
2020 |
|
Ole Sereni |
Ole sereni |
Mombasa Road |
20 |
2020 |
|
Elsie Ridge |
Intime Group |
Spring Valley |
40 |
2020 |
|
Habitat |
Ekco Investments |
Kilimani |
160 |
2020 |
|
Total |
824 |
|||
Source: Cytonn Research 2019
Section IV: Performance of Serviced Apartments in the Nairobi Metropolitan Area
For the purpose of this report, we tracked the performance of serviced apartments in 7 nodes in the Nairobi Metropolitan Area and compared this to the performance to 2018. The key metrics we looked at include:
- Charged Rates: This is the amount guests pay for an apartment in a specific market, on a daily basis, weekly and/or monthly. It informs potential investors on the rental income they are likely to gain from investing in serviced apartments,
- Occupancy Rates: This measures the number of apartments that are let out of the total available, in order to inform on the expected rental yield of the developments, and,
- Rental Yields: This refers to the measure of return on the real estate investment, from the rental income collected annually. The rental yield informs potential investors on the return they are likely to get from a property and hence the time it will take an investor to recoup the money invested. To calculate this, we have estimated annual income from monthly revenues having deducted operational costs assumed to be at 40.0% of revenues. To estimate the investment value, we have calculated development cost per SQM by factoring in land costs based on the location, construction costs, equipping costs, professional fees and other development-related costs. The formula to calculate rental yield is as follows;
Rental Yield= Monthly Rent per SQM x Occupancy Rate x (1-40.0% operational cost) x 12 months
Development Cost per SQM
*Important to note, however, is that depending on the actual incurred land cost, plot ratios, the level of finishing and equipping, investors will generally incur varying costs.
On performance, we will start by covering the performance by the node during the year, compare this with 2018 performance, then cover the performance by typology.
- Serviced Apartments Performance by Node
From our analysis, serviced apartments within the NMA recorded an average rental yield of 7.6% in 2019, 0.2% points higher than the 7.4% recorded in 2018, and this we attribute to a 2.3% increase in monthly charges per SQM, from Kshs 2,742 in 2018 to Kshs 2,806 in 2019, fueled by the continued demand for serviced apartments by both guests on business and leisure travels. The improved performance has on overall been supported by the stable political environment and improved security, thus making Nairobi an ideal destination for both business and holiday travelers.
The table below shows a summary of the performance of the various nodes within NMA:
(All values in Kshs unless stated otherwise)
|
|
2019 Summary of Performance per Node |
|||||||||||
|
|
Unit Sizes (SQM) |
Monthly Charges per Unit (Kshs) |
|
|
|
|
||||||
|
Node |
Studio |
1 bed |
2 bed |
3 bed |
Studio |
1 Bed |
2 Bed |
3 Bed |
Occupancy 2019 |
Monthly Charge per SQM 2019 |
Devt Cost per SQM(Kshs) |
Rental Yield 2019 |
|
Westlands& Parklands |
33 |
85 |
115 |
177 |
249,700 |
279,018 |
319,529 |
337,408 |
80.8% |
3,884 |
209,902 |
10.8% |
|
Kilimani |
39 |
69 |
110 |
149 |
160,000 |
221,167 |
362,813 |
418,000 |
80.0% |
3,353 |
202,662 |
9.5% |
| Limuru Road/ Gigiri |
|
51 |
137 |
187,400 |
197,184 |
260,500 |
300,000 |
88.2% |
3,430 |
231,715 |
9.4% |
|
|
Kileleshwa & Lavington |
38 |
70 |
134 |
140,000 |
193,333 |
268,990 |
474,000 |
82.4% |
2,845 |
206,132 |
8.2% |
|
|
Upperhill |
75 |
110 |
156 |
195,000 |
304,600 |
368,333 |
67.8% |
2,577 |
209,902 |
6.0% |
||
|
Nairobi CBD |
51 |
90 |
115 |
137 |
130,250 |
170,500 |
241,786 |
331,250 |
72.0% |
2,230 |
224,571 |
5.1% |
| Thika Road |
|
70 |
100 |
144 |
110,000 |
131,667 |
155,000 |
84.4% |
1,321 |
200,757 |
4.0% |
|
|
Average |
40 |
73 |
117 |
153 |
173,470 |
195,172 |
269,983 |
340,570 |
79.4% |
2,806 |
212,234 |
7.6% |
|
High |
51 |
90 |
137 |
177 |
249,700 |
279,018 |
362,813 |
474,000 |
88.2% |
3,884 |
231,715 |
10.8% |
|
Low |
33 |
51.11 |
100 |
137 |
130,250 |
110,000 |
131,667 |
155,000 |
67.8% |
1,321 |
200,757 |
4.0% |
|
||||||||||||
Source: Cytonn Research 2019
- Comparative Analysis- 2018/2019 Market Performance
Overall, serviced apartments’ performance slightly improved in 2019, evidenced by an increase in rental yields to 7.6% from 7.4%, supported by the growing number of tourist arrivals, despite the tough economic environment.
The table below shows the comparative analysis:
(All values in Kshs unless stated otherwise)
|
Comparative Analysis- 2018/2019 Market Performance |
|||||||||
|
Node |
Monthly Charge per SM 2019 |
Monthly Charge per SM 2018 |
Monthly charge per SQM % ∆ |
Occupancy 2019 |
Occupancy 2018 |
Occupancy Rates ∆ %points |
Rental Yield 2019 |
Rental Yield 2018 |
% Rental Yield ∆ |
|
Westlands& Parklands |
3,884 |
4,044 |
(4.0%) |
80.8% |
76.4% |
4.4% |
10.8% |
10.6% |
0.2% |
|
Kilimani |
3,353 |
3,567 |
(6.0%) |
80.0% |
86.0% |
(6.0%) |
9.5% |
10.9% |
(1.4%) |
|
Limuru Road/ Gigiri |
3,430 |
3,685 |
(6.9%) |
88.2% |
84.4% |
3.8% |
9.4% |
9.7% |
(0.3%) |
|
Kileleshwa& Lavington |
2,869 |
2,686 |
5.9% |
82.4% |
82.9% |
(0.4%) |
8.2% |
7.8% |
0.4% |
|
Upperhill |
2,577 |
2,580 |
(0.1%) |
67.8% |
60.0% |
7.8% |
6.0% |
5.3% |
0.7% |
|
Nairobi CBD |
2,230 |
2,374 |
(6.1%) |
72.0% |
74.4% |
(2.4%) |
5.1% |
5.7% |
(0.5%) |
|
Thika Road |
1,321 |
1,361 |
(2.9%) |
84.4% |
90.0% |
(5.6%) |
4.0% |
4.4% |
(0.4%) |
|
Msa Road |
1,642 |
85.0% |
5.0% |
||||||
|
Average |
2,806 |
2,742 |
2.3% |
79.4% |
79.9% |
(0.5%) |
7.6% |
7.4% |
0.2% |
|
|||||||||
Source: Cytonn Research 2019
- Upperhill recorded the highest increased in average rental yield to 6.0% from 5.3% recorded in 2018, and this we attribute to a 7.8% increase in occupancy rates attributed to a growing preference of the area given its the proximity to business nodes such as Kilimani, Westlands and the Nairobi CBD, ease of accessibility, proximity to the main airports that is Jomo Kenyatta International Airport (JKIA) and the Wilson Airport, in addition to the low supply of serviced apartments. However, the performance of the node remains relatively low compared to the market as the area is more of a commercial node thus has low preference for residence,
- Kilimani ranked second in performance with average rental yields of 9.5%. However, this was a 1.4% points decline from 10.9% recorded in 2018, which we attribute to the 6.0% points decline in occupancy rates and 6.0% correction in monthly charges per SQM, attributed to the growing competition from neighboring nodes such as Westlands, in addition to the growing supply.
- Performance per Typology
In terms of performance per typology, studio units recorded the highest average rental yield at 13.7%, mainly attributed to the relatively high occupancy rates at 83.9%, compared to 1, 2 and 3 bedroom units at 83.8%, 76.4% and 75.5%, respectively, supported by the relatively low supply of the typology in the market.
The table below shows the summary of performance per typology:
(All values in Kshs unless stated otherwise)
|
2019 Performance per Typology |
||||
|
Typology |
Average Size (SQM) |
Monthly Charges per SQM (Kshs) |
Occupancy |
Rental Yield 2019 |
|
Studio |
39 |
4,821 |
83.9% |
13.7% |
|
1 bedroom |
75 |
2,739 |
83.8% |
7.8% |
|
2 bedroom |
116 |
2,311 |
76.4% |
6.0% |
|
3 bedroom |
152 |
2,172 |
75.5% |
5.6% |
|
3,011 |
79.9% |
8.3% |
||
|
||||
Source: Cytonn Research 2019
Section V: Recommendations and Outlook
Having looked at the factors driving the hospitality industry, and specifically the serviced apartments sector, challenges and the current performance, we now conclude with a recommendation of the investment opportunity and outlook.
|
Serviced Apartments Sector Outlook |
||
|
Measure |
Sentiment |
Outlook |
|
Serviced Apartments Performance |
In 2019, serviced apartments recorded relatively high rental yield at 7.6%, 0.2% points higher than 7.4% recorded in 2018, and 2.7% points higher than 4.9% for the residential sector (apartments) according to Cytonn Research. Given the growing popularity of the concept, improved security and political stability, we expect the theme to continue recording improved performance going forward. |
Positive |
|
International Tourism |
The total number of international visitors arriving through JKIA and MIA increased by 5.4% to 1.2 mn for the period between January and September 2019 from 1.1 mn persons during the same period in 2018. We expect the numbers to continue going up supported by; political stability, positive accolades, in addition to the ongoing marketing efforts by the government and the industry players. |
Positive |
|
MICE Tourism |
MICE tourism has continued to grow evidenced by the 6.8% and 7.9% increase in international and local conferences, respectively, with 204 conferences in 2018, from 191 recorded in 2017, while the local conferences grew to 4,147 in 2018 from 3,844 in 2017. We expect this to increase in 2020 and onwards, supported by the calm political environment, aggressive marketing by the Kenyan government and the improving infrastructure. |
Positive |
|
Supply |
There were approximately 5,505 serviced apartment units in Nairobi as at 2019 with an additional 1,377 apartments set for completion by 2021. We therefore expect increased competition especially in areas such as Westlands and Kilimani which have the majority of the units in operation and also in the development pipeline. |
Neutral |
Based on the above metrics, we had 3 positive factors and only 1 neutral factor, thus our overall outlook for the serviced apartments theme is POSITIVE. The investment opportunity lies in Westlands and Parklands, and Kilimani, which have continued to be best performing nodes with average rental yields of 10.8% and 9.5%, respectively.
Disclaimer: The views expressed in this publication are those of the writers where particulars are not warranted. This publication is meant for general information only and is not a warranty, representation, advice or solicitation of any nature. Readers are advised in all circumstances to seek the advice of a registered investment advisor.

- Talk to us
- Kenya
- P.O Box 20695 - 00200, Nairobi, Kenya
- Cell +254709101200
- Tel +254709101200
- WhatsApp +254741676635
- United States
- +254709101200
- DOWNLOAD OUR APP
-


- Kenya
- 8th Floor, Pinetree Plaza, Kaburu Drive, Ngong Road, Nairobi, Kenya
- USA
- Suite 1150, 1775 Eye Street NW, USA, Washington DC 20006, USA
- Investments
- High Yield
- Private Equity
- Real Estate
- Real Estate
- RiverRun Estates
- Cytonn Towers
- The Ridge
- Taraji Heights
- The Alma