National Health Insurance Fund (NHIF) Review, & Cytonn Weekly #27/2023
By Research, Jul 9, 2023
Executive Summary
Fixed Income
During the week, T-bills were oversubscribed for the first time in four weeks, with the overall subscription rate coming in at 125.5%, up from an undersubscription rate of 39.5 % recorded the previous week. Investor’s preference for the shorter 91-day paper persisted as they sought to avoid duration risk, with the paper receiving bids worth Kshs 26.7 bn against the offered Kshs 4.0 bn, translating to an oversubscription rate of 667.7%, up from 144.5% recorded the previous week. The subscription rate for the 364-day paper increased to 22.7%, up from 15.1% recorded the previous week, while the subscription rate for the 182-day paper decreased to 11.4%, from 22.0% recorded the previous week. The government accepted a total of Kshs 30.1 bn worth of bids out of the total bids received, translating to an acceptance rate of 100.0%. The yields on the government papers continued to rise, with the yields on the 364-day, 182-day, and 91-day papers increasing by 9.3 bps, 25.2 bps, and 11.0 bps to 12.3%, 12.2%, 12.0% respectively;
In the primary market, the government is seeking to raise an additional Kshs 40.0 bn for budgetary support by offering a new bond, FXD1/2023/5 with a 5-year tenor to maturity and reopening the FXD1/2016/10, with a 3.2-years tenor to maturity. The coupon rate for the FXD1/2023/5 will be market-determined; however, the coupon rate for the FXD1/2016/10 is set at 15.0%. Additionally, the interest on FXD1/2023/5 will be subjected to a withholding tax at a rate of 15.0%, while the interest on FXD1/2016/10 will be subjected to a 10.0% withholding tax rate. The bidding closes on 11th July 2023. We anticipate the bonds to be oversubscribed, given the short tenor to maturity of the FXD1/2016/10, as well as its high coupon rate and its lower withholding tax, which will act as a bait to investors by providing a margin of safety on the back of rising market interest rates. However, investors are expected to attach higher yields as they seek to cushion themselves against future losses on the back of the government’s debt sustainability concerns and the sustained inflationary pressures experienced in the country. Our recommended bidding range for the bonds are 14.4% – 14.9% for FXD1/2023/5 and 14.2% –14.7% for FXD1/2016/10, based on bonds of similar tenor trading ranges;
The Kenya National Bureau of Statistics (KNBS) recently released the Q1'2023 Quarterly Gross Domestic Product (GDP) Report, highlighting that the Kenyan economy recorded a 5.3% growth in Q1’2023, albeit slower than the 6.2% growth recorded in Q1’2022. Additionally, the Kenya National Bureau of Statistics released the Q1’2023 Quarterly Balance of Payment Report, highlighting that Kenya’s balance of payments position recorded a 6.0% deterioration, with the deficit widening to Kshs 127.8 bn in Q1’2023, from a deficit of Kshs 120.6 bn recorded in Q1’2022 and a significant deterioration from the Kshs 29.1 bn deficit recorded in Q4’2022;
Also, during the week, Stanbic Bank released its monthly Purchasing Manager’s Index (PMI), highlighting that the index for the month of June 2023 came in at 47.8, down from 49.4 in May 2023, signalling a stronger downturn of the business environment in the fifth month running in June 2023;
Equities
During the week, the equities market was on an upward trajectory, with NASI, NSE 20, and NSE 25 gaining by 4.1%, 2.7%, and 4.0%, respectively, taking the YTD performance to losses of 12.5%, 3.4%, and 9.6% for NASI, NSE 20, and NSE 25, respectively. The equities market performance was mainly driven by gains recorded by large-cap stocks such as Safaricom, Equity Group, BAT and Bamburi of 8.0%, 4.6%, 4.1%, and 2.8%, respectively. The gains were, however, weighed down by losses recorded by stocks such as KCB Group of 0.5%;
Real Estate
During the week, the Kenya National Bureau of Statistics (KNBS) released the Q1’2023 GDP Report, highlighting that the Real Estate sector grew by 5.2% in Q1’2023, representing a 0.8% points slower growth than the 6.0% growth that was recorded in Q1’2022. In the retail sector, IBL Group, a Mauritian business conglomerate, announced plans to subscribe to additional shares in Mambo Retail Limited, which will acquire an additional 11.0% stake worth Kshs 5.8 bn in Naivas International Limited, bringing the firm’s holding to 51.0% of the shares in Naivas. In the Regulated Real Estate Funds, under the Real Estate Investment Trusts (REITs) segment, Fahari I-REIT closed the week trading at an average price of Kshs 6.0 per share in the Nairobi Securities Exchange, remaining relatively unchanged from the price recorded the previous week. On the Unquoted Securities Platform as of July 7, 2023, Acorn D-REIT and I-REIT closed the week trading at Kshs 23.9 and Kshs 21.6 per unit, respectively, a 19.5% and 8.0% gain for the D-REIT and I-REIT, respectively, from the Kshs 20.0 inception price. In addition, the Cytonn High Yield Fund (CHYF) closed the week with an annualized yield of 13.6%, remaining relatively unchanged from the previous week;
Focus of the Week
The National Health Insurance Fund (NHIF) was established in 1966 through an act of parliament. Its core mandate is to provide affordable medical insurance coverage to all Kenyans, thereby enabling Kenyans to access quality and affordable medical services from medical institutions. The fund is governed by the NHIF Act (1998), which over the years has been subjected to a number of amendments to address the changing health care needs of the health sector in the country. On 1st May 2023, President William Ruto announced the monthly contribution rate would be revised upwards from contribution of between Kshs 150.0 to Kshs 1,700.0 based on their monthly gross salary brackets, to 2.75% of the employee’s income, a move meant to address the cash crunch affecting the fund. Consequently, this week, we discuss the current state of the NHIF by focusing on the milestones achieved and the challenges facing the fund. We will also make a comparison with similar initiatives in other countries and give recommendations towards achieving a sustainable fund;
Investment Updates:
- Weekly Rates:
- Cytonn Money Market Fund closed the week at a yield of 12.08%. To invest, dial *809# or download the Cytonn App from Google Playstore here or from the Appstore here;
- Cytonn High Yield Fund closed the week at a yield of 13.56% p.a. To invest, email us at sales@cytonn.com and to withdraw the interest, dial *809# or download the Cytonn App from Google Playstore here or from the Appstore here;
- We continue to offer Wealth Management Training every Wednesday, from 9:00 am to 11:00 am. The training aims to grow financial literacy among the general public. To register for any of our Wealth Management Trainings, click here;
- If interested in our Private Wealth Management Training for your employees or investment group, please get in touch with us through wmt@cytonn.com;
- Cytonn Insurance Agency acts as an intermediary for those looking to secure their assets and loved ones’ future through insurance namely; Motor, Medical, Life, Property, WIBA, Credit and Fire and Burglary insurance covers. For assistance, get in touch with us through insuranceagency@cytonn.com;
- Cytonn Asset Managers Limited (CAML) continues to offer pension products to meet the needs of both individual clients who want to save for their retirement during their working years and Institutional clients that want to contribute on behalf of their employees to help them build their retirement pot. To more about our pension schemes, kindly get in touch with us through pensions@cytonn.com;
Real Estate Updates:
- For more information on Cytonn’s real estate developments, email us at sales@cytonn.com;
- Phase 3 of The Alma is now ready for occupation and the show house is open daily. To join the waiting list to rent, please email properties@cytonn.com;
- For Third Party Real Estate Consultancy Services, email us at rdo@cytonn.com;
- For recent news about the group, see our news section here;
Hospitality Updates:
- We currently have promotions for Staycations. Visit cysuites.com/offers for details or email us at sales@cysuites.com;
Money Markets, T-Bills Primary Auction:
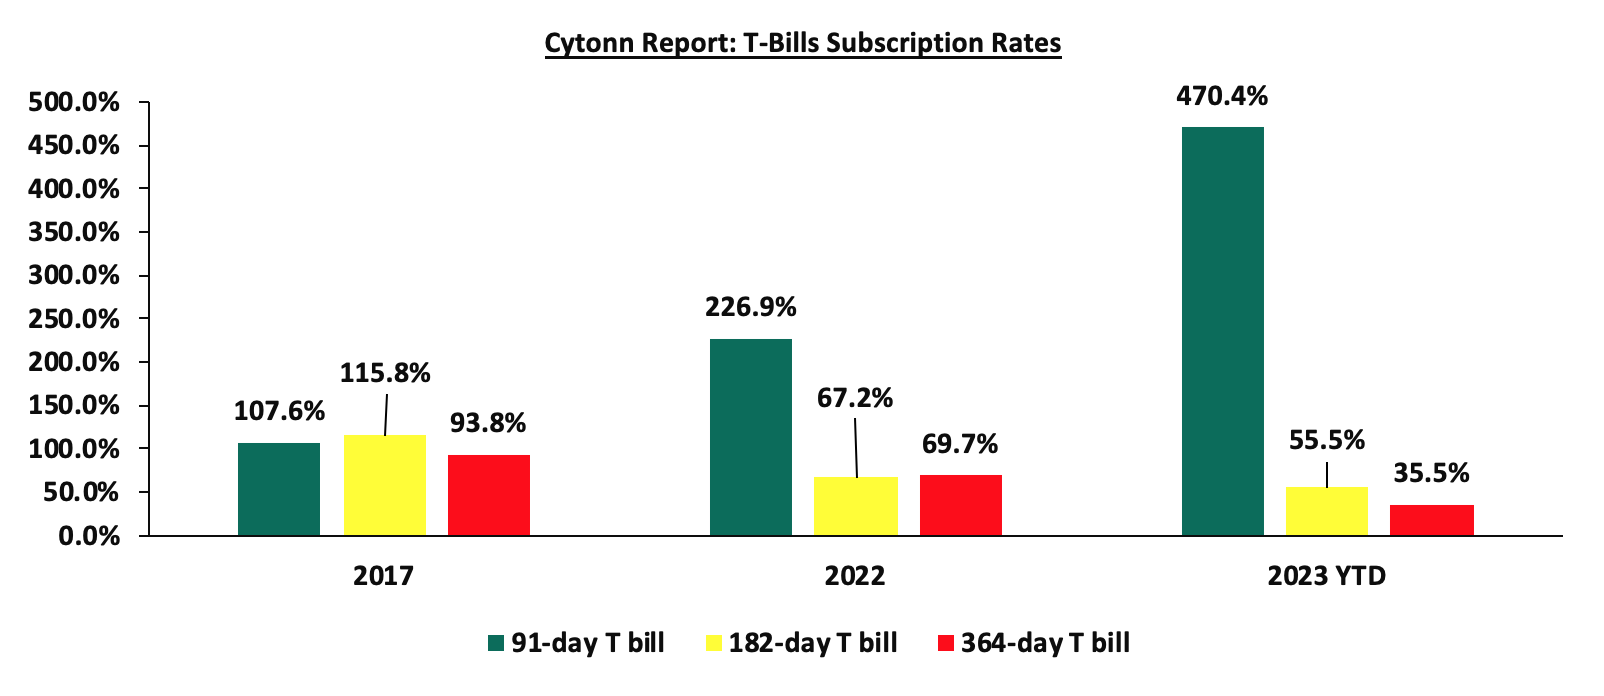
During the week, T-bills were oversubscribed for the first time in four weeks, with the overall subscription rate coming in at 125.5%, up from an undersubscription rate of 39.5 % recorded the previous week. Investor’s preference for the shorter 91-day paper persisted as they sought to avoid duration risk, with the paper receiving bids worth Kshs 26.7 bn against the offered Kshs 4.0 bn, translating to an oversubscription rate of 667.7%, up from 144.5% recorded the previous week. The subscription rate for the 364-day paper increased to 22.7%, up from 15.1% recorded the previous week, while the subscription rate for the 182-day paper decreased to 11.4%, from 22.0% recorded the previous week. The government accepted a total of Kshs 30.1 bn worth of bids out of the total bids received, translating to an acceptance rate of 100.0%. The yields on the government papers continued to rise, with the yields on the 364-day, 182-day, and 91-day papers increasing by 9.3 bps, 25.2 bps, and 11.0 bps to 12.3%, 12.2%, 12.0% respectively. The chart below compares the overall average T- bills subscription rates obtained in 2017, 2022 and 2023 Year to Date (YTD):
In the primary market, the government is seeking to raise an additional Kshs 40.0 bn for budgetary support by offering a new bond, FXD1/2023/5 with a 5-year tenor to maturity and reopening the FXD1/2016/10, with a 3.2-years tenor to maturity. The coupon rate for the FXD1/2023/5 will be market-determined; however, the coupon rate for the FXD1/2016/10 is set at 15.0%. Additionally, the interest on FXD1/2023/5 will be subjected to a withholding tax at a rate of 15.0%, while the interest on FXD1/2016/10 will be subjected to a 10.0% withholding tax rate. The bidding closes on 11th July 2023. We anticipate the bonds to be oversubscribed, given the short tenor to maturity of the FXD1/2016/10, as well as its high coupon rate and its lower withholding tax, which will act as a bait to investors by providing a margin of safety on the back of rising market interest rates. However, investors are expected to attach higher yields as they seek to cushion themselves against future losses on the back of the government’s debt sustainability concerns and the sustained inflationary pressures experienced in the country. Our recommended bidding range for the bonds are 14.4% – 14.9% for FXD1/2023/5 and 14.2% –14.7% for FXD1/2016/10, based on bonds of similar tenor trading ranges.
Money Market Performance:
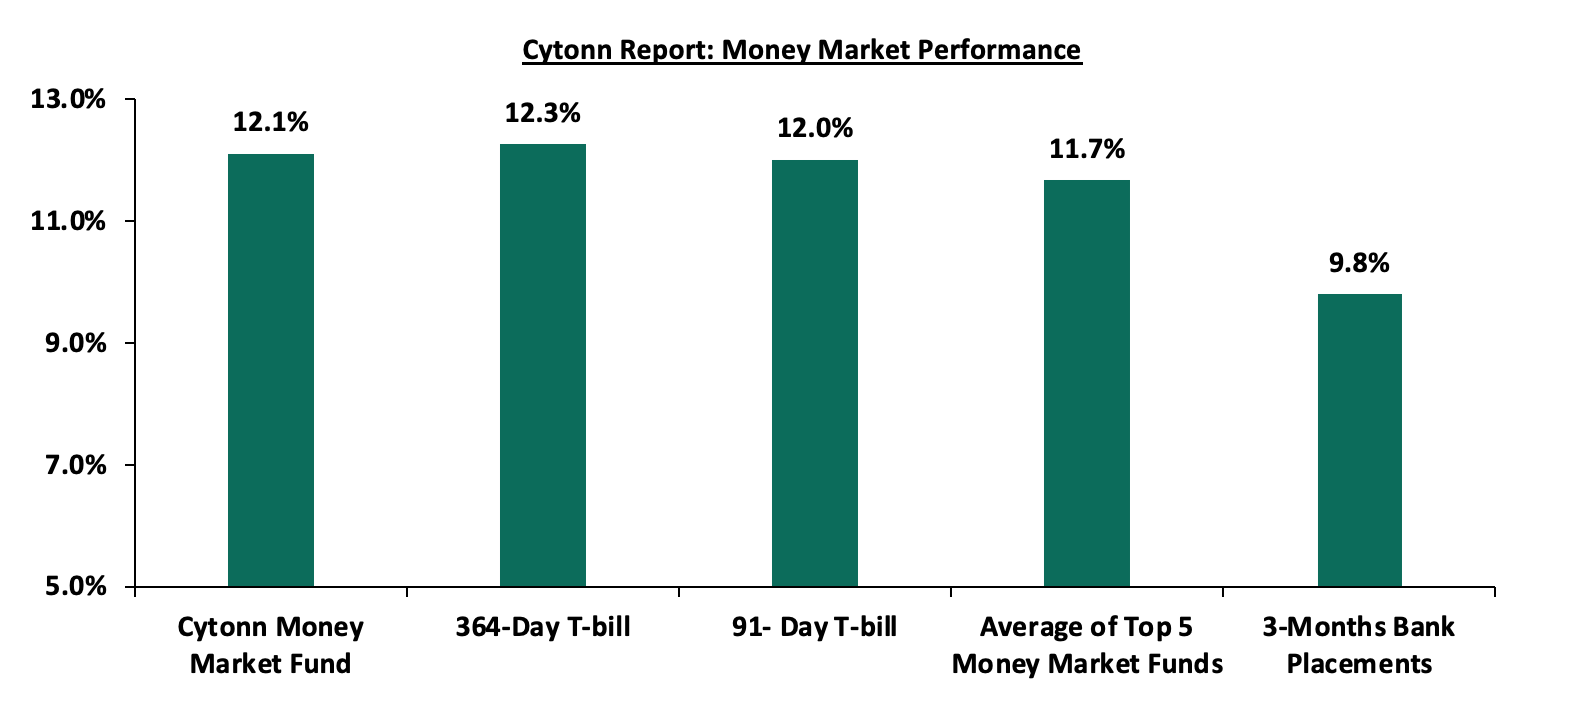
In the money markets, 3-month bank placements ended the week at 9.8% (based on what we have been offered by various banks), while the yields on the 364-day and 91-day paper increased by 9.3 bps and 11.0 bps to 12.3% and 12.0% respectively. The yield of Cytonn Money Market Fund increased by 17.0 bps to 12.1%, from 11.9% recorded the previous week, while the average yields of Top 5 Money Market Funds increased by 31.4 bps to 11.7% up from 11.3% recorded the previous week.
The table below shows the Money Market Fund Yields for Kenyan Fund Managers as published on 7 July 2023:
|
Cytonn Report: Money Market Fund Yield for Fund Managers as published on 7 July 2023 |
||
|
Rank |
Fund Manager |
Effective Annual Rate |
|
1 |
Cytonn Money Market Fund (dial *809# or download Cytonn App) |
12.1% |
|
2 |
Etica Money Market Fund |
12.0% |
|
3 |
Enwealth Money Market Fund |
11.7% |
|
4 |
Madison Money Market Fund |
11.2% |
|
5 |
GenAfrica Money Market Fund |
11.2% |
|
6 |
Co-op Money Market Fund |
11.1% |
|
7 |
Jubilee Money Market Fund |
11.1% |
|
8 |
Apollo Money Market Fund |
11.0% |
|
9 |
Kuza Money Market fund |
11.0% |
|
10 |
Dry Associates Money Market Fund |
10.8% |
|
11 |
Nabo Africa Money Market Fund |
10.6% |
|
12 |
Old Mutual Money Market Fund |
10.6% |
|
13 |
GenCap Hela Imara Money Market Fund |
10.3% |
|
14 |
Sanlam Money Market Fund |
10.3% |
|
15 |
KCB Money Market Fund |
10.3% |
|
16 |
NCBA Money Market Fund |
10.3% |
|
17 |
ICEA Lion Money Market Fund |
10.1% |
|
18 |
Zimele Money Market Fund |
9.9% |
|
19 |
Absa Shilling Money Market Fund |
9.7% |
|
20 |
CIC Money Market Fund |
9.7% |
|
21 |
British-American Money Market Fund |
9.6% |
|
22 |
AA Kenya Shillings Fund |
9.4% |
|
23 |
Orient Kasha Money Market Fund |
9.3% |
|
24 |
Mali Money Market Fund |
8.8% |
|
25 |
Equity Money Market Fund |
8.4% |
Source: Business Daily
Liquidity:
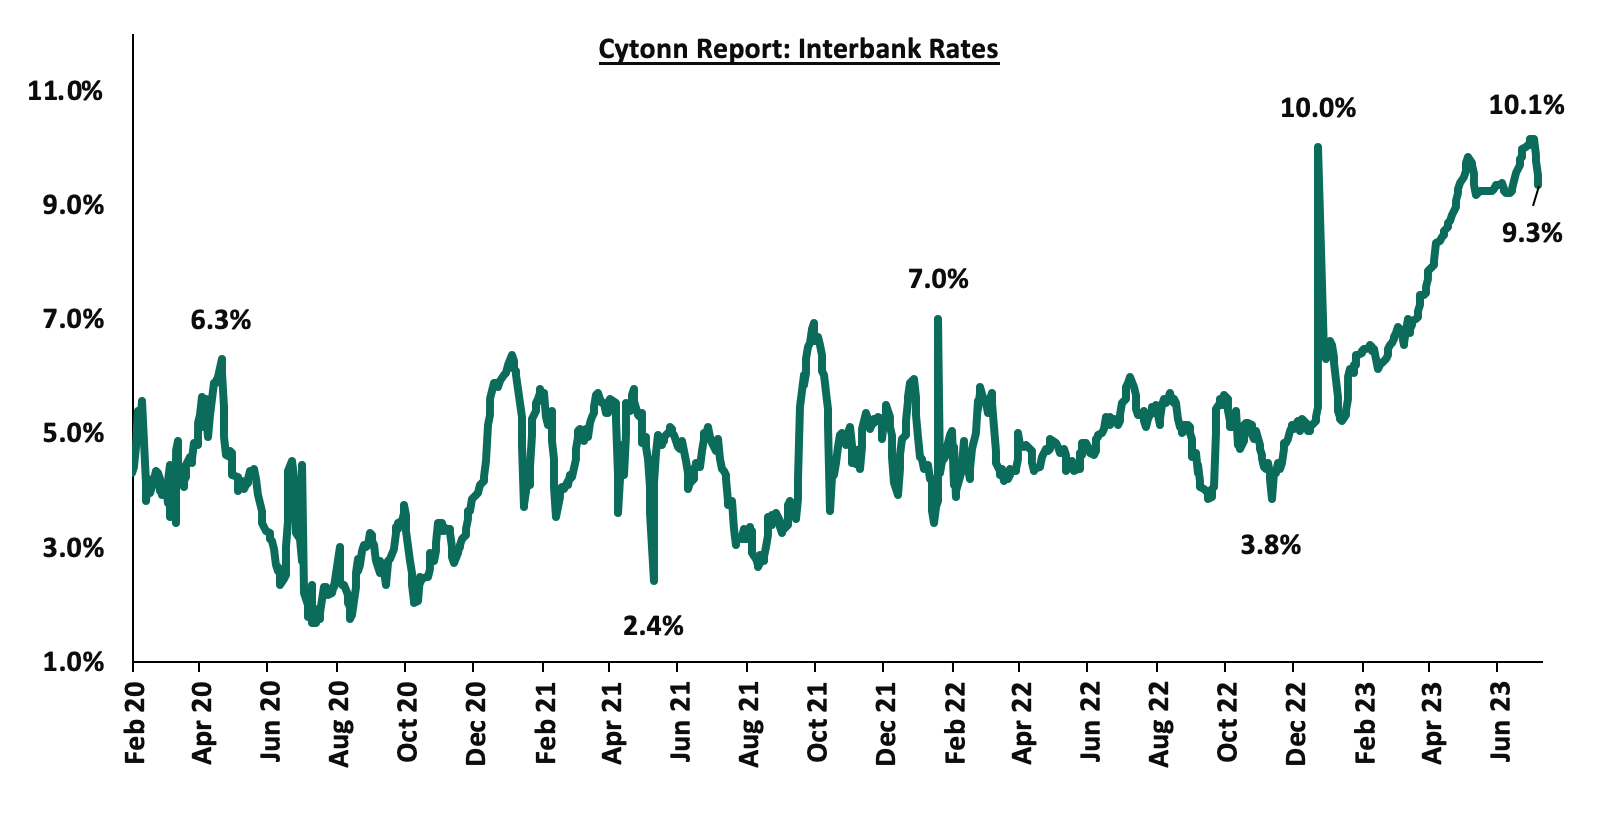
During the week, liquidity in the money markets eased, with the average interbank rate declining to 9.7% from 10.1% recorded the previous week, partly attributable to government payments that offset tax remittances. The average interbank volumes traded decreased by 44.4% to Kshs 9.5 bn from Kshs 17.1 bn recorded the previous week. The chart below shows the interbank rates in the market over the years:
Source: CBK
Kenya Eurobonds:
During the week, the yields on Eurobonds were on an upward trajectory, with the yield on the 10-year Eurobond issued in 2014 increasing the most by 0.7% points to 13.3% up from 12.6% recorded the previous week. The table below shows the summary of the performance of the Kenyan Eurobonds as of 6 July 2023;
|
Cytonn Report: Kenya Eurobonds Performance |
||||||
|
|
2014 |
2018 |
2019 |
2021 |
||
|
Date |
10-year issue |
10-year issue |
30-year issue |
7-year issue |
12-year issue |
12-year issue |
|
Amount Issued (USD) |
2.0 bn |
1.0 bn |
1.0 bn |
0.9 bn |
1.2 bn |
1.0 bn |
|
Years to Maturity |
1.1 |
4.8 |
24.8 |
4.0 |
9.0 |
11.1 |
|
Yields at Issue |
6.6% |
7.3% |
8.3% |
7.0% |
7.9% |
6.2% |
|
02-Jan-23 |
12.9% |
10.5% |
10.9% |
10.9% |
10.8% |
9.9% |
|
29-Jun-23 |
12.6% |
11.1% |
11.1% |
10.3% |
11.1% |
10.3% |
|
30-Jun-23 |
12.5% |
11.0% |
11.1% |
10.3% |
11.1% |
10.3% |
|
03-Jul-23 |
12.5% |
11.0% |
11.0% |
10.3% |
11.0% |
10.3% |
|
04-Jul-23 |
12.5% |
11.0% |
11.0% |
10.3% |
11.0% |
10.3% |
|
05-Jul-23 |
12.7% |
11.0% |
11.1% |
10.3% |
11.0% |
10.3% |
|
06-Jul-23 |
13.3% |
11.4% |
11.3% |
10.6% |
11.2% |
10.6% |
|
Weekly Change |
0.7% |
0.3% |
0.2% |
0.3% |
0.1% |
0.3% |
|
MTD Change |
0.8% |
0.4% |
0.3% |
0.3% |
0.2% |
0.3% |
|
YTD Change |
0.4% |
0.9% |
0.4% |
(0.3%) |
0.4% |
0.7% |
Source: Central Bank of Kenya (CBK) and National Treasury
Kenya Shilling:
During the week, the Kenya Shilling remained under pressure, having depreciated by 0.3% against the US dollar to close the week at Kshs 140.9, up from Kshs 140.5 recorded the previous week, partly attributable to the persistent high dollar demand from importers, especially in the oil and energy sectors. On a year-to-date basis, the shilling has depreciated by 14.2% against the dollar, adding to the 9.0% depreciation recorded in 2022. We expect the shilling to remain under pressure in 2023 as a result of:
- An ever-present current account deficit coming at 2.3% of GDP in Q1’2023, down from 4.2% recorded in a similar period last year, and,
- The need for government debt servicing, continues to put pressure on forex reserves given that 67.3% of Kenya’s external debt was US Dollar denominated as of March 2023, and,
The shilling is however expected to be supported by:
- Diaspora remittances standing at a cumulative USD 1,688.0 mn in 2023 as of May 2023, albeit 1.8% lower than the USD 1,718.6 mn recorded over the same period in 2022, and,
- The tourism inflow receipts came in at Kshs 268.1 bn in 2022, a significant 82.9% increase from Kshs 146.5 bn inflow receipts recorded in 2021.
Key to note is that Kenya’s forex reserves declined by 0.2% to remain relatively unchanged at Kshs 7.5 bn as of July 6, 2023 from what was recorded the previous week. Similarly, the country’s months of import cover remained relatively unchanged at 4.1 months of import cover, which is above the statutory requirement of maintaining at least 4.0 months of import cover. The chart below summarizes the evolution of Kenya months of import cover over the last 10 years:
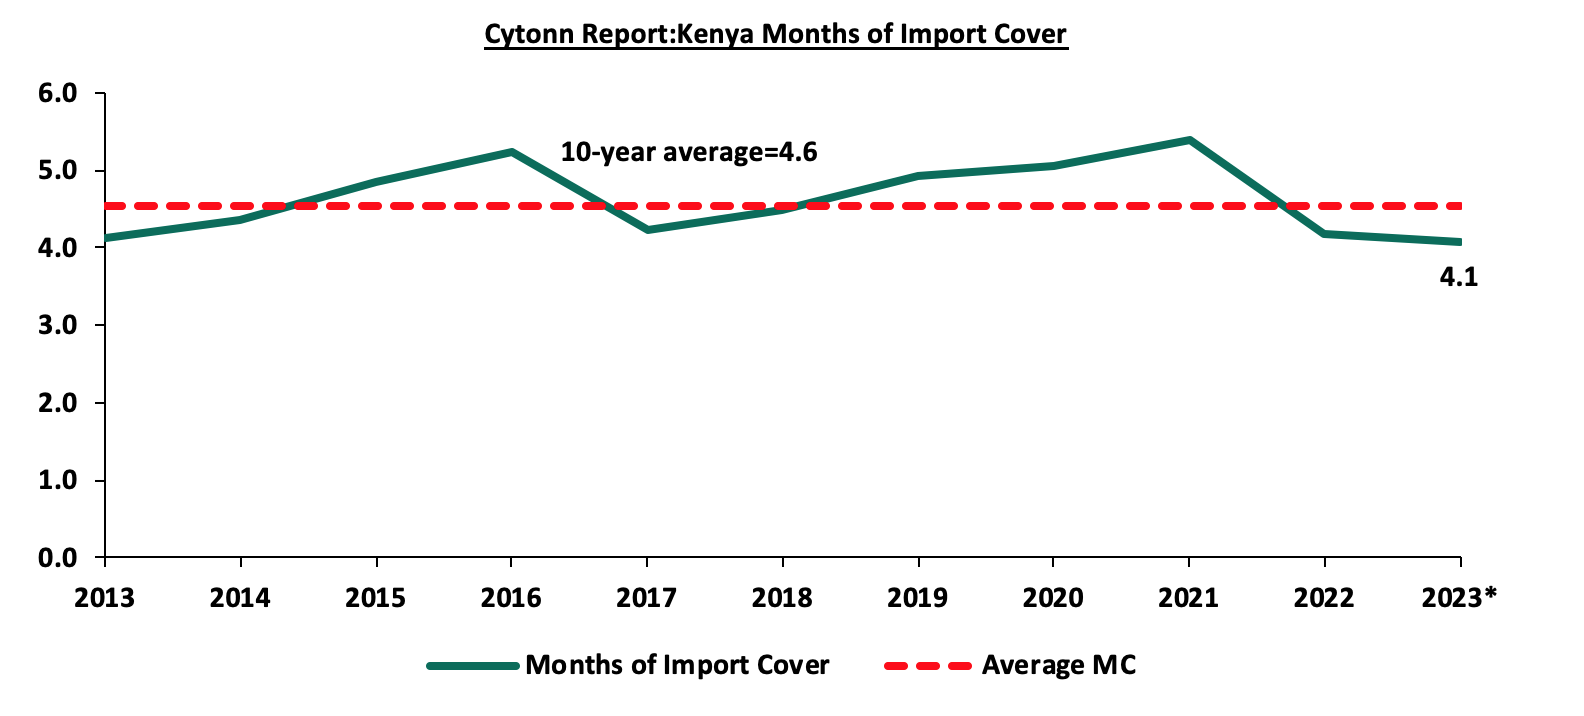
*Figure as at 6th July 2023
Weekly Highlights:
- Kenya Q1’2023 Balance of Payments
The Kenya National Bureau of Statistics released the Q1’2023 Quarterly Balance of Payment Report, highlighting that Kenya’s balance of payments position recorded a 6.0% deterioration, with the deficit widening to Kshs 127.8 bn in Q1’2023, from a deficit of Kshs 120.6 bn recorded in Q1’2022 and a significant deterioration from the Kshs 29.1 bn deficit recorded in Q4’2022. The narrowing of the current account balance by 39.0% in Q1’2023 to a deficit of Kshs 84.9 from a deficit of Kshs 139.3 in Q1’2022 was not sufficient to offset the reversal of the financial account balance from a surplus of Kshs 82.9 bn in Q1’2022 to a deficit of Kshs 111.1 bn in Q1’2023, hence resulting in the overall deterioration of the balance of payment. The table below shows the breakdown of the various balance of payments components, comparing Q1’2023 and Q1’2022:
|
Cytonn Report: Quarterly Balance of Payment |
|||||
|
Item |
Q4'2021 |
Q4'2022 |
Q1'2022 |
Q1'2023 |
Y/Y % Change |
|
Current Account Balance |
(130.0) |
(122.5) |
(139.3) |
(84.9) |
(39.0%) |
|
Capital Account Balance |
2.2 |
3.7 |
7.4 |
6.9 |
(5.9%) |
|
Financial Account Balance |
83.5 |
37.0 |
82.9 |
(111.1) |
(234.0%) |
|
Net Errors and Omissions |
9.3 |
52.7 |
(71.6) |
61.2 |
(185.5%) |
|
Balance of Payments |
(35.0) |
(29.1) |
(120.6) |
(127.8) |
6.0% |
All values in Kshs bns
Key take-outs from the table include;
- The current account deficit (value of goods and services imported exceeds the value of those exported) narrowed by a significant margin of 39.0% to Kshs 84.9 bn from Kshs 139.3 bn in Q1’2022, and by 30.7% from Kshs 122.5 bn recorded in Q4’2022. The narrowing of the current account was brought about by the 7.5% improvement in Merchandise trade deficit to Kshs 303.6 bn in Q1’2023, from Kshs 328.1 bn in Q1’2022,
- The financial account balance deficit (the difference between the foreign assets purchased by domestic buyers and the domestic assets purchased by foreign buyers) recorded a deficit of Kshs 111.1 bn in Q1’2023, a reversal from the surplus of Kshs 82.9 bn recorded in Q1’2022. In addition, the stock of gross official reserves declined by 5.0% to Kshs 921.3 bn in Q1’2023, down from Kshs 969.3 in Q1’2022,
- Consequently, the Balance of Payments (BoP) position deteriorated by 6.0% to a deficit of Kshs 127.8 bn in Q1’2023, from a deficit of Kshs 120.6 bn recorded in Q1’2022.
Current Account Balance
Kenya’s current account deficit narrowed by 39.0% to Kshs 84.9 bn in Q1’2023 from Kshs 139.3 bn recorded in Q1’2022. The Q1’2023 deficit was also a significant decline of 30.7% from the deficit of Kshs 122.5 bn recorded in Q4’2022. The contraction during the quarter was driven by:
- The contraction of the merchandise trade account deficit (the value of import goods exceeds the value of export goods, resulting in a negative net foreign investment) by 7.5% to Kshs 303.6 bn in Q1’2023, from Kshs 328.1 bn recorded in Q1’2022. On a q/q basis, the merchandise trade account deficit narrowed by 2.8% from a deficit of Kshs 312.5 bn recorded in Q4’2022, and,
- A 13.6% improvement in the services trade balance to a surplus of Kshs 56.0 bn from a surplus of Kshs 49.3 bn in Q1’2022. In addition, the services trade balance recorded a sharp q/q improvement of 174.6% from a surplus of Kshs 20.4 bn in Q4’2022, and
- A 19.2% improvement in the secondary income (transfer) balance to a surplus of Kshs 219.54 bn from a surplus of Kshs 184.1 bn in Q1’2022. Additionally, the secondary income balance recorded a marginal 1.9% q/q improvement from a surplus of Kshs 215.4 bn in Q4’2022.
The table below shows the breakdown of the various current account components on a year-on-year basis, comparing Q1’2022 and Q1’2023:
|
Cytonn Report: Current Account Balance |
|||||
|
Item |
Q4'2021 |
Q4'2022 |
Q1'2022 |
Q1'2023 |
Y/Y % Change |
|
Merchandise Trade Balance |
(338.1) |
(312.5) |
(328.1) |
(303.6) |
(7.5%) |
|
Services Trade Balance |
67.3 |
20.4 |
49.3 |
56.0 |
13.6% |
|
Primary Income Balance |
(43.9) |
(45.7) |
(44.6) |
(56.8) |
27.3% |
|
Secondary Income (transfer) Balance |
184.7 |
215.4 |
184.1 |
219.54 |
19.2% |
|
Current Account Balance |
(130.0) |
(122.5) |
(139.3) |
(84.9) |
(39.0%) |
All values in Kshs bns
The deterioration in the balance of payments performance is mainly due to the reversal of the financial account balance from a surplus to a deficit driven by debt servicing costs that have been on the rise given the continued depreciation of the Kenya shilling against the US dollar, given that 67.3% of Kenya's external debt as of March 2023 is denominated in USD. Consequently, the sustained depreciation of the shilling against hard currency continues to inflate the country's import bill. As such, we expect the high cost of imports to continue weighing down on the current account's performance in the medium term. However, we expect that the current administration’s focus on fiscal consolidation will improve the balance of payments performance by minimizing the costs of servicing external debts through the adjustment of the public debt mix in the FY/2023/24 budget to comprise 18.3% foreign debt and 81.7% domestic debt, from 48.0% foreign financing and 52.0% domestic financing in FY’2022/23. Additionally, the introduction of the fertilizer subsidy program is set to reduce the costs of farm inputs, boost agricultural production in the country, increase exports of agricultural products, and support the current account. We also expect that multilateral trade partnership deals such as the Kenya-EU Trade Deal and the Tripartite Agreement between the EAC, SADC and COMESA will help stabilize the balance of payments by increasing the volume of exports demanded and providing export markets for the same.
- Kenya Q1’2023 GDP growth
The Kenya National Bureau of Statistics (KNBS) recently released the Q1'2023 Quarterly Gross Domestic Product (GDP) Report, highlighting that the Kenyan economy recorded a 5.3% growth in Q1’2023, albeit slower than the 6.2% growth recorded in Q1’2022. The growth was mainly supported by a rebound in agricultural activities, which grew by 5.8% in Q1’2023 compared to a contraction of 1.7% in Q1’2022. All sectors in Q1’2023 recorded positive growth, with varying magnitudes across activities. However, most sectors recorded subdued growth compared to Q1’2022 with Mining and Quarrying, Accommodation and Food Services, and Financial and Insurance sectors recording the highest growth declines of 20.5% points, 18.6% points, and 11.2% points, respectively. The decline in overall GDP growth can be attributed to the above growth declines in respective sectors.
The key take-outs from the report include;
- Sectoral Contribution to Growth - The biggest gainer in terms of sectoral contribution to GDP was the financial and Insurance sector, increasing by 1.9% points to 8.8% in Q1’ 2023 from 6.8% in Q1’2022, while Agriculture and Forestry was the biggest loser, declining by 4.9% points to 18.5% in Q1’2023, from 23.4% in Q1’2022. The accommodation and Food Services sector recorded the highest growth rate in Q1’2023 growing by 21.5%, albeit slower than the 40.1% growth recorded in Q1’2022.The chart below shows the top contributors to GDP by sector in Q1’2023:
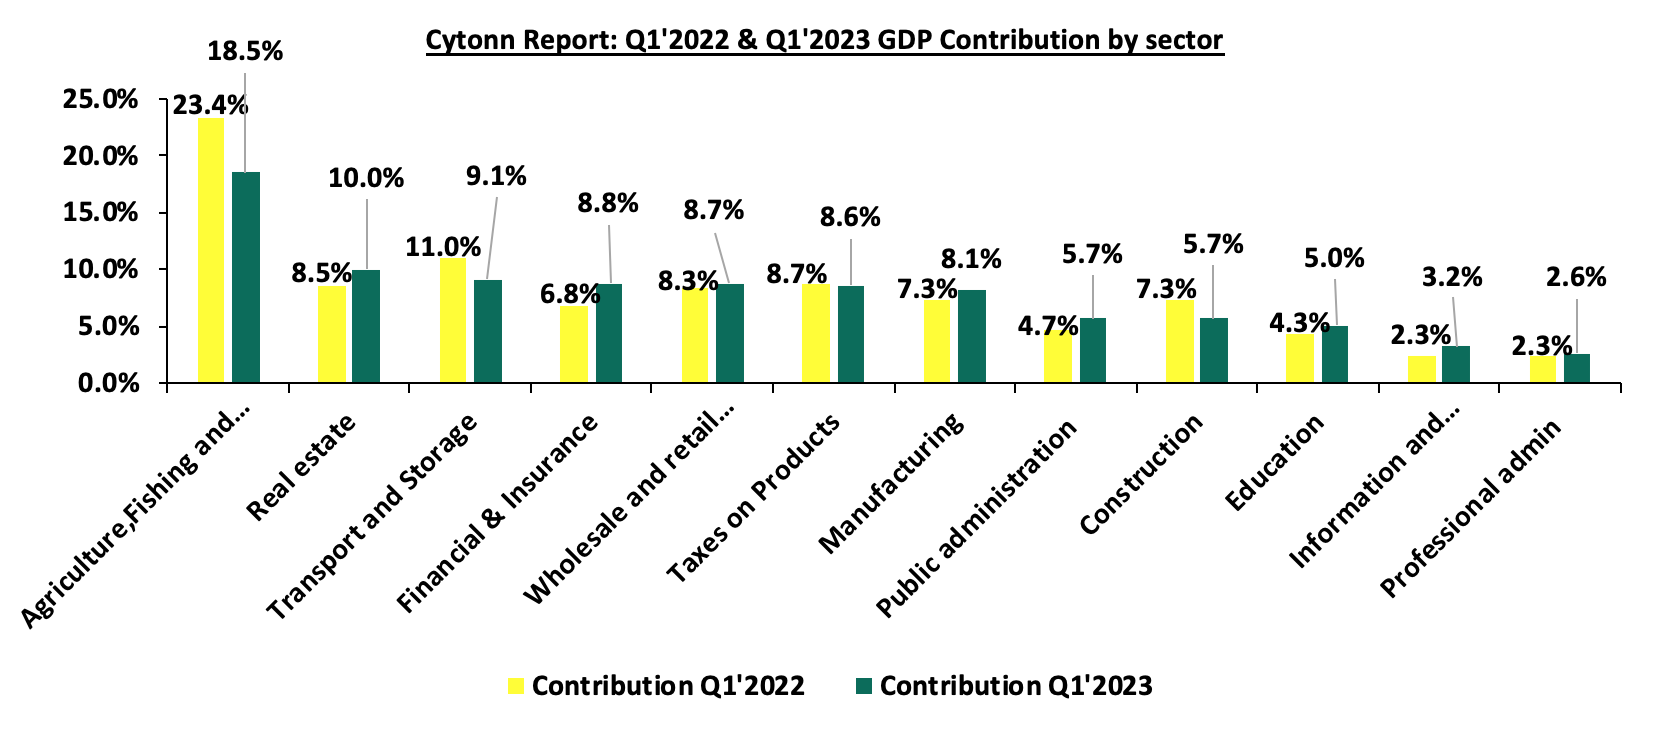
Source: KNBS Q1’2022 and Q1’2023 GDP Report
- Rebound in the Agricultural Sector– Agriculture, Forestry and Fishing activities recorded a growth of 5.8% compared to a contraction of 1.7% in Q1’2022. This is after a consecutive contraction of four quarters. The positive growth recorded during the quarter was mainly attributable to the sufficient rainfall experienced in the quarter under review, which resulted in increased agricultural production. Notably, during the quarter, production of key food crops increased, with a significant increase in the volume of vegetable and fruit exports during the quarter under review.
- Slower growth in the manufacturing sector - The manufacturing sector recorded a slower growth of 2.0% in Q1’2023 compared to a 3.8% growth in a similar period of review in 2022. However, the sectoral contribution to GDP increased by 0.8% points, to 8.1% in Q12023 from 7.3% in Q1’2022.
- Significant decline in the Financial and Insurance sector growth- Financial and Insurance sector growth declined by 11.2% points, to 5.8% in Q1’2023 from 17.0% growth that was recorded in Q1’2022. Additionally, its contribution to GDP decreased by 2.0% points, to 8.8% in Q1’2023, compared to 6.8% recorded in Q1’2022
- Sustained resilience in the Accommodation and Food services sector- The sector recorded 21.5% growth in Q1’2023, albeit lower than the 40.1% growth recorded in Q1’2022. This comes after the sector recorded significantly subdued performance in 2020 and part of 2021 as a consequence of the COVID-19 pandemic. The activity in the sector remained resilient during the quarter, with the number of visitor arrivals through Jomo Kenyatta International Airport and Moi International Airport increasing by 50.0% to 337,937 in Q1’2023 up from 225,321 recorded in Q1’2022. Additionally, the sectoral contribution to GDP increased by 0.1% points, to 1.1% in Q1’2023 from 1.0% recorded in Q1’2022. The chart below shows the different sectoral GDP growth rates for Q1’2023:
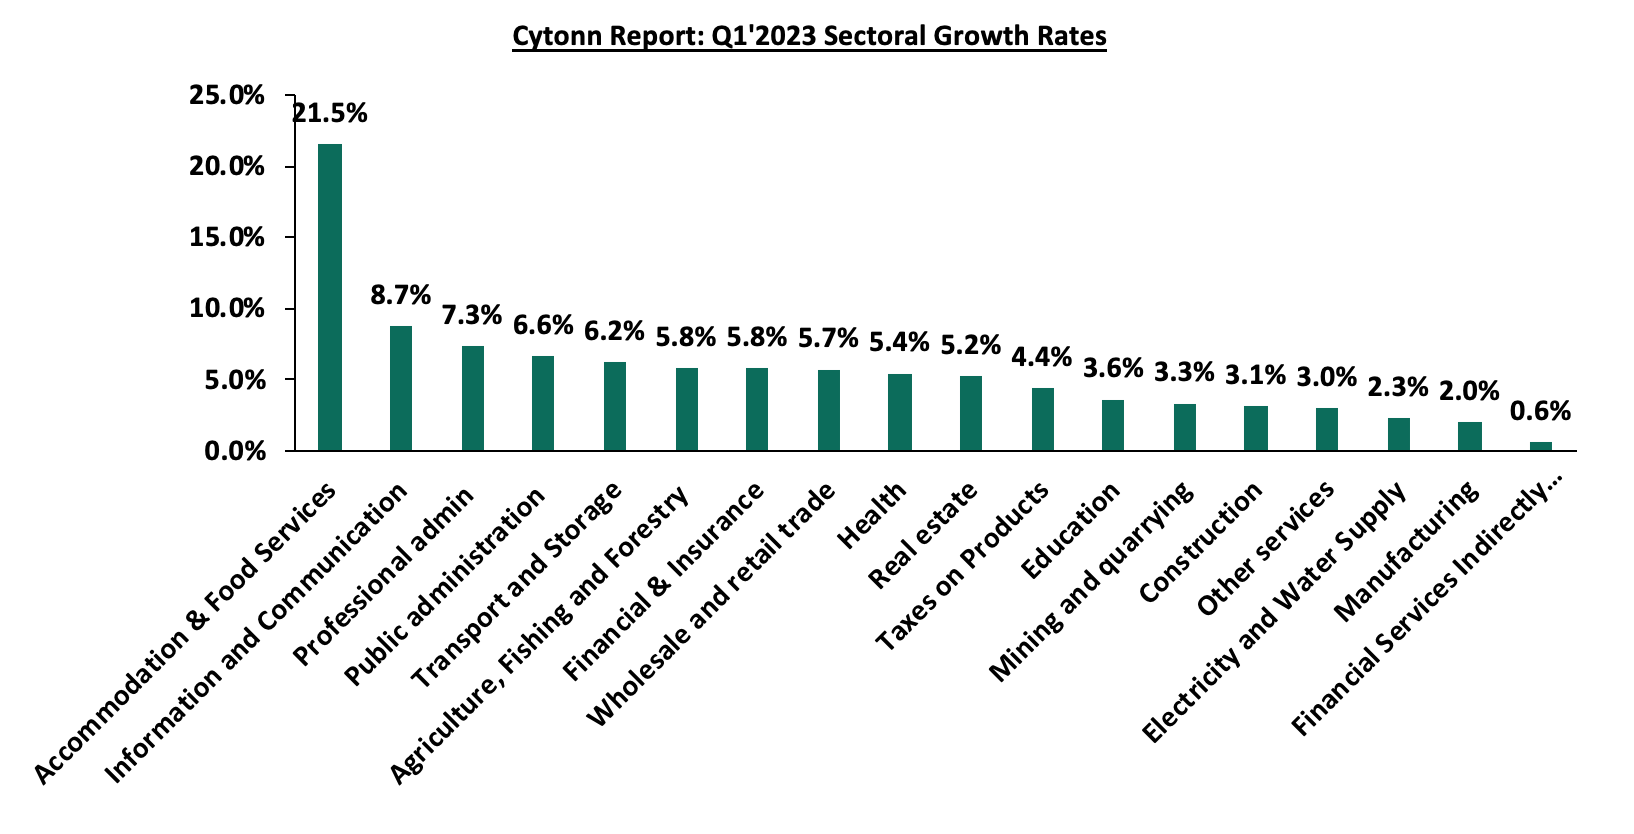
Source: KNBS Q1’2023 GDP Report
In the near-term, we expect the economy to grow at a slower pace on the back of elevated inflationary pressures with June inflation coming in at 7.9%, above the Central Bank of Kenya target range of 2.5% - 7.5%. Further, the hiking of the Central Bank Rate (CBR) by the CBK Monetary Policy Committee in 27th June in a bid to curb inflation and maintain price stability is expected to slow economic growth. However, we expect that recent fiscal policies such as subsidizing costs of crucial farm inputs such as fertilizers and the continued rainfall will support growth in the Agricultural sector, which remains as Kenya’s largest contributor to GDP as well as food prices being a major contributor to headline inflation.
- Stanbic Bank’s June 2023 Purchasing Manager’s Index (PMI)
During the week, Stanbic Bank released its monthly Purchasing Manager’s Index (PMI), highlighting that the index for the month of June 2023 came in at 47.8, down from 49.4 in May 2023, signalling a stronger downturn of the business environment in the fifth month running in June 2023. On a quarterly basis, the index recorded an average of 48.1 in Q2’2023, down from 49.3 recorded in Q1’2023. The strong downturn of the general business environment is mainly attributable to the elevated inflationary pressure experienced in the country, which has remained above the Central Bank of Kenya (CBK) target range of 2.5%–7.5% for the past 13 months, with the inflation rate in June 2023 slightly declining to 7.9% from 8.0% recorded in May 2023, coupled with the aggressive depreciation of the Kenyan shilling. This has seen input prices rise, putting consumer wallets under pressure, which has led to a reduction in demand for commodities as manufacturers and producers transfer the high costs to consumers through hikes in consumer prices in order to maintain their profit margins.
The services, wholesale and retail sectors registered the steepest declines in activity attributable to price pressures, which remained severe in the month of June, with average input prices rising at the fourth-steepest pace in the survey history on the back of May’s record. The rise in input prices was mainly driven by high fuel prices, which made production very expensive given that fuel is a major input in most businesses.
Notably, exports rose for the fourth consecutive month, attributable to the weak shilling, which made Kenyan exports more affordable in the global market, leading to the fastest growth in export demand since December 2021. More positively, hiring activities during the month picked up, which led to a rise in employment numbers as firms remained optimistic on growth. Key to note, a PMI reading of above 50.0 indicates an improvement in the business conditions, while readings below 50.0 indicate a deterioration. The chart below summarizes the evolution of PMI over the last 24 months:
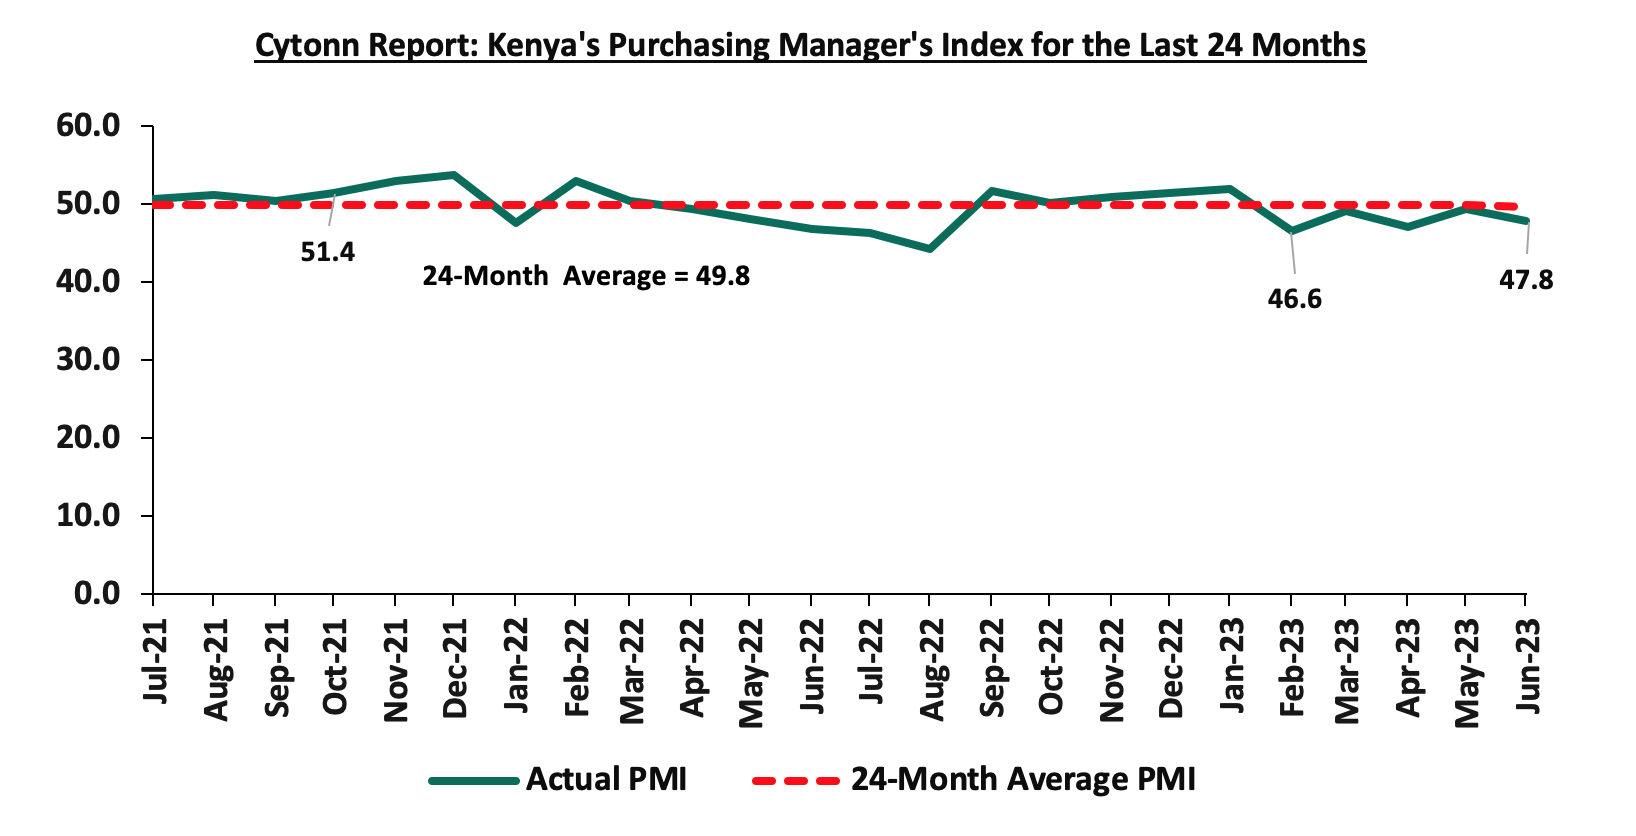
Going forward, we project that the business environment will be restrained in the short to medium term on the back of high food and fuel prices, as well as the sustained depreciation of the Kenyan shilling, which continues to raise the cost of production and importation. As a result, the volume of new businesses is expected to remain stifled as consumers cut back on spending owing to a lack of purchasing power. In addition, the provisions of the Finance Act 2023, characterized by the introduction of new taxes as well as upward revisions of existing taxes, are expected to dampen growth in the private sector owing to the high cost of doing business. Furthermore, cost of credit is anticipated to remain high in the short to medium term, reflected by the rising interest rates following the recent hike in the Central Bank Rate by 100.0 bps to 10.5% in June 2023 from 9.50% in May 2023, as a result, activities in the private sector is expected to be stifled. Notably, the general improvement in business conditions is largely dependent on the stability of the Kenya shilling, given that the country's high cost of production is mostly attributable to the high import cost of goods as a result of the country's dollar crunch.
Rates in the Fixed Income market have been on an upward trend given the continued government demand for cash and the highly tightened liquidity in the money market. The government is 163.4% behind its prorated net domestic borrowing target of Kshs 14.5 bn having a negative net borrowing position of Kshs 9.2 bn of the domestic net borrowing target of Kshs 586.5 bn for the FY’2023/2024. Revenue collections are lagging behind, with total revenue as of May 2023 coming in at Kshs 1.8 tn in FY’2022/2023, equivalent to 82.7% of its revised target of Kshs 2.2 tn and 90.2% of the prorated target of Kshs 2.0 tn. Therefore, we expect a continued upward readjustment of the yield curve in the short and medium term, with the government looking to bridge the fiscal deficit through the domestic market. Owing to this, our view is that investors should be biased towards short-term fixed-income securities to reduce duration risk
Market Performance:
During the week, the equities market was on an upward trajectory, with NASI, NSE 20, and NSE 25 gaining by 4.1%, 2.7%, and 4.0%, respectively, taking the YTD performance to losses of 12.5%, 3.4%, and 9.6% for NASI, NSE 20, and NSE 25, respectively. The equities market performance was mainly driven by gains recorded by large-cap stocks such as Safaricom, Equity Group, BAT and Bamburi of 8.0%, 4.6%, 4.1%, and 2.8%, respectively. The gains were, however, weighed down by losses recorded by stocks such as KCB Group of 0.5%;
During the week, equities turnover increased by 169.0% to USD 11.3 mn from USD 4.2 mn, recorded the previous week, taking the YTD turnover to USD 464.7 mn. Foreign investors remained net buyers for a fourth consecutive week with a net buying position of USD 1.5 mn from a net buying position of USD 1.1 mn recorded the previous week, taking the YTD net selling position to USD 254.7 mn.
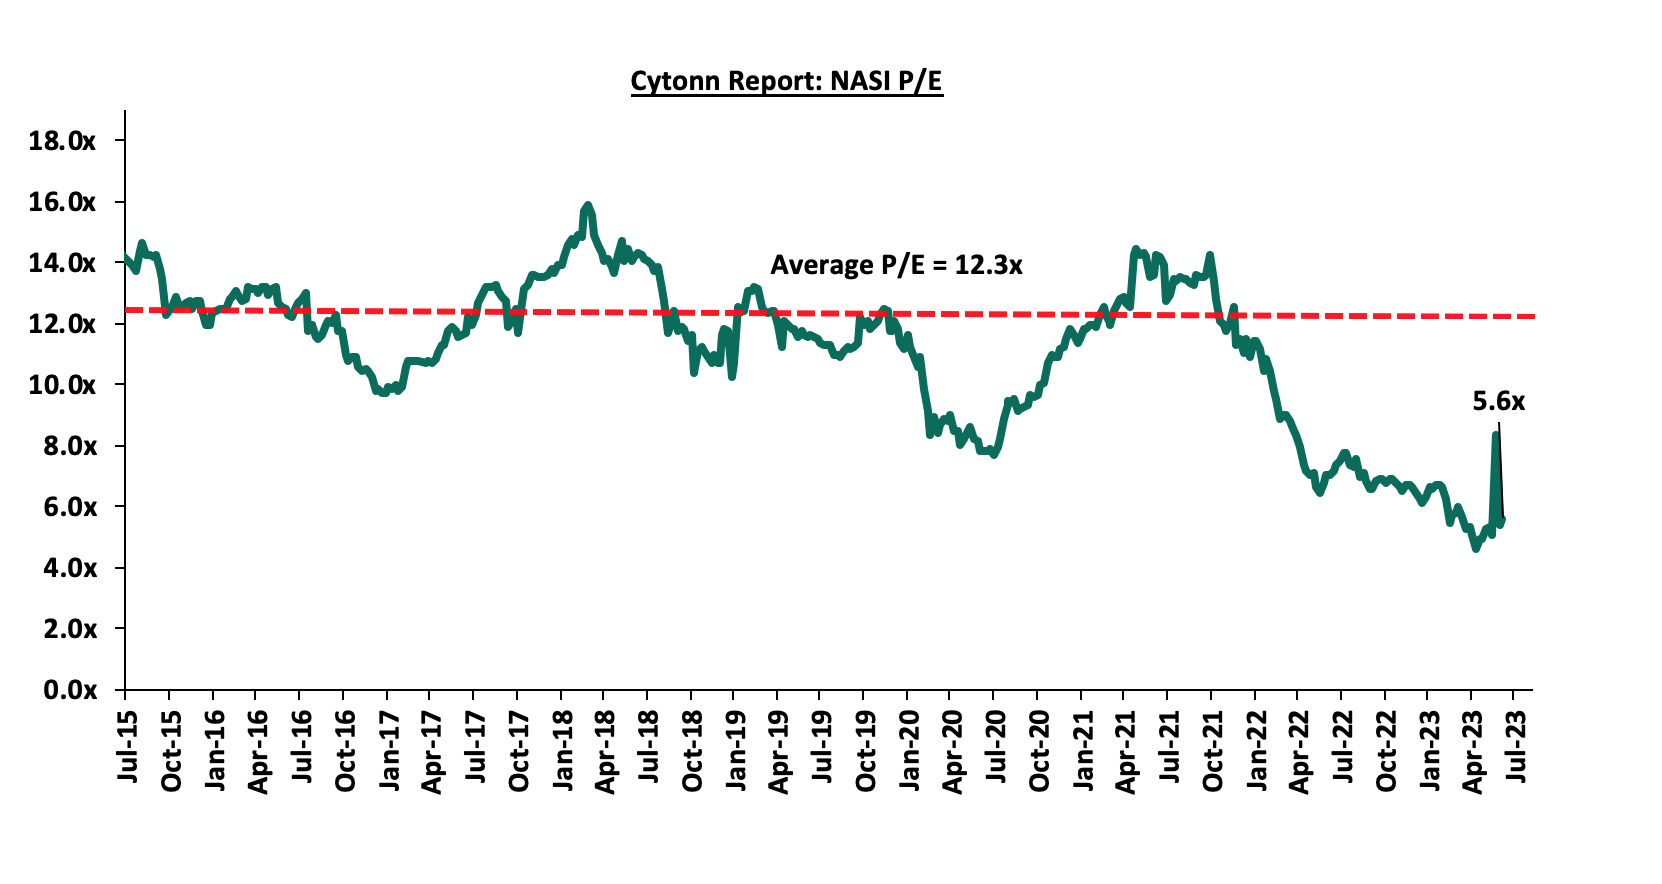
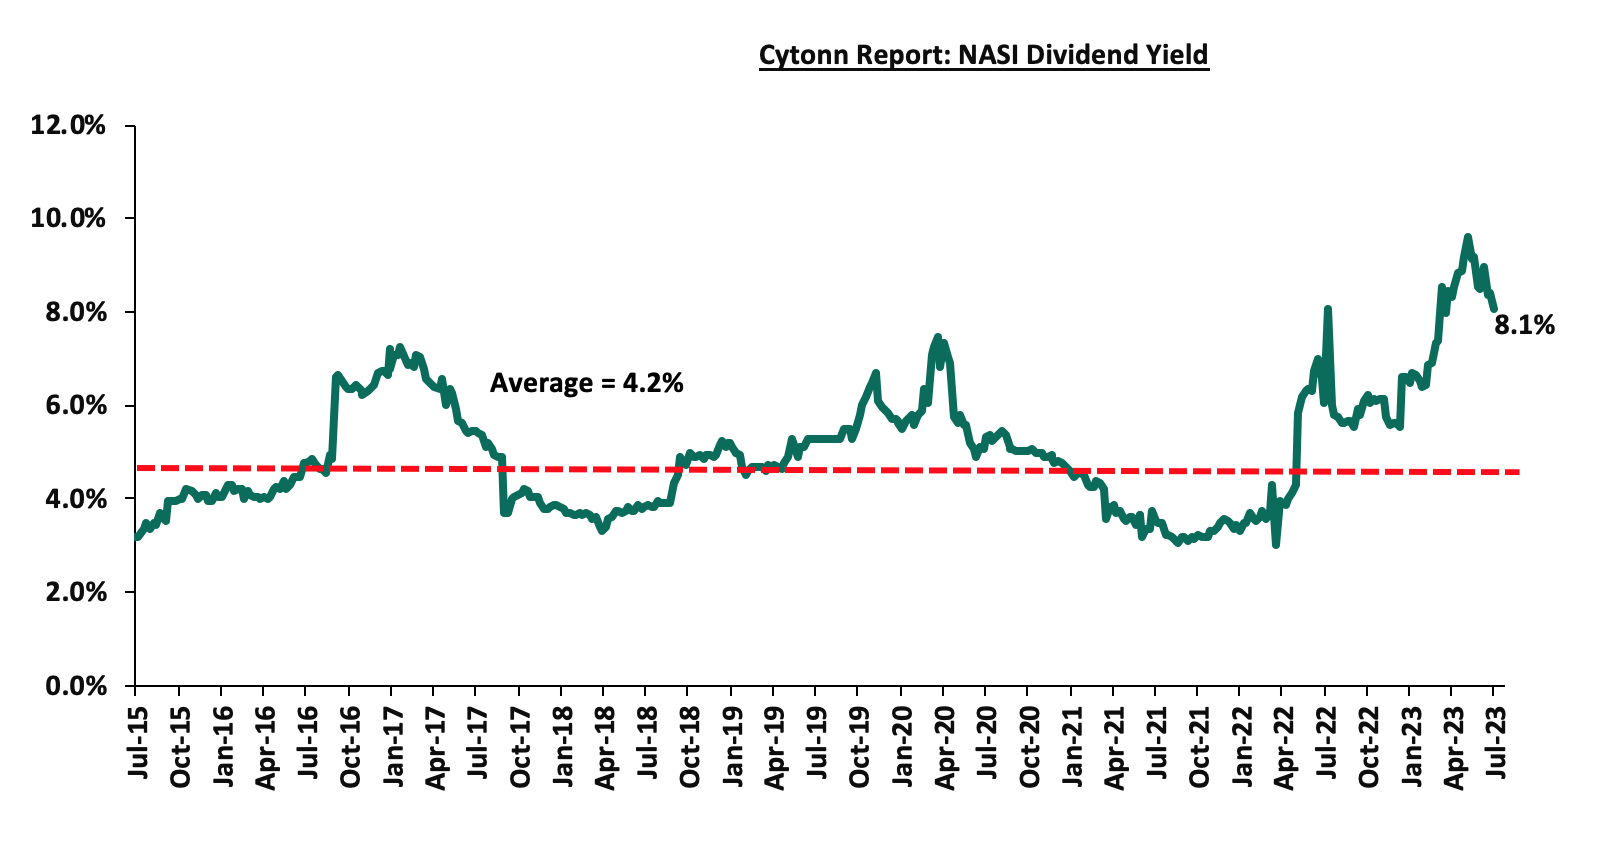
The market is currently trading at a price to earnings ratio (P/E) of 5.6x, 54.5% below the historical average of 12.3x. The dividend yield stands at 8.1%, 3.9% points above the historical average of 4.2%. Key to note, NASI’s PEG ratio currently stands at 0.7x, an indication that the market is undervalued relative to its future growth. A PEG ratio greater than 1.0x indicates the market is overvalued, while a PEG ratio less than 1.0x indicates that the market is undervalued. The charts below indicate the historical P/E and dividend yields of the market;
Universe of coverage:
|
Company |
Price as at 30/06/2024 |
Price as at 7/07/2023 |
w/w change |
YTD Change |
Target Price* |
Dividend Yield |
Upside/ Downside** |
P/TBv Multiple |
Recommendation |
|
KCB Group*** |
29.3 |
29.2 |
(0.5%) |
(24.0%) |
41.3 |
6.9% |
48.4% |
0.5x |
Buy |
|
Kenya Reinsurance |
1.8 |
1.8 |
2.2% |
(1.6%) |
2.5 |
10.9% |
47.3% |
0.1x |
Buy |
|
Jubilee Holdings |
180.0 |
189.0 |
5.0% |
(4.9%) |
260.7 |
6.3% |
44.3% |
0.3x |
Buy |
|
Liberty Holdings |
4.1 |
4.2 |
4.7% |
(15.9%) |
5.9 |
0.0% |
39.6% |
0.3x |
Buy |
|
Equity Group*** |
38.3 |
40.0 |
4.6% |
(11.2%) |
51.2 |
10.0% |
37.9% |
0.9x |
Buy |
|
CIC Group |
1.9 |
2.0 |
2.6% |
2.1% |
2.5 |
6.7% |
34.9% |
0.6x |
Buy |
|
Co-op Bank*** |
12.2 |
12.2 |
0.0% |
0.8% |
15.0 |
12.3% |
34.8% |
0.6x |
Buy |
|
NCBA*** |
38.9 |
39.4 |
1.4% |
1.2% |
48.9 |
10.8% |
34.8% |
0.8x |
Buy |
|
ABSA Bank*** |
11.8 |
12.1 |
2.5% |
(0.8%) |
14.7 |
11.2% |
32.4% |
1.0x |
Buy |
|
Sanlam |
7.3 |
8.0 |
9.6% |
(16.5%) |
10.3 |
0.0% |
28.6% |
2.3x |
Buy |
|
Standard Chartered*** |
160.5 |
162.0 |
0.9% |
11.7% |
183.9 |
13.6% |
27.1% |
1.1x |
Buy |
|
HF Group |
5.0 |
4.8 |
(4.0%) |
53.0% |
5.8 |
0.0% |
20.5% |
0.2x |
Buy |
|
Diamond Trust Bank*** |
49.9 |
50.0 |
0.3% |
0.3% |
54.6 |
10.0% |
19.2% |
0.2x |
Accumulate |
|
I&M Group*** |
17.1 |
18.5 |
8.2% |
8.5% |
19.5 |
12.2% |
17.4% |
0.4x |
Accumulate |
|
Stanbic Holdings |
111.3 |
119.8 |
7.6% |
17.4% |
127.9 |
10.5% |
17.3% |
0.9x |
Accumulate |
|
Britam |
5.0 |
5.1 |
1.6% |
(1.9%) |
6.0 |
0.0% |
17.1% |
0.7x |
Accumulate |
We are “Neutral” on the Equities markets in the short term due to the current tough operating environment and huge foreign investor outflows, and, “Bullish” in the long term due to current cheap valuations and expected global and local economic recovery.
With the market currently being undervalued to its future growth (PEG Ratio at 0.7x), we believe that investors should reposition towards value stocks with strong earnings growth and that are trading at discounts to their intrinsic value. We expect the current high foreign investors sell-offs to continue weighing down the equities outlook in the short term.
- Industry Report
During the week, the Kenya National Bureau of Statistics (KNBS) released the Q1’2023 GDP Report, and below are the key take-outs related to the Real Estate sector:
- Rebounding Growth in the Real Estate Sector – According to the report, the Real Estate sector grew by 5.2% in Q1’2023, representing a 0.8% points slower growth than the 6.0% growth that was recorded in Q1’2022, mainly attributable to the increased cost of construction materials, which hampered optimum investments, thereby reducing sectoral activities during the period. However, on a q/q basis, this was a 2.3% points increase from the 2.9% growth recorded in Q4’2022. The accelerated growth during the quarter was attributed to increased development activities on the back of resumed investor confidence. This was evidenced by a rise in the gross loans advanced to the Real Estate sector by 4.6% to Kshs 481.0 bn in Q1’2023, from Kshs 460.0 bn recorded in Q1’2022. The graph below shows the Real Estate sector growth rates from Q1’2020 to Q1’2023;
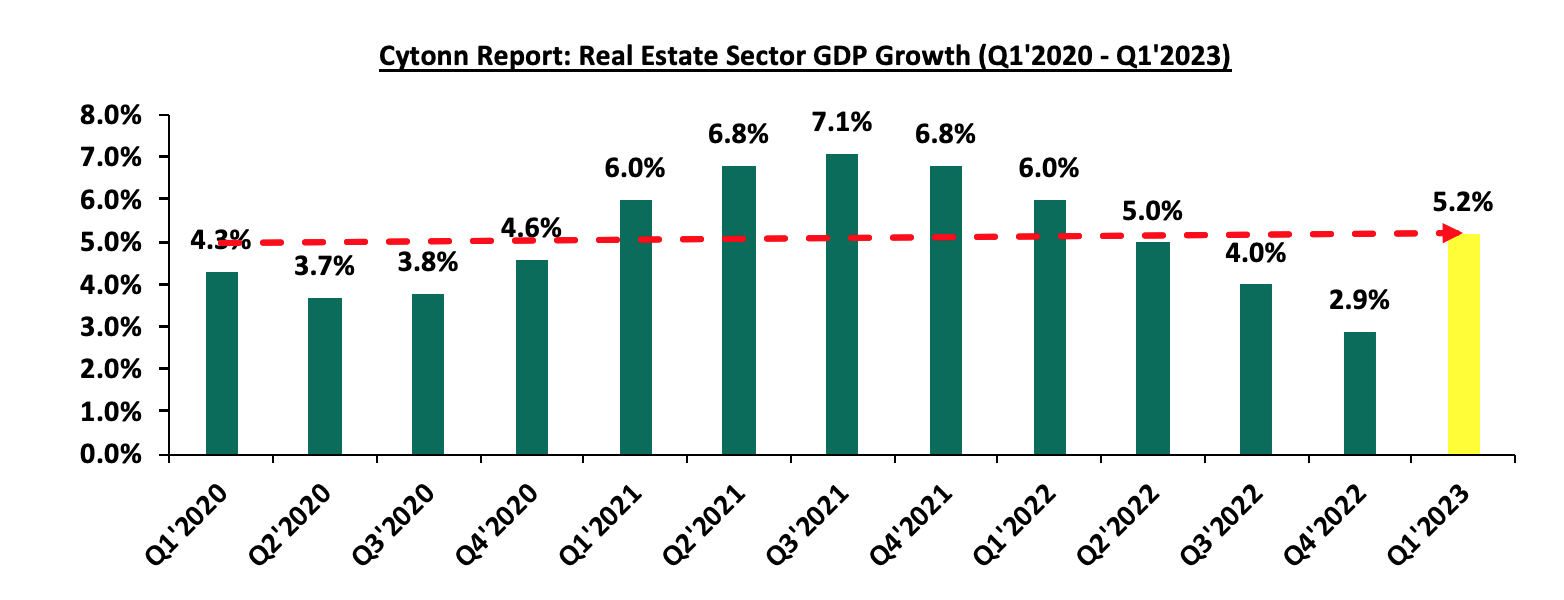
Source: Kenya National Bureau of Statistics (KNBS)
- Slow but Resurging Growth in the Construction Sector – The construction sector grew by 3.1% in Q1’2023, 2.9% points lower than the 6.0% growth recorded in Q1’2022. However, on a q/q basis, the performance represented a 0.7% points increase from the 2.4% growth recorded in Q4’2022. The slow growth on a y/y basis was mainly as a result of : (i) rising construction costs on the back of elevated inflation pressures, with the average construction cost so far in 2023 coming at Kshs 41,600 per SQM, a 20.1% increase from Kshs 34,650 per SQM in 2022, and, (ii) delays in processing construction permits owing to backlogs in registry systems, leading to an overall decrease in construction activities. In light of this, the consumption of cement declined by 7.7% to 1.5 mn metric tonnes recorded in January and February 2023, from 1.6 mn metric tonnes recorded in January and February 2022. On the other hand, the q/q increase in performance was attributable to heightened construction activities going into 2023, particularly in the housing and infrastructure sectors. This saw the gross loans advanced to the building and construction sector record a y/y increase of 4.2% to Kshs 414.6 bn in Q1’2023, from Kshs 397.8 bn in Q1’2022. The graph below shows the construction sector growth rates from Q1’2020 to Q1’2023;
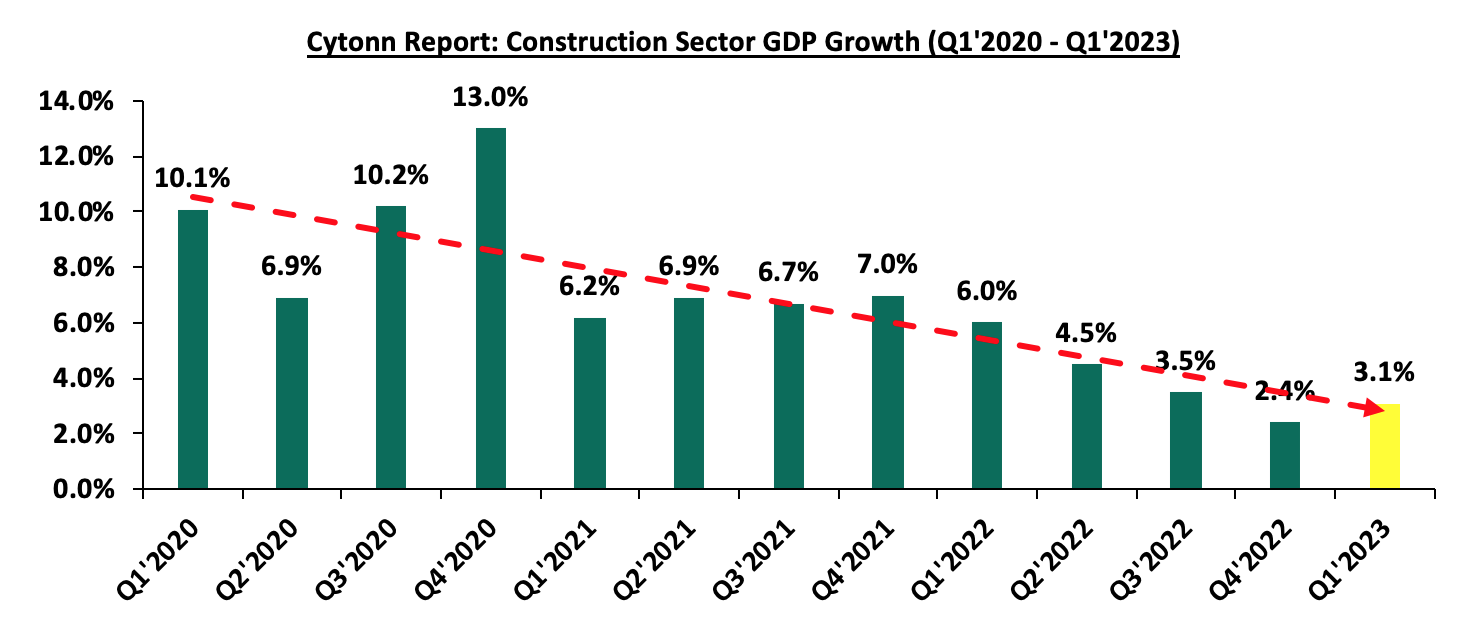
Source: Kenya National Bureau of Statistics (KNBS)
- Sustained Recovery in Accommodation and Restaurant Sector – Accommodation and Restaurant services grew by 21.5% during Q1’2023, representing an 18.6% points y/y decline from the 40.1% growth that was recorded in Q1’2022. On a q/q basis, the performance represented a 6.6% points increase from the 14.9% growth recorded in Q4’2022. The y/y decline in performance was mainly attributable to increased operational expenses due to rising inflation coupled by supply chain disruptions occasioned by the Russia-Ukraine war. On the other hand, the performance demonstrates a rebound from the contraction witnessed during the COVID-19 pandemic, as a result of imposed travel restrictions. In addition, the performance continues to be cushioned by the rise in tourism activities in the sector, with the number of international arrivals increasing by 50.0% to 337,937 persons in Q1’2023 against the 225,321 persons recorded in Q1’2022. The graph below shows the accommodation and restaurant sector growth rates from Q1’2020 to Q1’2023;
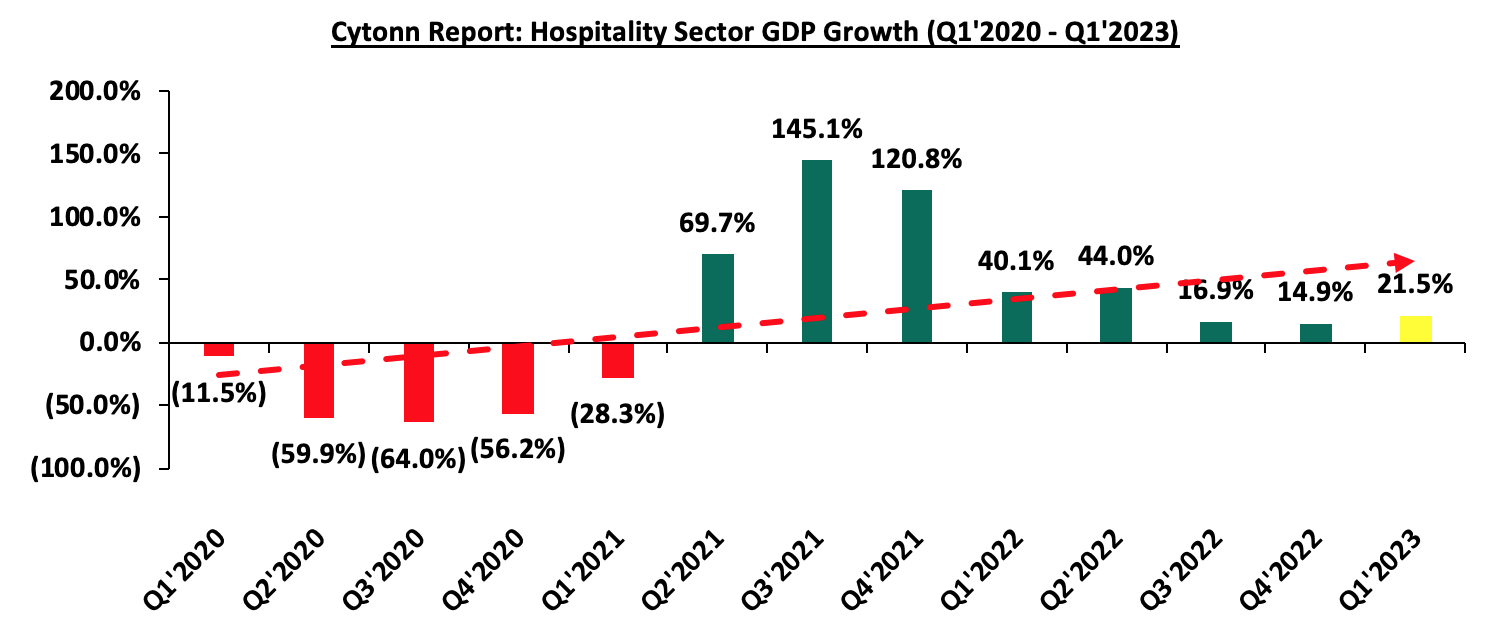
Source: Kenya National Bureau of Statistics (KNBS)
We expect Kenya’s Real Estate sector to continue on a growth trend supported by; i) increased development activities, particularly in the residential sector, with the emphasis on the provision of affordable housing, ii) improving investor confidence in the hospitality sector, evidenced by acquisitions and mergers amid expansionary efforts by players seeking market dominance, iii) initiation and completion of various infrastructure projects such as transport networks which are slated to open up more areas for investments, with the government increasing the allocation to the infrastructure sector by 16.9% to Kshs 286.6 bn in FY’2023/2024 from Kshs 245.1 bn in FY’2022/2023, and, iv) statutory reviews such as the Finance Act 2023 introducing a housing levy which will go into the development of affordable housing and support infrastructure. However, the optimum performance of the sector is expected to be subdued by the weakening of the Kenyan Shilling leading to the high cost of construction material imports in the country. Additionally, gross Non-Performing Loans (NPLs) in the Real Estate sector increased by 12.2% to Kshs 88.1 bn in Q1’2023, from Kshs 78.5 bn in Q1’2022 which has resulted in tightened lending requirements as lenders ask for more collateral in efforts to cushion themselves, due to a perceived higher credit risk in the sector.
- Retail Sector
During the week, IBL Group, a Mauritian business conglomerate, announced plans to subscribe to additional shares in Mambo Retail Limited, which will acquire an additional 11.0% stake worth Kshs 5.8 bn in Naivas International Limited, bringing the firm’s holding to 51.0% of the shares in Naivas. This comes several months after the group of foreign firms acquired an 8.5% stake in Naivas worth Kshs 4.5 bn which brought their ownership of the retail chain to 40.0%. The move to acquire an additional stake will see the group control the majority shareholding of the Kenyan based retail chain through the investment vehicle Mambo Retail Limited, owned collectively with investors such as Proparco and DEG. As a result of this transaction, the Mukuha family's interest in Naivas through the Gakiwawa Family Investments vehicle will decrease from the current 60.0% to 49.0%. This signifies the investors’ high appetite for Kenya’s retail sector, particularly Naivas which has emerged as one of Kenya’s largest supermarket chains, taking the share of retailers such as Nakumatt, Uchumi and Tuskys which exited the market. The group’s decision to acquire an additional stake in Naivas is driven by;
- Naivas’ impressive performance as it has grown to be one of Kenya’s most valuable companies, currently at an estimated market capitalization of Kshs 53.5 bn,
- Kenya’s recognition as a regional hub, thus enhancing investments,
- IBL’s expertise in the retail sector as it runs the Winners supermarket chain in Mauritius, makes Naivas a good investment opportunity,
- Positive demographics promoting retail investments, and,
- IBL’s expansion and diversification drive into East Africa, as part of its plans to increase regional expansion and investments, such as in the solar energy sector through IBL Energy Holdings Limited, the health sector through DotExe Ventures, and the retail sector through Naivas, among others. As a result, the Naivas retail chain currently boasts 93 outlets in Kenya.
The table below shows the number of stores operated by key local and international retail supermarket chains in Kenya;
|
Cytonn Report: Main Local and International Retail Supermarket Chains |
|||||||||||
|
Name of retailer |
Category |
Branches as at FY’2018 |
Branches as at FY’2019 |
Branches as at FY’2020 |
Branches as at FY’2021 |
Branches as at FY’2022 |
Branches opened in 2023 |
Closed branches |
Current branches |
Branches expected to be opened |
Projected branches FY’2023 |
|
Naivas |
Hybrid* |
46 |
61 |
69 |
79 |
91 |
2 |
0 |
93 |
0 |
93 |
|
Quick Mart |
Hybrid** |
10 |
29 |
37 |
48 |
55 |
3 |
0 |
58 |
0 |
58 |
|
Chandarana |
Local |
14 |
19 |
20 |
23 |
26 |
0 |
0 |
26 |
0 |
26 |
|
Carrefour |
International |
6 |
7 |
9 |
16 |
19 |
1 |
0 |
20 |
0 |
20 |
|
Cleanshelf |
Local |
9 |
10 |
11 |
12 |
12 |
1 |
0 |
13 |
0 |
13 |
|
Tuskys |
Local |
53 |
64 |
64 |
6 |
4 |
0 |
59 |
5 |
0 |
5 |
|
Game Stores |
International |
2 |
2 |
3 |
3 |
0 |
0 |
3 |
0 |
0 |
0 |
|
Uchumi |
Local |
37 |
37 |
37 |
2 |
2 |
0 |
35 |
2 |
0 |
2 |
|
Choppies |
International |
13 |
15 |
15 |
0 |
0 |
0 |
15 |
0 |
0 |
0 |
|
Shoprite |
International |
2 |
4 |
4 |
0 |
0 |
0 |
4 |
0 |
0 |
0 |
|
Nakumatt |
Local |
65 |
65 |
65 |
0 |
0 |
0 |
65 |
0 |
0 |
0 |
|
Total |
|
257 |
313 |
334 |
189 |
209 |
7 |
181 |
217 |
0 |
217 |
|
*51% owned by IBL Group (Mauritius), Proparco (France), and DEG (Germany), while 49% owned by Gakiwawa Family (Kenya) |
|||||||||||
|
**More than 50% owned by Adenia Partners (Mauritius), while Less than 50% owned by Kinuthia Family (Kenya) |
|||||||||||
Source: Cytonn Research
We expect to see a continued increase in activities in the Kenyan retail industry attributed to; i) sustained expansion efforts by both domestic and foreign retailers who are aggressively competing for a bigger share of the market and increased capital investments by foreign entities in the Kenyan retail market, ii) the growing demand for goods, services, and retail space driven by favorable demographics both within and beyond the Nairobi Metropolitan Area (NMA), and, iii) infrastructural developments enhancing accessibility in regions offering new opportunities for retail investment. Nevertheless, the rampant proliferation of e-commerce platforms, which are quickly changing how consumers shop and purchase goods, and the oversupply of retail spaces, currently estimated at 3.0 mn SQFT in the Nairobi Metropolitan Area (NMA) and 1.7 mn SQFT in the larger Kenyan retail sector (excluding NMA), remain significant obstacles that continue to impede the sector's growth and overall performance.
- Regulated Real Estate Funds
- Real Estate Investment Trusts (REITs)
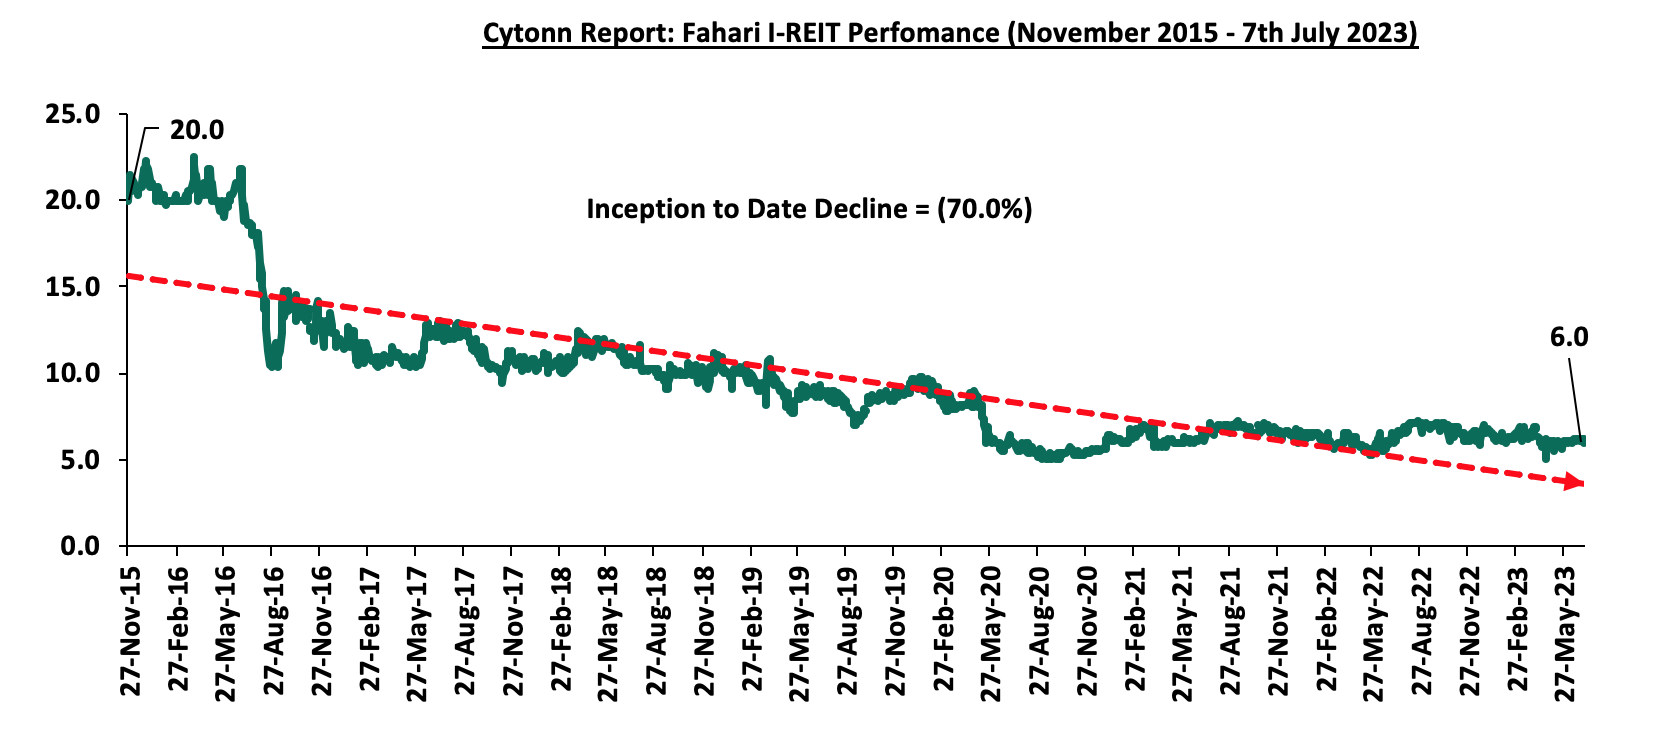
In the Nairobi Securities Exchange, ILAM Fahari I-REIT closed the week trading at an average price of Kshs 6.0 per share, remaining relatively unchanged from the price recorded the previous week. The performance represented an 11.5% Year-to-Date (YTD) decline from Kshs 6.8 per share recorded on 3 January 2023. In addition, the performance represented a 70.0% Inception-to-Date (ITD) loss from the Kshs 20.0 price. The dividend yield currently stands at 10.8%. The graph below shows Fahari I-REIT’s performance from November 2015 to 7 July 2023;
In the Unquoted Securities Platform, Acorn D-REIT and I-REIT traded at Kshs 23.9 and Kshs 21.6 per unit, respectively, as at 7 July 2023. The performance represented a 19.5% and 7.9% gain for the D-REIT and I-REIT, respectively, from the Kshs 20.0 inception price. The volumes traded for the D-REIT and I-REIT came in at 12.3 mn and 30.1 mn shares, respectively, with a turnover of Kshs 257.5 mn and Kshs 620.7 mn, respectively, since inception in February 2021.
REITs provide numerous advantages, including; access to larger capital pools, consistent and prolonged profits, tax exemptions, diversified portfolios, transparency, liquidity, and flexibility as an asset class. Despite these benefits, the performance of the Kenyan REITs market remains limited by several factors, such as; i) insufficient investor understanding of the investment instrument, ii) time-consuming approval procedures for REIT creation, iii) high minimum capital requirements of Kshs 100.0 mn for trustees, and, iv) high minimum investment amounts set at Kshs 5.0 mn discouraging investments.
- Cytonn High Yield Fund (CHYF)
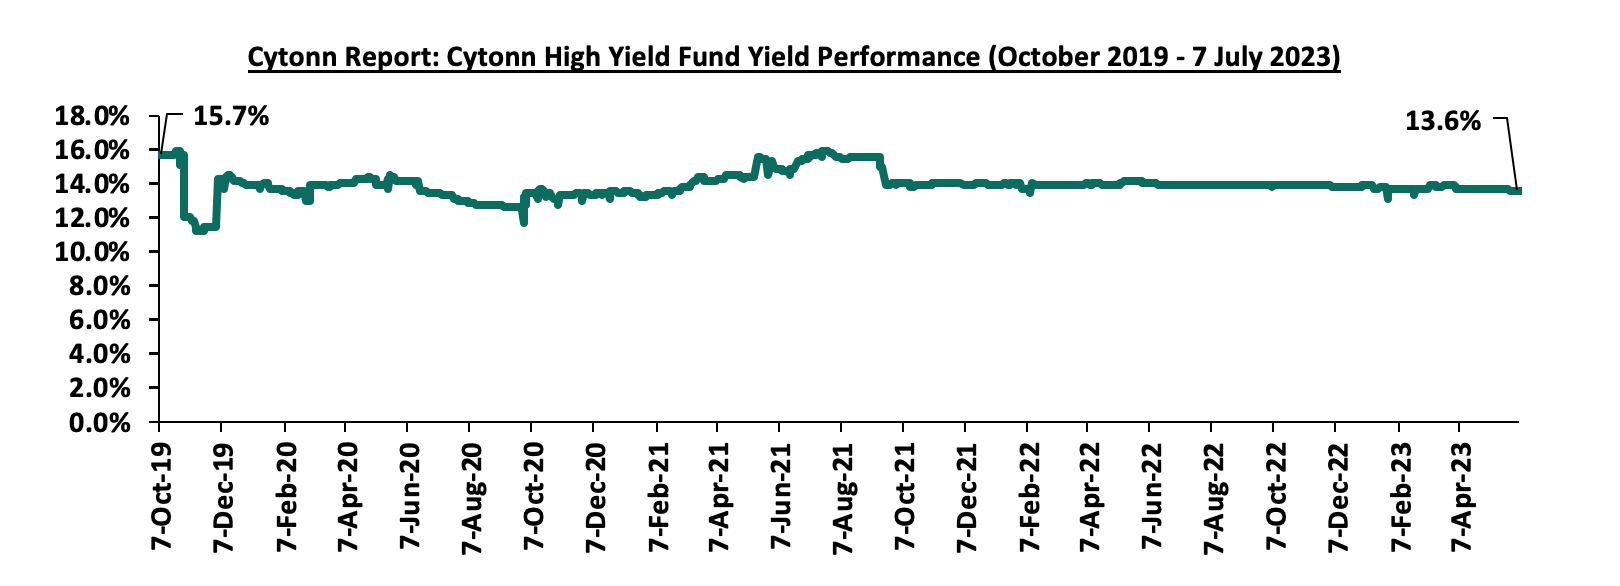
Cytonn High Yield Fund (CHYF) closed the week with an annualized yield of 13.6%, remaining relatively unchanged from the previous week. The performance also represented a 0.3% points Year-to-Date (YTD) decline from the 13.9% yield recorded on 1 January 2023, and 2.1% points Inception-to-Date (ITD) loss from the 15.7% yield. The graph below shows Cytonn High Yield Fund’s performance from October 2019 to 7 July 2023;
Notably, the CHYF has outperformed other regulated Real Estate funds with an annualized yield of 13.6%, as compared to Fahari I-REIT and Acorn I-REIT with yields of 10.8%, and 6.8%, respectively. As such, the higher yields offered by CHYF make the fund one of the best alternative investment resource in the Real Estate sector. The graph below shows the yield performance of the Regulated Real Estate Funds:
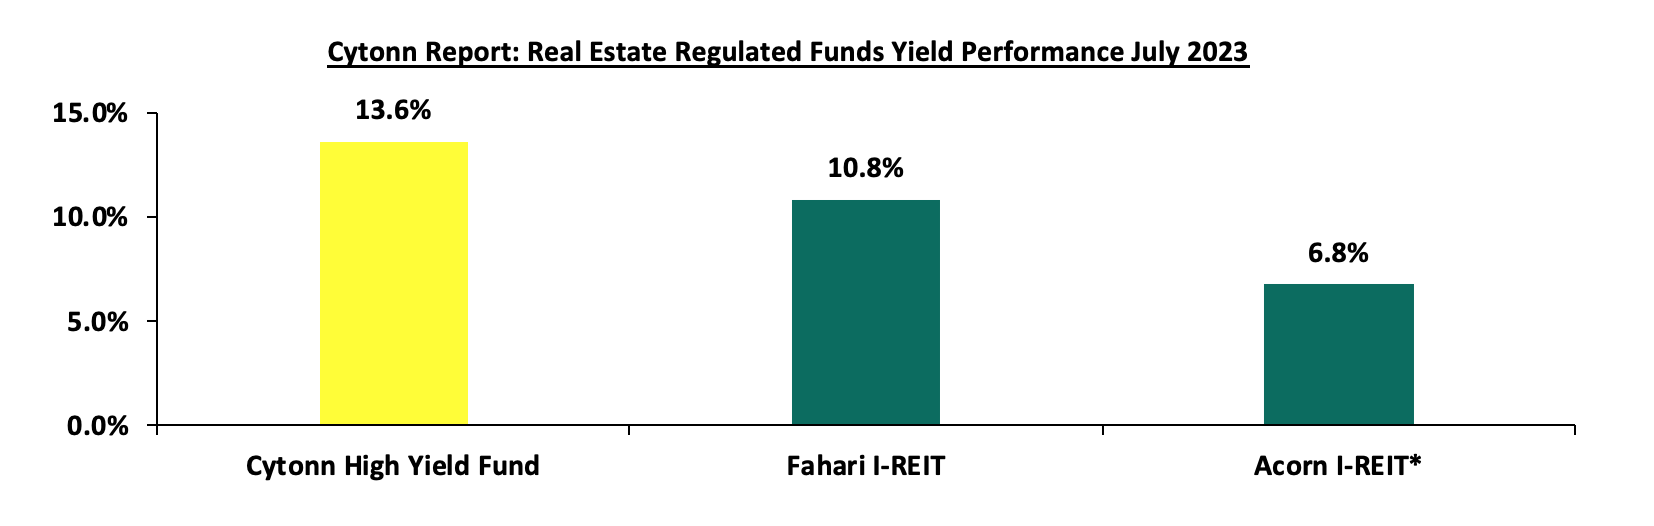
*FY’2022
Source: Cytonn Research
We expect the performance of Kenya’s Real Estate sector to remain on an upward trajectory, supported by factors such as; i) positive demographics continually boosting the demand for housing, ii) the increasing number of visitor arrivals into the country expected to continue boosting performance of the hospitality industry, and, iii) growing investor confidence in the retail sector which continues to avail more investments into the industry. However, factors such as; i) the rising costs of construction on the back of rising inflation which have subdued optimal construction activities, ii) existing oversupply of physical space prolonging vacancy rates in select sectors, and, iii) limited knowledge in REITs leading to reducing investments continue to hinder optimum performance of the sector.
The National Health Insurance Fund (NHIF) was established in 1966 through an act of parliament. Its core mandate is to provide affordable medical insurance coverage to all Kenyans, thereby enabling Kenyans to access quality and affordable medical services from medical institutions. The fund is governed by the NHIF Act (1998), which over the years has been subjected to a number of amendments to address the changing health care needs of the health sector in the country. Some of the notable changes in recent years include:
- Introduction of the Comprehensive Medical Insurance Scheme for Civil Servants (CMSCS) in January 2012. The CMSCS is part of NHIF and provides medical insurance to civil servants and their eligible beneficiaries. The scheme enables civil servants to enjoy inpatient treatments without any limits in government, missions, and some private hospitals,
- Introduction of the Health Insurance Subsidy Program (HISP) in September 2014. The program is financed by the government of Kenya, and the funds are channeled to NHIF for the benefit of identified households that are classified as poor and vulnerable,
- Upward revision of NHIF rates in April 2015, the rates increased from a contribution range of between Kshs 30.0 and Kshs 320.0, to a contribution range of between Kshs 150.0 to Kshs 1,700.0 depending on the employee’s salary. The benefits package was expanded to include not only inpatient cover but also other benefits such as outpatient cover and maternity benefits, among others,
- Launch of Universal Health Coverage program. The program is aimed at enabling all Kenyan Citizens to access free basic health care services in all public health facilities. The pilot phase was launched in December 2018 and was implemented Isiolo, Machakos, Nyeri and Kisumu counties, and
- Launch of biometric registration in October 2020 for all NHIF member. The move was intended to improve efficiency and enhance convenience for members seeking services and also reduce medical fraud.
On 1 May 2023, President William Ruto announced that there would be changes to the National Health Insurance Fund (NHIF) contributions deducted from the employees’ gross salary. The move is aimed at increasing the total contributions received by revising the contribution rate to 2.75% of the gross salary as opposed to the current charging of a fixed rate of between Kshs 150.0 – Kshs 1,700.0 depending on the gross salary bracket. Additionally, the increase in contributions is expected to enable the NHIF to address some of the witnessed cash crunch, which has resulted in some hospitals declining the use of NHIF cards to cover medical bills due to the delayed disbursements of funds by the NHIF to hospitals. According to the Ministry of Health Sector working group report 2021-2022, NHIF paid a total claim of Kshs 71.3 bn against the Kshs 78.8 bn it received from member contributions. This represents a 90.5% claim ratio, which was the highest claim ratio in the last 5 years, leaving only 9.5% of the total contributions received to cater for the fund’s other expenses, thereby exacerbating the Fund’s solvency risk and the possibility of its inability to meet future financial obligations. This further points towards the need for NHIF to revise upward the NHIF contributions if the fund is to be sustainable and profitable in the long term. As such, we saw it fit to review the National Health Insurance Fund (NHIF) to shed light on the current state of the fund in terms of the milestones achieved and the challenges faced while looking at the impact of the upward adjustment of the NHIF deductions. We shall also make a comparison with similar initiatives in other countries and give our recommendations towards achieving a sustainable Fund. We shall undertake this by looking into the following;
- The National Health Insurance Fund (NHIF),
- Challenges facing the National Health Insurance Fund (NHIF),
- The National Health Insurance Fund’s Membership and Contributions,
- National Health Insurance Fund Acts,
- Case Study and Recommendations, and,
- Conclusion.
Section I: The National Health Insurance Fund (NHIF)
The National Health Insurance Fund, formerly known as the National Hospital Insurance Fund, was established in 1966 through an Act of Parliament. The fund was initially intended for employed individuals in the formal sector, however, in 1972, the act was amended to incorporate those in the informal sector. In 1998, the original act was replaced with the National Insurance Fund Act, No.9 of 1998, which transformed the fund into a state owned corporation run by a board of Management. The fund’s core mandate is to provide affordable medical insurance cover to all Kenyans as well as facilitate access to quality and affordable medical services from medical institutions. This is achieved through:
- Registering and receiving contributions,
- Processing payments to accredited health care providers,
- Carrying out regular internal accreditation of health facilities,
- Contracting health care providers as agents to facilitate the health insurance scheme,
- Protecting the interests of the contributors to the Fund, and,
- Advising on the national policy to be followed with regard to National Health Insurance.
The Fund is governed by a Board of Management, as defined in the National Insurance Fund Act, No.9 of 1998, with their role being management, control, and administration of the Fund’s assets to ensure the Fund achieves its goals and objectives. The members of the Board of management consist of:
- The Chairperson, who is appointed by the President,
- The Principal Secretary, Ministry of Health,
- The Principal Secretary, National treasury and planning,
- One person nominated by the Kenya Medical Association,
- One person nominated by the Federation of Kenya Employees,
- One person nominated by the Central Organization of the Trade unions,
- Two persons, not being Governors, nominated by the Council of Governors,
- Two persons, not being Officers, nominated by the Cabinet Secretary, Ministry of Health, and,
- The Chief Executive Officer (CEO), who is appointed by the Board of Management through a competitive process and serves for term of 3 years and is eligible for appointed for a further and final 3-year term
The day to day management and implementation of policy matters are done by the Chief Executive Officer (CEO). The Fund’s Board of Management is mandated with the following functions and objectives:
- To receive all the contributions and other payments due to the Fund,
- To make payments out of the Fund to the accredited health facilities,
- To set criteria for the accreditation of hospitals and to declare such hospitals,
- To regulate the contributions payable to the Fund, benefits, and other payments to be made out of the Fund,
- To promote the interests of the contributors to the Fund, and,
- To advise on the national policy to be followed with regards to National Health Insurance and implement all government policies.
Section II: Challenges facing the National Health Insurance Fund (NHIF)
Despite the progress made by NHIF over the 57 years it has been in operation, the fund has encountered a number of challenges that have hampered its ability to achieve its objectives. These challenges have raised uncertainties about the sustainability of the fund and had a damaging effect on the Funds image. Some of the notable challenges include;
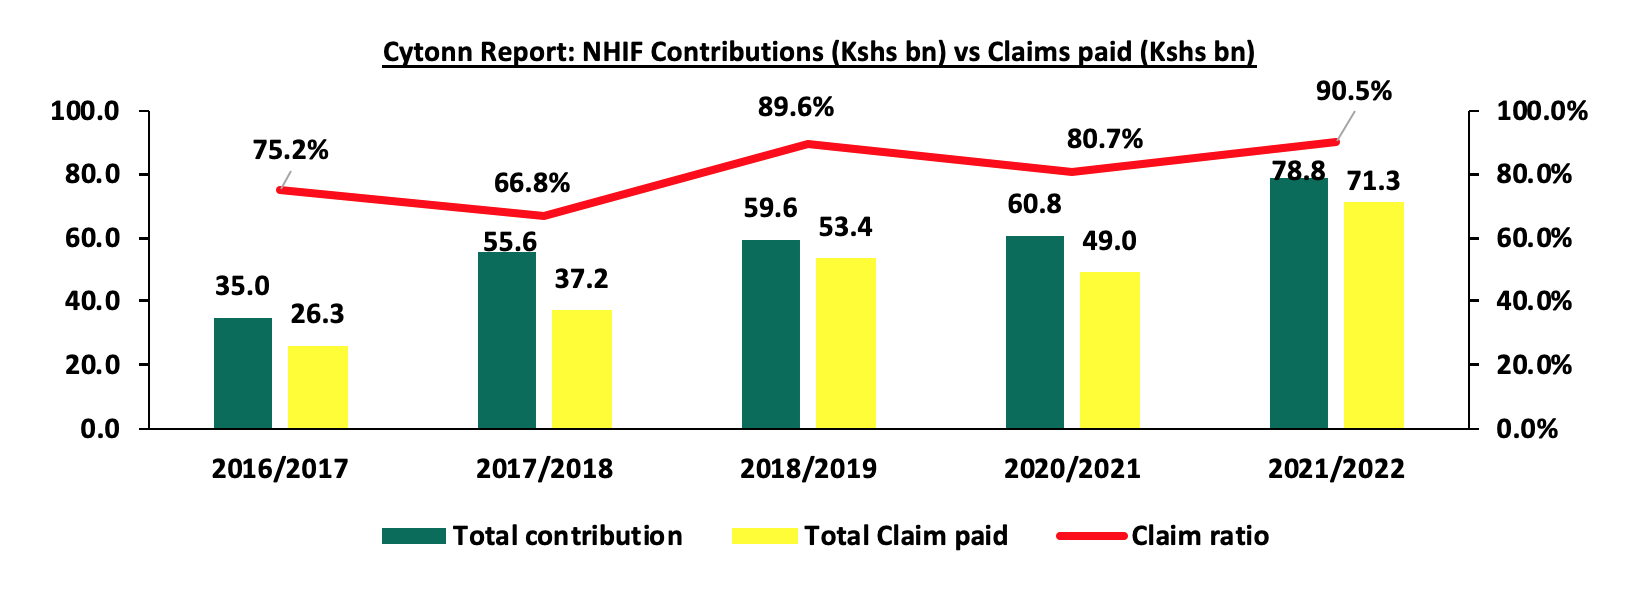
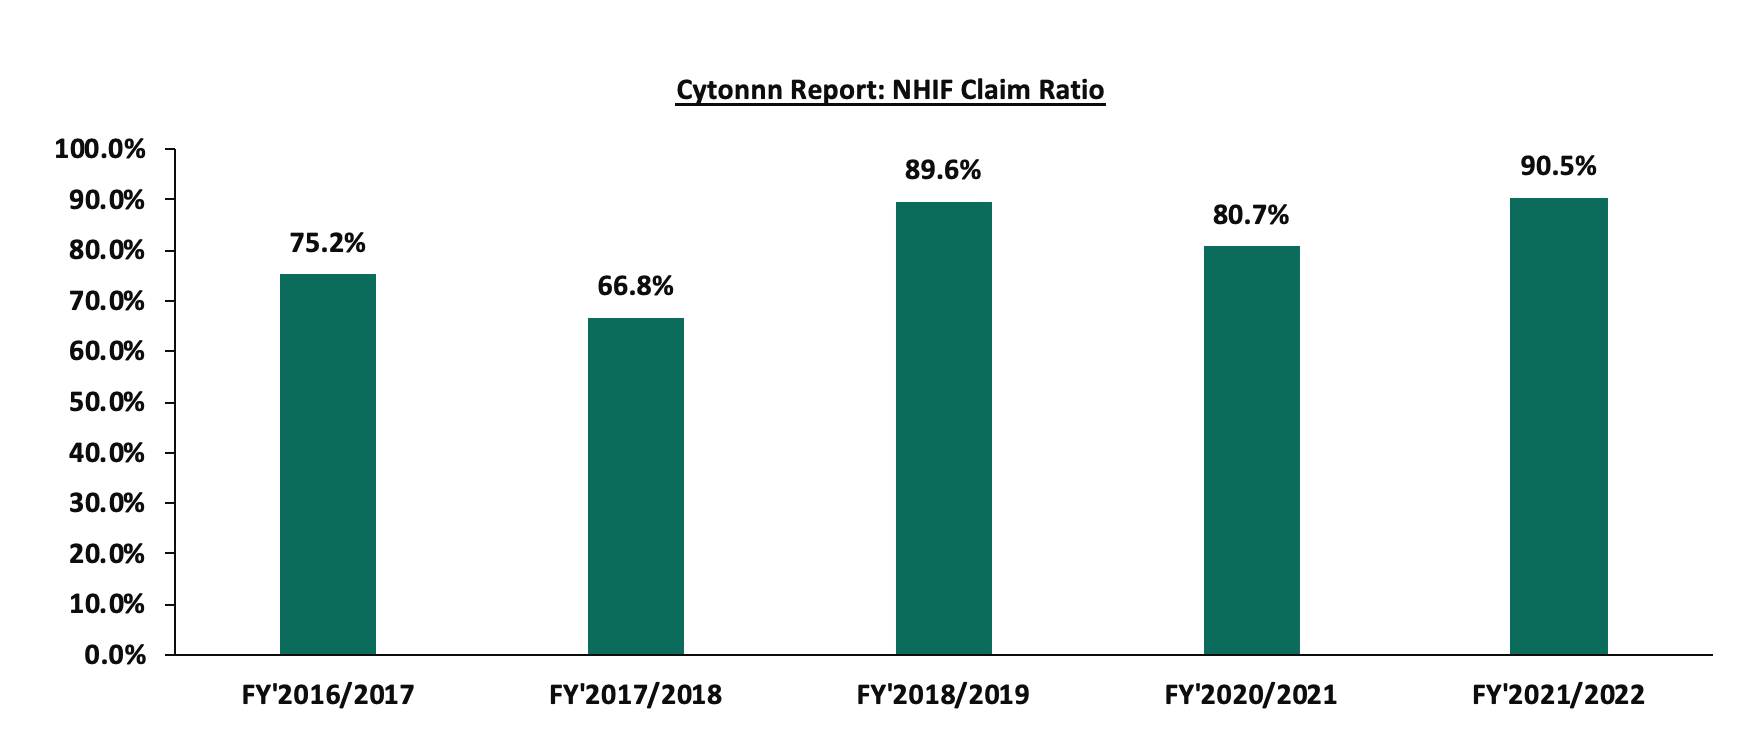
- High payout ratio - Despite the fact that NHIF premium contributions have been increasing over the years, with total contributions to the Fund growing at a 5-year CAGR of 17.6% to Kshs 78.8 bn in FY’2021/2022 from Kshs 35.0 bn in FY’2016/2017, the growth in total payout from the fund has outpaced the growth in total contribution received, having grown by a 5-year CAGR of 22.1% to Kshs 71.3 bn in FY’2021/2022, from Kshs 26.3 bn in FY’2016/2017. This has led the claim ratio for FY’2021/2022 to increase by 15.3% points to 90.5% from the 75.2% claim ratio recorded in FY’2016/2017. As such, the high pay-out ratio reduces the fund’s net operating surplus, increasing the Fund’s solvency risk and the possibility of its inability to meet future financial obligations. Below is the graph of growth of the claim ratio for the last 5 years:
- Low Insurance Penetration – Insurance uptake in Kenya continues to remain low compared to other key economies, with insurance penetration at 2.3% as of FY’2022, according to the Q4’2022 Insurance Regulatory Authority (IRA) and the Kenya National Bureau of Statistics (KNBS) 2023 Economic Survey. The low penetration rate, which is below the global average of 7.0%, according to the Swiss RE institute, is attributable to the fact that insurance uptake is still seen as a luxury and is mostly taken when it is necessary or a regulatory requirement. Notably, Insurance penetration remained unchanged at 2.3% in 2022, similar to what was recorded in 2021 and 2020. The chart below shows Kenya’s insurance penetration for the last 12 years:
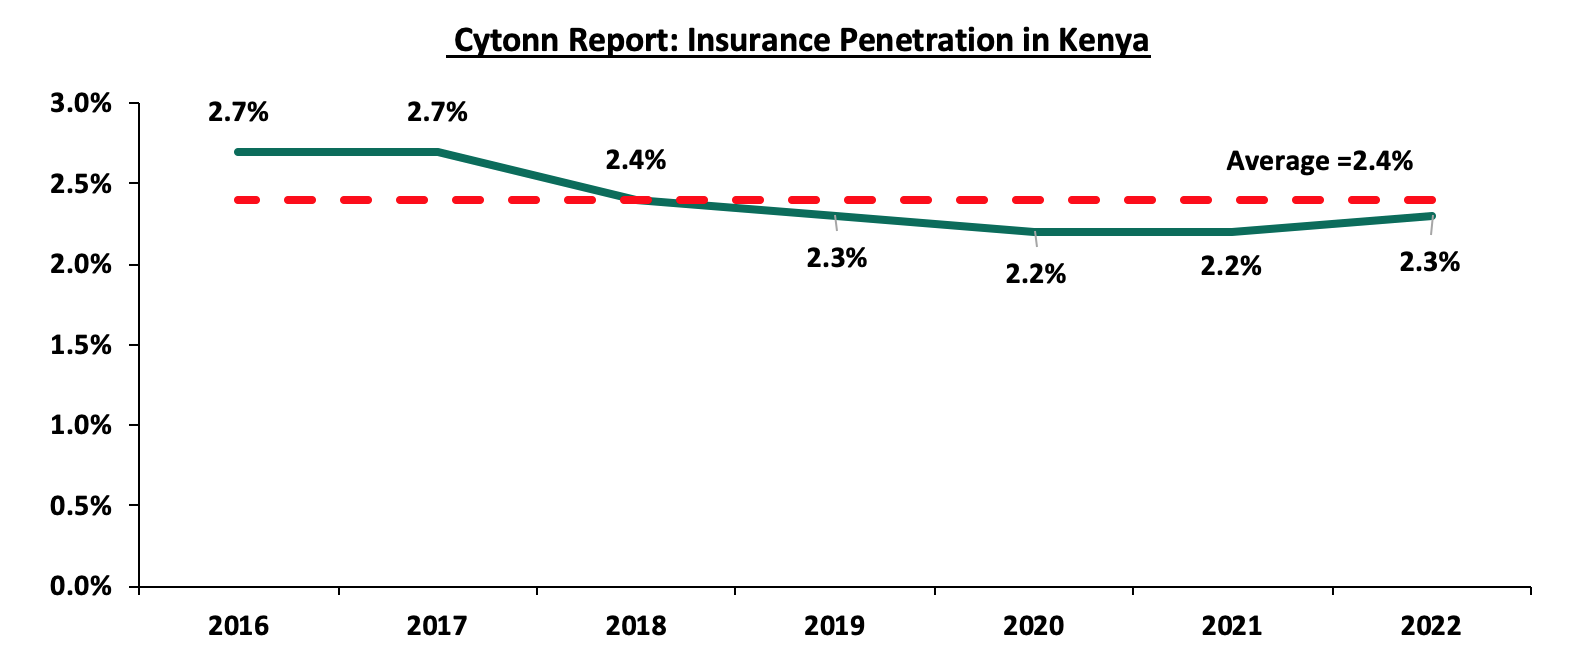
Source: CBK Financial Stability Reports
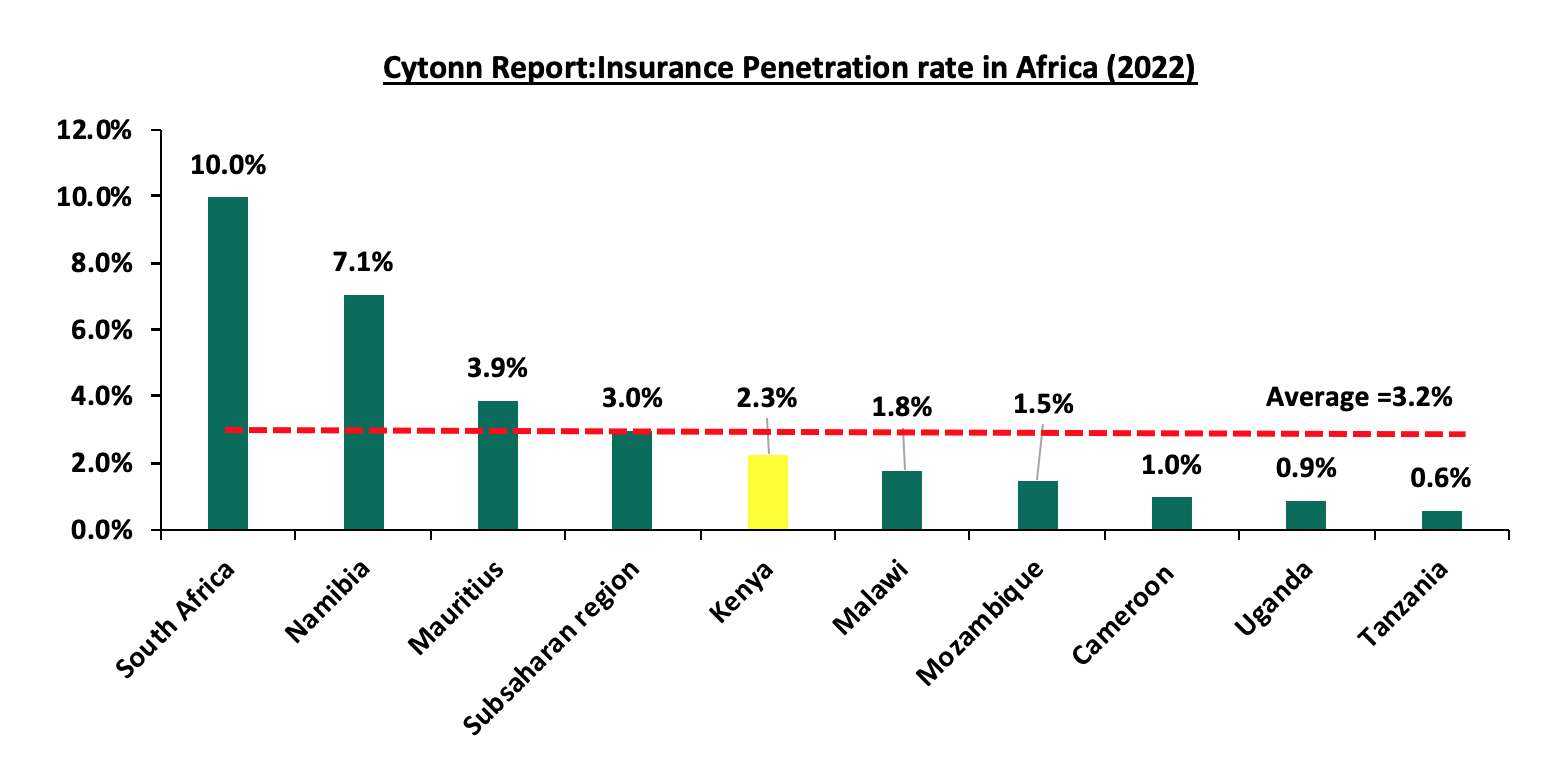
Source: Swiss Re, GCR Research, KNBS
- Failure to achieve revenue targets – For the last 3 years, the fund has been operating below its targeted revenue collection, which constitutes the total contribution received plus the investment income earned. In FY’2021/2022, the funds collected a total revenue of Kshs 80.4 bn, which was below the revenue target of Kshs 90.6 bn representing a revenue target attainment of 88.8%. This was below the previous year’s revenue target attainment of 96.1% from a total revenue of Kshs 62.0 bn against a revenue target of Kshs 64.5 bn,
- High attrition rate – The fund has continued to experience a decline in active membership who make monthly contributions due to low retention rates as a result of attrition of informal sector registered members, partly attributable to low disposable income. According to the Ministry of Health Sector report 2021/2022, the Fund’s active membership stood at 43.2% of the 15.5 mn registered members in FY’2021/2022, compared to an active membership of 89.7% out of the 6.8 mn members in FY’2016/2017,
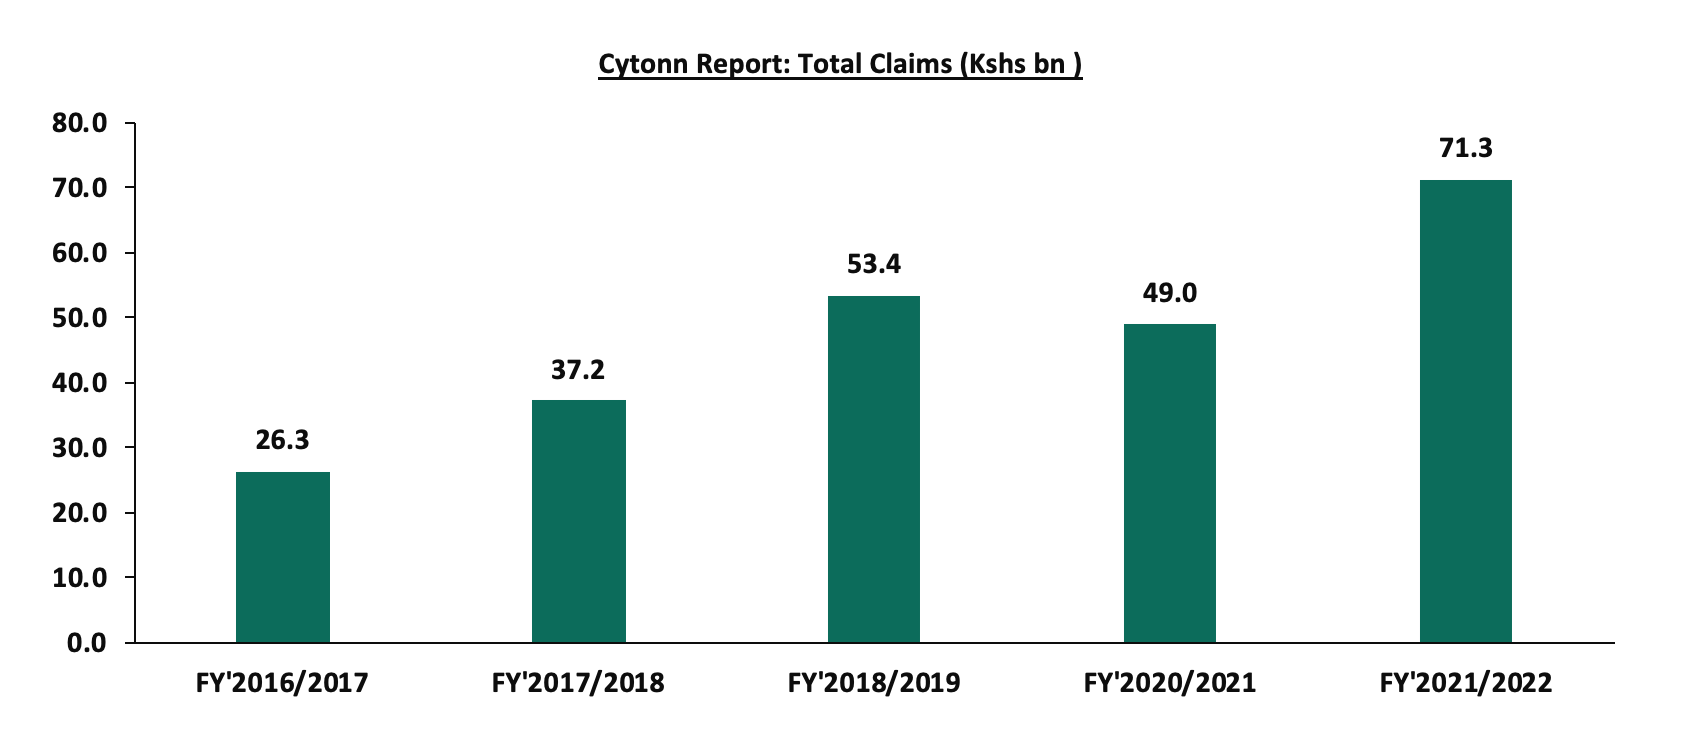
- Fraudulent Claims – There have been numerous instances of fraudulent claims, including collaboration between some beneficiaries and health service providers. Additionally, there have been reports of some health service providers participating in altering or falsifying information to increase their payouts from the Fund. Such occurrences have led to an increase in claims, consequently reducing the net operating surplus of the Fund. Notably, the total claims paid out of the fund increased at a 5-year CAGR of 22.1% to Kshs 71.3 bn in FY’2021/2022, from Kshs 26.3 bn in FY’2016/2017,
- Rise in cost of medical services – The cost of medical drugs and procedures has also been on the rise in the wake of the Kenya shilling’s depreciation against the US dollar, forcing healthcare providers to pass on the increased cost to insurers and patients who pay out of pockets,
- Overdependence on total Contributions as the source of funding - According to the Ministry of Health Sector report 2021/2022, the fund’s other income totaled Kshs 1.6 bn out of the total revenue of Kshs 80.4 bn in FY’2021/2022, representing 2.0% of the total revenue collected
- Delayed Remittances – The Fund has experienced delayed remittances of the NHIF contributions by some employers and self-employed individuals. Consequently, this has continued to hinder the Fund’s ability to meet its collection targets. In June 2023, the Cabinet Secretary for the Ministry of Health, Susan Nakhumicha, noted that the government owed NHIF a total of Kshs 20.0bn, and,
- Mismanagement and misappropriation of funds – There have been cases of corruption and mismanagement of funds at the NHIF. As such, this has hampered the Fund’s ability to meet its objectives, with the Fund also witnessing dwindling trust from the contributors.
Section III: The National Health Insurance Fund’s Membership and Contributions
Membership in the NHIF is mandatory for all workers in formal employment, with the contributions ranging between Kshs 150.0 to Kshs 1,700.0 depending on the employee’s gross salary bracket. According to the Ministry of Health Sector working group report 2021-2022, NHIF membership stood at 15.5 mn members with an active membership of 6.7 mn as at 30 June 2022. The chart below shows the evolution of membership since FY’2016/2017:
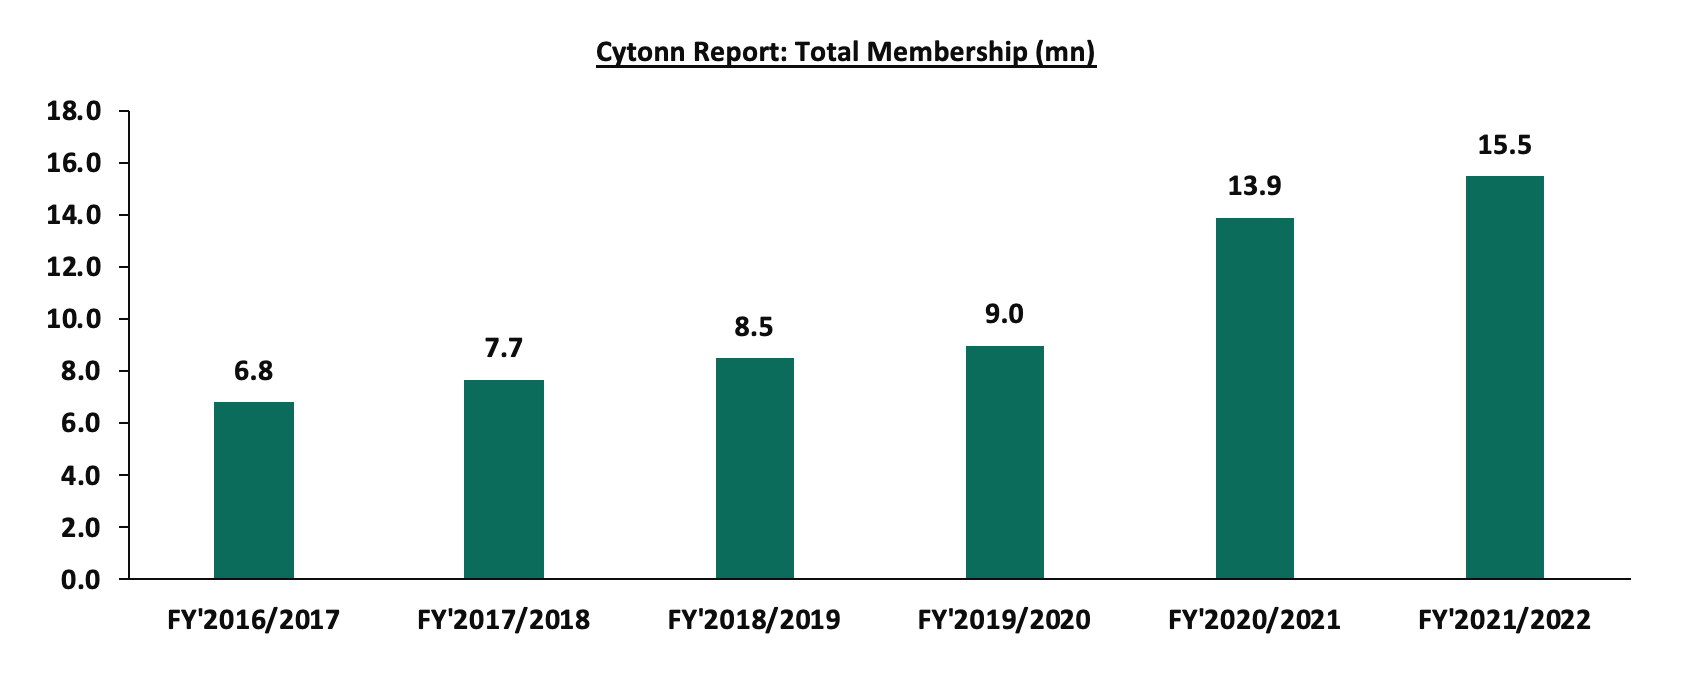
Source: Ministry of health Sector working group report
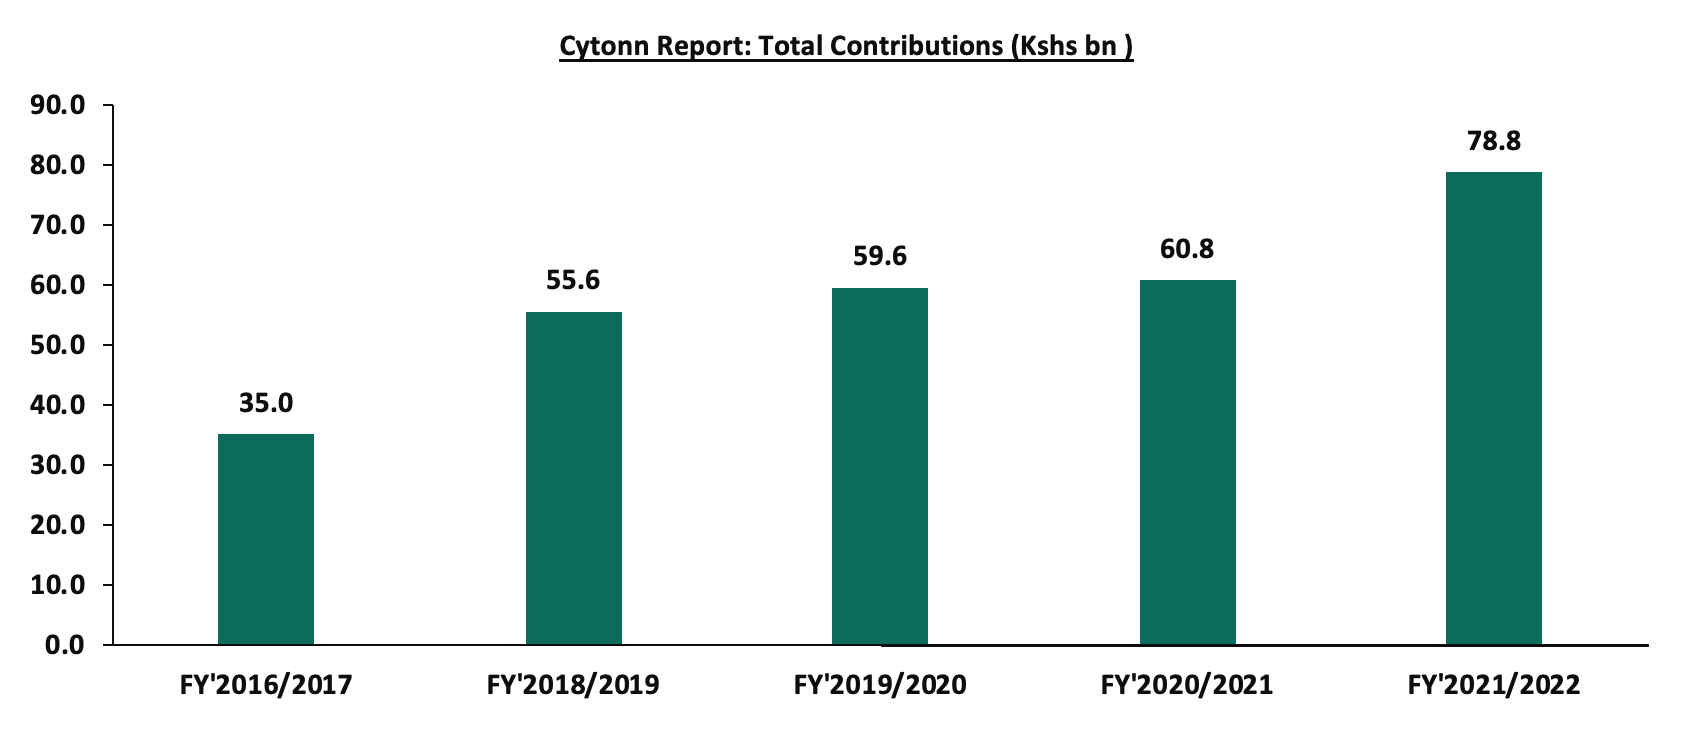
The total contributions made to the Fund have grown at a 5-year CAGR of 17.7% to Kshs 78.8 bn in FY’2021/2022, up from Kshs 35.0 bn collected in FY’2016/2017. This is mainly attributable to the upward revision of workers’ monthly contribution rates to a scale of between Kshs 500.0 and Kshs 1, 700.0 from Kshs 320.0 in 2015, due to the expansion of benefit package to include outpatient cover, special initiatives such as Health Insurance Subsidy Programme (HISP), Universal Health Care and Linda Mama Programme. The graph below shows the growth of the total contributions to the Fund:
Source: Ministry of health Sector working group report
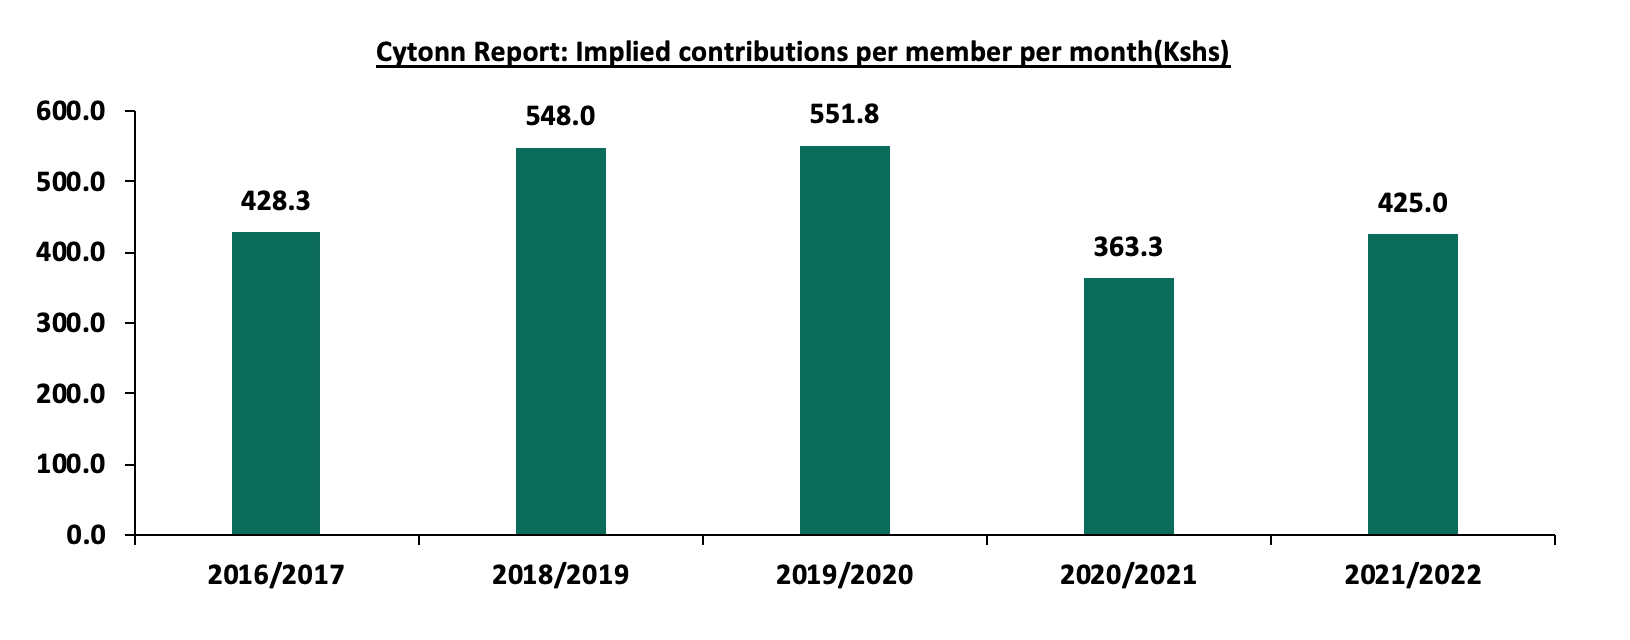
However, in FY’2021/2022 the fund did not meet its collection target of Kshs 90.6 bn, achieving only 88.8% of its target, compared to the 96.1% target achievement recorded in FY’2020/2021. This was attributable to a tough macroeconomic environment as a result of the negative effects of the COVID-19 pandemic, which caused companies to downsize, reduce salaries, and even shut down. Similarly, the informal sector also experienced financial challenges brought on by the negative effects of the COVID-19 pandemic which impaired their ability to make voluntary contributions to the fund. Below is graph showing the implied monthly contributions per member:
Source: Ministry of health Sector working group report
The total claims paid out of the fund have also increased at a 5-year CAGR of 22.1% to Kshs 71.3 bn in FY’2021/2022, from Kshs 26.3 bn in FY’2016/2017, mainly attributable to increased uptake of outpatient cover and special cover packages. The graph below shows the growth of the total claims paid out of the Fund:
Source: Ministry of health Sector working group report
Despite the significant growth in the total membership contributions, the growth of the total claims paid continues to weigh down on the net contributions retained in the fund. Notably, in FY’2021/2022, the claim ratio was at its peak, coming in at 90.5%, representing 9.8% points increase from the 80.7% ratio recorded in FY’2020/2021. The increase was mainly a result of the high uptake of outpatient cover and special cover packages, partly due to prevalence of chronic diseases. Below is the graph showing the movement of the benefits to contribution ratios over the years:
Source: Ministry of health Sector working group report
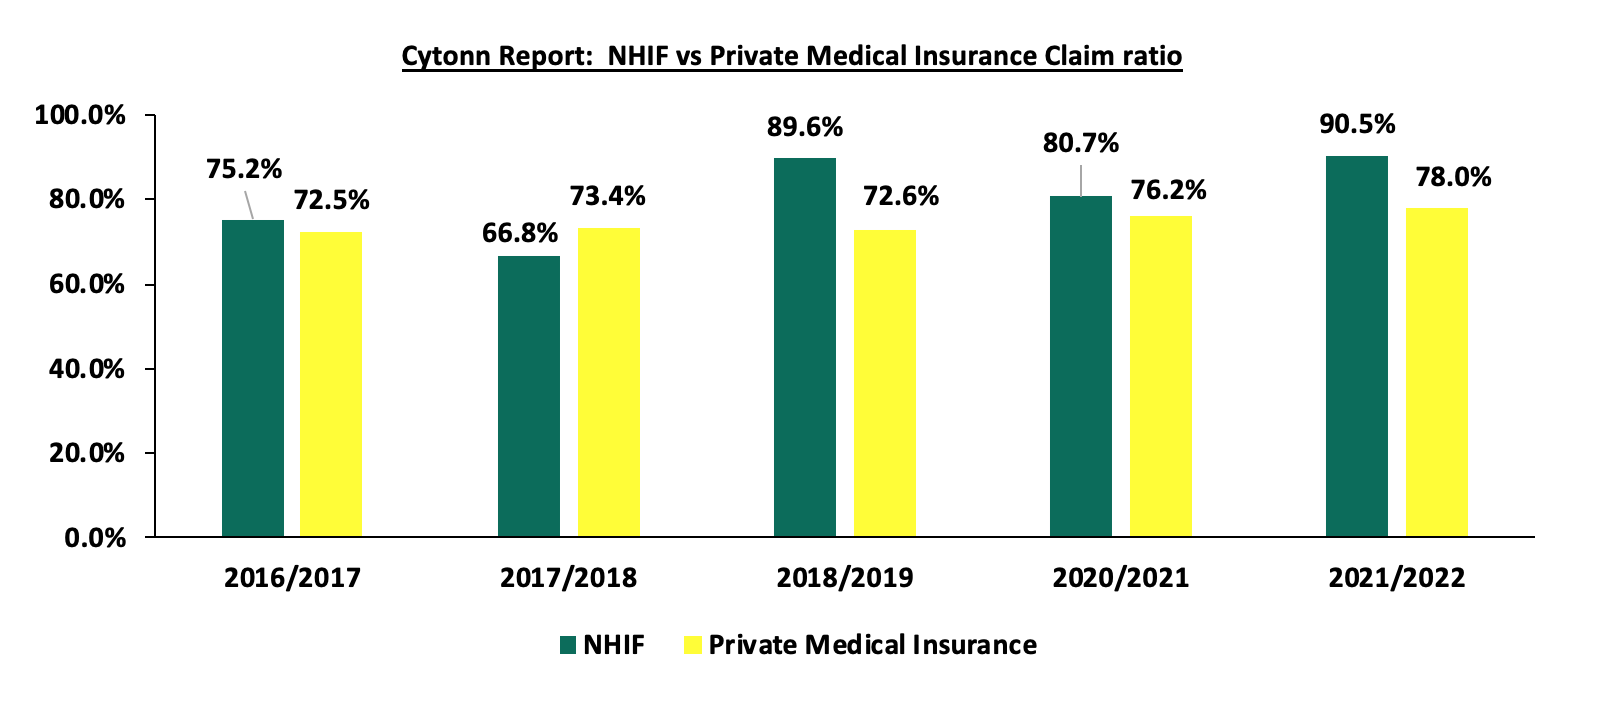
NHIF claim ratio of 90.5% as at 30th June 2023 is significantly high when compared to the Private Medical insurance claim ratio of 78.0%, according the Insurance Regulatory Authority (IRA) Q2’2022 Insurance industry report. This high claim ratio of NHIF indicates there is a possibility of the Fund being overcharged by health service providers or the contributions charged by NHIF are not sufficient enough to run the fund. NHIF needs to come up with austeric measures to lower the claim ratio to match the Private Medical Insurance claim ratio of 78.0%. With a total contribution of Kshs 78.8 bn and Claim ratio of 78.0%, the fund will have paid out a total claim of Kshs 61.5 bn and consequently the fund will have a surplus of Kshs 17.3 bn as opposed to the current surplus of Kshs 7.5 bn. Below is the graph comparing the claim ratio for NHIF with the Private medical insurance claim ratio:
Source: Ministry of health Sector working group report, IRA
Section IV: National Health Insurance Fund Acts
NHIF Act 1998 is the principal statute that governs the NHIF, with the Act having been amended severally to accommodate the changing health care needs of the Kenyan population as well as lessen the restrictions in the health sector. The main focus of the continued amendment has been to operationalize key areas under the NHIF Act 1998 in order to attain the Universal Health Coverage (UHC) through the removal of financial barriers. Key reforms that have since been implemented to enhance the capacity of the NHIF to effectively deliver its mandate include;
- Upward revision of workers’ monthly contribution rates to a scale of between Kshs 500.0 and Kshs 1, 700.0, from Kshs 320.0 in 2015,
- Expansion of the NHIF benefit package to also accommodate the outpatient care services from the previous restriction of just offering inpatient services only,
- Amendment of the NHIF Act to outline appropriate legal framework for UHC implementation, such as digitization of the processes in order to scale up UHC as well as the introduction of additional benefits,
- Expansion of the empaneled healthcare providers network to ensure members have easy access to affordable and quality health services, and,
- Implementation of biometric registration and identification of NHIF beneficiaries to enhance convenience for members seeking services and also reduce medical fraud.
- The National Health Insurance Fund Act, Regulations, 2022
The NHIF Act 1998 was subjected to several amendments and passed in parliament in December 2021 and assented into law in January 2022 and was referred to the National Health Insurance Fund Act, Regulations, 2022. The regulations sought to:
- Prescribe the mode of identification of beneficiaries for purposes of fulfilling goals of the fund,
- Ensure that every person of 18 years and above and is a Kenyan resident is registered member of the Fund,
- Define the different types of contributions to be made to the Fund, and,
- Provide for benefit entitlements to members and their beneficiaries and the payment of claims to healthcare providers.
Key provisions in the NHIF Amendments 2022 included;
- The draft had proposed to maintain the current contributions of between Kshs 150 and Kshs 1600 for individual in salaried employment earning up to Kshs 99,999,
- For salaried individuals earning gross income of Kshs 100,000.0 and above, they were to be subjected to a monthly contribution rate of 1.7%, in contrast to the current flat rate of Kshs 1,700.0 per month,
- For the individual identified under the indigents and vulnerable group, the government committed to pay Kshs 500.0 per month on their behalf, and,
- Other contributors not employed or listed as an indigent or vulnerable person were to pay a monthly contribution rate of Kshs 500.0.
- The National Health Insurance Fund Regulations, 2023
Following the recent release of the proposed amendments to the current Act, the NHIF invited public participation and feedback on the Draft National Health Insurance Fund (NHIF) Amendment Act Regulation, 2023. The draft is meant to replace the NHIF Act 1998 (amended in 2022) subject to approval by the Parliament.
The Key provisions that have been proposed include;
- There will be a standard contribution rate of 2.75% of the gross monthly income for a person in salaried employment. This will be in contrast with the current Act in which individuals in formal employment are contributing between Kshs 150.0 to Kshs 1700.0 based on gross salary bracket,
- For the self-employed person, they will be subjected to a special contribution at a rate of 2.75% of the declared or assessed gross monthly income. The minimum contribution for a self-employed member will not fall below Kshs 300.0,
- The national government commit to pay Kshs 13,300.0 annually on behalf of indigent and vulnerable persons,
- Other contributors not employed or listed as an indigent or vulnerable person shall pay a monthly contribution of Kshs 1,000.0, as opposed to the Kshs 500.0 proposed in the draft regulations 2022, and,
- The proposed regulation reduces the period for access to benefit after registration to 60 days as opposed to the current 90 days.
Comparison between the Current and Proposed NHIF rates
The proposed regulations will see a drop in contributions for individuals earning less than Kshs 30,000.0 per month, while an increase for persons earning Kshs 30,000.0 and above per month. The table below shows the comparison of current and proposed rates for members for the select income bracket;
|
Cytonn Report: Current and Proposed NHIF Rates |
||
|
Employee Gross monthly Income per month (Kshs) |
Current Rate (Kshs) |
Proposed Rate (2.75% of the Gross Salary) (Kshs) |
|
15, 000.0 - 19,999.0 |
600.0 |
412.5 - 550.0 |
|
25,000.0 – 29,999.0 |
850.0 |
687.5 – 825.0 |
|
35,000.0 - 39, 999.0 |
950.0 |
962.5 – 1,100.0 |
|
45,000.0 - 49,999.0 |
1,100.0 |
1,237.5 - 1,375.0 |
|
60,000.0 - 69,999.0 |
1,300.0 |
1,650.0 - 1,925.0 |
|
80,000 .0 - 89,999.0 |
1,600.0 |
2,200.0 - 2,475.0 |
|
100,000.0 - 200,000.0 |
1,700.0 |
2,750.0 - 5,500.0 |
|
300,000.0 - 500,000.0 |
1,700.0 |
8,250.0 - 13,750.0 |
Source: Cytonn Research
Key take outs from the above table;
- Individuals earning less than Kshs 30,000.0 per month will have their contributions dropping by between 2.9% and 40.0% per month,
- Individuals earning over Kshs 100,000.0 will see an increase to over Kshs 2,700.0 per month contributions from the current flat rate of Kshs 1,700.0, and,
- For persons earning Kshs 500,000.0 per month, their contribution will rise 7 times to Kshs 13,750.0. from the current flat rate of Kshs 1,700.0 per month.
Some of the impacts of the proposed regulations and rates on contributors include;
- Increase affordability by low income earners: Under the proposed regulations the required monthly contributions from low income earners will drop. As such, this is expected to increase affordability to many people with low income in both formal and informal employment, and,
- Increased burden for high income earners: The proposed regulation will see the contributions from high income earners significantly increase. This is likely to add burden and reduce disposal income among the earners under those brackets,
- Increased cost to the government: The government’s committing to increase its monthly contribution for the indigent and vulnerable persons, will strain on its expenditure given the government has been recording a budget deficit occasioned by low revenue collection and high expenses.
Section V: Case Studies and Recommendations
National Health Insurance Funds are government sponsored insurance covers aimed at ensuring its citizens get affordable medical covers irrespective of their social-economic status. This enables the citizens to access health care services without having to dig into their pockets to cater for the medical expenses. In most cases they are mandatory and a portion of the employee’s salary is deducted and remitted to these funds. National Health Insurance Funds have been created in several countries, and often vary in terms of structure and systems of operations. In this tropical we shall focus on the United Kingdom National Health Service and Japan National Health Insurance System. Additionally, we shall discuss key take outs from the Case Studies;
|
Cytonn Report: Summary of National Health insurance Funds in Various Countries |
|
|
Institution |
Key-Take-outs/Features |
|
Japan National Health Insurance System (NHIS) |
|
|
United Kingdom National Health Service (NHS) |
|
Source: Cytonn Research
In order to ensure the effectiveness of the NHIF, the government, in collaboration with the NHIF's board of management and health service providers, can borrow a number of key takeaways from Japan's NHIS and the UK NHS and work together to address some of the challenges faced by the funds. As such, we recommend the undertaking of the following actionable steps:
- Improve the Infrastructure of Public Hospitals: To achieve a Universal Health Care (UHC) system, the government should invest in facilities in public hospitals to ensure they offer quality services, given that the majority of individuals in rural areas access health services from public hospitals due to difficulty accessing private hospitals. According to the UK Department of Health and Social Care report Annual report and Account 2021-2022, NHS spent £32.1 bn (Kshs 4.9 tn) to finance the commissioning of new hospitals, renovate existing health care facilities, and purchase health care equipment’s among others. UK investment in improving health facilities infrastructure has enabled one of the best health care systems in the world, as it is among the top 5 best health systems in the world, according to the Common Wealth Secretariat
- Investigate the high Claims Ratio: The claims ratio for NHIF is at 90.5% whereas the Insurance Regulatory Authority, IRA, says that medical claims ratio should be at 78%, the high claims ratio for NHIF may point to fraud or overbilling by hospitals
- Creation of Strong partnerships with both the public and private health service providers: With the recent bad blood between NHIF and the local health service providers on the back of delayed remittance of the amounts owed, NHIF should aim to rebuild a cordial relationship with them in order for Kenyan Citizens to access health care services in any health facility. In most instances, Kenyans are forced to pay for health services out of their pockets as some hospitals decline the use of NHIF cards to settle for expenses. In Japan, the good relationship between NHIS and the health service providers has enabled Japan’s residents to have the freedom to access health care services anywhere at any time,
- The Government should have an active role in setting up the Fees charged by the service providers: Given that there are reports showing that some health service providers are altering or falsifying information to increase their payouts from the Fund, the government should play an active role in setting the baseline fees for the services offered in health institutions to prevent Kenyans and the fund from being overcharged. In Japan, the government is responsible for preparing the fee schedule entailing all the fees for all the services offered by health institutions and ensuring strict adherence to the schedule, and,
- Government should consider including a subsidy program for NHIF: The elevated prices of food and fuel have reduced Kenyan residents’ disposable income, and therefore Kenyans have to dig into their pockets in the event that they have surpassed their limits. Insurance penetration in Kenya continues to remain low compared to other key economies, with insurance penetration at 2.3%, which is below the global average of 7.0%,according to the Swiss RE institute, and is attributable to the fact that insurance uptake is still seen as a luxury and is mostly taken when it is necessary or a regulatory requirement. As such, the government should come up with a subsidy program aimed at cushioning Kenyans from rising medical costs. Case in point; Japan has a subsidy program called the "High Cost Medical Expense Benefit System" aimed at shielding the residents from the burden of medical expenses in the event they exceed their monthly limits. The system sets the maximum threshold an individual can pay out of pocket depending on their age and income.
Section VI: Conclusion
The major concern facing the National Health Insurance Fund is its sustainability and profitability in the long term given the high claim ratio, which reduces the Fund’s net operating surplus. Additionally, the heightened concern has been exacerbated by the delayed remittance from the government, which has hampered the Fund’s ability to settle its obligations with the country’s health service providers. As such, the proposed increase in the NHIF rate to 2.75% is a commendable step in addressing the cash crunch witnessed in the fund. With the high claim ratio, it further reinforces the need for an upward revision of the rate, given that the growth in total claims is outpacing the growth in total contributions received. However, given the high cost of living in Kenya, exacerbated by elevated inflationary pressures, the increase in rates will be an additional cost to Kenyans, reducing their disposable income. We are of the view that to achieve Universal Health coverage, the government should increase its investment in developing the health care infrastructure in order to ensure the equitable provision of health services.
Disclaimer: The views expressed in this publication are those of the writers where particulars are not warranted. This publication, which is in compliance with Section 2 of the Capital Markets Authority Act Cap 485A, is meant for general information only and is not a warranty, representation, advice or solicitation of any nature. Readers are advised in all circumstances to seek the advice of a registered investment advisor.

- Talk to us
- Kenya
- P.O Box 20695 - 00200, Nairobi, Kenya
- Cell +254709101200
- Tel +254709101200
- WhatsApp +254741676635
- United States
- +254709101200
- DOWNLOAD OUR APP
-


- Kenya
- 8th Floor, Pinetree Plaza, Kaburu Drive, Ngong Road, Nairobi, Kenya
- USA
- Suite 1150, 1775 Eye Street NW, USA, Washington DC 20006, USA
- Investments
- High Yield
- Private Equity
- Real Estate
- Real Estate
- RiverRun Estates
- Cytonn Towers
- The Ridge
- Taraji Heights
- The Alma