Cytonn Monthly - August 2022
By Cytonn Research, Sep 4, 2022
Executive Summary
Fixed Income
During the month of August, T-bills remained undersubscribed, with the overall subscription rate coming in at 73.2%, down from 97.4% recorded in July 2022 partly driven by the uncertainty which surrounded the August 2022 general elections. The overall subscription rates for the 91-day paper increased to 280.6% from 278.1% while that of the 182-day and 364-day papers declined to 40.4% and 22.9% from 74.8% and 47.6% recorded in July 2022, respectively. In the primary bond market, the government bonds for the month of August were undersubscribed with the average subscription rate coming in at 98.3%, higher than the 29.3% average subscription rate for the month of July 2022;
Also during the week, the Kenya National Bureau of Statistics (KNBS) released the y/y inflation for the month of August 2022 highlighting that the inflation rate increased to 8.5%, from the 8.3% recorded in July 2022;
Equities
During the month of August, the equities market recorded mixed performance, with NASI and NSE 25 declining by 2.5% and 0.6%, respectively while NSE 20 gained by 2.9%. The equities market performance was driven by losses recorded by large cap stocks such as Safaricom, EABL and KCB Group which declined by 6.7%, 2.7% and 0.7%, respectively. The losses were however mitigated by gains recorded by other large cap stocks such as NCBA, ABSA, Bamburi and Co-operative Bank of 16.6%, 7.2%, 4.7% and 4.2%, respectively. During the month, KCB Group announced that it had entered into a final agreement with shareholders of Trust Merchant Bank (TMB) to acquire an 85.0% stake in the Democratic Republic of Congo (DRC)- based lender, with an option to acquire the remaining stake after two years;
During the week, HF Group released their H1’2022 financial results, indicating an increase in Core earnings per share by 114.4 % to Kshs 0.1 in H1’2022, up from the loss per share of Kshs 0.9 recorded in H1’2021. Additionally, the International Finance Corporation (IFC) disclosed that it would extend USD 150.0 mn (Kshs 18.0 bn) to KCB Group in form of a senior unsecured loan with a maturity of 7-years and a grace period of 2-years;
Real Estate
During the month, Knight Frank released two industry reports; the Prime Global Cities Index – Q2’2022 Report and the Kenya Market Update H1’2022 Report highlighting that the average selling price for prime housing units increased by 1.2% in the period under review. In the retail sector, Naivas founders, the family of Peter Mukuha Kago, sold an estimated 8.5% stake worth Kshs 3.8 bn to an undisclosed consortium of international investors. For the Real Estate Investment Trusts, listed firm GRIT Real Estate completed the purchase of an extra 8.7% stake worth Kshs 2.3 bn in Gateway Real Estate Africa Ltd (GREA). In the Nairobi stock exchange, ILAM Fahari I-REIT closed the month trading at an average price of Kshs 6.5 per share;
Investment Updates:
- Weekly Rates:
- Cytonn Money Market Fund closed the week at a yield of 10.57%. To invest, dial *809# or download the Cytonn App from Google Playstore here or from the Appstore here;
- Cytonn High Yield Fund closed the week at a yield of 13.91% p.a. To invest, email us at sales@cytonn.com and to withdraw the interest, dial *809# or download the Cytonn App from Google Playstore here or from the Appstore here;
- We continue to offer Wealth Management Training every Wednesday and every third Saturday of the month, from 9:00 am to 11:00 am, through our Cytonn Foundation. The training aims to grow financial literacy among the general public. To register for any of our Wealth Management Trainings, click here;
- If interested in our Private Wealth Management Training for your employees or investment group, please get in touch with us through wmt@cytonn.com;
- Any CHYS and CPN investors still looking to convert are welcome to consider one of the five projects currently available for assignment, click here for the latest term sheet;
- Cytonn Insurance Agency acts as an intermediary for those looking to secure their assets and loved ones’ future through insurance namely; Motor, Medical, Life, Property, WIBA, Credit and Fire and Burglary insurance covers. For assistance, get in touch with us through insuranceagency@cytonn.com;
- Cytonnaire Savings and Credit Co-operative Society Limited (SACCO) provides a savings and investments avenue to help you in your financial planning journey. To enjoy competitive investment returns, kindly get in touch with us through clientservices@cytonn.com;
Real Estate Updates:
- For an exclusive tour of Cytonn’s real estate developments, visit: Sharp Investor's Tour, and for more information, email us at sales@cytonn.com;
- Phase 3 of The Alma is now ready for occupation and the show house is open daily. To rent please email properties@cytonn.com;
- We have 8 investment-ready projects, offering attractive development and buyer targeted returns; See further details here: Summary of Investment-ready Projects;
- For Third Party Real Estate Consultancy Services, email us at rdo@cytonn.com;
- For recent news about the group, see our news section here;
Hospitality Updates:
- We currently have promotions for Staycations. Visit cysuites.com/offers for details or email us at sales@cysuites.com;
Money Markets, T-Bills Primary Auction:
During the month of August, T-bills remained undersubscribed, with the overall subscription rate declining to 73.2%, from 97.4% recorded in July 2022 partly driven by the uncertainty which surrounded the August 2022 general elections. The overall subscription rates for the 91-day paper increased to 280.6% from 278.1% while that of the 182-day and 364-day papers declined to 40.4% and 22.9% from 74.8% and 47.6% recorded in July 2022, respectively. The average yields on the government papers recorded mixed performance with the 182-day and 91-day papers increasing by 16.3 bps and 36.6 bps to 9.4% and 8.6%, respectively, while the average yield on the 364-day paper declined by 5.8 bps to 9.9%. For the month of August, the government continued to reject expensive bids, accepting a total of Kshs 81.8 bn out of the Kshs 87.8 bn worth of bids received, translating to an acceptance rate of 93.1%.
During the week, T-bills were oversubscribed, with the overall subscription rate coming in at 128.8%, an increase from the 80.9% recorded the previous week. The increase in the subscription rate was partly attributable to the eased liquidity in the money market with the average interbank rates decreasing to 5.0% from 5.1% recorded the previous week. The shorter 91-day paper remained oversubscribed for the tenth consecutive time, with the paper receiving bids worth Kshs 16.3 bn against the offered Kshs 4.0 bn, translating to a subscription rate of 406.6%, up from the 270.4% recorded the previous week. The subscription rate for the 182-day paper also increased to 112.3% from 41.6% while the 364-day paper declined to 34.1% from 44.4%, recorded the previous week. The yields on the government papers recorded mixed performance, with the yields on the 182-day and 91-day papers increasing by 4.4 bps and 9.3 bps to 9.6% and 8.9%, respectively, while the yields on the 364-day paper declined by 3.4 bps to 9.9%. The government continued to reject expensive bids, accepting a total of Kshs 21.1 bn worth of bids out of the Kshs 30.9 bn worth of bids received, translating to an acceptance rate of 68.4%.
The August 2022 bonds remained undersubscribed, receiving bids worth Kshs 49.1 bn against the offered Kshs 50.0 bn, translating to a subscription rate of 98.3%. The performance was partly attributable to the increased perceived risks arising from increasing inflationary pressures, the August general elections and local currency depreciation. The table below provides more details on the bonds issued during the month of August:
|
Issue Date |
Bond Auctioned |
Effective Tenor to Maturity (Years) |
Coupon |
Amount offered (Kshs bn) |
Actual Amount Raised (Kshs bn) |
Total bids received |
Average Accepted Yield |
Subscription Rate |
Acceptance Rate |
|
22/08/2022 |
FXD1/2022/03-Re-opened |
2.7 |
11.8% |
50.0 |
38.5 |
49.1 |
12.4% |
98.3% |
78.4% |
|
22/08/2022 |
FXD2/2019/10-Re-opened |
6.7 |
12.3% |
13.9% |
|||||
|
22/08/2022 |
FXD1/2021/20-Re-opened |
19.1 |
13.4% |
14.0% |
|||||
|
August 2022 Average |
|
9.5 |
12.5% |
50.0 |
38.5 |
49.1 |
13.4% |
98.3% |
78.4% |
|
July 2022 Average |
|
16.0 |
12.8% |
30.0 |
7.9 |
8.5 |
13.6% |
29.3% |
94.0% |
Secondary Bond Market:
The yield on the government securities increased during the month compared to the same period in 2021 as a result of the relatively increased uncertainty in the economy. The chart below shows the yield curve movement during the period:
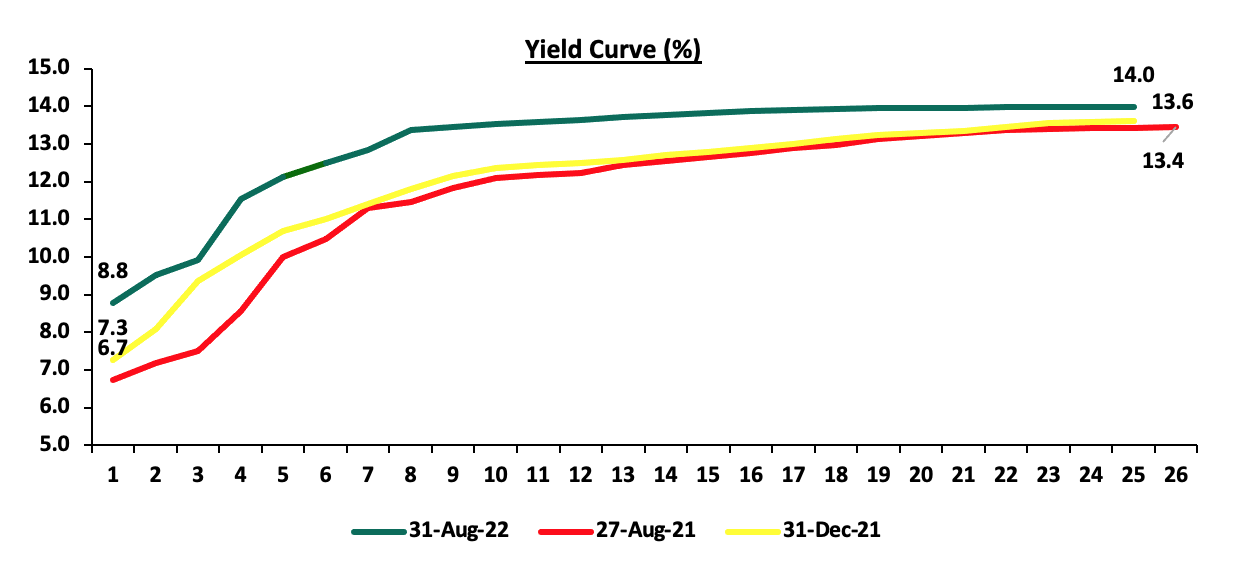
The secondary bond turnover increased by 12.2% to Kshs 68.4 bn, from Kshs 60.9 bn recorded in July 2022, pointing towards increased activity by commercial banks in the secondary bonds market. On a year on year basis, the bonds turnover declined by 7.5% to Kshs 804.1 bn, from Kshs 869.5 bn worth of treasury bonds transacted over a similar period last year.
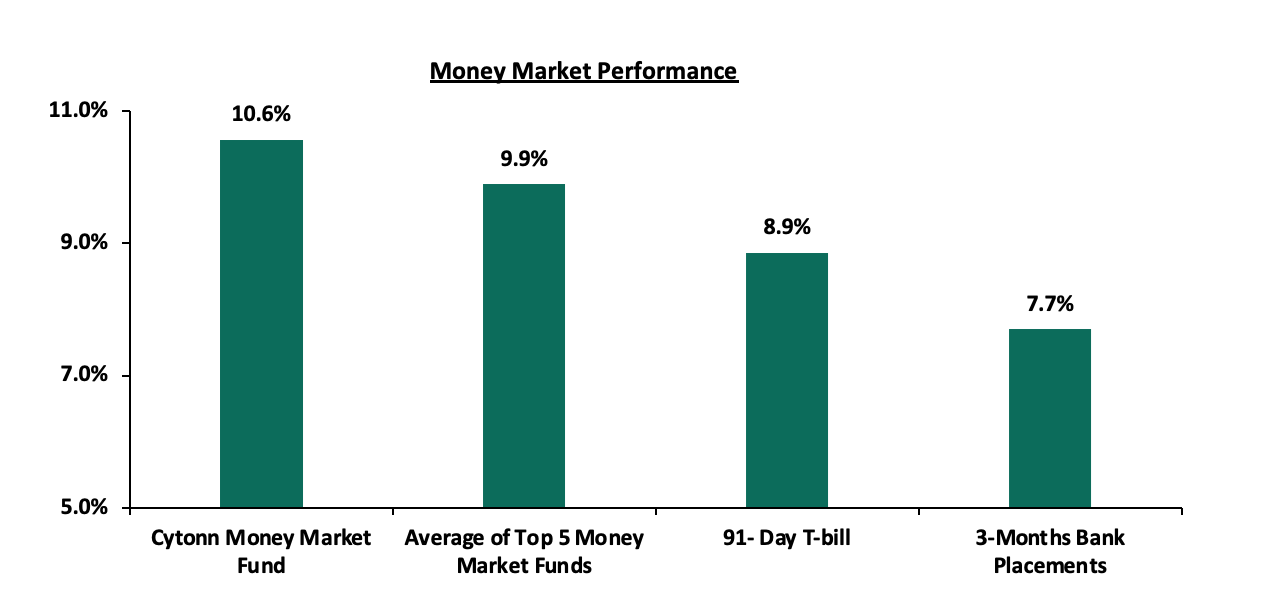
In the money markets, 3-month bank placements ended the week at 7.7% (based on what we have been offered by various banks), while the yield on the 91-day T-bill increased by 9.3 bps to 8.9%. The average yield on the Top 5 Money Market Funds and Cytonn Money Market Fund remained relatively unchanged at 9.8% and 10.6%, respectively, as was recorded last week.
The table below shows the Money Market Fund Yields for Kenyan Fund Managers as published on 2nd September 2022:
|
Money Market Fund Yield for Fund Managers as published on 2nd September 2022 |
||
|
Rank |
Fund Manager |
Effective Annual Rate |
|
1 |
Cytonn Money Market Fund |
10.6% |
|
2 |
Zimele Money Market Fund |
9.9% |
|
3 |
Old Mutual Money Market Fund |
9.8% |
|
4 |
Dry Associates Money Market Fund |
9.6% |
|
5 |
Sanlam Money Market Fund |
9.6% |
|
6 |
Nabo Africa Money Market Fund |
9.5% |
|
7 |
NCBA Money Market Fund |
9.5% |
|
8 |
Madison Money Market Fund |
9.4% |
|
9 |
Apollo Money Market Fund |
9.3% |
|
10 |
Co-op Money Market Fund |
9.2% |
|
11 |
CIC Money Market Fund |
9.0% |
|
12 |
GenCap Hela Imara Money Market Fund |
8.8% |
|
13 |
ICEA Lion Money Market Fund |
8.8% |
|
14 |
Orient Kasha Money Market Fund |
8.5% |
|
15 |
British-American Money Market Fund |
7.5% |
|
16 |
AA Kenya Shillings Fund |
5.1% |
Source: Business Daily
Liquidity:
Liquidity in the money markets eased in the month of August 2022, with the average interbank rate declining to 5.3%, from 5.5%, recorded in July 2022. During the week, liquidity in the money markets also eased, with the average interbank rate decreasing to 5.0% from 5.1% recorded the previous week, partly attributable to government payments that offset tax remittances. The average interbank volumes traded decreased by 31.7% to Kshs 15.0 bn from Kshs 22.0 bn recorded the previous week.
Kenya Eurobonds:
During the month, the yields on the Eurobonds were on a downward trajectory despite the prevailing uncertainties surrounding the increasing inflationary pressures, local currency depreciation as well as the ongoing presidential poll petition. The yield on the 12-year Eurobond issued in 2021 was the largest decliner having declined by 1.8% points to 11.5% from 13.3%, recorded in July 2022.
During the week, the yields on Eurobonds recorded mixed performance with the yield on the 10-year Eurobond issued in 2014 recording the highest increase having increased by 0.9% point to 15.2%, from 14.3%, recorded the previous week. The table below shows the summary of the performance of the Kenyan Eurobonds as of 1st September 2022;
|
Kenya Eurobond Performance |
||||||
|
|
2014 |
2018 |
2019 |
2021 |
||
|
Date |
10-year issue |
10-year issue |
30-year issue |
7-year issue |
12-year issue |
12-year issue |
|
03-Jan-22 |
4.4% |
8.1% |
8.1% |
5.6% |
6.7% |
6.6% |
|
29-Jul-22 |
16.2% |
14.9% |
13.3% |
16.3% |
14.0% |
13.3% |
|
26-Aug-22 |
14.3% |
12.7% |
11.9% |
14.0% |
12.7% |
11.6% |
|
29-Aug-22 |
14.2% |
12.8% |
12.0% |
14.2% |
12.7% |
11.1% |
|
30-Aug-22 |
14.6% |
12.9% |
12.0% |
14.2% |
12.8% |
11.4% |
|
31-Aug-22 |
15.3% |
13.2% |
12.4% |
14.5% |
13.1% |
11.5% |
|
01-Sep-22 |
15.2% |
13.3% |
12.5% |
14.5% |
13.2% |
11.6% |
|
Weekly Change |
0.9% |
0.6% |
0.6% |
0.5% |
0.5% |
0.0% |
|
MTM Change |
(1.0%) |
(1.7%) |
(0.8%) |
(1.8%) |
(0.9%) |
(1.8%) |
|
YTD Change |
10.8% |
5.3% |
4.4% |
8.9% |
6.5% |
5.0% |
Source: Central Bank of Kenya (CBK)
Kenya Shilling:
During the month, the Kenya Shilling depreciated by 1.0% against the US Dollar, to close the month at Kshs 120.0, from Kshs 118.8 recorded at the end of August 2022, driven by the increased dollar demand from oil and merchandise importers on the back of increased global oil prices against slower recovery in exports against slower supply of hard currency.
During the week, the Kenyan shilling continued to depreciate against the US dollar to close the week at Kshs 120.1, a 0.2% depreciation from Kshs 119.9 recorded the previous week, partly attributable to increased dollar demand from the oil and energy sectors against a slower supply of hard currency. On a year to date basis, the shilling has depreciated by 6.2% against the dollar, higher than the 3.6% depreciation recorded in 2021. We expect the shilling to remain under pressure in 2022 as a result of:
- High global crude oil prices on the back of persistent supply chain bottlenecks coupled with high demand as most economies gradually recover,
- An ever-present current account deficit due to an imbalance between imports and exports, with Kenya’s current account deficit estimated at 5.3% of GDP in the 12 months to May 2022 compared to the 5.0% within a similar period in 2021, and,
- The aggressively growing government debt, with Kenya’s public debt having increased at a 10-year CAGR of 18.2% to Kshs 8.6 tn in May 2022, from Kshs 1.6 tn in May 2012 thus putting pressure on forex reserves to service some of the public debt. It is worth noting that the average GDP growth over the same period has been 3.9%, indicating that the increase in debt is not translating into GDP growth.
The shilling is however expected to be supported by:
- Sufficient Forex reserves currently at USD 7.4 bn (equivalent to 4.2-months of import cover), which is above the statutory requirement of maintaining at least 4.0-months of import cover, and,
- Sufficient diaspora remittances evidenced by a 6.6% increase to USD 3,995.0 mn cumulative remittances as of July 2022, compared to USD 3,442.0 mn recorded over the same period in 2021, which has continued to cushion the shilling against a faster depreciation.
August 2022 Inflation
In line with our expectations, the y/y inflation for the month of August 2022 increased to 8.5%, from the 8.3% recorded in July 2022 mainly driven by the elevated food and fuel prices. The table below shows a summary of both the year on year and month on month commodity groups’ performance:
|
Major Inflation Changes – August 2022 |
|||
|
Broad Commodity Group |
Price change m/m (August-22/July-22) |
Price change y/y (August-22/ August-21 |
Reason |
|
Food & Non-Alcoholic Beverages |
0.5% |
15.3% |
The m/m increase was mainly contributed by increase in prices of maize flour-loose, sugar and mangoes. The increase was however mitigated by a decline in prices of carrots and onion-leeks |
|
Housing, Water, Electricity, Gas and other Fuel |
0.3% |
5.6% |
The m/m increase was as a result of increase in prices of house rent-single rooms among other things |
|
Transport Cost |
0.3% |
7.6% |
The m/m increase was as a result of high fuel prices of petrol and diesel at Kshs 150.1 per litre and Kshs 131.0 per litre, respectively |
|
Overall Inflation |
0.4% |
8.5% |
The m/m increase was driven by a 0.5% increase in food & non-alcoholic beverages coupled with a 0.3% increase in housing, water, electricity, gas and other fuel |
Going forward, we expect inflationary pressures to remain elevated due to high fuel and food prices as focus remains primarily on the inflated import bill. Additionally, the move by the Kenya Revenue Authority (KRA) to adjust for inflation the excise duty on select goods is expected to further increase the cost of goods as the burden will be passed on to the consumer. The adjusted rates which will take effect on 1st October 2022 will result to a 6.3% increase in the price of select goods such as fuel and beer, in line with the average annual inflation rate for FY’2021/2022. However, we expect the Monetary Policy Committee’s fiscal stance of maintaining the Central Bank Rate at 7.5% rather than reducing it to continue anchoring the inflation rate. In our view, Kenya’s inflation rate stability is largely pegged on how soon the global market stabilizes.
Monthly Highlights:
- Stanbic Bank released its monthly Purchasing Manager’s Index (PMI) highlighting that the index for the month of July 2022 declined for the fourth consecutive time to 46.3, from 46.8 recorded in June 2022 pointing towards a further deterioration in the business environment in the Kenyan private sector. For more information, see our Cytonn Weekly #31/2022,and,
- The National Treasury gazetted the revenue and net expenditures for the first month of FY’2022/2023, ending 31st July 2022 indicating that the total Revenue collected amounted to Kshs 133.2 bn equivalent to 6.2% of the original estimates of Kshs 2,141.6 bn for FY’2022/2023. For more information, see our Cytonn Weekly #33/2022.
Rates in the Fixed Income market have remained relatively high due to the relatively heightened perceived risk by investors. As it is still early in the financial year, the government is 25.1% behind its prorated borrowing target of Kshs 100.7 bn having borrowed Kshs 75.4 bn of the Kshs 581.7 bn borrowing target for the FY’2022/2023. We expect sustained gradual economic recovery as evidenced by the revenue collections of Kshs 2.0 tn in the FY’2021/2022, equivalent to a 2.8% outperformance. Despite the performance, we believe that the projected budget deficit of 6.2% for the FY’2022/2023 is relatively ambitious given the downside risks of a deteriorating business environment occasioned by high inflationary pressures. We however expect the support from the IMF and World Bank to finance some of the government projects and thus help maintain a stable interest rate environment since the government is not desperate for cash. Owing to this, our view is that investors should be biased towards short-term fixed-income securities to reduce duration risk.
Markets Performance
During the month of August, the equities market recorded mixed performance, with NASI and NSE 25 declining by 2.5% and 0.6%, respectively while NSE 20 gained by 2.9%. The equities market performance was driven by losses recorded by large cap stocks such as Safaricom, EABL and KCB Group which declined by 6.7%, 2.7% and 0.7%, respectively. The losses were however mitigated by gains recorded by other large cap stocks such as NCBA, ABSA, Bamburi and Co-operative Bank of 16.6%, 7.2%, 4.7% and 4.2%, respectively.
During the week, the equities market was on an upward trajectory with NASI and NSE 25 both gaining by 0.1%, while NSE 20 gained by 0.8%, taking their YTD performance to losses of 17.4%, 7.9% and 13.0%, for NASI, NSE 20 and NSE 25, respectively. The equities market performance was mainly driven by gains recorded by large-cap stocks such as NCBA, ABSA, Co-operative Bank and BAT of 5.8%, 2.6%, 2.5% and 2.2%, respectively. The gains were however weighed down by losses recorded by Diamond Trust Bank (DTB-K), Bamburi and Equity Group which declined by 2.9%, 2.6% and 2.1%, respectively.
Equities turnover declined by 33.9% during the month to USD 44.7 mn, from USD 67.6 mn recorded in July 2022. Additionally, foreign investors remained net sellers, with a net selling position of USD 13.9 mn, compared to July’s net selling position of USD 25.1 mn.
During the week, equities turnover increased by 134.8% to USD 15.1 mn, from USD 6.3 mn recorded the previous week, taking the YTD turnover to USD 586.8 mn. Foreign investors remained net sellers, with a net selling position of USD 6.0 mn, from a net selling position of USD 2.0 mn recorded the previous week, taking the YTD net selling position to USD 147.3 mn.
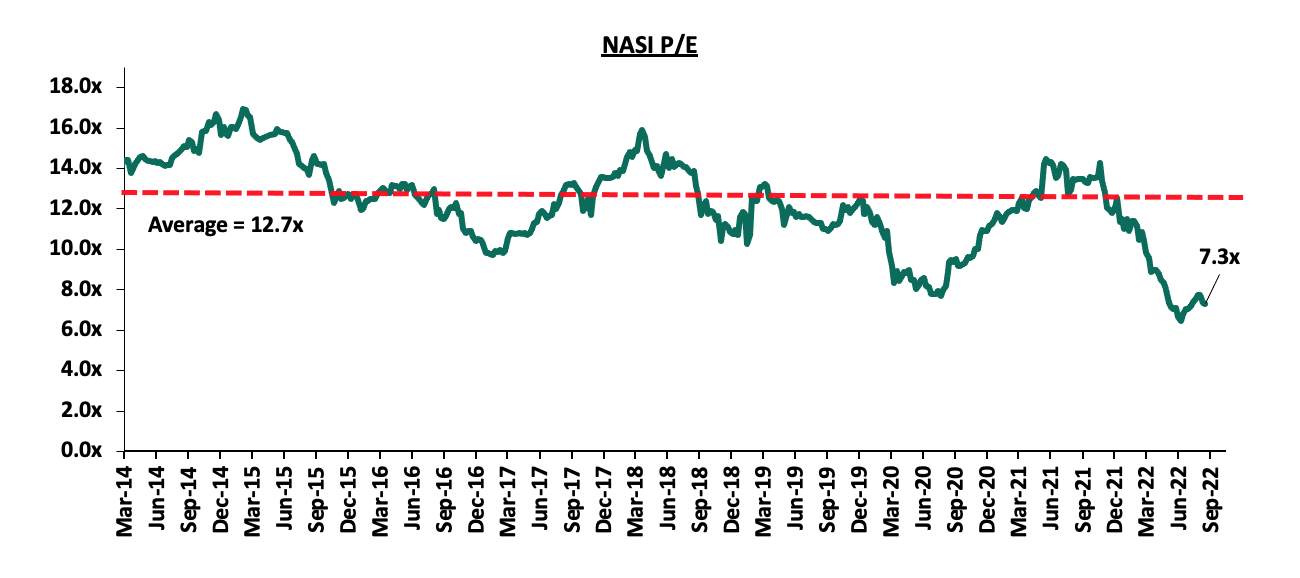
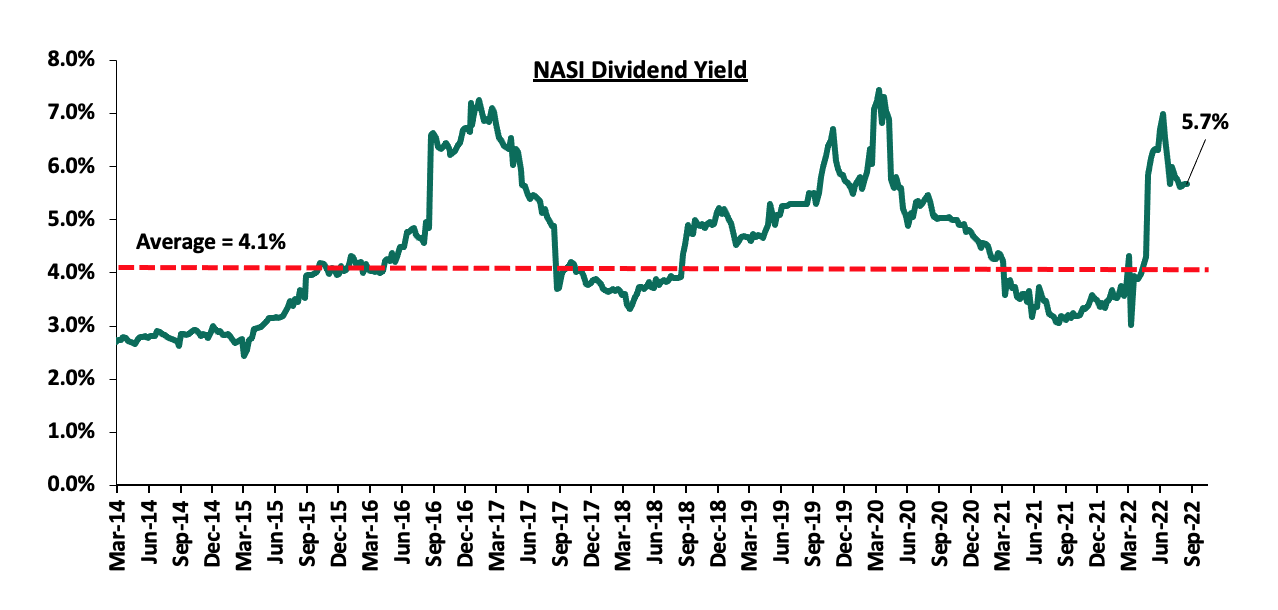
The market is currently trading at a price to earnings ratio (P/E) of 7.3x, 42.5% below the historical average of 12.7x, and a dividend yield of 5.7%, 1.6% points above the historical average of 4.1%. Key to note, NASI’s PEG ratio currently stands at 0.9x, an indication that the market is undervalued relative to its future growth. A PEG ratio greater than 1.0x indicates the market may be overvalued while a PEG ratio less than 1.0x indicates that the market is undervalued. The charts below indicate the historical P/E and dividend yields of the market:
Monthly highlights:
- The Insurance Regulatory Authority of Kenya (IRA) released the Quarterly Insurance Industry Report for the period ending 31st March 2022 highlighting that the industry’s gross premiums rose by 11.6% to Kshs 88.4 bn, from Kshs 79.3 bn recorded in Q1’2021, with the general insurance business contributing 61.0% of the industry’s premium income, a 0.2% points decline from the 61.2% contribution witnessed in Q1’2021. For more information, please see our Cytonn Weekly #31/2022, and,
- KCB Group announced that it had entered into a final agreement with shareholders of Trust Merchant Bank (TMB) to acquire an 85.0% stake in the Democratic Republic of Congo (DRC)- based lender, with an option to acquire the remaining stake after two years. For more information please see our Cytonn Weekly #31/2022.
Weekly Highlights:
- KCB Group’s IFC Loan Facility
During the week, the International Finance Corporation (IFC) disclosed that it would extend USD 150.0 mn (Kshs 18.0 bn) to KCB Group in form of a senior unsecured loan with a maturity of 7-years and a grace period of 2-years. The credit facility is aimed at supporting the growth of the bank’s climate finance portfolio which entails clients in sectors such as manufacturing, real estate and agriculture. Notably, this is the third facility from IFC following a 10-year USD 150.0 mn and a 7-year USD 75.0 mn extended to KCB Group in 2020 and 2018, respectively to scale-up lending to Micro, Small and Medium Enterprises (MSME). This makes KCB Group the biggest borrower from IFC among tier one Kenyan lenders with a cumulative amount of USD 375.0 mn (Kshs 45.0 bn).
Upon disbursement, the credit facility is expected to provide the Group with a strong financial capability to lend to MSMES and support climate finance transactions. As at H1’2022, KCB Group’s green lending as a percentage of its loan portfolio stood at 11.7%, with the Group keen to align to global best practices and Environment Social and Corporate Governance standards.
Going forward, we expect the Kenyan Banking sector to continue incorporating climate-related risk management as the Central Bank of Kenya (CBK) continues to enforce the Guidance on Climate-Related Risk Management rolled out in 2021. The guidelines are aimed at guiding financial institutions to integrate the risks and opportunities arising from climate change in their risk management, strategy and governance structure. As such, we expect the Kenyan financial institutions to channel their long term financing to companies and sectors whose activities do not pose an environmental risk.
- Earnings Release
During the week, HF Group released their H1’2022 financial results. Below is a summary of their performance;
|
Balance Sheet Items (Kshs bns) |
H1’2021 |
H1’2022 |
y/y change |
|||||||||||||||
|
Net loans |
35.3 |
34.9 |
(1.1%) |
|||||||||||||||
|
Government Securities |
4.9 |
9.2 |
87.8% |
|||||||||||||||
|
Total Assets |
53.0 |
55.7 |
5.2% |
|||||||||||||||
|
Customer Deposits |
37.8 |
39.1 |
3.4% |
|||||||||||||||
|
Deposits Per Branch |
1.7 |
1.8 |
3.4% |
|||||||||||||||
|
Total Liabilities |
44.8 |
46.8 |
4.6% |
|||||||||||||||
|
Shareholder's Funds |
8.2 |
8.0 |
(3.1%) |
|||||||||||||||
|
Balance Sheet Ratios |
H1’2021 |
H1’2022 |
y/y % pts change |
|||||||||||||||
|
Loan to deposit ratio |
93.3% |
89.2% |
(4.1%) |
|||||||||||||||
|
Return on Average Equity |
(21.2%) |
(2.4%) |
18.8% |
|||||||||||||||
|
Return on Average Assets |
(3.3%) |
(0.4%) |
2.9% |
|||||||||||||||
|
Income Statement (Kshs bns) |
H1’2021 |
H1’2022 |
y/y change |
|||||||||||||||
|
Net Interest Income |
0.9 |
1.0 |
11.4% |
|||||||||||||||
|
Net non-Interest Income |
0.3 |
0.5 |
53.2% |
|||||||||||||||
|
Total Operating income |
1.2 |
1.5 |
22.3% |
|||||||||||||||
|
Loan Loss provision |
(0.06) |
0.10 |
76.0% |
|||||||||||||||
|
Total Operating expenses |
(1.6) |
(1.5) |
(6.5%) |
|||||||||||||||
|
Profit before tax |
(0.3) |
0.1 |
118.4% |
|||||||||||||||
|
Profit after tax |
(0.3) |
0.1 |
114.4% |
|||||||||||||||
|
Core EPS |
(0.9) |
0.1 |
114.4% |
|||||||||||||||
|
Income Statement Ratios |
H1’2021 |
H1’2022f |
y/y % pts change |
|||||||||||||||
|
Yield from interest-earning assets |
9.1% |
9.3% |
0.2% |
|||||||||||||||
|
Cost of funding |
4.8% |
4.8% |
(0.0%) |
|||||||||||||||
|
Net Interest Spread |
4.3% |
4.5% |
0.2% |
|||||||||||||||
|
Net Interest Margin |
4.2% |
4.5% |
0.3% |
|||||||||||||||
|
Cost of Risk |
4.7% |
6.7% |
2.0% |
|||||||||||||||
|
Net Interest Income as % of operating income |
73.9% |
67.3% |
(6.6%) |
|||||||||||||||
|
Non-Funded Income as a % of operating income |
26.1% |
32.7% |
6.6% |
|||||||||||||||
|
Cost to Income Ratio (with LLP) |
125.5% |
95.9% |
(29.6%) |
|||||||||||||||
|
Capital Adequacy Ratios |
H1’2021 |
H1’2022 |
||||||||||||||||
|
Core Capital/Total Liabilities |
10.1% |
7.8% |
||||||||||||||||
|
Minimum Statutory ratio |
8.0% |
8.0% |
||||||||||||||||
|
Excess |
2.1% |
(0.2%) |
||||||||||||||||
|
Core Capital/Total Risk Weighted Assets |
8.8% |
8.1% |
||||||||||||||||
|
Minimum Statutory ratio |
10.5% |
10.5% |
||||||||||||||||
|
Excess |
(1.7%) |
(2.4%) |
||||||||||||||||
|
Total Capital/Total Risk Weighted Assets |
12.3% |
12.0% |
||||||||||||||||
|
Minimum Statutory ratio |
14.5% |
14.5% |
||||||||||||||||
|
Excess |
(2.2%) |
(2.5%) |
||||||||||||||||
|
Liquidity Ratio |
22.2% |
26.0% |
||||||||||||||||
|
Minimum Statutory ratio |
20.0% |
20.0% |
||||||||||||||||
|
Excess |
2.2% |
6.0% |
||||||||||||||||
|
Adjusted core capital/ total deposit liabilities |
10.5% |
7.9% |
||||||||||||||||
|
Adjusted core capital/ total risk weighted assets |
9.1% |
8.2% |
||||||||||||||||
|
Adjusted total capital/ total risk weighted assets |
12.6% |
12.1% |
||||||||||||||||
Key take-outs from the earnings release include;
- Earnings Growth - Core earnings per share increased by 114.4 % to Kshs 0.1 in H1’2022, up from the loss per share of Kshs 0.9 recorded in H1’2021, attributed to a 22.3% increase in total operating income to Kshs 1.5 bn, from Kshs 1.2 bn in H1’2021, coupled with a 6.5% decline in total operating expenses to Kshs 1.5 bn, from Kshs 1.6 bn in H1’2021,
- Improved Asset Quality - The bank experienced an improvement in asset quality as the NPL ratio improved to 20.1% from the 22.6% recorded in H1’2021, following the faster 11.1% decline in NPLs that outpaced the 0.1% decline in gross loans which came in at Kshs 41.3 bn in H1’2022, from Kshs 41.4 bn recorded in H1’2021. Despite the improved asset quality during the period, HF Group’s NPL ratio is still higher than the sector’s average of 14.7% as of June 2022, an indication that the group needs to continuously enhance its credit assessment in order to bring down this high NPL Ratio,
- Improved Efficiency- The Bank’s Cost to Income Ratio (CIR) improved to 95.9%, from 125.5% in H1’2021, attributable to the 6.5% decline in total operating expenses to Kshs 1.5 bn in H1’2022, from Kshs 1.6 bn recorded in H1’2021. Key to note, this is the second consecutive quarter that HF Group’s total operating expenses have been lower than its total operating income – a Cost to Income ratio of below 100.0%. However, the ratio is still high compared to the listed banking sector average, which stood at 53.1% as of Q1’2022. Without LLP, the cost to income ratio also improved to 89.2%, from 120.9% in H1’2021., and,
- HF remains undercapitalised - The Bank’s capital adequacy levels fall below the regulatory limits as evidenced by Core Capital/ Total Liabilities, Core Capital/Total Risk Weighted Assets, Total Capital/ Total Risk Weighted Assets ratios which are short of the regulatory limits by 0.2% points, 2.4% points and 2.5% points, respectively, an indication that the Bank needs to beef up their capital reserves in order to be able to withstand any financial downturn and other unforeseen losses.
For a comprehensive analysis, please see our HF Group’s H1’2022 Earnings Note
Asset Quality
The table below is a summary of the asset quality for the listed banks
</thead.
|
Bank |
H1'2021 NPL Ratio** |
H1'2022 NPL Ratio* |
H1'2021 NPL Coverage** |
H1'2022 NPL Coverage* |
% point change in NPL Ratio |
% point change in NPL Coverage |
|
ABSA Bank Kenya |
7.9% |
7.1% |
70.9% |
78.5% |
(0.8%) |
7.6% |
|
Equity Group |
11.4% |
8.8% |
63.2% |
64.1% |
(2.6%) |
0.9% |
|
I&M Holdings |
10.4% |
9.4% |
67.2% |
59.2% |
(1.0%) |
(8.0%) |
|
Stanbic Bank |
9.5% |
10.4% |
51.2% |
56.0% |
0.9% |
4.8% |
|
Diamond Trust Bank |
10.4% |
12.8% |
41.8% |
44.2% |
2.4% |
2.4% |
|
NCBA Group |
16.7% |
13.5% |
68.0% |
62.8% |
(3.2%) |
(5.2%) |
|
Co-operative Bank |
15.2% |
14.1% |
63.5% |
65.8% |
(1.1%) |
2.3% |
|
SCBK |
15.4% |
15.4% |
81.4% |
83.9% |
0.1% |
2.5% |
|
HF Group |
22.6% |
20.1% |
65.1% |
77.6% |
(2.5%) |
12.5% |
|
KCB Group |
14.4% |
21.4% |
61.6% |
45.8% |
7.0% |
(15.8%) |
|
Mkt Weighted Average |
12.7% |
13.0% |
64.5% |
62.4% |
0.3% |
(2.1%) |
|
*Market cap weighted as at 02/09/2022 **Market cap weighted as at 09/09/2021 |
||||||
Key take-outs from the table include;
- KCB Group had the highest NPL Ratio jump by 7.0% points to 21.4%, from 14.4% recorded in H1’2021, which was 6.7% points higher than industry average of 0.3% points, mainly attributable to KCB Kenya's deterioration in its NPL ratio to 22.8% from 11.9% in H1'2021, following reclassification of 9 large accounts to non-performing loans in the Kenya market. Additionally, the Group has a 50.1% exposure to corporate loans, which have been impacted by delayed recovery from COVID-19, increased inflationary pressures and pending government bills,
- Asset quality for the listed banks deteriorated during the period, with the weighted average NPL ratio increasing by 0.3% points to a market cap weighted average of 13.0%, from an average of 12.7% for the listed banking sector in H1’2021, and,
- NPL Coverage for the listed banks declined to a market cap weighted average of 62.4% in H1’2022, from 64.5% recorded in H1’2021, as the banks reduced their provisioning following reduced risks with some sectors such as tourism, agriculture and manufacturing continue to record gradual recovery.
Summary Performance
The table below highlights the performance of the listed banks, showing the performance using several metrics, and the key take-outs of the performance;
|
Cytonn Investments Summary H1’2022 - Listed Banks Performance Summary |
|||||||||||||
|
Bank |
Core EPS Growth |
Interest Income Growth |
Interest Expense Growth |
Net Interest Income Growth |
Net Interest Margin |
Non-Funded Income Growth |
NFI to Total Operating Income |
Growth in Total Fees & Commissions |
Deposit Growth |
Growth in Government Securities |
Loan to Deposit Ratio |
Loan Growth |
Return on Average Equity |
|
HF Group |
114.4% |
4.6% |
(1.3%) |
11.4% |
4.5% |
53.2% |
32.7% |
13.2% |
3.4% |
87.8% |
89.2% |
(1.1%) |
(2.4%) |
|
NCBA |
66.9% |
10.9% |
12.0% |
10.2% |
6.0% |
32.5% |
48.9% |
(2.2%) |
7.1% |
17.0% |
53.5% |
4.5% |
17.3% |
|
Co-op |
55.7% |
10.0% |
5.5% |
11.8% |
8.4% |
28.8% |
38.7% |
36.8% |
3.8% |
0.7% |
78.0% |
9.6% |
21.8% |
|
Stanbic |
36.9% |
14.8% |
(2.2%) |
20.9% |
5.4% |
25.1% |
45.1% |
11.1% |
(0.7%) |
(36.1%) |
94.5% |
17.5% |
20.1% |
|
Equity |
36.1% |
28.6% |
30.9% |
27.8% |
7.3% |
24.4% |
39.4% |
28.5% |
18.5% |
16.9% |
67.0% |
28.9% |
31.9% |
|
KCB Group |
28.4% |
15.7% |
30.3% |
11.5% |
8.5% |
29.9% |
32.1% |
24.4% |
15.6% |
30.4% |
80.4% |
20.3% |
23.2% |
|
DTB-K |
25.6% |
12.5% |
11.4% |
13.3% |
5.2% |
17.8% |
26.0% |
9.4% |
10.4% |
(4.3%) |
67.4% |
14.3% |
7.8% |
|
I&M |
15.9% |
19.3% |
20.2% |
18.7% |
6.4% |
28.2% |
32.5% |
30.1% |
13.2% |
17.2% |
73.8% |
13.0% |
13.3% |
|
ABSA |
13.0% |
21.3% |
25.1% |
20.3% |
7.6% |
10.8% |
31.0% |
(10.0%) |
6.7% |
(0.4%) |
92.9% |
19.5% |
21.4% |
|
SCBK |
10.9% |
4.4% |
(21.4%) |
9.9% |
6.4% |
10.9% |
35.6% |
(6.2%) |
3.1% |
2.1% |
44.8% |
(1.3%) |
17.7% |
|
H1'22 Mkt Weighted Average* |
33.8% |
18.0% |
18.5% |
17.8% |
7.3% |
24.3% |
37.1% |
18.0% |
11.2% |
11.3% |
72.9% |
17.8% |
23.4% |
|
H1'21 Mkt Weighted Average** |
136.0% |
15.0% |
10.8% |
17.6% |
7.4% |
19.2% |
35.6% |
16.6% |
18.4% |
12.4% |
68.8% |
11.7% |
16.9% |
|
*Market cap weighted as at 02/09/2022 **Market cap weighted as at 09/09/2021 |
|||||||||||||
Key takeaways from the table above include:
- The listed banks recorded a 33.8% weighted average growth in core Earnings per Share (EPS), compared to a weighted average increase of 136.0% in H1’2021 for the listed banking sector,
- The Banks have recorded a weighted average deposit growth of 11.2%, slower than the 18.4% growth recorded in H1’2021, an indication of reduced investment risk in the business environment,
- Interest income grew by 18.0%, compared to a growth of 15.0% recorded in H1’2021 while the weighted average Yield on Interest Earning Assets (YIEA) declined to 9.8%, from the 9.9% recorded in H1’2021 for the listed banking sector. On the other hand, the Net Interest Margin (NIM) now stands at 7.3%, 0.1% points lower than the 7.4% recorded in H1’2021 for the whole listed banking sector, and,
- Non-Funded Income grew by 24.3%, compared to the 19.2% growth recorded in H1’2022.
We shall be releasing the Cytonn H1’2022 Listed Banking sector report on 11th September 2022.
Universe of coverage:
|
Company |
Price as at 26/08/2022 |
Price as at 02/09/2022 |
w/w change |
m/m change |
YTD Change |
Year Open 2022 |
Target Price* |
Dividend Yield |
Upside/ Downside** |
P/TBv Multiple |
Recommendation |
|
Jubilee |
258.0 |
240.3 |
(6.9%) |
3.7% |
(24.2%) |
316.8 |
379.4 |
0.4% |
58.3% |
0.4x |
Buy |
|
Kenya Re |
2.1 |
2.1 |
0.5% |
4.5% |
(8.3%) |
2.3 |
3.2 |
4.8% |
56.1% |
0.2x |
Buy |
|
Sanlam |
11.5 |
10.6 |
(8.3%) |
(4.2%) |
(8.7%) |
11.6 |
15.9 |
0.0% |
50.7% |
1.1x |
Buy |
|
I&M Group*** |
17.2 |
17.0 |
(0.9%) |
0.9% |
(20.6%) |
21.4 |
22.3 |
8.8% |
40.0% |
0.5x |
Buy |
|
KCB Group*** |
41.0 |
40.9 |
(0.2%) |
(0.5%) |
(10.3%) |
45.6 |
52.2 |
7.3% |
35.1% |
0.8x |
Buy |
|
DTB-K*** |
51.5 |
50.0 |
(2.9%) |
5.1% |
(16.0%) |
59.5 |
62.4 |
6.0% |
30.8% |
0.2x |
Buy |
|
Co-op Bank*** |
12.1 |
12.4 |
2.5% |
1.3% |
(5.0%) |
13.0 |
14.1 |
8.1% |
22.3% |
0.9x |
Buy |
|
Equity *** |
49.2 |
48.2 |
(2.1%) |
2.5% |
(8.7%) |
52.8 |
54.4 |
6.2% |
19.2% |
1.2x |
Accumulate |
|
Britam |
6.4 |
6.5 |
0.6% |
5.9% |
(14.3%) |
7.6 |
7.7 |
0.0% |
18.8% |
1.1x |
Accumulate |
|
Stanbic |
99.0 |
100.0 |
1.0% |
3.7% |
14.9% |
87.0 |
109.8 |
9.0% |
18.8% |
0.9x |
Accumulate |
|
ABSA Bank*** |
11.7 |
12.0 |
2.6% |
5.9% |
2.1% |
11.8 |
13.6 |
1.7% |
15.0% |
1.2x |
Accumulate |
|
SCBK*** |
136.0 |
136.5 |
0.4% |
2.3% |
5.0% |
130.0 |
137.0 |
10.3% |
10.6% |
1.1x |
Accumulate |
|
Liberty |
7.1 |
7.2 |
0.6% |
27.5% |
1.7% |
7.1 |
7.8 |
0.0% |
8.6% |
0.5x |
Hold |
|
NCBA*** |
28.6 |
30.2 |
5.8% |
14.4% |
18.7% |
25.5 |
29.1 |
6.6% |
3.0% |
0.7x |
Lighten |
|
CIC Group |
2.1 |
2.0 |
(4.7%) |
4.9% |
(6.0%) |
2.2 |
2.1 |
0.0% |
2.9% |
0.7x |
Lighten |
|
HF Group |
3.4 |
3.5 |
4.8% |
0.9% |
(7.4%) |
3.8 |
2.8 |
0.0% |
(20.5%) |
0.2x |
Sell |
|
Target Price as per Cytonn Analyst estimates **Upside/ (Downside) is adjusted for Dividend Yield ***For Disclosure, these are stocks in which Cytonn and/or its affiliates are invested in |
|||||||||||
We are “Neutral” on the Equities markets in the short term due to the current adverse operating environment and huge foreign investor outflows, and, “Bullish” in the long term due to current cheap valuations and expected global and local economic recovery.
With the market currently trading at a discount to its future growth (PEG Ratio at 0.9x), we believe that investors should reposition towards value stocks with strong earnings growth and that are trading at discounts to their intrinsic value. We expect the current high foreign investors sell-offs, the upcoming Kenyan general elections and the slow vaccine rollout to continue weighing down the economic outlook in the short term.
- Industry Report
During the week, Knight Frank, an international Real Estate consultancy and management firm, released the Kenya Market Update H1’2022 Report highlighting the performance of key Real Estate sectors in the country. The following were the key take outs from the report:
- In the residential sector, the average selling prices for prime housing units increased by 1.2% in H1’2022, mainly driven by the reopening of the economy that resulted to an improved purchasing power of buyers. The rental rates for prime residential units however declined by 2.2% in the period under review, compared to a 1.6% decline that was recorded in H1’2021. The decline in the rates was mainly on the back of an oversupply of the prime units that outweighed the demand, thus landlords providing concessions such as rent discounts in an aim to attract clients,
- The average asking rents for prime commercial office spaces came in at Kshs 144 per SQFT ($1.20) in H1’2022, a 20.0% increase from Kshs 120 per SQFT (USD 1.10) recorded a similar period in 2021. The increase was mainly driven by the completion of quality office spaces fetching prime rents, coupled with the continued preference for quality office spaces fuelling their demand and uptake. However, the average occupancy levels declined by 0.2% to 72.8%, from 73.0% in H1’2021 mainly driven by the existing oversupply of office spaces in the market. Key to note is that there are no major incoming office block developments in 2023 which is likely to increase the absorption of the existing office spaces, and,
- The average prime industrial rents registered a 5.0% increase to Kshs 71 per SQFT from Kshs 68 per SQFT in H2’2021 driven by; i) the growth of e-commerce that drives the demand for storage facilities, ii) rapid infrastructure developments driving growth of the sector, and, ii) the increasing investor confidence in Kenya’s property market which drives both local and international investments in the country.
The findings of this report are in line with our Cytonn H1’2022 Markets Review report which highlighted an increase in the average selling price for residential units and an increase in the average rent per SQFT of office spaces within the Nairobi Metropolitan Area (NMA). We still maintain our view that the residential sector performance will be supported mainly by the growing population driving demand and construction for housing units, while the NMA office sector’s performance will be shaped by the slow but rising investor confidence in Kenyan property market, coupled with the expansion of various firms. However, oversupply in the office market currently at 6.7 mn SQFT in the NMA, is expected to hinder the optimum performance of the sector.
Other notable industry report released during the month include:
|
# |
Theme |
Report |
Key Take-outs |
|
1 |
Residential Sector |
Prime Global Cities Index – Q2’2022 by Knight Frank |
|
We expect Kenya’s property market to continue recording development activities in its various sectors driven by; rapid construction activities particularly in the residential and infrastructure sectors, rapid growth of the industrial sector, increasing investor confidence in the general property market. Conversely, oversupply in select Real Estate sectors, coupled with the high construction costs, is expected to weigh down the optimum performance of the sector.
- Residential Sector
Notable highlights during the month include;
- EA Limited, a subsidiary of the TransCentury PLC, an African infrastructure investment company based in Nairobi Kenya, announced plans to develop an affordable housing project worth USD 250.0 mn (Kshs 29.8 bn) in the Democratic Republic of Congo (DRC). For more information, see our Cytonn Weekly #33/2022, and,
- The National Housing Cooperation (NHC) announced that it is seeking to raise Kshs 7.0 bn through the International Finance Corporation (IFC) under the Public Private Partnership (PPP) model, to fund the construction of 3,500 housing units in Athi River, Machakos County. For more information, see our Cytonn Weekly #34/2022.
- Retail Sector
During the week, Naivas founders, the family of Peter Mukuha Kago, sold an estimated 8.5% stake worth Kshs 3.8 bn to an undisclosed consortium of international investors. This comes two months after French private equity firm Amethis, and the International Finance Cooperation (IFC) consortium, sold 31.5% stake in Naivas supermarket to IBL Group and other investors such as French fund Proparco, and DEG. Naivas is currently valued at Kshs 45.6 bn and the trade will see the founding family’s stake drop to 60.0%, from the previous 68.5%. According to our Cytonn Weekly #25/2022, IBL Group, the largest investment Consortium in Mauritius, purchased the largest stake of 26.3% worth Kshs 12.0 bn, making it the largest investment worldwide, and the first in East Africa. French fund Proparco, and DEG invested Kshs 3.7 bn and Kshs 2.5 bn, respectively, representing an 8.3% and 5.4% stake in the retailer, respectively. This indicates continued interest in Kenya Retail Sector by foreign investors. Naivas currently ranks #1 in the retail industry, based on branches, with 84 number of branches. The table below shows a summary of the number of stores of the key local and international retailer supermarket chains in Kenya;
|
Main Local and International Retail Supermarket Chains |
||||||||||
|
Name of retailer |
Category |
Highest number of branches that have existed as at FY’ 2018 |
Highest number of branches that have existed as at FY’ 2019 |
Highest number of branches that have existed as at FY’ 2020 |
Highest number of branches that have existed as at FY’ 2021 |
Number of branches opened in 2022 |
Closed branches |
Current number of branches |
Number of branches expected to be opened |
Projected number of branches FY’2022 |
|
Naivas |
Local |
46 |
61 |
69 |
79 |
5 |
0 |
84 |
1 |
85 |
|
QuickMart |
Local |
10 |
29 |
37 |
48 |
3 |
0 |
51 |
0 |
51 |
|
Chandarana |
Local |
14 |
19 |
20 |
23 |
1 |
1 |
24 |
4 |
28 |
|
Carrefour |
International |
6 |
7 |
9 |
16 |
0 |
0 |
16 |
0 |
16 |
|
Cleanshelf |
Local |
9 |
10 |
11 |
12 |
0 |
0 |
12 |
0 |
12 |
|
Tuskys |
Local |
53 |
64 |
64 |
3 |
0 |
61 |
3 |
0 |
3 |
|
Game Stores |
International |
2 |
2 |
3 |
3 |
0 |
0 |
3 |
0 |
3 |
|
Uchumi |
Local |
37 |
37 |
37 |
2 |
0 |
35 |
2 |
0 |
2 |
|
Choppies |
International |
13 |
15 |
15 |
0 |
0 |
13 |
0 |
0 |
0 |
|
Shoprite |
International |
2 |
4 |
4 |
0 |
0 |
4 |
0 |
0 |
0 |
|
Nakumatt |
Local |
65 |
65 |
65 |
0 |
0 |
65 |
0 |
0 |
0 |
|
Total |
|
257 |
313 |
334 |
186 |
9 |
179 |
195 |
5 |
200 |
Source: Cytonn Research
Other notable highlights during the month include;
- Java House Africa Group, announced that it was seeking franchisees under its Kukito Brand which primarily serves grilled chicken and fries, in a bid to accelerate its growth in Kenya. The restaurant chain is looking to partner with local investors for an undisclosed amount who will use the Kukito brand name to establish more fast food outlets across the country. For more information, see our Cytonn Weekly #32/2022, and,
- Safaricom PLC announced plans to shut down its retail outlet at Two Rivers Mall, by 31st August 2022, as it plans to streamline its operations with the existing oversupply of retail spaces in the country that has reduced the footfall in shopping malls. For more information, see our Cytonn Weekly #34/2022.
- Hospitality Sector
During the month, the Competition Authority of Kenya (CAK) approved the sale of 680 Hotel in Nairobi’s city center to Maanzoni Lodges, and Crowne Plaza Hotel in Upper Hill to Kasada Hospitality Fund. This comes one month after the two hotels were acquired by the respective buyers for a total of Kshs 5.0 bn; 680 Hotel valued at Kshs 1.2 bn, and, Crowne Plaza which was valued at Kshs 4.6 bn, while its rebranding and management will be taken over by Accor Hotels, from Intercontinental Hotels Group. For more information, see our Cytonn Weekly #34/2022.
- Mixed Use Developments (MUDs)
During the month;
- Local Authorities Pension Fund (LAPF) Kenya announced plans to construct a mixed use development facility at an estimated cost of kshs 10.0 bn in Nakuru County. The mixed use facility will be comprised of a shopping mall, a five-star hotel, a warehouse block, residential apartments, a kindergarten school, a petrol station, and, an amusement park. For more information, see our Cytonn Weekly #31/2022, and,
- Property developer Mi Vida Homes completed and launched the first phase of the Mi Vida housing project worth Kshs 12.0 bn. For more information, see our Cytonn Weekly #31/2022.
- Infrastructure
During the month, the Kenya National Highway Authority (KeNHA) announced plans to construct two segments of the Eldoret-Juba road, at an estimated cost of Kshs 22.6 bn. The sections to be constructed will be as follows; i) A 55.0 Km road between Lesseru in Uasin Gishu County and Kitale in Transzoia County at an estimated cost of Kshs 6.6 bn, and, ii) A 142.0 Km road between Morpus in West Pokot County and Lokichar in Turkana County at an estimated cost Kshs 16.0 bn. For more information, see our Cytonn Weekly #34/2022.
- Industrial Sector
During the month, Stihl Group, a German based manufacturing company announced plans to open a new subsidiary dubbed Stihl East Africa, in Nairobi Kenya by the end of August 2022. This will make Kenya the first East African hub by the manufacturing company and the second African country after South Africa, where the company established a subsidiary in 1996. For more information, see our Cytonn Weekly #32/2022.
- Real Estate Investment Trusts (REITs)
During the week, listed firm GRIT Real Estate completed the purchase of an extra 8.7% stake worth Kshs 2.3 bn in Gateway Real Estate Africa Ltd (GREA), bringing the firm’s total stake to 35.0%, from 26.3% in April 2022. The listed firm has plans to raise its stake to 48.6% by December 2022, in a bid to increase its controlling interest in the company. Upon the successful acquisition, GRIT will own half of the US Embassy housing project in Rosslyn Estate that was jointly developed by GREA and US-based Verdant Ventures. Consequently, this will further cement its presence in the Kenyan Real Estate market, after completing the purchase of Orbit Products Africa, a warehouse and manufacturing facility located in Machakos County, at a cost of Kshs 6.1 bn in March 2022. Additionally, GRIT has a 50.0% stake in Buffalo Mall located in Naivasha, and a pharmaceutical warehouse along Mombasa Road that it leased out to South Africa’s Imperial Health Sciences Logistics.
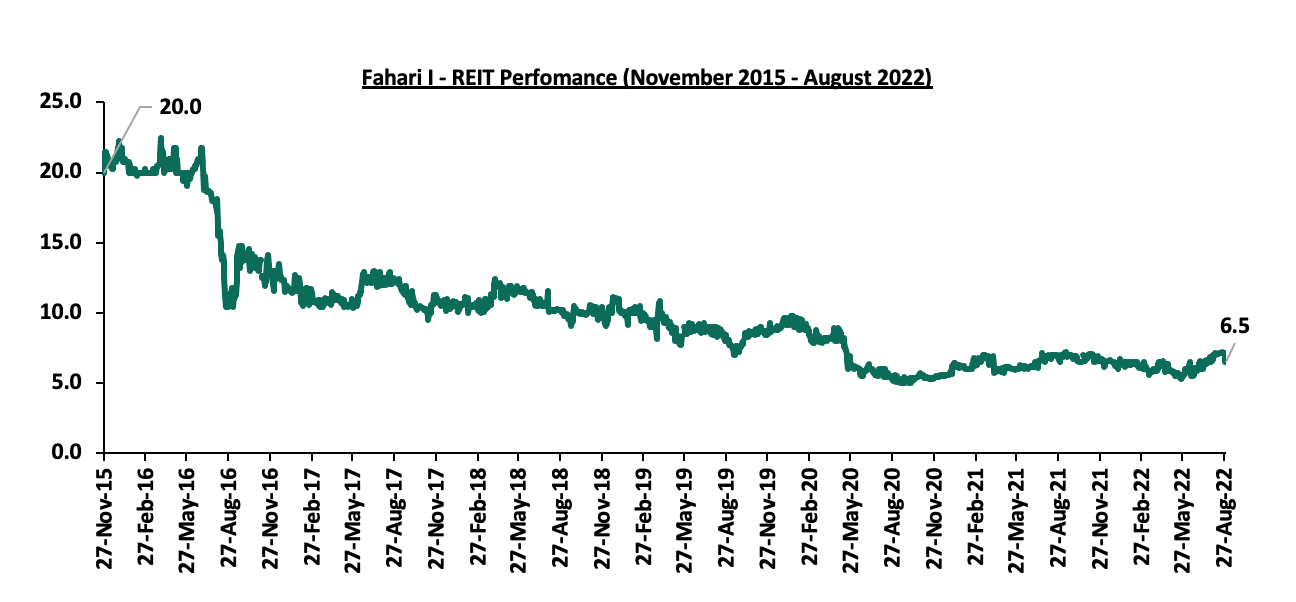
In the Nairobi Stock Exchange, Fahari I-REIT closed the month trading at an average price of Kshs 6.5 per share, representing a 1.6% Year-to-Date (YTD) increase from Kshs 6.4 per share. On an Inception-to-Date (ITD) basis, the REIT’s performance continues to be weighed down having realized a 72.5% decline from Kshs 20.0 per share. The graph below shows Fahari I-REIT’s performance from November 2015 to August 2022:
The Kenyan Real Estate market is expected to be on an upward trajectory driven by; i) increased construction activities in the residential and infrastructure sectors, ii) improving investor confidence in the Kenyan property market, iii) rapid expansion in the retail sector, and, iv) continuous growth of the industrial sector. However, the performance of the sector is expected to be weighed down by the inadequate investor appetite in local REITs, oversupply in select Real Estate sectors, and the high construction costs.
Disclaimer: The views expressed in this publication are those of the writers where particulars are not warranted. This publication, which is in compliance with Section 2 of the Capital Markets Authority Act Cap 485A, is meant for general information only and is not a warranty, representation, advice or solicitation of any nature. Readers are advised in all circumstances to seek the advice of a registered investment advisor

- Talk to us
- Kenya
- P.O Box 20695 - 00200, Nairobi, Kenya
- Cell +254709101200
- Tel +254709101200
- WhatsApp +254741676635
- United States
- +254709101200
- DOWNLOAD OUR APP
-


- Kenya
- 8th Floor, Pinetree Plaza, Kaburu Drive, Ngong Road, Nairobi, Kenya
- USA
- Suite 1150, 1775 Eye Street NW, USA, Washington DC 20006, USA
- Investments
- High Yield
- Private Equity
- Real Estate
- Real Estate
- RiverRun Estates
- Cytonn Towers
- The Ridge
- Taraji Heights
- The Alma