NMA Mixed Use Developments Report 2019 & Cytonn Weekly#45/2019
By Cytonn Research Team, Nov 10, 2019
Executive Summary
Fixed Income
During the week, T-bills were oversubscribed, with the subscription rate coming in at 132.6%, up from 114.3% the previous week. The oversubscription is partly attributable to favorable liquidity in the money market during the week. The yield on the 91-day and 364-day papers remained unchanged at 6.4% and 9.8%, respectively, while the yield on the 182-day paper increased by 0.1% point to 7.3% from the 7.2% recorded in the previous week. During the week, Stanbic Bank released Kenya’s PMI Index for the month of October, which came in at 53.2 as compared to the 54.1 recorded in the month of September. Readings above 50.0 indicate an improvement in business conditions while readings below 50.0 show a deterioration. Businesses saw new orders rise at a sharp pace, despite it being slower than in the month of September, mainly supported by increasing client numbers who came in from referrals by previous clients;
Equities
During the week, the equities market was on a downward trend with NASI, NSE 20 and NSE 25 declining by 2.0%, 0.6% and 3.0%, respectively, taking their YTD performance to gains/losses of 14.6%, (4.1%) and 11.4%, for NASI, NSE 20 and NSE 25, respectively. During the week, the President signed the Finance Bill, 2019 into law, scrapping the law capping interest rate at 4.0% above the Central Bank Rate (CBR). Interest rate caps were introduced in Kenya in September 2016 with the enactment of the Banking (Amendment) Act, 2015, due to the high cost of borrowing that saw banks charge interest rates as high as 21.0% for loans, yet depositors earned approximately 5.0% for their deposits;
Private Equity
ICEA Lion Asset Management, a Kenya based fund manager, signed an agreement to acquire Stanlib Kenya, another Kenya based fund manager, for an estimated Kshs 1.5 bn for a 100% stake. ICEA Lion is acquiring Stanlib Kenya from South Africa based Liberty Holdings Ltd who in their FY’2018 Annual Report announced they would be selling majority stakes in their asset-management operations in East and West Africa, and Liberty Health and Liberty Africa’s Insurance short-term insurance businesses in Malawi and Namibia;
Real Estate
During the week, the Kenya National Bureau of Statistics (KNBS) released the Leading Economic Indicators (LEI) September 2019, highlighting continued growth of the hospitality sector. The bureau also released the 2019 Kenya Population and Housing Census Volume I, reporting a 2.2% yearly growth in the last decade following the census exercise carried out in August 2019. In the residential sector, the Finance Act, 2019 (the Act) was assented to by the President with several amendments focused on supporting the Big Four Agenda. The government announced that the first lottery on the Park Road affordable housing project in Ngara was set to be conducted at the end of November 2019, following the completion of the first phase of the project comprising of 228 housing units, while Vaal Real Estate, an Egyptian and Turkish owned developer, launched a 227-unit project dubbed Wilma Towers, located along Elgeyo Marakwet Road in Kilimani, Nairobi. In listed real estate, ICEA Lion Asset Management signed an agreement to acquire Stanlib Kenya from South Africa based Liberty Holdings Ltd. In addition, REITs investee companies are set to gain with the exemption from income tax following the approval of the Finance Act, 2019;
Focus of the Week
This week we update our NMA Mixed-Use Developments (MUDs) Report 2018, by focusing on Mixed-Use Developments’ performance against the single-use market performance of the residential, commercial office, and retail sectors as of September 2019. In terms of performance, Mixed-Use Developments recorded average rental yields of 7.3% in 2019, 0.4% points higher than the respective single-use retail, commercial office and residential themes average of 6.9%, attributed to increasing popularity for the mixed-use concept due to convenience as a result of incorporated working, shopping and living spaces. The investment opportunity for mixed-use themed developments lies in Kilimani and Limuru Road given the relatively high rental yields of 9.1% and 8.5%, respectively, above the market average of 7.3%. The recommended investment strategy is incorporating differentiated concepts such as serviced apartments and shared offices which provide attractive returns of 6.4% and 13.5%, respectively.
- You can now make instant withdrawals from your Cytonn Money Market Fund account, just dial *809#
- Caleb Mugendi, Asst. Head of Investments, was on KTN News discussing the lending cap rate that was lifted by the members of the parliament and how SME’s are going to be affected. Watch Caleb here.
- David Kingoo, Senior Risk and Compliance Associate was on K24 TV to talk about the interest rate cap the National Assembly was expected to vote on. Watch David here
- David Kingoo, Senior Risk and Compliance Associate was on Metropol TV to talk about the current state of Sacco’s and the cooperative industry. Watch David here
- Caleb Mugendi, Asst. Head of Investments, was on KBC Channel 1 to discuss the repeal of the interest rate capping law. Watch Caleb here
- Phase 1 of The Alma is now 100% sold with early buyers having achieved up to 55% capital appreciation. We are now running a promotion in Phase 2: Buy a unit in Phase 2 with a 15-year payment plan and 0% deposit. For inquiries, please email us on clientservices@cytonn.com. The site is open between 8 am - 5 pm, 7-days a week for site visits;
- Cytonn Money Market Fund closed the week at an average yield of 11.0% p.a. To subscribe, just dial *809#;
- For an exclusive tour of Cytonn’s real estate developments, visit: Sharp Investor's Tour and for more information, email us at sales@cytonn.com;
- We continue to hold weekly workshops and site visits on how to build wealth through real estate investments. The weekly workshops and site visits target both investors looking to invest in real estate directly and those interested in high yield investment products to familiarize themselves with how we support our high yields. Watch progress videos and pictures of The Alma, Amara Ridge, and The Ridge;
- We continue to see very strong interest in our weekly Private Wealth Management Training (largely covering financial planning and structured products). The training is at no cost and is open only to pre-screened participants. We also continue to see institutions and investment groups interested in the training for their teams. Cytonn Foundation, under its financial literacy pillar, runs the Wealth Management Training. If interested in our Private Wealth Management Training for your employees or investment group, please get in touch with us through wmt@cytonn.com. To view the Wealth Management Training topics, click here;
- Join us on Saturday 9th November 2019 from 9:00 am to 11:00 am at the Chancery for a detailed, informative and interactive session on REITs. To sign up for this session, click here
- Are you an SME interested in learning about pensions? Join us as we delve into retirement solutions suitable for you and your business at The Chancery, 6th Floor along Valley Road on 14th November from 9:00 am to 11:00 am. To confirm your attendance, kindly RSVP at com/pensionstraining
- For recent news about the company, see our news section here;
- We have 10 investment-ready projects, offering attractive development and buyer targeted returns. See further details here: Summary of Investment-Ready Projects
Money Markets, T-Bills & T-Bonds Primary Auction:
During the week, T-bills were oversubscribed, with the subscription rate coming in at 132.6%, up from 114.3% the previous week. The oversubscription is partly attributable to favorable liquidity in the money market during the week. The yield on the 91-day and 364-day papers remained unchanged at 6.4% and 9.8%, respectively, while the yield on the 182-day paper increased by 0.1% point to 7.3% from the 7.2% recorded in the previous week. The acceptance rate dropped to 83.5% from 86.5%, recorded the previous week, with the government accepting Kshs 26.5 bn of the Kshs 31.8 bn bids received.
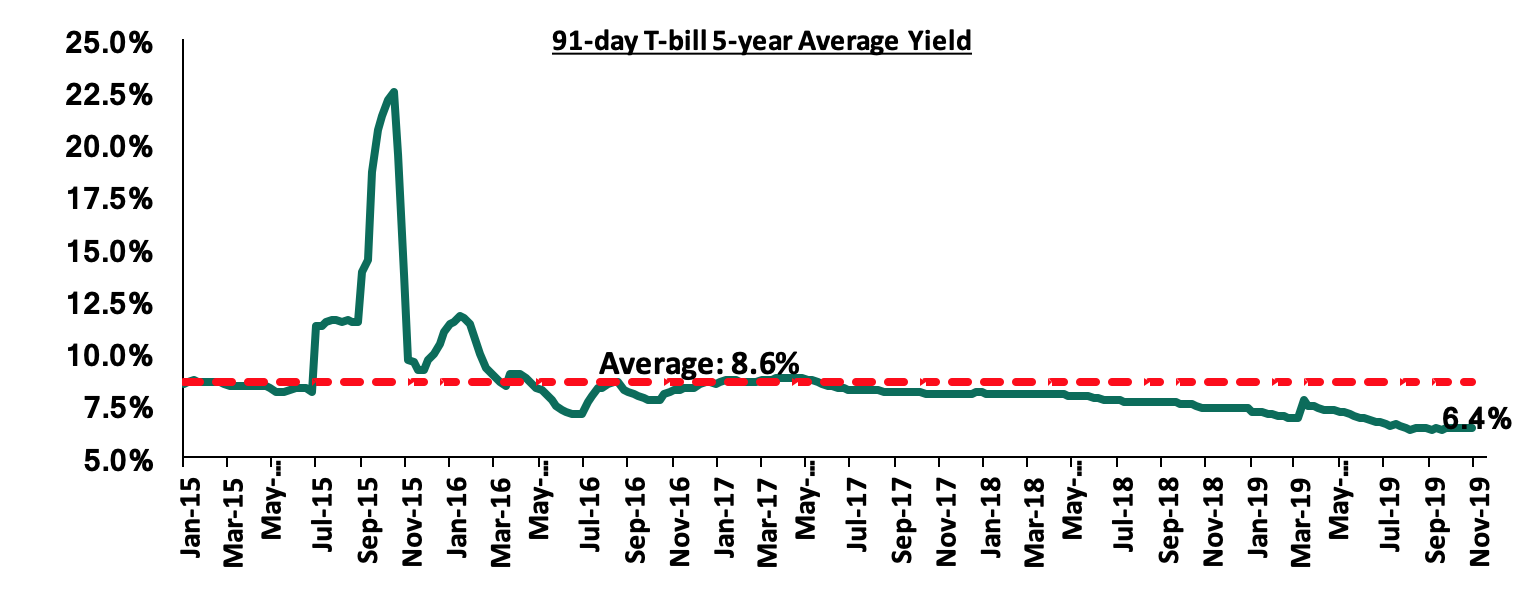
The 91-day T-bill is currently trading at a yield of 6.4%, which is below its 5-year average of 8.6%. The lower yield on the 91-day paper is mainly attributable to the low-interest-rate environment that has persisted since the passing of the law capping interest rates.
During the week, the National Treasury announced that it will issue a 10-year Kshs 50.0 bn bond (FXD 4/2019/10) with market-determined coupon rates for Budgetary Support purposes. The period of sale is from 6th November 2019 to 19th November 2019. As per the historical trend, we expect the market to maintain a bias towards the 10-year bond mainly driven by the perception that risks may not be adequately priced on the longer end of the yield curve, which is relatively flat due to saturation of long-term bonds. We shall give our bidding range in next week’s report.
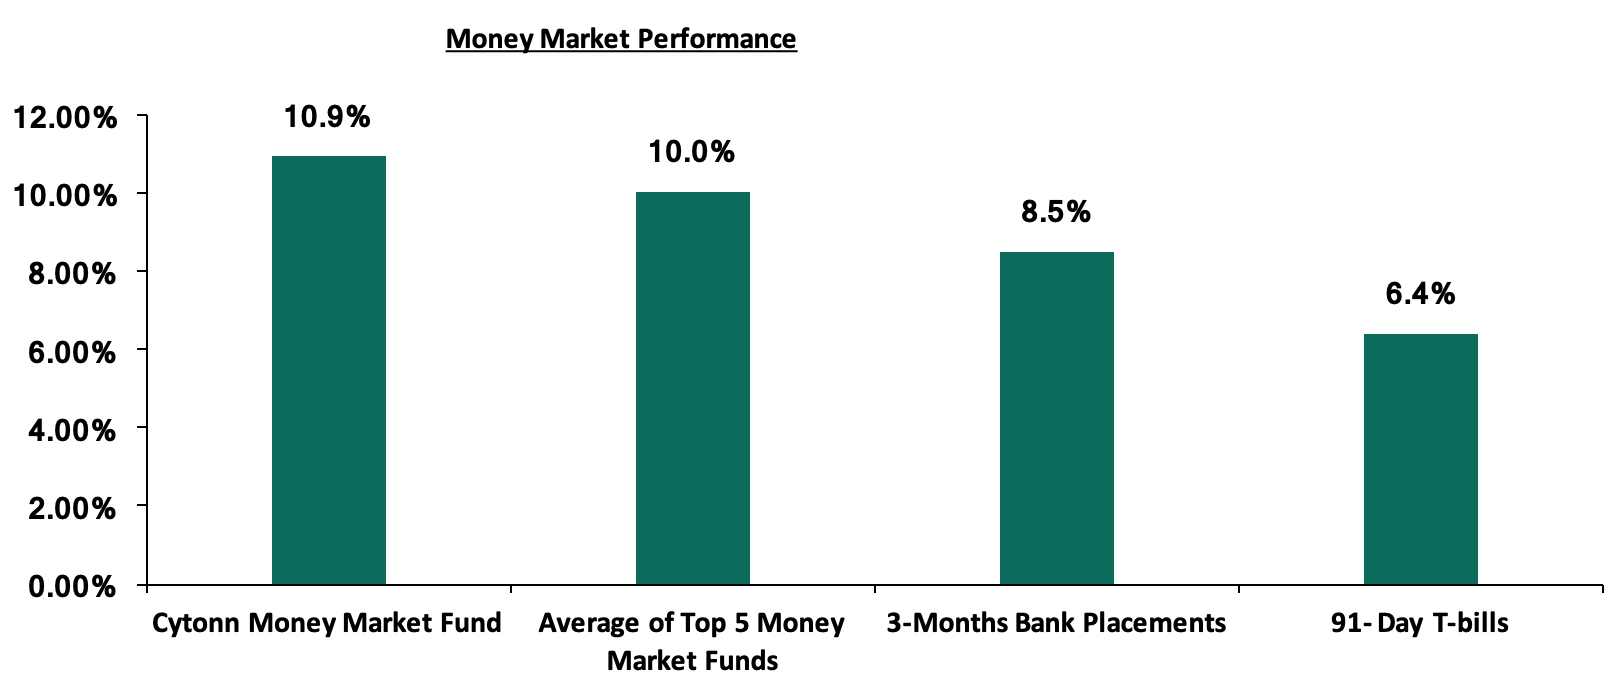
In the money markets, 3-month bank placements ended the week at 8.5% (based on what we have been offered by various banks), the 91-day T-bill came in at 6.4%, while the average of Top 5 Money Market Funds came in at 10.0%, which was a 0.2% decrease from 10.2% recorded in the previous week. The Cytonn Money Market Fund closed the week at 10.9%, from 11.0% recorded the previous week.
Liquidity:
During the week, the average interbank rate dropped to 5.1% from 6.4% recorded the previous week, pointing to increasing liquidity in the money markets. The average interbank volumes dropped by 51.5% to Kshs 8.4 bn, from Kshs 17.4 bn recorded the previous week.
Kenya Eurobonds:
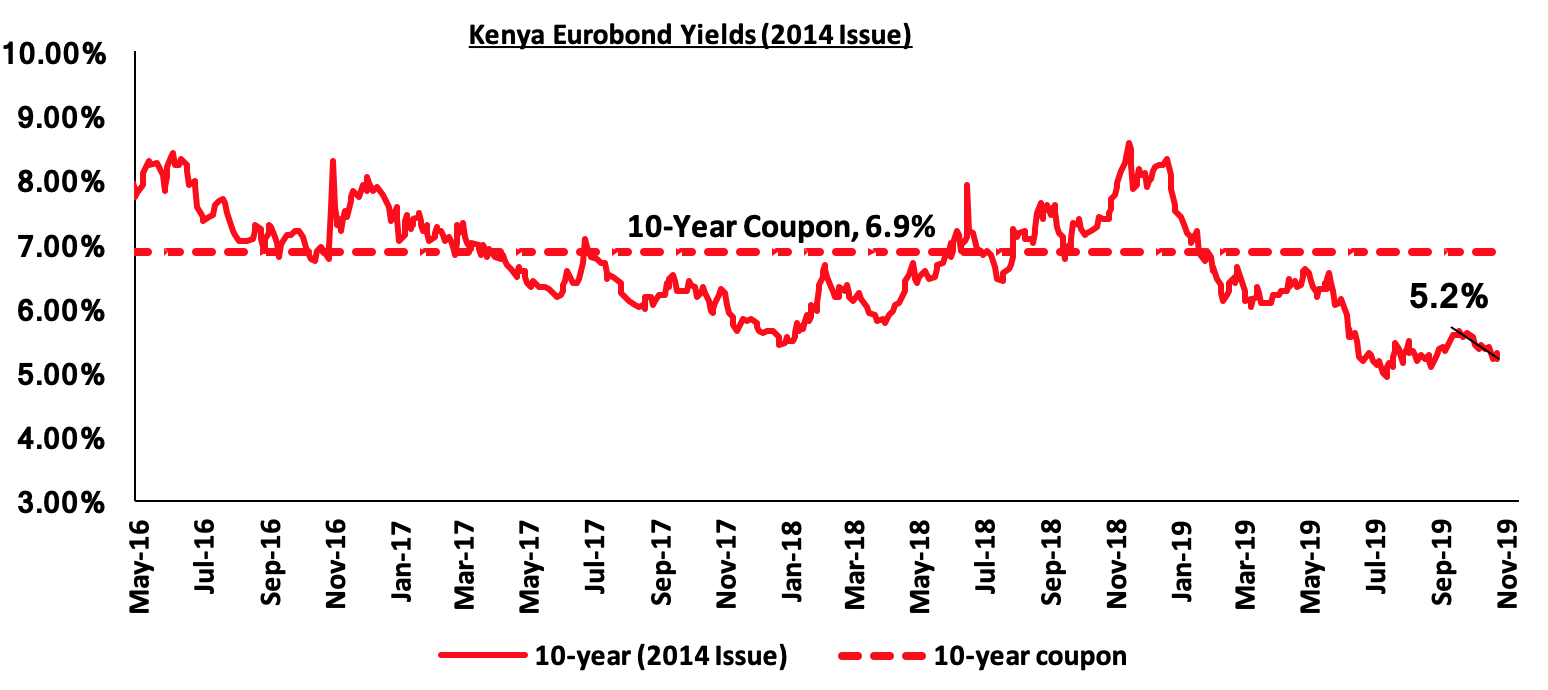
According to Reuters, the yield on the 10-year Eurobond issued in June 2014 decreased by 0.2% points to 5.2% from 5.4% in the previous week. We attribute the decline across all the Kenya Eurobonds to easing risk concerns over the economy by investors following the news of the interest rate cap repeal, which is seen as likely to stimulate credit growth and economic growth.
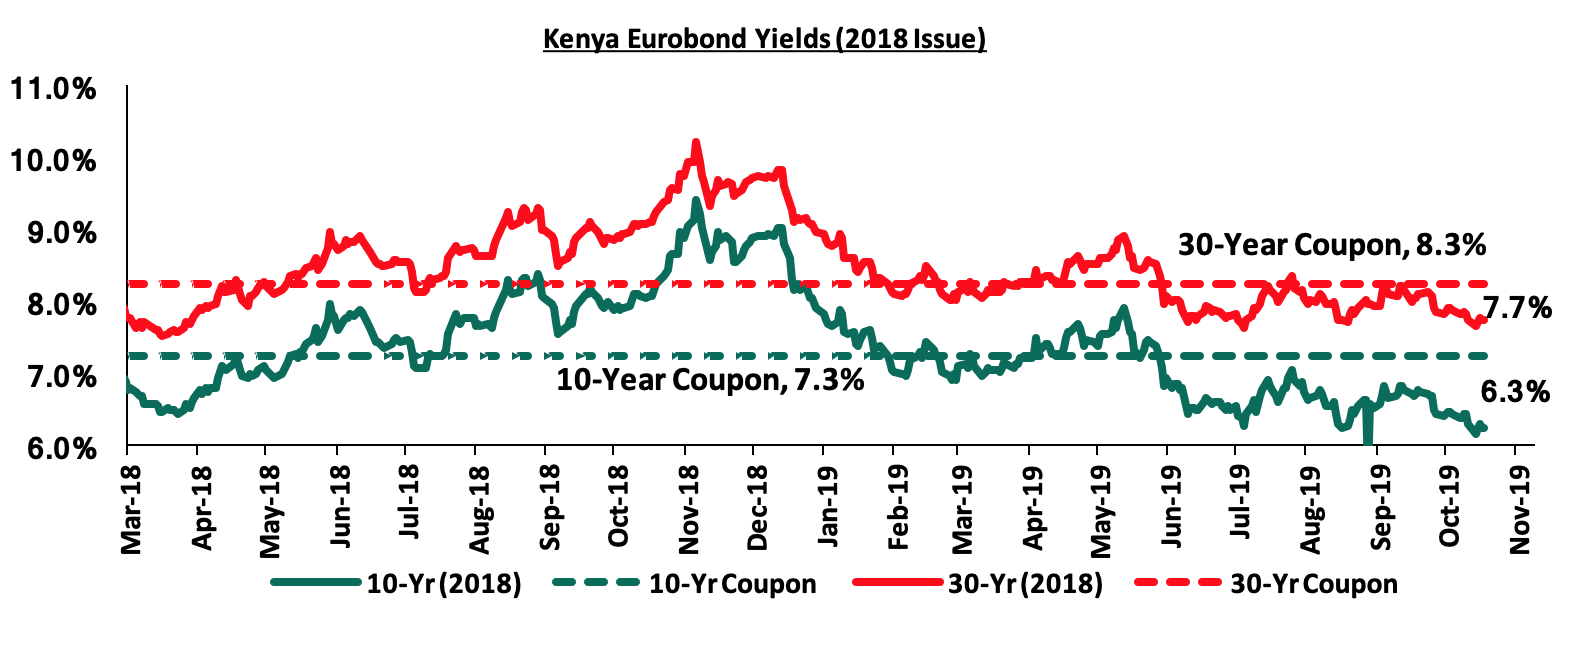
During the week, the yield on the 10-year and 30-year Eurobond both declined by 0.1% point to 6.3% from 6.4% and 7.7% from 7.8% in the previous week, respectively.
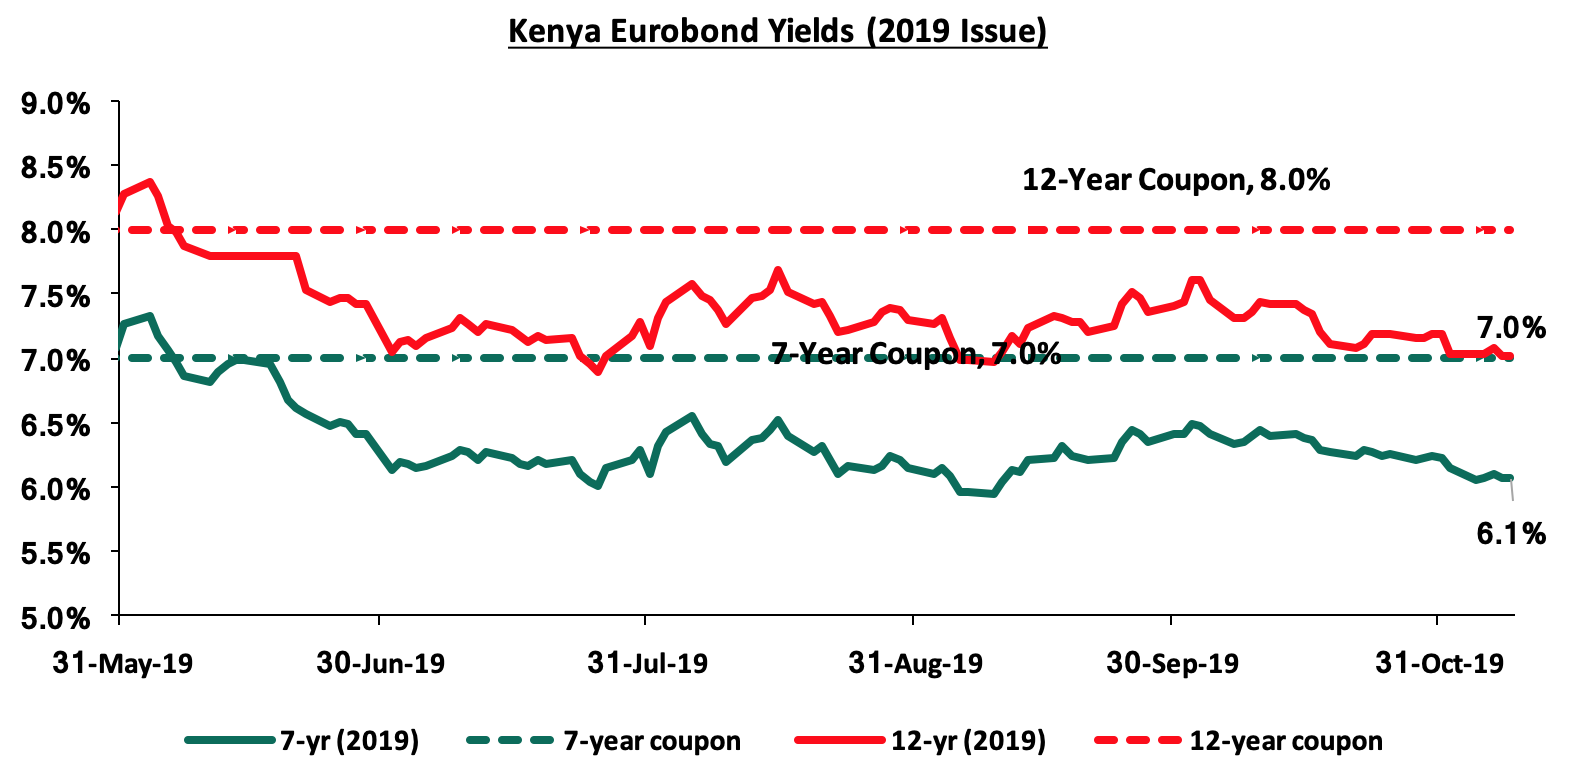
During the week, the yields on the 7-year Eurobond remained unchanged at 6.1% while yields on the 12-year Eurobond declined by 0.2% points to 7.0% from 7.2% the previous week.
Kenya Shilling:
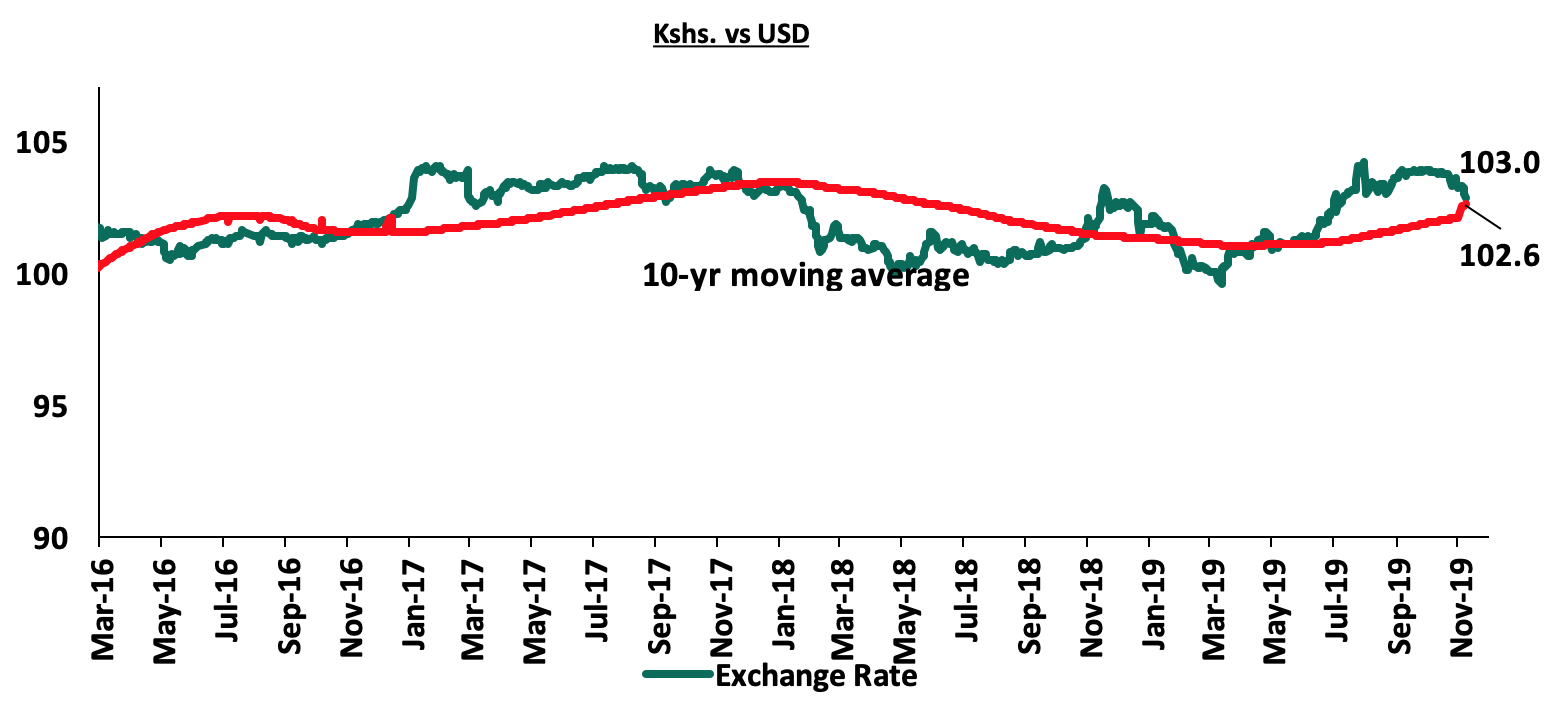
During the week, the Kenya Shilling appreciated by 0.5% against the US Dollar to close at Kshs 102.8 from 103.3 recorded in the previous week. The appreciation was attributed to positive investor sentiment owing to the repeal of interest cap during the week. On a YTD basis, the shilling has depreciated by 0.9% against the US Dollar, in comparison to the 1.3% appreciation in 2018. In our view, the shilling should remain relatively stable against the dollar in the short term, supported by:
- The narrowing of the current account deficit, with preliminary data indicating that Kenya’s current account deficit improved by 11.8% during Q2’2019, coming in at a deficit of Kshs 107.6 bn, from Kshs 122.0 bn in Q2’2018, equivalent to (6.2%) of GDP, from (7.6%) recorded in Q2’2018. This was mainly driven by the narrowing of the country’s merchandise trade deficit by 1.7% and a rise in secondary income (transfers) balance by 5.1%,
- Improving diaspora remittances, which have increased cumulatively by 8.0% in the 12-months to September 2019 to USD 2.8 bn, from USD 2.6 bn recorded in a similar period of review in 2018. The rise is due to:
- Increased uptake of financial products by the diaspora due to financial services firms, particularly banks, targeting the diaspora, and,
- New partnerships between international money remittance providers and local commercial banks making the process more convenient,
- CBK’s supportive activities in the money market, such as repurchase agreements and selling of dollars, and,
High levels of forex reserves, currently at USD 9.0 bn (equivalent to 5.6-months of import cover), above the statutory requirement of maintaining at least 4.0-months of import cover, and the EAC region’s convergence criteria of 4.5-months of import cover.
Weekly Highlight:
According to the Stanbic Bank Kenya PMI index, Kenya’s PMI Index for the month of October came in at 53.2 as compared to the 54.1 recorded in the month of September. Readings above 50.0 indicate an improvement in business conditions while readings below 50.0 show a deterioration.
Businesses saw new orders rise at a sharp pace, despite it being slower than in the month of September. This was mainly supported by increasing client numbers who came in from referrals by previous clients. Demand was mainly driven by improved marketing strategies and service quality. Sales from foreign clients rose at a faster pace than in September. It is key to note that output levels expanded marginally attributable to continuing cash-flow issues in businesses in the country making it hard for companies to keep up with new orders resulting in increased backlogs for the sixth month running. Employment grew at a solid rate with some businesses increasing their labour because of the increased demand, while others reduced staff in an effort to limit staff cost pressures. Based on the slow pace of new order growth, stocks of purchases increased marginally with the increase being the lowest since April. Lead times remained strong in the month of October mainly due to a recorded increase in competition among suppliers. Selling charges reduced for the second time in nearly two years on the back of reduced input price inflation. Overall costs rose at a moderate pace despite the fall in fuel prices, mainly because of the higher commodity prices owing to lack of supply and faster salary inflation. Expectations for future activity fell in October posting the weakest optimism in 2019 so far. Going forward, we are positive that the improving trend in business conditions will continue, supported by the current stable macro-economic conditions.
Rates in the fixed income market have remained relatively stable as the government rejects expensive bids. The government is 31.2% behind its domestic borrowing target, having borrowed Kshs 79.4 bn against a pro-rated target of Kshs 115.5 bn. We expect an improvement in private sector credit growth considering the repeal of the interest rate cap. This will result in increased competition for bank funds from both the private and public sectors, thereby reducing liquidity in the money markets, resulting in upward pressure on interest rates. Owing to this, our view is that investors should be biased towards short-term fixed-income securities to reduce duration risk.
Market Performance
During the week, the equities market was on a downward trend with NASI, NSE 20 and NSE 25 declining by 2.0%, 0.6% and 3.0%, respectively, taking their YTD performance to gains/losses of 14.6%, (4.1%) and 11.4%, for NASI, NSE 20 and NSE 25, respectively. The performance in NASI was driven by losses recorded by stocks mainly in the Banking sector with NCBA Group, KCB Group, Barclays Bank of Kenya and Standard Chartered Bank recording losses of 11.7%, 6.3%, 5.9% and 5.8%, respectively.
Equities turnover declined by 18.0% during the week to USD 58.3 mn, from USD 71.1 mn the previous week, taking the YTD turnover to USD 1,300.4 mn. Foreign investors remained net sellers for the week, with a net selling position of USD 6.7 mn, increasing by 41.6% from a net selling position of USD 4.7 mn recorded the previous week.
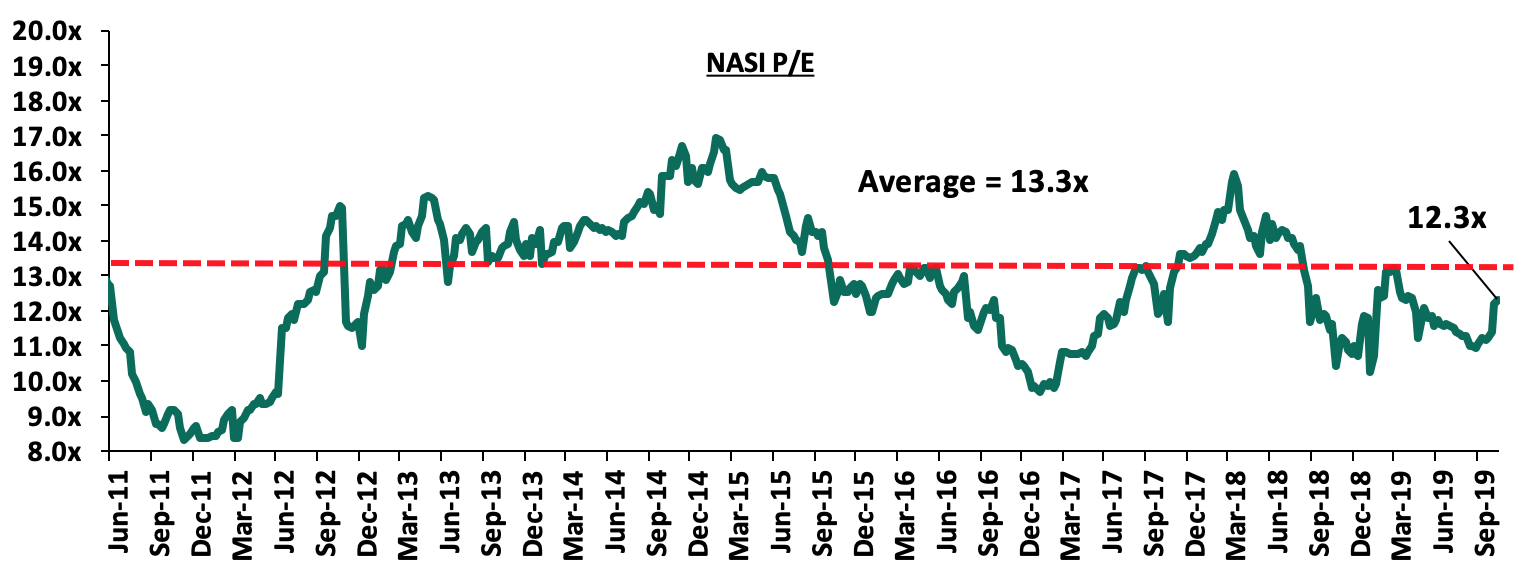
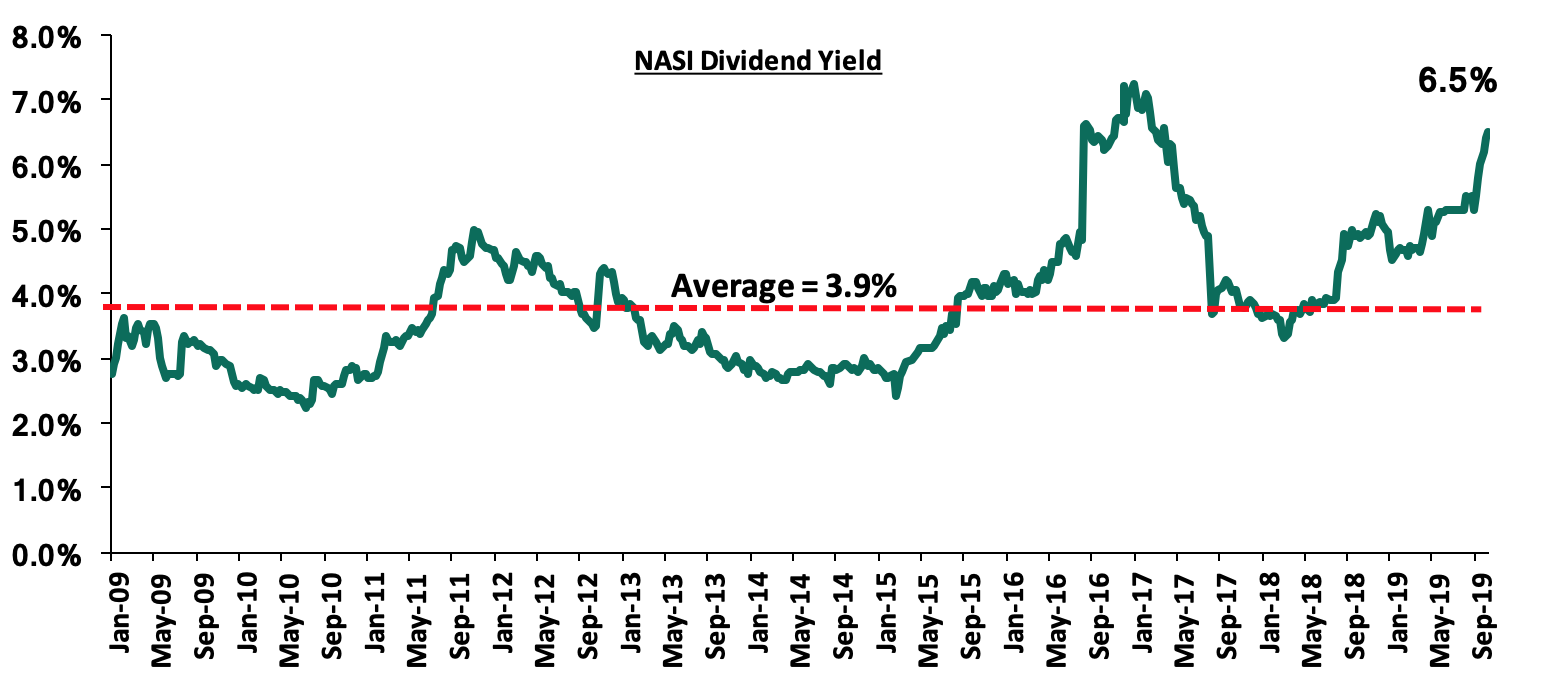
The market is currently trading at a price to earnings ratio (P/E) of 12.3x, 7.3% below the historical average of 13.3x, and a dividend yield of 6.5%, above the historical average of 3.9%. With the market trading at valuations below the historical average, we believe there is value in the market. The current P/E valuation of 12.3x is 26.9% above the most recent trough valuation of 9.7x experienced in the first week of February 2017, and 48.3% above the previous trough valuation of 8.3x experienced in December 2011. The charts below indicate the historical P/E and dividend yields of the market.
Earnings Releases
National Bank of Kenya released their Q3’2019 financial results
During the week, the National Bank of Kenya released its Q3’2019 financial results. Below is a summary of their performance;
- Profit before tax increased to Kshs. 0.7 bn, from a loss of Kshs 0.1 bn Q3’2018. The bank recorded a 1,753.4% increase in profit after tax to Kshs 0.4 bn from a profit after tax of Kshs. 22.0 mn in Q3’2018. The performance was driven by a 7.3% increase in total operating income, and was weighed down by the 3.9% increase in the total operating expenses,
- Total operating income increased by 7.3% to Kshs. 6.0 bn from Kshs. 5.6 bn in Q3’2018. This was driven by an 11.6 % increase in Net Interest Income (NII) to Kshs. 4.6 bn from Kshs. 4.1 bn in Q3’2018, despite the 4.6% decline in Non-Funded Income (NFI) to Kshs. 1.4 bn from Kshs. 1.5 bn in Q3’2018,
- Interest income increased by 4.7% to Kshs. 6.6 bn, from Kshs. 6.3 bn in Q3’2018, driven by the increase in interest income on Loans & Advances that increased by 6.0% to Kshs. 3.3 bn, from Kshs. 3.1 bn in Q3’2018. Interest income on Government Securities increased by 4.2% to Kshs. 3.3 bn, from Kshs. 3.2 bn in Q3’2018. As a result, the yield on interest-earning assets increased to 10.6% in Q3’2019 from 10.1% in Q3’2018,
- Interest expense declined by 8.2% to Kshs. 2.0 bn, from Kshs. 2.2 bn in Q3’2018, following a 16.8% decline in the interest expense on Customer Deposits to Kshs. 1.6 bn, from Kshs. 2.0 bn in Q3’2018. Interest expense on Deposits & Placements from Banking Institutions increased by 38.8% to Kshs. 0.3 bn, from Kshs. 0.2 bn in Q3’2018. The cost of funds declined marginally to 2.9%, from 3.0% in Q3’2018, while Net Interest Margin increased to 7.2%, from 6.6% in Q3’2018,
- Non-Funded Income (NFI) declined by 4.6% to Kshs. 1.4 bn, from Kshs. 1.5 bn in Q3’2018. The decline in NFI was driven by a 39.1% decrease in Other Income to Kshs. 0.1 bn, from Kshs. 0.2 bn in Q3’2018, coupled with a 10.3% decline in foreign exchange income to Kshs. 363.4 mn, from Kshs. 404.9 mn in Q3’2018. Fees and commissions on loans and advances also declined by 6.4% to Kshs. 90.0 mn, from Kshs. 96.2 mn in Q3’2018. Other Fees however increased by 5.8% to Kshs 0.9 bn from Kshs 0.8 bn recorded in Q3’2018. The current revenue mix stands at 86:14 funded to non-funded income as compared to 80:20 in Q3’2018. The proportion of funded income to total revenue increased owing to the decline in NFI coupled with the increase in NII,
- Total Operating Expenses increased by 3.9% to Kshs. 5.4 bn, from Kshs. 5.2 bn, largely driven by the 3.7% increase in Staff Costs to Kshs. 3.0 bn in Q3’2019, as compared to Kshs 2.9 bn in Q3’2018. The lower write-back in Loan Loss Provisions of Kshs 30.8 mn compared to Kshs 0.2 bn in Q3’2018, also contributed to the increase in Total Operating Expenses. Other Expenses declined by 4.5% to Kshs. 2.4 bn in Q3’2019, from Kshs. 2.5 bn in Q3’2018,
- The cost to income ratio improved to 88.8% from 91.8% in Q3’2018. Without LLP, the cost to income ratio deteriorated to 87.5%, from 86.7% in Q3’2018, as a result of the lower write-back in Loan Loss Provisions,
- The balance sheet experienced a contraction, as total assets decreased by 4.7% to Kshs. 107.2 bn from Kshs. 112.5 bn in Q3’2018. This decrease was largely caused by a 24.8% decline in cash and bank balances to Kshs 6.9 bn, from Kshs 9.2 bn in Q3’2018, coupled with the 17.5% decline in Government Securities to Kshs 34.1 bn, from Kshs 41.3 bn in Q3’2018,
- The loan book declined marginally by 0.3% to Kshs 47.9 bn, from Kshs 48.0 bn in Q3’2018.
- Total liabilities decreased by 5.3% to Kshs. 99.9 bn, from Kshs. 105.5 bn in Q3’2018, driven by an 11.1% decline in Customer Deposits to Kshs. 82.5 bn, from Kshs 92.8 bn in Q3’2018. However, there was a 24.5% increase in Deposits and Balances due to other banking Institutions to Kshs 7.3 bn, from Kshs 5.8 bn in Q3’2018, and the 48.0% increase in Other Liabilities to Kshs. 10.0 bn, from Kshs. 6.8 bn in Q3’2018,
- Deposits per branch decreased by 9.8% to Kshs. 1.2 bn, from Kshs. 1.3 bn in Q3’2018, as the bank closed the third quarter with 69 branches,
- The slower decline in loans as compared to deposits led to an increase in the loan to deposit ratio to 58.0%, from 51.7% in Q3’2018,
- Gross non-performing loans increased by 6.7% to Kshs. 33.0 bn in Q3’2019, from Kshs. 30.9 bn in Q3’2018. Consequently, the NPL ratio increased marginally to 47.9%, from 47.1% in Q3’2018. General provisions increased by 17.5%, to Kshs. 15.6 bn from Kshs. 13.3 bn in Q3’2018. The NPL coverage thus increased to 63.4% in Q3’2019, from 57.1% in Q3’2018.
- Shareholders’ funds increased by 4.5% to Kshs. 7.3 bn in Q3’2019, from Kshs. 7.0 bn in Q3’2018, aided by the 19.3% increase in the statutory loan loss reserves to Kshs 4.5 bn, from Kshs 3.8 bn in Q3’2018,
- National Bank is currently severely undercapitalized with a core capital to risk-weighted assets ratio of 1.5%, 9.0% below the statutory requirement. In addition, the total capital to risk-weighted assets ratio was 2.9%, below the statutory requirement by 11.6%. Adjusting for IFRS 9, the core capital to risk-weighted assets stood at 1.8%, while total capital to risk-weighted assets came in at 3.5%, indicating that the bank’s total capital relative to its risk-weighted assets declined by 0.6% due to implementation of IFRS 9, and,
- National Bank currently has a return on average assets of 0.4% and a return on average equity of 5.5%.
Key Take-Outs:
- National Bank is currently undercapitalized with the total capital to risk-weighted assets ratio coming in at 2.9%, 11.6% below the 14.5%, as required by regulation. The bank has been granted an exemption to operate below the regulatory requirement but the current acquisition by KCB Group should see the bank become recapitalized as they operate as a separate subsidiary for two years, and,
- The bank experienced a deterioration in asset quality, with gross non-performing loans (NPLs) increasing by 6.7% to Kshs. 33.0 bn, from Kshs. 30.9 bn in Q3’2018. The NPL ratio of 47.9% is above the banking sector average of 10.0% and thus the bank needs to adopt a raft of measures to improve on the overall asset quality.
For more information, see our National Bank Q3’2019 Earnings Note
Weekly Highlight
During the week, the President signed the Finance Bill 2019 into law, scrapping the law capping interest rates at 4.0% above the Central Bank Rate (CBR). Interest rate caps were introduced in Kenya in September 2016 with the enactment of the Banking (Amendment) Act, 2015, due to the high cost of borrowing that saw banks charge interest rates as high as 21.0% for loans, yet depositors earned approximately 5.0% for their deposits. The main aim of the rate caps was to reduce the cost of borrowing, expand access to credit, and increase the return on savings. However, since its enactment, the rate cap failed to achieve its intended goals evidenced by subdued private sector credit growth and reduced loan accessibility, resulting in the proliferation of alternative credit markets such as loan sharks and mobile financial services. In order to reverse the effects of the rate cap, the President echoed the sentiments of the International Monetary Fund (IMF) and Central Bank of Kenya (CBK) who had called for the repeal of interest rate caps in order to allow credit flow to the economy by enhancing access to credit by the private sector, specifically the Small and Medium Enterprises (SMEs), as well as cutting out exploitative lenders such as unregulated loan sharks and mobile financial services providers. For more information, see our latest topical on the rate caps End of Interest Rate Caps?
With the interest rate cap repealed, we expect increased access to credit by borrowers that have been shunned under the current regulated loan-pricing framework. However, we still recommend that we deal with two key outstanding issues of (i) Consumer Protection Against Abuse by Banks, and (ii) Promoting Competing Alternative Funding Channels.
Universe of Coverage
Below is a summary of our universe of coverage:
|
Banks |
Price at 1/11/2019 |
Price at 8/11/2019 |
w/w change |
YTD Change |
Target Price* |
Dividend Yield |
Upside/ Downside** |
P/TBv Multiple |
Recommendation |
|
Sanlam |
16.0 |
17.0 |
6.3% |
(14.8%) |
29.0 |
0.0% |
70.6% |
0.7x |
Buy |
|
I&M Holdings*** |
47.0 |
50.0 |
6.4% |
5.9% |
79.8 |
7.8% |
67.3% |
0.8x |
Buy |
|
Diamond Trust Bank |
116.0 |
120.0 |
3.4% |
(27.2%) |
175.6 |
2.2% |
48.5% |
0.6x |
Buy |
|
Kenya Reinsurance |
3.2 |
3.1 |
(0.9%) |
(17.2%) |
3.8 |
14.3% |
33.8% |
0.3x |
Buy |
|
KCB Group*** |
53.3 |
49.9 |
(6.3%) |
12.1% |
61.4 |
7.0% |
30.0% |
1.3x |
Buy |
|
Jubilee holdings |
360.0 |
350.3 |
(2.7%) |
(13.5%) |
418.5 |
2.6% |
22.1% |
0.9x |
Buy |
|
CIC Group |
3.0 |
3.2 |
6.3% |
(20.5%) |
3.8 |
4.0% |
21.7% |
1.1x |
Buy |
|
Britam |
7.0 |
7.4 |
6.0% |
(30.2%) |
8.8 |
0.0% |
18.6% |
0.7x |
Accumulate |
|
Liberty Holdings |
9.7 |
10.3 |
6.2% |
(24.7%) |
11.3 |
4.9% |
14.6% |
0.7x |
Accumulate |
|
NCBA Group |
39.5 |
34.9 |
(11.7%) |
7.7% |
37.9 |
4.3% |
13.1% |
0.7x |
Accumulate |
|
Equity Group*** |
46.5 |
48.9 |
5.1% |
7.5% |
53.0 |
4.1% |
12.6% |
1.9x |
Accumulate |
|
Standard Chartered |
214.8 |
202.3 |
(5.8%) |
2.7% |
208.0 |
9.4% |
12.2% |
1.6x |
Accumulate |
|
Barclays Bank*** |
13.5 |
12.7 |
(5.9%) |
0.0% |
12.6 |
8.7% |
7.7% |
1.7x |
Hold |
|
Co-op Bank*** |
15.8 |
15.7 |
(0.6%) |
(16.8%) |
15.0 |
6.4% |
1.9% |
1.3x |
Lighten |
|
Stanbic Holdings |
110.5 |
110.0 |
(0.5%) |
5.8% |
100.5 |
4.4% |
(4.3%) |
1.2x |
Sell |
|
HF Group |
7.2 |
7.2 |
0.0% |
27.1% |
2.8 |
0.0% |
(61.7%) |
0.3x |
Sell |
|
*Target Price as per Cytonn Analyst estimates **Upside / (Downside) is adjusted for Dividend Yield ***Banks in which Cytonn and/or its affiliates are invested in |
|||||||||
We are “Positive” on equities for investors as the sustained price declines has seen the market P/E decline to below its historical average. We expect increased market activity, and possibly increased inflows from foreign investors, as they take advantage of the attractive valuations, to support the positive performance.
During the week, ICEA Lion Asset Management, a Kenya based fund manager, signed an agreement to acquire Stanlib Kenya, another Kenya based fund manager, for an estimated Kshs 1.5 bn for a 100% stake. ICEA Lion is acquiring Stanlib Kenya from South Africa based Liberty Holdings Ltd, who in their FY’2018 Annual Report announced they would be selling majority stakes in their asset-management operations in East and West Africa, and Liberty Health and Liberty Africa’s Insurance short-term insurance businesses in Malawi and Namibia; as the company pushes ahead with plans to improve profitability and win back market share by focusing on the South African market.
Stanlib Kenya had earnings of Kshs 65.8 mn for the H1’2019 period, which implies that if the transaction is carried at the estimated value of Kshs 1.5 bn, the transaction will be carried out at a P/E ratio of 11.4x. The P/E ratio is 53.8% lower than the average P/E multiple of other similar transactions in Kenya. Other similar transactions carried out in the past include the acquisition of a 100% stake in ApexAfrica Capital by Axis, a Mauritian private equity fund in 2015 for Kshs 470.0 mn, translating to a P/E multiple of 40.2x, and the 90.9% acquisition of GenAfrica Asset Managers Ltd by Kuramo Capital, a New York based investment management firm focused on alternative investments in frontier and emerging markets, in two different transactions in 2018, for Kshs 2.9 bn, translating to a P/E multiple of 23.6x. The table below summarizes the details of the transactions:
|
Summary of Transactions |
|||||||||
|
Asset Manager Acquired |
Seller |
Acquirer |
Earnings at Acquisition (Kshs mn) |
Acquisition Stake |
Transaction Value (Kshs mn) |
P/E Multiple |
Date |
AUM (Kshs bn) *** |
Price to AUM % |
|
Apex Africa |
Founding Shareholders |
Axis (Mauritius) |
11.7 |
100.0% |
470 |
40.2x |
Aug 2015 |
N/A |
N/A |
|
GenAfrica |
Centum Investments |
Kuramo Capital |
134.2 |
73.4% |
2,324.20 |
23.6x |
Aug 2018 |
153.1 |
2.1% |
|
GenAfrica |
Management and Staff |
Kuramo Capital |
134.2 |
17.5% |
554.2 |
23.6x |
Sep 2018 |
153.1 |
2.1% |
|
Stanlib Kenya |
Liberty Holdings Ltd |
ICEA Lion |
131.7* |
100.0% |
1,500.0** |
11.4x |
Nov 2019 |
106.0 |
1.4% |
|
Average |
72.7% |
24.7x |
1.9x |
||||||
|
*Annualized H1’2019 Pretax Earnings **Estimated transaction value *** Estimated total AUM at transaction date |
|||||||||
The acquisition by ICEA Lion is strategic, given;
- It will cement ICEA Lion’s position as the second-largest Unit Trust Fund Manager with combined assets under management of Kshs 9.6 bn as at H1’2019, coming only second to CIC Asset Managers, and increase their retirement benefits assets under management by approximately Kshs 104.0 bn,
- The transaction will see ICEA Lion diversify to the listed property market with the assets being acquired by ICEA Lion including the investment management mandates and all rights, obligations, and benefits in connection with, Stanlib's role as Promoter and REIT Manager in relation to the Fahari I-REIT,
- The expected growth of the equities market in Kenya and Sub-Saharan Africa, driven by product diversification, new listings, and continued investor interest fuelled by existing low valuations in sections in the market such as the financial services, and,
- The increasing number of institutional and retail investors in Kenya and Sub-Saharan Africa and the assets under their management. In Kenya, the retirement benefits assets under management grew by 8.0% to Kshs 1,166.6 bn in 2018 from Kshs 1,080.1 bn in 2017, an indicator of the growing opportunity for asset managers in Kenya.
Private equity investments in Africa remain robust as evidenced by the increasing investor interest, which is attributed to; (i) rapid urbanization, a resilient and adapting middle class and increased consumerism, (ii) the attractive valuations in Sub Saharan Africa’s private markets compared to its public markets, (iii) the attractive valuations in Sub Saharan Africa’s markets compared to global markets, and (iv) better economic projections in Sub Sahara Africa compared to global markets. We remain bullish on PE as an asset class in Sub-Sahara Africa. Going forward, the increasing investor interest and a stable macro-economic environment will continue to boost deal flow into African markets.
- Industry Reports
During the week, the Kenya National Bureau of Statistics (KNBS) released the Leading Economic Indicators (LEI) September 2019, highlighting the continued growth of the hospitality sector. The key take-outs were;
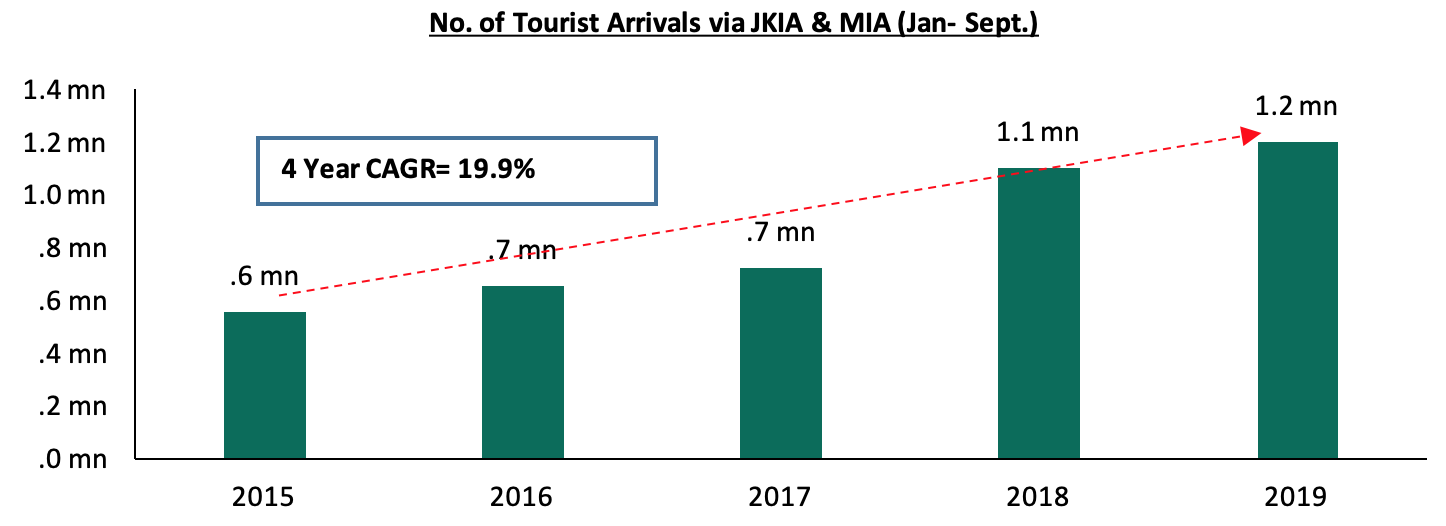
- The total number of visitors arriving through Jomo Kenyatta (JKIA) and Moi International Airports (MIA) increased by 5.4% from 1.1 mn persons for the period between January to September 2018 to 1.2 mn persons during the same period in 2019. We attribute the continued growth of the sector to the calm political environment and the improved security, which have continued to boost tourists’ confidence in the country and thus, making it a preferred travel destination for both business and holiday travelers.
Source: KNBS
- The quantity of cement consumed dropped by 0.5% from 3.93 mn metric tonnes for the period between January and August 2018 to 3.91 mn metric tonnes during the same period in 2019. The reduction in consumption of cement illustrates reduced activities in the construction sector, which has been crippled by the tough economic environment. However, with the launch of infrastructural projects such as the Western bypass and the Standard Gauge Railway Phase 2, we expect the consumption to increase in the coming months.
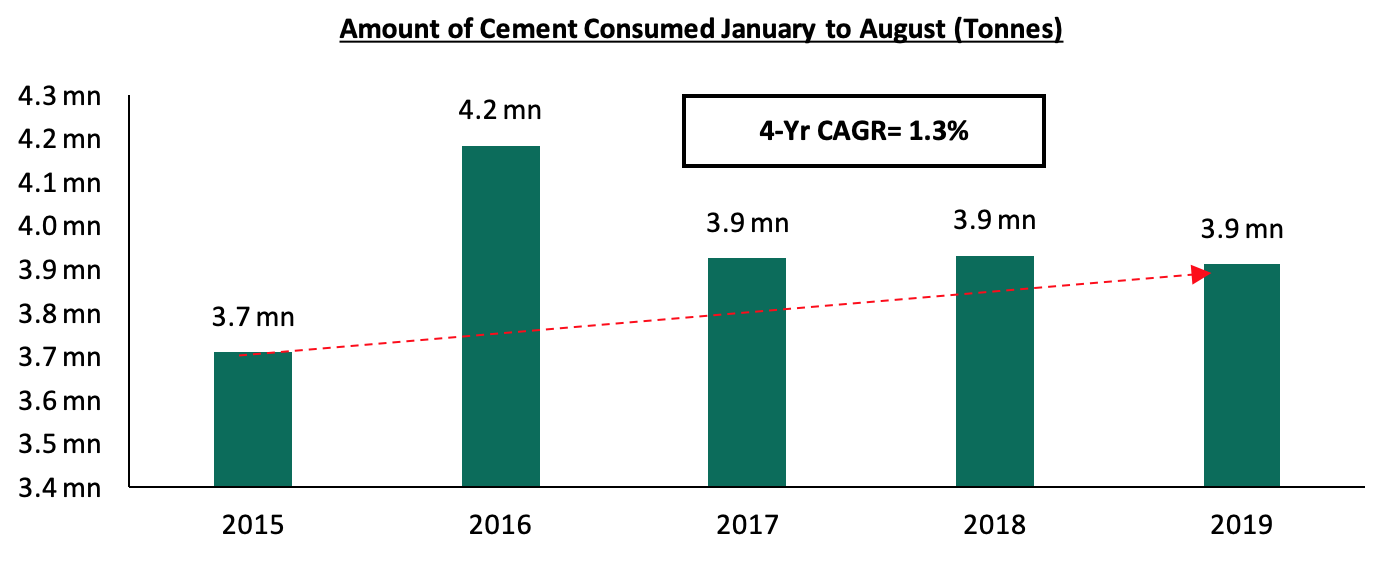
Despite the continued growth of the hospitality sector, the real estate sector continues to record a slowdown in development activities as evidenced by the above statistics. We attribute this mainly to the tough economic environment and surplus supply in the retail, commercial office, and high-end residential sectors and thus have a neutral outlook for the sector. However, we have a positive outlook for the hospitality sector and mid-end and low-end residential sector, as we expect improved performance boosted by the demand for hospitality services and the continued focus on the provision of affordable housing, respectively.
The Kenya National Bureau of Statistics also released the 2019 Kenya Population and Housing Census Volume I, highlighting a 2.2% yearly growth in the last decade. The key take-outs were;
- The current total population stands at 47.6 mn, a 2.2% growth rate from the previous 37.7 mn as at 2009, indicating a decline in the inter-censual growth rate by 0.7% points from 2.9% in 2009,

- The total number of households came in at 12.1 mn, with the average household size declining to 3.9 in 2019 from 4.2 in 2009. This indicates that households have become slightly smaller, in terms of the number of people, in the last 10 years,
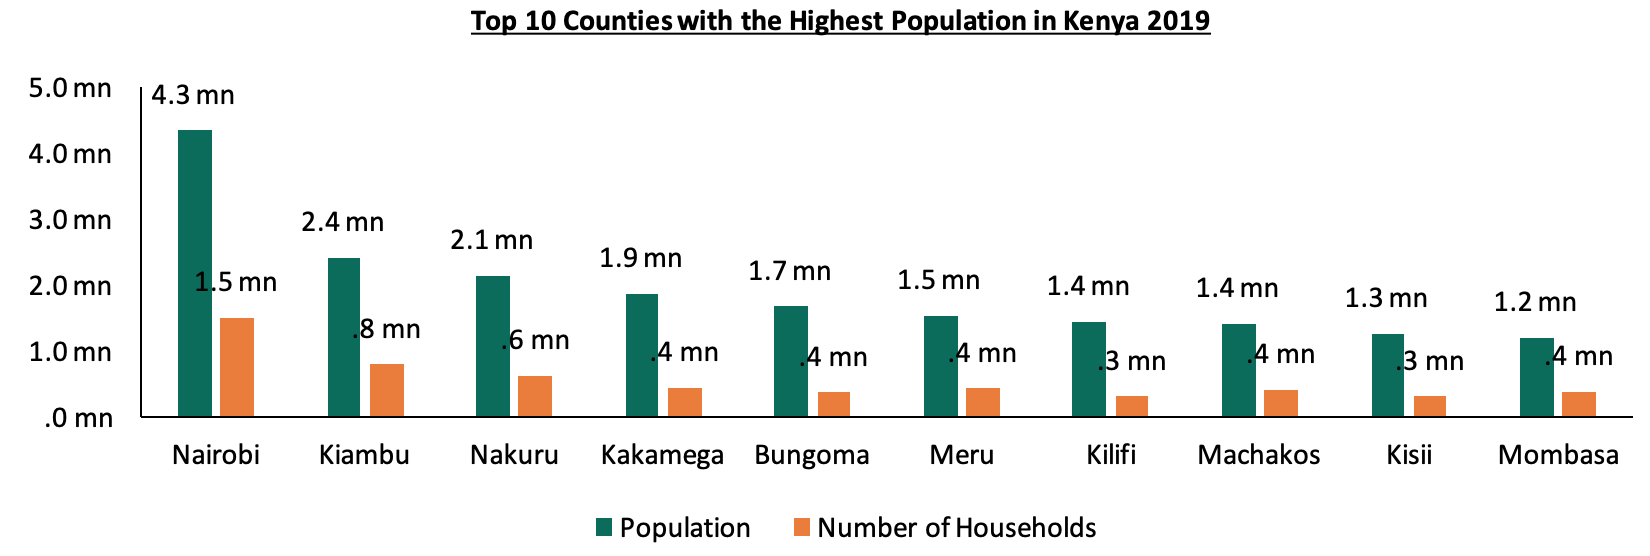
- At the county level, Nairobi, Kiambu and Nakuru counties recorded the highest population at 4.3 mn, 2.4 mn and 2.1 m, respectively, while the number of households stood at 1.5 mn, 0.8 mn and 0.6 mn, respectively
Source: Kenya National Bureau of Statistics, 2019
The above demographics is an indication of the continued growth of Kenya’s population, relatively faster at 2.2%, compared to the global average at 1.2%, and translates to continued demand for public utilities, infrastructural facilities, shopping outlets and entertainment facilities. For the real estate sector, this will fuel the continued demand for property both for residential purposes and for investment. According to the National Housing Corporation, Kenya had a housing deficit of approximately 2.0 mn units as at 2018, and this continues to grow by approximately 200,000 units annually, yet the incoming supply is at approximately 50,000 units annually. We thus expect the recently released statistics to prompt the need for both the public and private sectors to focus on provision of housing to accommodate the growing population, in addition to providing other complimentary facilities such as shopping outlets, hospitality facilities and utilities such as water and electricity.
For counties, we expect growth in demand for property mainly in Nairobi, Kiambu, and Nakuru counties that recorded the highest population. Investors are likely to focus on such areas in a bid to leverage from the high population, which means relatively high demand for property. We also expect these counties to be target areas for infrastructural improvement by the government aimed at serving the population and relieving pressure on the available facilities. This will eventually open up the areas more for development thus attract real estate activities.
- Residential Sector
During the week, the Finance Act, 2019 (the Act) was assented to by the President. In addition to the Act introducing policy and taxation measures for revenue generation in the financial year 2019/2020 for government’s expenditure, it as well focused on supporting the Big Four Agenda, mainly the provision of affordable housing. The main amendments made with regard to this pillar include;
For home buyers:
- Inclusion of Fund Managers or Investment Banks registered under the Capital Markets Act as approved institutions which can hold deposits of a Home Ownership and Savings Plan (HOSP), in addition to adoption of investment guidelines issued by the Capital Markets Authority (CMA) to guide investment of deposits held in a registered HOSP. This is in addition to the previously approved prudential guidelines issued by the Central Bank of Kenya. This thus means that inspiring home owners can now make savings for purchase of a home through Money Market Funds, through which their money gains interest over time, with the current money market fund yield averaging at 10.0%. This lightens the burden for the homeowners who will also pay rent for the house they will be living in during the construction period, in addition to benefiting from the tax rebates associated with the HOSP program. Please see our topical on Home Ownership Savings Plan, "HOSP" Schemes in Kenya for more information on how the HOSP program operates,
- Stamp duty exemption on the transfer of a house constructed under the affordable housing scheme from the developer to the National Housing Corporation. This exemption will relieve the finance burden on home buyers who would have otherwise incurred the cost while buying the houses, and would likely result in the units being unaffordable,
- Income tax exemption for withdrawals from the National Housing Development Fund (NHDF) to purchase a house by a first time home owner. With this change, we expect individuals making savings through the Fund to enjoy the tax break thus reduced financial burden,
For developers:
- Exemption of goods supplied for the direct and exclusive use in the construction of houses under the affordable housing scheme (AHS) from Value Added Tax (VAT). This exemption shall be subject to the AHS approval by the Cabinet Secretary (CS) for Finance. Currently, the tax on imports stands at approximately 25% of the value of the goods,
- Exemption of companies implementing projects under the affordable housing scheme from the application of thin capitalization rules,
- Reduction of Import Declaration Fee (IDF) from the previous 2.0% to 1.5% on inputs for the construction of houses under the affordable housing scheme approved by the Cabinet Secretary for Finance.
Others include:
- Exemption of the income of the National Housing Development Fund (NHDF) from income tax, and this we expect to enhance easier operation and efficiency of the Fund. Please see our topical on the National Housing Development Fund for more details on the structure and operationalization of the Fund.
The above tax and policy changes, which will be effective as from 1st January 2020, are an indication of the continued government focus on promoting the affordable housing agenda by empowering both inspiring homeowners and private sector developers, through offering an extensive list of incentives. We thus expect more potential homeowners to join the program given the significantly reduced financial burden in the strive towards homeownership, and developers and other private sector players taking up affordable housing projects as they are bound to maximize on the reduced costs. We, therefore, recommend that potential home buyers and developers look into ways of leveraging on the discussed incentives as they stand to benefit. Specifically, we recommend that potential home buyers look into making savings through the HOSP program, especially with the option of doing so through money market funds, which offers a competitive interest rate of up to 10.0%, in addition to being a flexible platform whose initial investments can be as low as Kshs 1,000.
During the week, the government announced that the first lottery on the Park Road affordable housing project in Ngara was set to be conducted at the end of November 2019, following the completion of the first phase of the project comprising of 228 housing units. Previously registered homeowners were thus instructed to review their income profiles and update their details on the boma yangu portal ahead of the planned lottery-based allocation. Since the launch of the Big Four Agenda, the initiative has recorded notable progress, with; (i) growing aggregate demand as Kenyans continue to register for the units, (ii) financial backing from various international and private institutions towards support of homebuyer financing, and (iii) government incentives listed previously, meant to boost offtake. However, despite the above factors the initiative has, continued to face delays with regards to operationalization of; (i) the Kenya Mortgage Refinancing Company due to lack of licensing from the Central Bank of Kenya despite having drafted the facility’s regulations in February 2019, which is key to end-buyers, and (ii) the National Development Housing Fund due to legal oppositions. Nevertheless, we expect the allocation of the Park Road project to homeowners to boost confidence in the government’s affordable housing initiative, given that the Phase I of the project is the first to be completed and handed over to the owners, and thus lure more inspiring homeowners to join the program. Some other affordable housing projects in the pipeline include; 2,720 units River Estate in Ngara, 1,434 units Pangani Regeneration Project that are ongoing, among others.
Vaal Real Estate, an Egyptian and Turkish owned developer, launched a 15 floor residential development along Elgeyo Marakwet road in Kilimani Area, Nairobi. The development dubbed “Wilma Towers” will comprise of 227- 1, 2 and 3 bedrooms units, built on half an acre, and is set for completion in October 2020. The units, sized at 45 sqm, 80 sqm and 100 sqm, are priced at Kshs 4.9 mn, Kshs 11.6 mn and Kshs 14.6 mn, respectively, which translates to an average of Kshs 133,296 per SQM. The price is 8.6% higher than the Kilimani market average of Kshs 121,845 per SQM as per the Nairobi Metropolitan Area Residential Report 2018/2019.
All values in Kshs unless stated otherwise
|
Nairobi Metropolitan Area Apartments Performance 2018/2019 |
|||||||
|
Area |
Average Price per SQM |
Average Rent per SQM |
Average Annual Uptake |
Average Occupancy |
Average Rental Yield |
Average Price Appreciation |
Total returns |
|
Riverside |
135,813 |
737 |
22.9% |
76.2% |
5.1% |
0.9% |
5.9% |
|
Loresho |
113,122 |
479 |
20.9% |
95.4% |
4.3% |
1.4% |
5.7% |
|
Kilimani |
121,845 |
852 |
30.4% |
76.8% |
5.6% |
0.0% |
5.6% |
|
Westlands |
145,042 |
665 |
27.8% |
80.4% |
5.2% |
0.2% |
5.4% |
|
Parklands |
123,146 |
744 |
23.3% |
85.7% |
5.1% |
(0.3%) |
4.8% |
|
Kileleshwa |
138,619 |
846 |
28.1% |
81.7% |
4.2% |
0.0% |
4.2% |
|
Upper Mid-End Average |
129,598 |
720 |
25.6% |
82.7% |
4.9% |
0.4% |
5.3% |
|
|||||||
Source: Cytonn Research 2019
Kilimani area continues to record increased activities, attributed to strong investor demand fuelled by the relatively high returns at approximately 5.6%, compared to the upper mid-end market average at 5.3%, and annual unit uptake at 30.4%, compared to market average at 25.6%. This has mainly been boosted by; (i) its proximity to commercial nodes such as Upperhill, CBD and Westlands, (ii) good infrastructure and ease of access in addition to the ongoing dualling of Ngong Road, (iii) availability of social amenities such as shopping facilities such as The Junction Mall, Adlife Plaza and Prestige Plaza, and (iv) High levels of security as the area is situated within the UN blue zone, which attracts expatriates. However, key to note, from our analysis, Kilimani market unit prices stagnated in 2018/2019, attributed to the current oversupply of apartments in the upper mid-end market and resultant low occupancy rates. Therefore, despite the above factors, we expect the market to record minimal development activities.
- Listed Real Estate
During the week, ICEA Lion Asset Management, a Kenya based fund manager, signed an agreement to acquire Stanlib Kenya, a Kenya based fund manager as well, from South Africa based Liberty Holdings Ltd. The implementation of the Agreement is subject to the fulfillment of conditions, which include, but are not limited to, the approval of the Competition Authority of Kenya, the Capital Markets Authority of Kenya and the Trustee, by no later than 29 February 2020. According to Stanlib Fahari I- REIT Earnings update- H1’2019, the firm’s total assets comprised of investment property valued at Kshs 3.4 billion and cash reserves of Kshs 235 million. The divestment is part of an extensive review of its operations, which according to online sources, has been informed by low historical returns, capital requirements, and competition. The Fahari I- REIT performance has been on a decline since its listing in November 2015, trading at Kshs 8.8 on 8th November 2019, 56% lower than its initial value of Kshs 20.0 per unit. The poor performance of the REIT is attributable to;
- Inadequate investor knowledge,
- The opacity of the exact returns from the underlying assets,
- The negative sentiments currently engulfing the sector given the poor performance of Fahari I-REIT, and
- Lack of institutional support for REITs.
In our view, the subject announcement is likely to cause unsteadiness in the market thus causing investors to adopt a wait and see attitude awaiting closure on the sale, and hence result in poor performance of the REIT on the bourse. If successful, we still do not foresee improvement of the performance of the I- REIT, unless the above factors resulting in its poor performance are addressed.
Despite REITs not being a popular product in the Kenya market evidenced by the poor performance of the Fahari I-REIT mentioned above, the government of Kenya continues to make strides towards promoting the development of the product. During the week, the Finance Act, 2019 (the Act) was assented to by the President, highlighting a plus for the REIT market. As per the approved amendments, the income of REITs investee companies has been exempted from income tax, and this thus translates to higher profits for investees. Previously, only the income of REITs was exempt from corporation tax. This amendment aims at increasing the flexibility of REITs in making investments and thus attract more investors into buying into the product.
Other highlights during the week;
- GCG India and East Africa, an Italian Company, announced that it had set up a Kshs 500 mn plant in Kenya targeting to produce bottle caps for alcohol and beverage manufacturers across East Africa. Guala Closures East Africa (GCEA) is a wholly-owned member of the Guala Closures Group of companies (GCG), and also supplies the caps to more than five alcohol and beverage companies in Kenya, Uganda, and Tanzania. The above is an indication that Kenya continues to attract investors and multinationals, and this we attribute to; (i) recognition of Kenya as a regional hub, (ii) infrastructural improvement, (iii) political stability and (iv) the ease of doing business with the World Bank ranking Kenya as #56 in 2019, from #61 in 2018 out of 190 countries.
We expect the real estate sector to continue recording development activities fueled by the growth of the hospitality sector with the increasing entry of international arrivals, the continued focus on the affordable housing initiative, entry of multinationals, in addition to investor focus on selected markets in the residential sector.
Last year, we released the NMA Mixed-Use Developments (MUDs) Report 2018 that highlighted the performance of Mixed-Use Developments within the Nairobi Metropolitan Area in 2018. According to the report, MUDs performed better in 2018 recording average rental yields of 8.0%, 0.5% points higher than single-use themes average of 7.5%. Other than the retail sector, which recorded average rental yields of 8.5%, 1.0% lower than single-use retail, commercial office and residential themes within MUDs performed better with rental yields averaging at 8.2% and 5.6%, 0.3% and 0.6% points higher than single-use office and residential units which had market averages of 7.9% and 5.0%, respectively.
This week, we update our report based on research conducted in eight nodes within the Nairobi Metropolitan Area, comparing Mixed-Use Developments’ performance against the market performance of the residential, commercial office, and retail sectors as of September 2019. The report shall cover the following:
- Overview of Mixed-Use Developments (MUDs),
- Mixed-Use Developments Performance Summary in 2019, and
- Mixed-Use Developments Investment Opportunity and Outlook.
Section I: Overview of Mixed-Use Developments (MUDs)
A Mixed-Use Development (MUD) refers to a real estate development containing more than one real estate theme. Such a development would have two or more uses, that is, residential, retail, office, and hospitality, all in one location, and whose functions are to some degree physically and structurally integrated. These real estate developments can range from a single building to an entire neighborhood and aim to offer a variety of benefits such as housing, workplaces and other amenities within the same location. Mixed-Use Developments are designed to not only incorporate various types of real estate themes together but also complement them. Some of the major factors supporting the growth of Mixed-Use Developments include:
- Relatively Higher Developer Returns: Over the past two years, rental yields in sole use office and retail properties have been on a downward trajectory owing to an oversupply in the majority of the commercial nodes within Nairobi. This downturn in performance has resulted in less speculative investment leading to an upturn in the new trend of mixed-use developments MUDs which promise better-diversified portfolio and returns from a project mix comprising of sectors that perform differently in the market,
- Demographic Growth: According to the World Bank, Kenya’s urban population grows at an average annual rate of 4.3%. This is in comparison to the Sub-Saharan and global rates of 4.1% and 1.2%, respectively. The rapid population growth calls for innovative real estate solutions that promote operational synergies and accommodate the population pressures with themes that complement each other,
- Foreign Investments: Nairobi’s status as one of the top dynamic cities in the world, evidenced by rankings in JLL’s City Momentum Index Reports, continues to attract foreign investors with interests in emerging niches such as Mixed-Use Developments. For instance, Actis, a UK-based private equity firm is behind Garden City, along Thika Road, Aviation Industry Corporation of China (AVIC) is behind the upcoming Global Trade Centre in Westlands and also has ownership stake in Two Rivers Mall, the largest Mixed-Use Development in East and Central Africa, while UK-based Kiloran Development Group is behind the upcoming Beacon Mall, along Mombasa Road, and,
- Growth of the Middle Class: Kenya’s middle class continues to grow which means increased disposable income and demand for convenient lifestyles such as the ability to live, work and play in an environment that meets business, residential and social demands of modern lifestyles. This has created a niche for developers to connect workstations and residences promoting productivity and peak functionality to end buyers.
However, Mixed-Use Developments tend to face various challenges such as:
- High Development Costs: This is owing to the size and intricacies involved in incorporating various real estate themes together. This is coupled by soaring land prices in Nairobi and other urban areas, with a price per acre within Nairobi County standing at Kshs 134 mn as at September 2019, driven by high demand due to population pressures and infrastructural improvements, and,
- Inadequate Infrastructure: The rapid growth of urban populations against the backdrop of inadequate infrastructure means overreliance on insufficient infrastructures such as sewer systems and roads. Thus, Mixed-Use Developments tend to procure own forms of infrastructure such as water, sewerage systems, and reliable electricity, which means incurring huge costs.
Section II: Mixed-Use Developments Performance Summary in 2019
- Summary of Thematic Performance in MUDs in Comparison to General Market Performance
Mixed-Use Developments recorded average rental yields of 7.3%, 0.4% points higher than the respective single use retail, commercial office and residential themes with 6.9% in 2019. In 2019, retail, offices and residential spaces in MUDs recorded rental yields of 8.4%, 7.9% and 5.4%, respectively, compared to the single-use average of 8.0%, 7.7%, and 5.0%, respectively. This is attributed to increasing popularity for differentiating the mixed-use concepts due to convenience as a result of incorporated working, shopping and living spaces. However, MUDs recorded a 0.1% point y/y decline in performance to 7.3% in 2019 from 7.4% in 2018 attributed to a decline in effective demand and constrained consumer spending due to a tough financial environment as a result of the interest rates capping law that has since been repealed.
The table below shows the performance of single-use and mixed-use development themes between 2018 and 2019:
|
Thematic Performance of MUDs in Key Nodes 2018-2019 |
||||||
|
|
MUD Themes Average |
Single-Use Themes Average |
||||
|
|
Rental Yield % 2019 |
Rental Yield % 2018 |
Rental Yield % 2019 |
Rental Yield % 2018 |
∆ in y/y MUD Rental yields |
MUD vs Single-Use Rental Yield 2019 |
|
Retail |
8.4% |
8.5% |
8.0% |
9.5% |
(0.1%) |
0.4% |
|
Offices |
7.9% |
8.2% |
7.7% |
7.9% |
(0.3%) |
0.2% |
|
Residential |
5.4% |
5.6% |
5.0% |
5.0% |
(0.2%) |
0.4% |
|
Average |
7.3% |
7.4% |
6.9% |
7.5% |
(0.1%) |
0.4% |
|
*Market performance is as at Q3’2019
|
||||||
Source: Cytonn Research 2019
- Mixed-Use Developments Performance per Node
Kilimani was the best performing node recording average rental yields of 9.1% with the retail and office spaces recording rental yields of 9.6% and 8.4%, respectively, 1.2% points and 0.5% points higher than the sector average of 8.4% and 7.9%, respectively. The performance is driven by high occupancy rates in addition to premium rental rates charged as the area serves a prime commercial and affluent neighbourhood with areas such as Kileleshwa and Lavington, hosting a large portion of Nairobi’s high-end and upper-middle-class population.
Limuru Road was ranked second with average rental yields of 8.0%, largely driven by its attractiveness as a retail destination with malls such as Two Rivers. Mombasa Road and Eastlands were the worst performing areas recording rental yields of 5.7% and 5.5%, respectively attributed to low rental charges as a result of competition from informal Mixed-Use Developments.
The table below shows the performance of Mixed-Use Developments by node in 2019:
|
NMA Mixed-Use Developments Market Performance by Nodes 2019 |
|||||||||||||
|
|
Retail Performance |
Office Performance |
Residential Performance |
||||||||||
|
Location |
Price/SQFT |
Rent/SQFT |
Occup. (%) |
Rental Yield (%) |
Price/ SQFT |
Rent/SQFT |
Occup. (%) |
Rental Yield (%) |
Price/SQM |
Rent/SQM |
Ann. Uptake % |
Rental Yield % |
Avg. MUD yield |
|
Kilimani |
17,702 |
172 |
82.6% |
9.6% |
13,770 |
126 |
74.8% |
8.4% |
9.1% |
||||
|
Limuru Rd |
22,500 |
223 |
72.0% |
8.6% |
13,500 |
130 |
72.0% |
8.3% |
177,935 |
842 |
25.0% |
5.7% |
8.0% |
|
Karen |
23,333 |
163 |
85.0% |
7.3% |
13,380 |
137 |
86.0% |
10.6% |
215,983 |
821 |
26.7% |
4.6% |
8.2% |
|
UpperHill |
15,552 |
127 |
71.3% |
7.0% |
12,673 |
100 |
78.7% |
7.4% |
7.4% |
||||
|
Westlands |
15,876 |
172 |
72.8% |
9.6% |
12,917 |
113 |
68.7% |
7.1% |
204,603 |
810 |
31.0% |
4.8% |
7.4% |
|
Thika Rd |
26,250 |
200 |
84.5% |
8.3% |
13,890 |
128 |
71.0% |
8.0% |
161,910 |
640 |
30.1% |
4.8% |
6.0% |
|
Msa Rd |
19,200 |
150 |
68.0% |
6.4% |
13,200 |
100 |
52.0% |
4.7% |
171,304 |
722 |
23.0% |
5.1% |
5.7% |
|
Eastlands |
20,000 |
132 |
72.0% |
5.7% |
12,000 |
100 |
68.0% |
6.8% |
81,717 |
350 |
20.0% |
5.5% |
5.5% |
|
Average |
18,846 |
167 |
77.3% |
8.4% |
13,227 |
118 |
73.4% |
7.9% |
167,909 |
689 |
26.5% |
5.4% |
7.3% |
|
* Mixed-Use Developments in Kilimani and Upper Hill areas had no residential spaces
|
|||||||||||||
Source: Cytonn Research 2019
- Performance of Real estate Themes in MUDs versus Single-themed Developments’ Performance
In our Mixed-Use Development analysis, we looked into the performance of the retail, commercial office and residential themes:
- Retail Sector
Retail spaces in Mixed-Use Developments recorded average occupancy rates and rental yields of 77.3% and 8.4%, respectively, 2.2% points and 0.4% points higher than the single use retail market average of 75.1% and 8.0% in 2019, respectively. The better performance of retail spaces in Mixed-Use Developments is attributed to the convenience of the spaces as one-stop centres for consumers living and working in the area.
Kilimani and Westlands are the best-performing nodes in both single and Mixed-Use Development recording rental yields of 9.6% and 9.4%, respectively in mixed-use development themes. This is mainly attributed to the nodes serving the upper middle income and high-end population. Mombasa Road and Eastlands were the worst performers recording rental yields of 6.4% and 5.7%, respectively, a 2.0% and 2.7% points, lower than the MUD average of 8.4%, attributed to low rental charges as property managers look to attract smaller retailers.
The table below provides a summary of the performance of retail spaces in MUDs against market performance:
(All Values in Kshs Unless Stated Otherwise)
|
Performance of Retail in MUDs versus Single- Use Market Performance 2019 |
||||||||||
|
|
MUD Performance |
Single-Use Retail Performance |
||||||||
|
Location |
Rent/SQFT |
Occupancy (%) |
Rental Yield (%) |
Rent/SQFT |
Occupancy (%) |
Rental Yield (%) |
Rental Yield Difference |
|||
|
Kilimani |
172 |
82.6% |
9.6% |
170.4 |
87.2% |
9.9% |
(0.2%) |
|||
|
Westlands |
170 |
72.8% |
9.4% |
203.6 |
84.6% |
9.2% |
(0.5%) |
|||
|
Limuru Rd |
223 |
72.0% |
8.6% |
166.0 |
61.7% |
6.8% |
1.8% |
|||
|
Thika Rd |
200 |
84.5% |
8.3% |
165.4 |
73.5% |
7.5% |
0.9% |
|||
|
Upper Hill |
127 |
71.3% |
7.0% |
|||||||
|
Karen |
163 |
85.0% |
6.8% |
207.9 |
77.0% |
9.1% |
(2.3%) |
|||
|
Msa Rd |
150 |
68.0% |
6.4% |
148.1 |
64.0% |
6.3% |
0.1% |
|||
|
Eastlands |
132 |
72.0% |
5.7% |
145.0 |
74.5% |
7.5% |
(1.8%) |
|||
|
Average |
166 |
77.3% |
8.4% |
168.6 |
75.1% |
8.0% |
0.4% |
|||
|
* Single-Use retail performance is as at Q3’2019
|
||||||||||
Source: Cytonn Research 2019
- Commercial Office Space
Commercial office spaces in MUDs performed better than single-use office spaces recording rental yields of 7.9%, 0.2% points more than the former at 7.7% as at Q3’2019. The improved performance is attributed to the better quality of space and additional amenities offered in mixed-use developments compared to single-use office spaces. Karen and Kilimani were the best-performing office spaces in MUDs recording average rental yields of 10.6% and 8.4%, respectively, while Mombasa Road was the worst-performing recording occupancy rates and rental yields of 52.0% and 4.7%, respectively.
The table below shows the performance of office spaces in MUDs against the Single-Use commercial market in 2019:
(All Values in Kshs Unless Stated Otherwise)
|
Performance of Commercial Offices in MUDs versus Single- use Market Performance 2019 |
|||||||||
|
|
MUD Performance |
Single-Use Office Performance |
|
||||||
|
Location |
Price/SQFT |
Rent/SQFT |
Occupancy (%) |
Rental Yield (%) |
Price/ SQFT |
Rent/ SQFT |
Occup. (%) |
Rental Yield (%) |
Rental Yield Difference |
|
Karen |
13,380 |
137 |
86.0% |
10.6% |
13,665 |
111 |
84.6% |
9.0% |
1.6% |
|
Kilimani |
13,770 |
126 |
74.8% |
8.4% |
12,680 |
91 |
81.2% |
7.2% |
1.3% |
|
Limuru Rd |
13,500 |
130 |
72.0% |
8.3% |
13,833 |
116 |
79.6% |
9.2% |
(0.9%) |
|
Thika Rd |
13,890 |
128 |
71.0% |
8.0% |
12,600 |
88 |
80.9% |
6.6% |
1.5% |
|
Upper Hill |
12,673 |
100 |
78.7% |
7.4% |
12,397 |
98 |
81.5% |
7.6% |
(0.2%) |
|
Westlands & Parklands |
12,917 |
113 |
68.7% |
7.1% |
12,369 |
101 |
80.7% |
8.5% |
(1.4%) |
|
Msa Rd |
13,200 |
100 |
52.0% |
4.7% |
11,400 |
73 |
68.7% |
5.7% |
(1.0%) |
|
Average |
13,227 |
118 |
73.4% |
7.9% |
12,638 |
96 |
80.5% |
7.7% |
0.2% |
|
*Limuru Road includes Gigiri area * Single-Use office performance is as at Q3’2019
|
|||||||||
Source: Cytonn Research 2019
- Residential Space
Residential units in Mixed-Use Developments recorded average rental yields of 5.4% in 2019, 0.4% points more than the single use residential market rental yields of 5.0% as at Q3’2019. Residential units in MUDs also recorded average price and rent per SQM of Kshs 157,909 and Kshs 689, respectively, above the single- use market average of Kshs 112,003 and Kshs 540, respectively. Thika Road was the best performing area recording rental yields of 6.4% driven by higher uptake of 30.1% compared to the average uptake of 26.5% attributed to increased demand for units in the area boosted by affordability in comparison to the upper markets.
The table below summarizes the performance of residential spaces in MUDs against the single- use market in 2019:
(All Values in Kshs Unless Stated Otherwise)
|
Performance of Residential Units in MUDs versus Single- Use Market Performance 2019 |
|||||||||
|
|
MUD Performance |
Single-Use Residential Performance |
|
||||||
|
Location |
Price/SQM |
Rent/SQM |
Uptake % |
Rental Yield % |
Price/SQM |
Rent/SQM |
Uptake % |
Rental Yield % |
Rental Yield Difference |
|
Thika Rd |
124,045 |
640 |
30.1% |
6.4% |
79,478 |
433 |
17.6% |
5.8% |
0.6% |
|
Limuru Rd |
177,935 |
842 |
25.0% |
5.7% |
98,979 |
507 |
20.4% |
4.9% |
0.8% |
|
Eastlands |
81,717 |
350 |
20.0% |
5.5% |
79,802 |
362 |
24.0% |
5.5% |
0.0% |
|
Msa Rd |
171,304 |
722 |
23.0% |
5.1% |
80,290 |
368 |
22.1% |
4.9% |
0.2% |
|
Westlands |
204,603 |
810 |
31.0% |
4.8% |
145,299 |
806 |
24.2% |
4.8% |
(0.0%) |
|
Karen |
215,983 |
821 |
26.7% |
4.6% |
188,172 |
763 |
20.9% |
4.2% |
0.4% |
|
Average |
157,090 |
689 |
26.5% |
5.4% |
112,003 |
540 |
21.5% |
5.0% |
0.4% |
|
* Single-Use residential performance is as at Q3’2019 • Residential spaces in Mixed-Use Developments recorded rental yields of 5.4% in 2019, 0.4% points more than the single-use residential market rental yields of 5.0% • Thika Road and Limuru Road were the best performing areas recording rental yields of 6.4% and 5.7%, respectively |
|||||||||
Source: Cytonn Research 2019
Section III: Mixed-Use Developments Investment Opportunity and Outlook
The table below summarizes our outlook on Mixed-Use Developments (MUDs), where we look at the general performance of the key sectors that compose MUDs i.e. retail, commercial office and residential and investment opportunities that lies in such the themes:
|
Mixed-Use Developments (MUDs) Outlook |
||
|
Sector |
2019 Sentiment and Outlook |
2019 Outlook |
|
Retail |
|
Neutral |
|
Office |
|
Neutral |
|
Residential |
|
Positive |
|
Outlook |
The outlook for Mixed-Use Developments (MUDs) is neutral mainly due to attractive returns compared to single-use themes. However, the sector remains constrained mainly due to oversupply of space by 2.8 mn SQFT and 5.2 mn SQFT in the retail and office sectors. The investment opportunity within the Nairobi Metropolitan Area is in areas with high returns such as Kilimani and Limuru Road recording rental yields of 9.1% and 8.5%, respectively. |
|
Source: Cytonn Research 2019
Despite the 0.1% point drop in rental yields performance to 7.3% in 2019 from 7.4% in 2018, MUDs still offer an attractive investment as the development provides diversified revenue streams for property owners and improves the overall return on investment. We expect investors’ returns to be dependent on the composition of mixed-use concepts due to sectors such as retail and office having an oversupply of 2.8 mn SQFT and 5.2 mn SQFT, respectively as at 2018. We recommend Kilimani and Limuru Road as the major investment zones given the relatively high rental yields of 9.1% and 8.5%, respectively, above the market average of 7.3%. The investment strategy for mixed-use developments lies in incorporating differentiated concepts such as serviced apartments and offices which provide attractive returns of 6.4% and 13.5%, respectively, compared to the unserviced apartments and office space yields of 5.1% and 7.9%, respectively, as at Q3’2019.
Disclaimer: The views expressed in this publication are those of the writers where particulars are not warranted. This publication is meant for general information only and is not a warranty, representation, advice or solicitation of any nature. Readers are advised in all circumstances to seek the advice of a registered investment advisor.

