Nyeri Real Estate Investment Opportunity 2019, & Cytonn Weekly #08/2019
By Cytonn Research Team, Feb 24, 2019
Executive Summary
Fixed Income
T-bills remained over-subscribed during the week, with the overall subscription rate coming in at 104.6%, a decline from 140.3%, recorded the previous week. The decline in subscription is partly attributable to the 5-year and 10-year bond sale that closed this week. There was mixed performance, with the 91-day paper recording an increase in subscription rate to 127.6%, from 121.5% recorded the previous week, while the 182-day and 364-day papers recorded declines in subscription rate to 115.7% and 84.3%, from 117.1% and 170.9%, recorded the previous week, respectively. During the week, the National Treasury released the budgetary review for the first half of the financial year 2018/2019, which indicated revenue collection for the period was 92.9% of the target, a slight improvement from the 91.2% recorded in H1’2017/2018 reflecting the impact of the government’s efforts of improving revenue collection. The National Treasury also announced its plan to re-open the sale of the mobile-based infrastructure bond M-Akiba as it looks to collect a total of Kshs. 1.0 bn in 2019;
Equities
During the week, the equities market was on a declining trend, with NASI, NSE 20 and NSE 25 declining by 1.9%, 2.2% and 2.8%, respectively, taking their year-to-date (YTD) gains to 9.8%, 5.1% and 9.6%, respectively. The Central Bank of Kenya (CBK) has published draft regulations for mortgage refinance companies (MRCs), setting the stage for creation of a State-backed firm that will advance cash to banks for onward lending to home buyers, in line with the President’s Big 4 Agenda of delivering 500,000 affordable housing units by 2022;
Private Equity
In the Education sector, the African Management Initiative (AMI), a Pan-African company focused on skills development and workplace learning announced the close of a USD 1.8 mn Series A funding round aimed at promoting in-person as well as on-the-job training for staff in African countries. The firm, that has so far conducted skill development programmes for various companies such as the Mastercard Foundation, Shell Foundation, Equity Group and Kenya Commercial Bank (KCB), targets to enhance its innovative mobile-based learning platform and widen its market coverage in Africa. In the Hospitality sector, Inside Capital Partners, a Mauritian independent private equity manager announced a commitment to invest USD 7.5 mn in Latitude Hotels Group, an African lifestyle hospitality Group based in Zambia, for an undisclosed stake;
Real Estate
During the week, Kenya Bankers’ Association and Knight Frank released their Q4’2018 and H2’2018 reports, respectively. The KBA-HPI Index report indicated a marginal price increase in house prices in the overall market by 1.5% in the last quarter of 2018. However, as per the Knight Frank Kenya Market Update report, prime residential markets registered a 4.5% decline in prices in 2018, whereas oversupply continued to affect performance of commercial office and retail sectors in various Nairobi sub-markets. In addition, the real estate sector along Kiambu Road is set to shape up following Kiambu County’s Senator Paul Wamatangi announcement of plans to revamp Kiambu Road into a dual carriageway;
Focus of the Week
In line with our regional coverage strategy, we continue to carry out research in various markets in Kenya, with our focus areas being in counties such as Nakuru, Mombasa, Kisumu, Laikipia, Meru, Nyeri and Uasin Gishu. In January 2018, we published the Nyeri Investment Opportunity 2017, highlighting that the area recorded an average rental yield and capital appreciation of 8.8% and 17.3%, respectively. This week we revisit the area by highlighting its performance informed by the 2019 research. Nyeri market recorded improved performance with the average rental yield coming in at 5.1% for the residential sector, 12.1% in the commercial sector and capital appreciation of 19.1%. This is attributed to a continued increase in the property value fueled by demand and a general increase in economic activities, despite the limited number of institutional developers especially in the residential sector.
- Our regulated affiliate, Cytonn Asset Managers Limited, which is regulated by both the Capital Markets Authority and the Retirement Benefits Authority, has been granted a Real Estate Investment Trust (REIT) license by CMA. Read full press release here.;
- On Tuesday 19th February 2019, Cytonn Real Estate, the development affiliate of Cytonn Investments, held a groundbreaking ceremony for the Applewood project, their signature and exclusive Kshs 2.5 bn residential gated community, located in Miotoni, Karen. Read about the project here;
- Moses Njuguna - a unit Manager was on Kameme T.V. to give insights on the performance of the National Land Commission as their tenure ended. Watch Moses here;
- Following the completion and handover of Amara Ridge, we have now launched Applewood, our Kshs 2.5 bn residential development located in Miotoni, Karen. This signature development shall comprise luxury homes, each sitting on 1/2 acre. We invite you to the exhibition of Applewood which will be at the Amara Ridge Clubhouse (Location pin: https://goo.gl/maps/B3GVnu8pHyn) from 9:00 am to 5:00 pm daily and will end on 28th Feb 2019.
Call 0709 101 000 or email resales@cytonn.com to reserve a villa! See Video here; - We continue to hold weekly workshops and site visits on how to build wealth through real estate investments. The weekly workshops and site visits target both investors looking to invest in real estate directly and those interested in high yield investment products to familiarize themselves with how we support our high yields. Watch progress videos and pictures of The Alma, Amara Ridge, and The Ridge. Key to note is that our cost of capital is priced off the loan markets, where all-in pricing ranges from 16.0% to 20.0%, and our yield on real estate developments ranges from 23.0% to 25.0%, hence our top-line gross spread is about 6.0%. If interested in attending the site visits, kindly register here;
- We continue to see very strong interest in our weekly Private Wealth Management Training (largely covering financial planning and structured products). The training is at no cost and is open only to pre-screened participants. We also continue to see institutions and investment groups interested in the training for their teams. Cytonn Foundation, under its financial literacy pillar, runs the Wealth Management Training. If interested in our Private Wealth Management Training for your employees or investment group, please get in touch with us through wmt@cytonn.com. To view the Wealth Management Training topics, click here;
- For recent news about the company, see our news section here;
- We have 10 investment-ready projects, offering attractive development and buyer targeted returns of around 23.0% to 25.0% p.a. See further details here: Summary of Investment-Ready Projects;
- We continue to beef up the team with ongoing hires for Financial and Real Estate Advisors for our offices in Nairobi, Nakuru, Kisumu, and Nyeri. Visit the Careers Section on our website to apply;
T-Bills & T-Bonds Primary Auction:
T-bills remained over-subscribed during the week, with the overall subscription rate coming in at 104.6%, a decline from 140.3%, recorded the previous week. The decline in subscription is partly attributable to the 5-year and 10-year bond sale that closed during the week. There was mixed performance, with the 91-day paper recording an increase in subscription rates to 127.6%, from 121.5%, recorded the previous week, while the 182-day and 364-day papers recorded declines in subscription to 115.7% and 84.3%, from 117.1% and 170.9%, recorded the previous week, respectively. The yields on the 91-day, 182-day, and 364-day papers declined by 5.3 bps, 10.8 bps and 5.9 bps to 7.0%, 8.4%, and 9.5%, respectively. The acceptance rate improved to 91.1% from 90.9% recorded the previous week, with the government accepting Kshs 22.9 bn of the Kshs 25.1 bn worth of bids received, an indication that bids were largely within ranges the Central Bank of Kenya (CBK) deemed acceptable.
This week, the government issued a 5-year tenor (FXD1/2019/5) and a 10-year tenor (FXD1/2019/10) bond, which recorded an over-subscription of 156.5%, mainly attributable to the relative favorable liquidity conditions. The yields came in at 11.3% and 12.4% for the 5-year and 10-year bonds, respectively, in line with our expectations, with the government accepting Kshs 53.4 bn out of the Kshs 78.3 bn worth of bids received against Kshs 50.0 bn on offer, translating to an acceptance rate of 68.2%.
Liquidity:
The average interbank rate increased to 1.9% from 1.4% the previous week, while the average volumes traded in the interbank market declined by 41.6% to Kshs 10.4 bn, from Kshs 17.8 bn the previous week. The low interbank rate points to improved liquidity conditions, with the rate declining to an 8-year low of 1.2% as at 14th February 2019 partly attributed to government payments and net redemption of government securities.
Kenya Eurobonds:
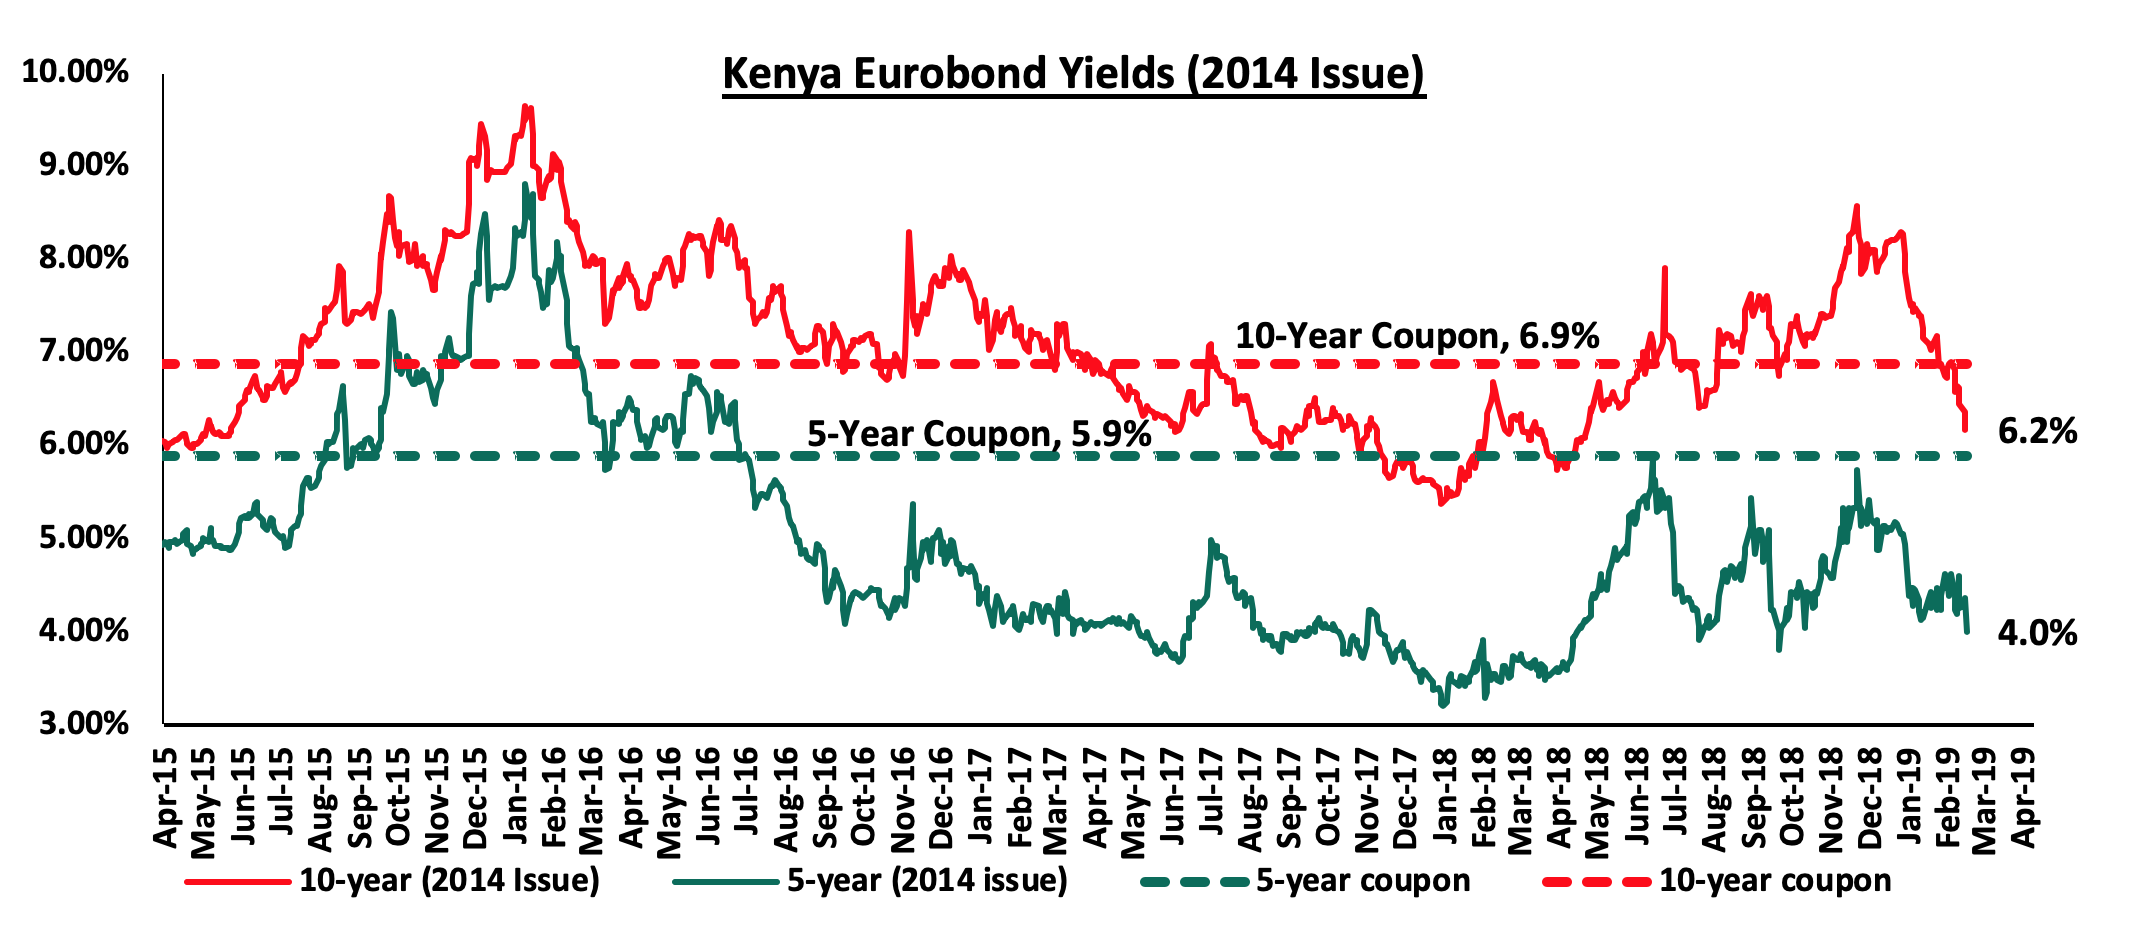
According to Bloomberg, the yields on the 5-year and 10-Year Eurobonds issued in 2014 declined by 0.3% points and 0.4% points, respectively, to 4.0% and 6.2% from 4.3% and 6.6% the previous week. The continued decline in yields signals improving country risk perception by investors, which is partly attributed to bullish expectations of improved economic growth in 2019 as well as increased Eurobond demand in emerging markets, with a similar trend observed in other Sub-Saharan African Eurobonds, driving the prices up and effectively the yields down. Key to note is that these bonds have 0.3-years and 5.3-years to maturity for the 5-year and 10-year, respectively.
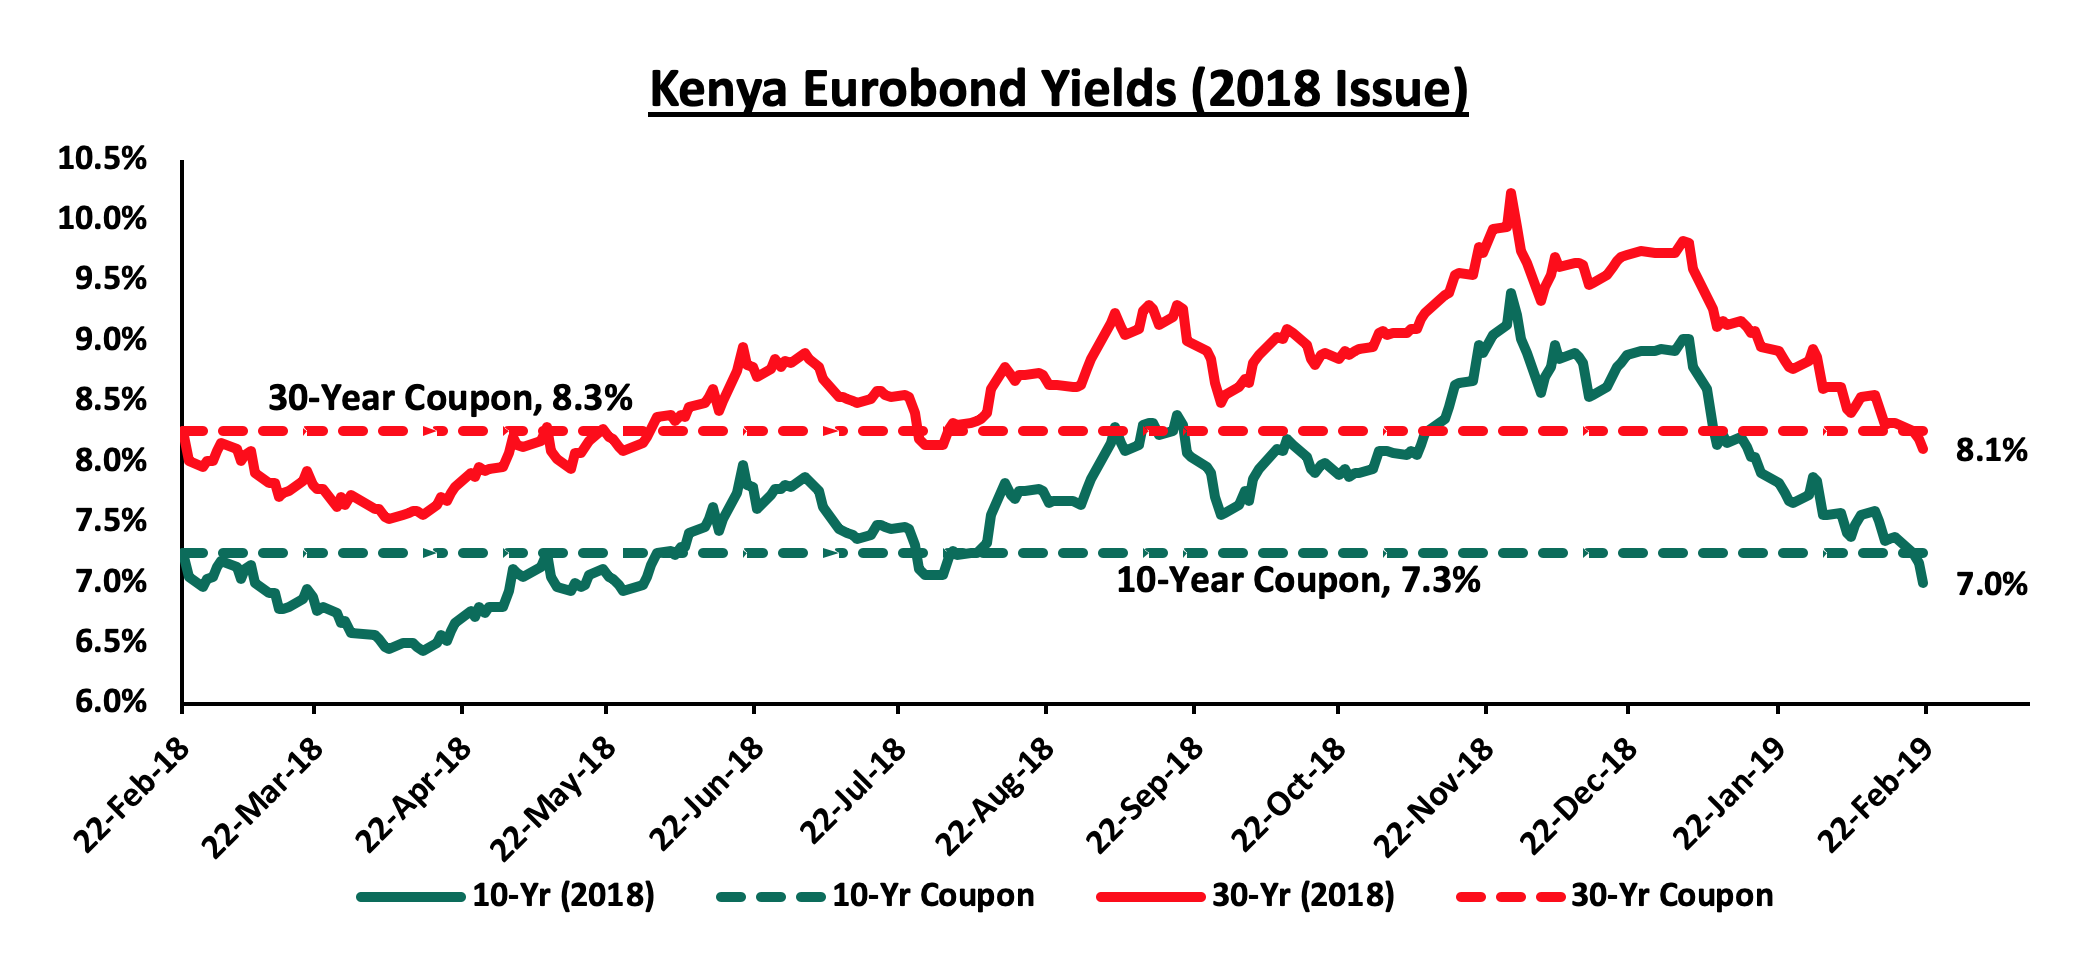
For the February 2018, Eurobond issue, during the week, the yields on both the 10-year and 30-year Eurobonds declined by 0.4% points and 0.2% points to 7.0% and 8.1% from 7.4% and 8.3%, respectively. Since the issue date, the yields on the 10-year Eurobond has declined by 0.3% points while the 30-year Eurobonds has declined by 0.2% points.
Kenya Shilling:
During the week, the Kenya Shilling remained stable closing at Kshs 100.2, similar to the previous week, supported by inflows from horticulture exports and Diaspora remittances, which offset the dollar demand from manufacturers and oil importers. The Kenya Shilling has appreciated against the US Dollar by 1.6% year to date, in addition to the 1.4% appreciation in 2018, and in our view, the shilling should remain relatively stable to the dollar in the short term, supported by:
- The narrowing of the current account deficit to 5.1% in the 12-months to November 2018, from 6.5% in November 2017, attributed to improved agriculture exports, increased diaspora remittances, strong receipts from tourism and slower growth in imports due to lower food and SGR–related equipment imports and the decline in international oil prices,
- Improving diaspora remittances, which increased by 38.6% in 2018 to USD 2.7 bn from USD 1.9 bn recorded in 2017. The rise is due to; (a) increased uptake of financial products by the diaspora due to financial services firms, particularly banks, targeting the diaspora, and (b) new partnerships between international money remittance providers and local commercial banks making the process more convenient,
- CBK’s activities in the money market, such as repurchase agreements and selling of dollars, and,
- High levels of forex reserves, currently at USD 8.1 bn, equivalent to 5.3-months of import cover, compared to the one-year average of 5.1-months and above the EAC Region’s convergence criteria of 4.5-months of imports cover.
Weekly Highlights:
During the week, The National Treasury announced its plan to re-open the sale of the mobile-based infrastructure bond M-Akiba in an effort to attract more takers after the low uptake in 2017, which saw the Government collect Kshs 247.0 mn against a target of Kshs. 1.0 bn. The sale of the mobile-based bond is scheduled to begin on 25th February 2019 and run up to 8th March 2019, with the Treasury targeting Kshs. 250.0 mn. In total, the government plans to raise Kshs 1.0 bn with the next sales scheduled for May, July and August, each targeting Kshs. 250 mn. The bond aims to attract investors with a minimum investment of Kshs 3,000 to be locked in for a period of three years, with the interest at 10.0%. Interest is then earned every six months and principal amount upon reaching maturity date. We expect this year’s sale to spark more investor interest and higher subscription owing to: (i) increased public awareness, (ii) a minimum Kshs. 3,000 investments, below the minimum Kshs. 50,000 required to buy other conventional bonds and thus can access a larger audience, and, (iii) its relatively shorter term with the current demand for shorter term papers.
The National Treasury released the budgetary review for the first half of the 2018/2019 financial year as summarized in the table below:
Amounts in Kshs bns unless stated otherwise
|
Item |
H1'2017/2018 |
H1'2018/2019 |
|||
|
Collected/Spent |
Collected/Spent |
Target |
% met |
Change y/y |
|
|
Total revenue |
709.4 |
794.7 |
855.7 |
92.9% |
12.0% |
|
External grants |
7.8 |
8.8 |
20.5 |
43.0% |
12.8% |
|
Total revenue & external grants |
717.2 |
803.5 |
876.2 |
91.7% |
12.0% |
|
Recurrent expenditure |
647.0 |
643.9 |
768.6 |
83.8% |
(0.5%) |
|
Development expenditure & Net Lending |
173.8 |
308.9 |
232 |
133.2% |
77.7% |
|
County governments + contingencies |
86.1 |
122.6 |
130 |
94.2% |
42.4% |
|
Total expenditure |
907.0 |
1,075.5 |
1,130.7 |
95.1% |
18.6% |
|
Fiscal deficit excluding grants |
(197.6) |
(280.8) |
(275.0) |
42.1% |
|
|
Fiscal deficit including grants (Cash basis) |
(209.2) |
(276.2) |
(254.5) |
32.0% |
|
|
Fiscal deficit including grants (Commitment basis) |
(189.7) |
(272.0) |
(254.5) |
43.3% |
|
|
Deficit(excluding grants) as % of GDP |
2.3% |
2.8% |
2.8% |
||
|
Net foreign borrowing |
24.1 |
144.4 |
34.8 |
415.2% |
499.7% |
|
Net domestic borrowing |
183.6 |
130.8 |
217.7 |
60.1% |
(28.7%) |
|
Other domestic financing |
1.6 |
1.0 |
2.0 |
49.1% |
(39.0%) |
|
Total borrowing |
209.2 |
276.2 |
254.5 |
108.6% |
32.0% |
|
GDP Estimate |
8,654.6 |
9,990.0 |
9,990.0 |
||
Key takeout from the table above are as follows:
- Total cumulative revenue in H1’2018/2019 amounted to Kshs. 794.7 bn against a target of Kshs. 855.7 bn (92.9% of the target). This performance was 12.0% above the Kshs 709.4 bn recorded over the same period in the 2017/2018 fiscal year. Ordinary revenue collection was Kshs. 722.3 bn against a target of Kshs. 775.0 bn (93.2% of the target), which constituted an under performance of Kshs. 52.7 bn. This was mainly driven by poor performance in collection of other income tax, which was 17.7% below target and excise duty, which was 16.1% below target,
- The total expenditure for the period under review amounted to Kshs. 1,075.5 bn, against a target of Kshs. 1,130.7 bn (95.1% of the target). The shortfall of Kshs. 55.2 bn was attributed to under-absorption in both recurrent and development expenditures by the National Government,
- The cumulative overall fiscal balance (on a commitment basis and excluding grants), amounted to Kshs. 280.8 bn (equivalent to 2.8% of GDP) against a targeted deficit of Kshs. 275.0 bn (equivalent to 2.75% of GDP),
- Cumulative external financing for the period between July 1st 2018 and December 31st 2018 amounted to a net borrowing of Kshs. 144.4 bn, a significant increase of 499.7% from Kshs 24.1 bn recorded over the same period in the 2017/2018 fiscal year. This was driven by disbursements of government project loans, and,
- Net domestic borrowing amounted to Kshs. 130.8 bn against a target borrowing of Kshs. 217.7 bn (60.1% of the target) and a 28.7% decline from Kshs 183.6 bn recorded over the same period in the 2017/2018 fiscal year.
Revenue collection remains an area of focus, with the government having managed to meet 92.9% of its target, which is a slight improvement from the 91.2% recorded in H1’2017/2018 reflecting the impact of the government’s efforts of improving revenue collection. The key concern, however, remains on the expenditure side, which has continued to grow faster than revenue, recording an 18.6% growth, compared to the 12.0% growth in revenue collection. This has led to widening of the fiscal deficit to Kshs 280.8 bn, (2.8% of GDP) from Kshs 197.6 bn, (2.3% of GDP) in H1’2017/2018. This in effect has led to increased total government borrowing, to plug in the deficit, with foreign borrowing increasing by a staggering 499.7% to Kshs 144.4 bn from Kshs 24.1 bn. This data is consistent with our analysis as presented in our Annual markets outlook where we indicated a negative outlook on government borrowing.
Inflation Projection:
We are projecting the y/y inflation rate for the month of February to come in within the range of 4.1% - 4.5%, a decline compared to 4.7% recorded in January. The m/m inflation for the month of February is however expected to rise due to the following factors:
- A rise in the food and non-alcoholic beverages index, which has a weighting of 36.0%, mainly driven by the rise in food prices with a significant rise being recorded in tomato and onion prices that have gone up. Potato prices have also been on the rise driven by the 1.7 million tons of Irish potatoes shortage due to farmers’ over-reliance on uncertified seeds that yield less, which has seen prices in the local retail markets increase, and,
- The rise in food and non-alcoholic beverages index is expected to be mitigated by a decline in the transport index with petrol prices having declined by 4.0% to Kshs 100.1 from Kshs 104.2 per litre previously, while diesel prices have declined by 6.1% to Kshs 96.0 per litre from Kshs 102.2 per litre, previously.
Rates in the fixed income market have remained stable as the government rejects expensive bids, as it is currently 26.0% ahead of its domestic borrowing target for the current financial year, having borrowed Kshs 254.2 bn against a pro-rated target of Kshs 201.8 bn. However, a budget deficit is likely to result from depressed revenue collection, creating uncertainty in the interest rate environment as additional borrowing from the domestic market goes to plug the deficit. Despite this, we do not expect upward pressure on interest rates due to increased demand on government securities, driven by improved liquidity in the market owing to the relatively high debt maturities. Our view is that investors should be biased towards medium-term fixed income instruments to reduce duration risk associated with long-term debt, coupled with the relatively flat yield curve on the long-end due to saturation of long-term bonds.
Market Performance
During the week, the equities market was on a declining trend with NASI, NSE 20 and NSE 25 declining by 1.9%, 2.2% and 2.8%, respectively, taking their year-to-date (YTD) gains to 9.8%, 5.1% and 9.6%, respectively. The decline in NASI was driven by declines in large cap stocks such as East Africa Breweries Limited (EABL), Co-operative Bank, British American Tobacco (BAT) and Equity Group, which declined by 9.8%, 6.1%, 4.7% and 2.7%, respectively.
Equities turnover decreased by 22.1% during the week to USD 23.1 mn from USD 29.7 mn the previous week, taking the YTD turnover to USD 0.3 bn. Foreign investors remained net buyers for the week, with a net purchase position of USD 5.4 mn, a 391.1% increase from last week’s net purchase position of USD 1.1 mn.
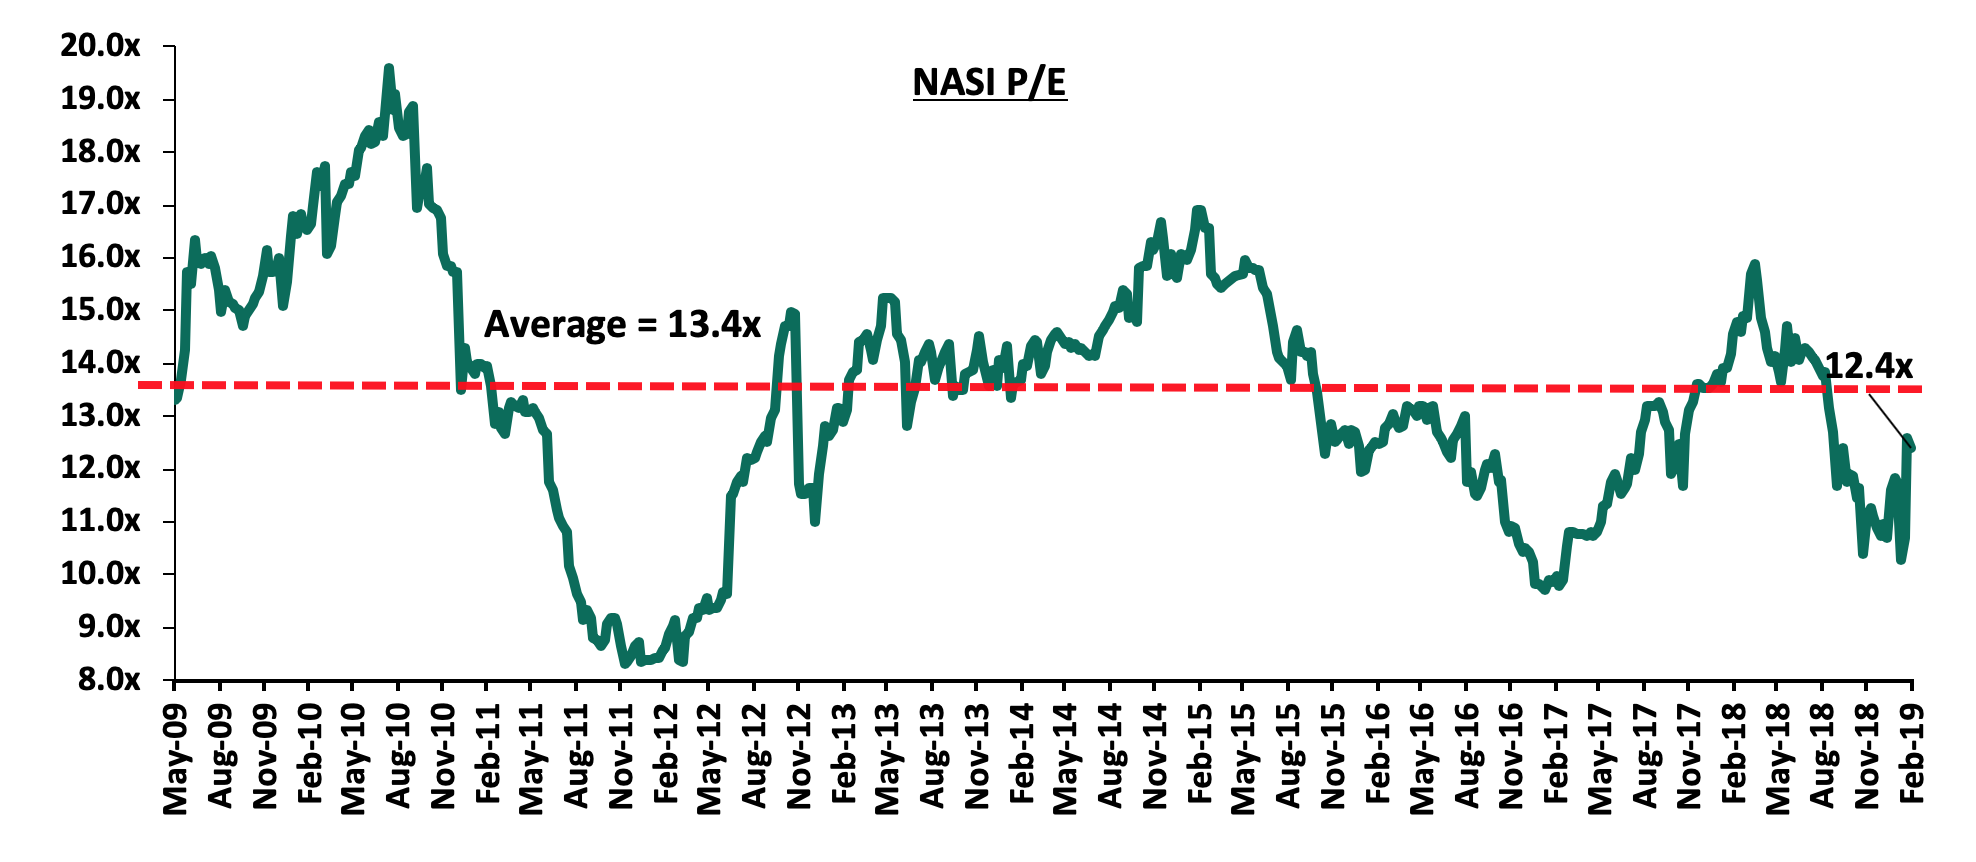
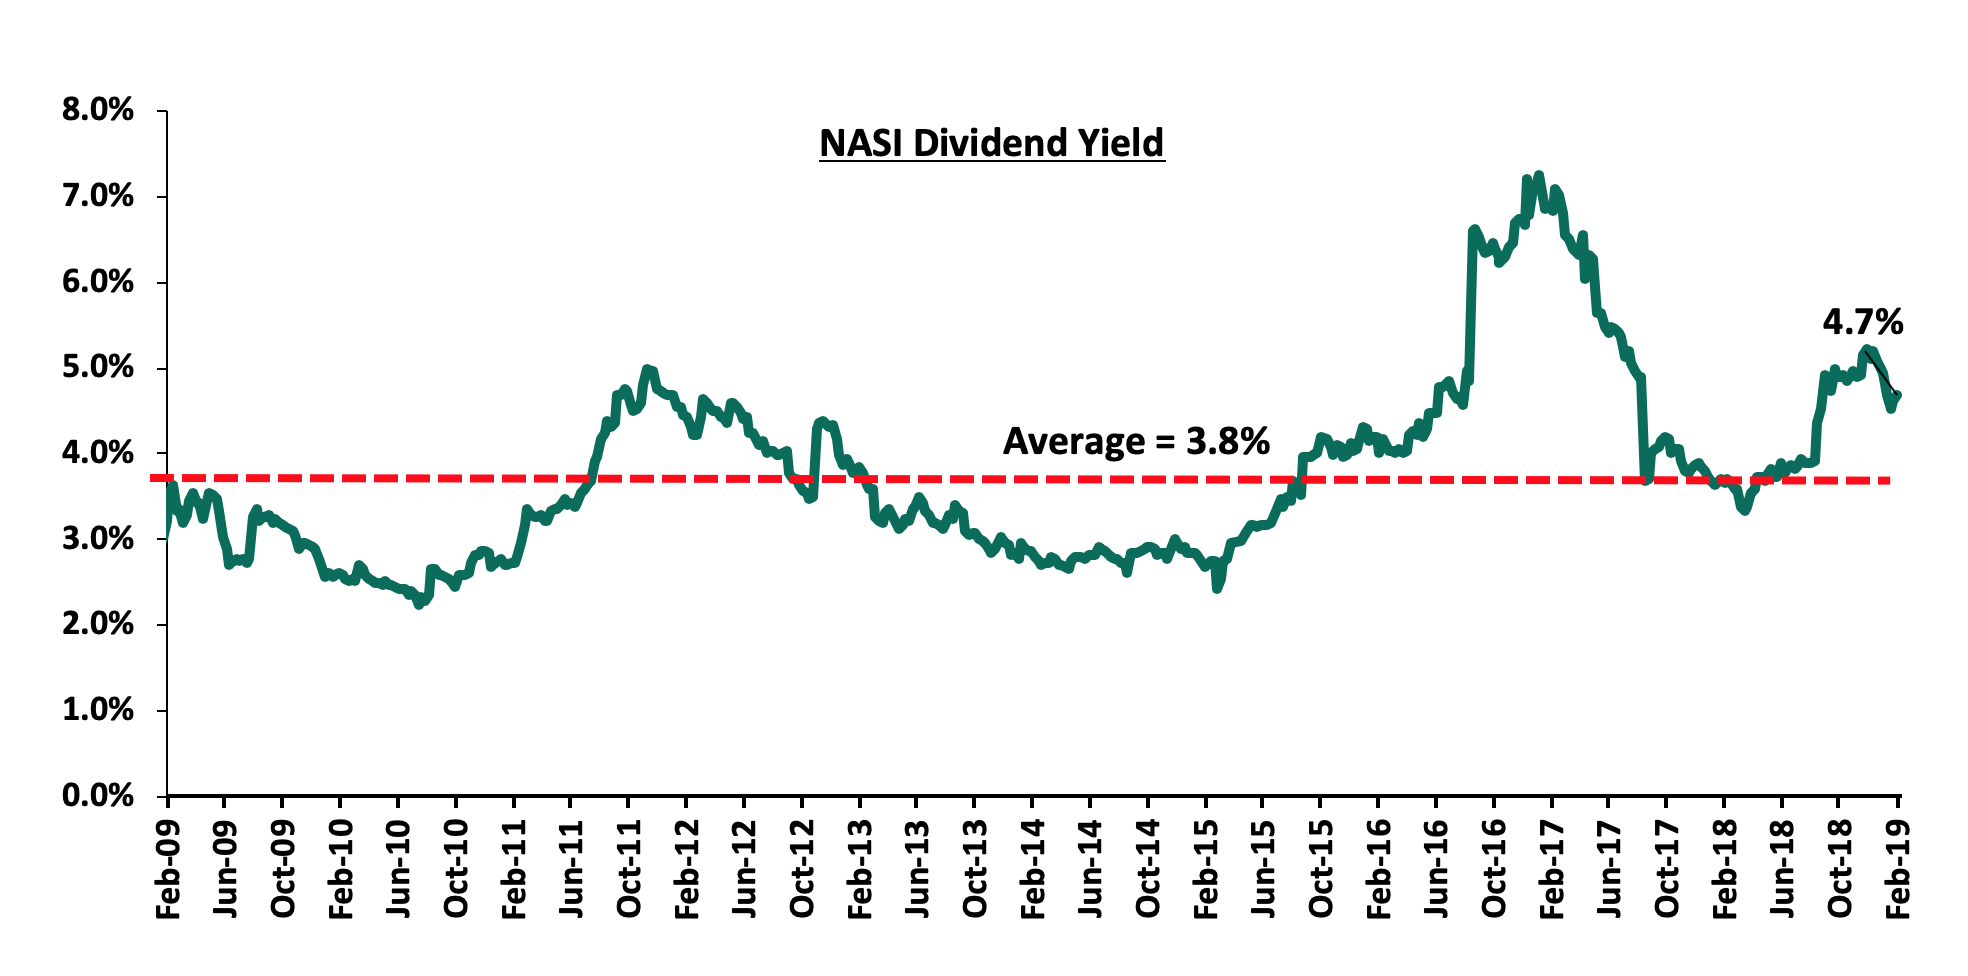
The market is currently trading at a price to earnings ratio (P/E) of 12.4x, 7.4% below the historical average of 13.4x, and a dividend yield of 4.7%, above the historical average of 3.8%. With the market trading at valuations below the historical average, we believe there is value in the market. The current P/E valuation of 12.4x is 26.4% above the most recent trough valuation of 9.8x experienced in the first week of February 2017, and 49.1% above the previous trough valuation of 8.3x experienced in December 2011. The charts below indicate the historical P/E and dividend yields of the market.
Weekly Highlights
The Central Bank of Kenya (CBK) has published draft regulations for mortgage refinance companies (MRCs), setting the stage for creation of a State-backed firm that will advance cash to banks for onward lending to home buyers. Through CBK (Mortgage Refinance Companies) Regulations 2019, the regulator provides for establishment of non-deposit taking firms under the Companies Act, licensed by the CBK to conduct mortgage refinance business. The MRCs will be used to advance loans to primary mortgage lenders such as commercial banks, microfinance banks and Savings and Cooperative Societies (Sacco’s) using funds from the capital markets so as to provide affordable mortgages to eligible individuals. Refinance firms are being fashioned as implementation vehicles for meeting Kenya’s affordable housing plan that targets 500,000 decent, affordable housing units by the year 2022. According to the CBK, the regulations are intended to provide a clear framework for licensing, capital adequacy, liquidity management, corporate governance, risk management as well as reporting requirements of MRCs. The draft regulations for MRCs are almost similar to those of commercial banks. According to the draft, which will be subjected to public comments up to the end of the month, the details for the set-up of MRCs include:
- Minimum core capital of MRCs will be at least Kshs 1.0 bn, which is the same level as that of commercial banks,
- The MRCs will be required to have a master servicing and refinancing agreement governing the lending operations between the mortgage refinance company and the participating primary mortgage lenders, and,
- CBK proposes that no MRC shall grant direct finance to any primary mortgage lender of amounts exceeding 25.0% of core capital.
The draft regulations come at a time the Housing Fund Regulations (2018) are also still in draft form and deductions are yet to be made from formal employees towards funding the housing projects. According to Housing PS Charles Hinga, the flagship low-cost housing plan has received Kshs 2.6 tn in investment pledges. In our view, the introduction of the MRCs should boost credit extension to the private sector, which would be instrumental in developing at least 500,000 affordable housing units by 2022, in line with the President’s Big 4 Agenda.
Universe of Coverage
Below is a summary of our SSA universe of coverage:
|
Banks |
Price as at 15/02/2019 |
Price as at 22/02/2019 |
w/w change |
YTD Change |
LTM Change |
Target Price |
Dividend Yield |
Upside/Downside |
P/TBv Multiple |
|
GCB Bank*** |
4.2 |
4.1 |
(1.9%) |
(10.9%) |
(40.5%) |
7.7 |
9.3% |
97.6% |
1.0x |
|
Diamond Trust Bank |
150.0 |
151.0 |
0.7% |
(3.5%) |
(28.1%) |
283.7 |
1.8% |
89.6% |
0.9x |
|
Access Bank |
6.6 |
6.4 |
(3.0%) |
(5.9%) |
(50.4%) |
9.5 |
6.7% |
55.1% |
0.4x |
|
CRDB |
135.0 |
135.0 |
0.0% |
(10.0%) |
(32.5%) |
207.7 |
0.0% |
53.9% |
0.5x |
|
CAL Bank |
0.9 |
0.9 |
0.0% |
(7.1%) |
(18.1%) |
1.4 |
0.0% |
53.8% |
0.8x |
|
KCB Group*** |
43.5 |
42.0 |
(3.3%) |
12.1% |
(7.2%) |
61.3 |
7.3% |
53.3% |
1.3x |
|
I&M Holdings |
95.5 |
93.8 |
(1.8%) |
10.3% |
(21.9%) |
138.6 |
3.7% |
51.5% |
0.9x |
|
UBA Bank |
8.0 |
8.0 |
0.0% |
3.9% |
(38.5%) |
10.7 |
11.9% |
45.6% |
0.5x |
|
Ecobank |
7.5 |
7.5 |
(0.3%) |
(0.4%) |
(29.8%) |
10.7 |
0.0% |
43.6% |
1.6x |
|
Zenith Bank |
24.8 |
25.3 |
2.2% |
9.8% |
(20.3%) |
33.3 |
11.8% |
43.5% |
1.1x |
|
Co-operative Bank |
15.6 |
14.6 |
(6.1%) |
2.1% |
(14.6%) |
19.9 |
5.1% |
41.4% |
1.3x |
|
Equity Group |
42.5 |
41.4 |
(2.7%) |
18.7% |
(3.3%) |
56.2 |
4.9% |
40.8% |
2.0x |
|
Stanbic Bank Uganda |
29.0 |
28.8 |
(0.8%) |
(7.3%) |
(0.9%) |
36.3 |
3.9% |
30.1% |
2.0x |
|
NIC Group |
39.5 |
39.9 |
1.0% |
43.5% |
25.4% |
48.8 |
2.9% |
25.2% |
1.1x |
|
Barclays Bank |
11.8 |
11.5 |
(2.5%) |
5.0% |
6.0% |
12.5 |
8.7% |
17.4% |
1.6x |
|
Union Bank Plc |
6.9 |
7.0 |
1.4% |
25.0% |
2.2% |
8.2 |
0.0% |
16.4% |
0.7x |
|
SBM Holdings |
6.0 |
6.0 |
0.0% |
0.7% |
(22.3%) |
6.6 |
5.0% |
14.3% |
0.9x |
|
Bank of Kigali |
276.0 |
276.0 |
0.0% |
(8.0%) |
(6.4%) |
299.9 |
5.0% |
13.7% |
1.5x |
|
HF Group |
6.5 |
6.3 |
(3.7%) |
13.4% |
(32.6%) |
6.6 |
5.3% |
10.4% |
0.2x |
|
Guaranty Trust Bank |
38.0 |
38.0 |
0.1% |
10.3% |
(20.8%) |
37.1 |
7.1% |
4.8% |
2.4x |
|
Standard Chartered |
204.3 |
200.0 |
(2.1%) |
2.8% |
(3.8%) |
196.3 |
6.4% |
4.6% |
1.6x |
|
Stanbic Holdings |
94.3 |
91.8 |
(2.7%) |
1.1% |
11.9% |
92.6 |
2.5% |
3.4% |
0.9x |
|
Bank of Baroda |
134.0 |
134.0 |
0.0% |
(4.3%) |
17.5% |
130.6 |
1.9% |
(0.7%) |
1.2x |
|
Standard Chartered |
21.0 |
21.0 |
0.0% |
0.0% |
(28.6%) |
19.5 |
0.0% |
(7.3%) |
2.6x |
|
FBN Holdings |
8.5 |
8.3 |
(1.8%) |
4.4% |
(31.1%) |
6.6 |
3.4% |
(16.7%) |
0.5x |
|
National Bank |
5.7 |
6.1 |
6.7% |
13.9% |
(26.5%) |
4.9 |
0.0% |
(19.1%) |
0.4x |
|
Stanbic IBTC Holdings |
48.5 |
48.5 |
0.0% |
1.1% |
5.4% |
37.0 |
1.3% |
(22.4%) |
2.5x |
|
Ecobank Transnational |
14.4 |
14.2 |
(1.7%) |
(16.8%) |
(28.2%) |
9.3 |
0.0% |
(34.4%) |
0.5x |
|
* Target Price as per Cytonn Analyst estimates ** Upside/ (Downside) is adjusted for Dividend Yield ***Banks in which Cytonn and/or its affiliates are invested in ****Stock prices indicated in respective country currencies |
|||||||||
We are “Positive” on equities for investors as the sustained price declines has seen the market P/E decline to below its historical average. We expect increased market activity, and possibly increased inflows from foreign investors, as they take advantage of the attractive valuations, to support the positive performance.
The African Management Initiative (AMI), a Pan-African company focused on skills development and workplace learning announced the close of a USD 1.8 mn (Kshs 180.2 mn) Series A funding round aimed at promoting in-person as well as on-the-job training for staff in African countries. Investisseurs & Partenaires (I&P), a French impact investing group dedicated to Sub-Saharan Africa, invested USD 1.0 mn in the funding round. The remaining USD 0.8 mn was contributed by Adolf H. Lundin (AHL) Ventures Partners, an impact investment firm based in Lichtenstein focused on high-growth businesses in Africa, and the Argidius Foundation, an organization that provides business support for small and medium sized enterprises in developing markets. AMI has a physical presence in Nairobi, Johannesburg and Kigali. It has conducted skill development programmes for various companies such as the Mastercard Foundation, Shell Foundation, Equity Group and Kenya Commercial Bank (KCB). The firm focuses on professionals and entrepreneurs with the aim of building key business management skills and has so far developed more than 50 business modules and trained more than 25,000 people across South Africa and Kenya. The firm aims to use the funds to enhance its innovative mobile-based learning platform and widen its market coverage in Africa. As hirers seek to improve employee productivity and performance, as well as increase innovation in new strategies and products, we expect blended learning in the workplace involving a combination of online and classroom learning to be a target area for private equity investors seeking to obtain value in the education sector. In 2018, the total funding raised in the education sector of Sub-Saharan Africa stood at Kshs 4.9 bn compared to Kshs 34.7 bn raised across our key focus areas of Fintech, Financial Services, Education, Real Estate and Hospitality, equivalent to 14.1% of the total fundraising activity during the year. We expect fundraising activity in the Kenyan education sector to increase in 2019 bouyed by the demand for on-the-job training by professionals, the entry of international brands over the past years such as the Nova Academies, GEMS Cambridge, JSE listed ADvTech Limited and Bridge Schools, and the demand for quality education and a more comprehensive curriculum.
Inside Capital Partners, a Mauritian independent private equity manager announced a commitment to invest USD 7.5 mn in Latitude Hotels Group, an African lifestyle hospitality Group based in Zambia, for an undisclosed stake. Latitude Group currently runs 3 hotels in Zambia, Malawi and Uganda. The hospitality group will use the funds to develop three additional hotels in Kenya, Ethiopia and Mauritius by 2021. The investment in Latitude Hotels becomes the second transaction of Inside Capital Partners after acquisition of a minority stake in Kalulushi Clay Brick, Zambia’s largest clay brick factory, following the close of its first fund, Inside Equity Fund, with a size of USD 34.0 mn, in December 2017. The fund was backed by Triple Jump, a development finance institution focused on financial sectors in developing countries, and a mix of family offices and other regional industrial players. The fund manager, who is currently proceeding with a second round of fundraising targeted to raise USD 60.0 mn, is expected to make further investments in the hospitality sector targeting entities with an underlying strong net asset value, above market occupancy levels and a strong development pipeline. The Latitude Group offers world-class facilities that includes luxury rooms, spas, gyms, shared co-working space amongst others, to both public and private members. The Group currently owns and operates the Latitude 13o Hotel in Lilongwe, Malawi, that includes 20 long-stay apartments and 9 luxurious suites, and Latitude 15o Hotel in Lusaka, Zambia, that has 32 guest rooms, three 2-bedroom suites amongst other facilities. The Latitude Group is also in the process of commissioning its third hospitality investment, Latitude 0o, a flagship green development incorporating 49 luxurious suites located in Kampala, Uganda and overlooking Lake Victoria. The last decade has seen many global operators opening quality hotels in key markets in Sub-Saharan Africa like South Africa, Mauritius and Kenya with the supply of new hotels attributed to high occupancy rates. We expect the hospitality sector in Sub-Saharan Africa to continue performing well driven by;
- A growing population and expected strong economic growth where GDP is expected to grow by 2.7% in 2018, and 3.4% in 2019, from 2.6% in 2017,
- Growth in both international and domestic travelers to the market,
- An expected improvement in hotel standards as there is a shortage of quality hotels in Africa and as the middle class grows, there is higher demand for quality hotels, and,
- Increase in intra-African travel as the continent experiences better connectivity, access to low-cost airlines, and more countries embracing visa-free travel within Sub-Saharan Africa.
In Kenya, we expect further growth in the hospitality sector as a result of (i) restoration of political calm following the reconciliation of the Country’s two top political leaders last year, (ii) improved hotel standards as hotels rebrand while some embark on refurbishment and expansion, and (iii) improved flight operations and systems such as direct flights from the USA to Kenya, which commenced in October, 2018.
We maintain a positive outlook on private equity investments in Africa as evidenced by the increasing investor interest, which is attributed to; (i) economic growth, which is projected to improve in Africa’s most developed PE markets, (ii) attractive valuations in Sub Saharan Africa’s private markets compared to its public markets, and (iii) attractive valuations in Sub Saharan Africa’s markets compared to global markets. Going forward, the increasing investor interest, stable macro-economic and political environment will continue to boost deal flow into African markets.
I. Industry Reports
During the week, Kenya Bankers’ Association released their Q4’2018 issue of the KBA-House Pricing Index (HPI), which tracks house price movements in the Nairobi Metropolitan Area. The key take-outs from the report are as below:
- Overall residential prices rose by 1.5% in Q4’2018, a 0.1% points q/q rise compared to 1.4% in Q3’2018. As per the report, this is attributable to stabilizing supply and demand dynamics with supply reducing notably due to credit constraints on the developers’ side, while demand has continued to be boosted by buyers’ preference for new buildings, driving selling prices up for new stock,
- Apartments accounted for 76.3% of the total transaction volumes over the last quarter of 2018, followed by bungalows and maisonettes with 12.1% and 11.6%, respectively. This was a notable difference from Q3’2018, which had transaction volumes of 27.0%, 37.8%, and 35.1% for apartments, bungalows, and maisonettes, respectively. The rapid shift in typology uptake is attributable to the affordability of apartments given that they have relatively lower construction costs per unit,
- Key factors that continue to shape homebuyers’ preference are (i) unit plinth area, (ii) number of bathrooms, and, (iii) most importantly, the number of bedrooms, with amenities such as a gym, master en-suite and wooden floors having a marginal effect on housing prices.
According to the KBA-HPI Index Report, homebuyers showed preference for properties in high-end and upper mid-end markets. This is in line with our findings as per Cytonn Annual Markets Review 2018, where the upper mid-end sector registered the highest annual uptake with 26.6% in comparison to the overall residential market uptake average of 22.8%. On the Cytonn outlook, supply is expected to remain modest with credit to the private sector expected to remain low, thus stalling additional stock. However, the current housing shortage, which stands at 2.0 mn units, is set to continue driving demand, thereby sustaining units’ uptake in the middle-income and low-end segments.
Knight Frank also released the Kenya’s Market Update for the second half of 2018. The report tracks the high-end and upper mid-end real estate markets in Kenya. The key take-outs from the report are:
- High-end residential prices declined by 4.5% in 2018, 3.6% points more compared to 0.9% in 2017. The report attributes this to a general oversupply in the upper spectrums of the market, which have rendered the market a buyer’s market, thus driving prices down as a way of price correction,
- Residential rents also decreased, albeit at a slower rate of 1.3% in 2018, compared to 2.8% in 2017. This is as expatriates and mid to high income-earners sustained demand for temporary-stay properties in high-end markets,
- In the office sector, asking rents in Nairobi stagnated over the second half of 2018 at Kshs 130 per SQFT, a result of the market’s oversupply. The report, however, notes that absorption of Grade A office space increased by 63.0% during the second half compared to the first half of 2018. This is as a result of the attractive locations of the various Grade A offices delivered to the market,
- In the retail sector, monthly rents for prime nodes remained flat in the second half of 2018 attributable to the retail market adjusting to continued oversupply in certain locations, making it a tenant’s market. However, occupancy for established malls remained relatively high at over 90.0% with new malls registering lower occupancies of 45-75%.
The report is in line with our findings, whereby, the high-end residential market registered a 0.8%-points decline in price appreciation to 2.9% in 2018, from 3.7% in 2017, due to available supply that is not commensurate with actual effective demand for the same. As per Cytonn Annual Markets Review 2018, the office sector registered only a marginal increase in performance cushioned by a slight uptick in occupancy to 83.3% in 2018 from 82.6% in 2017, whereas the retail sector registered a decline in occupancy rates to 79.8% from 80.3%, over the same period. This, consequently, has driven developers to lower asking rents in order to retain clientele and encourage occupancy. As per the Cytonn report, commercial sector performance is set to stagnate as the oversupply persists for the next 3-5 years. Differentiated concepts, however, such as mixed-used developments and serviced offices are expected to perform well due to their low market share of 0.4% as well as continued demand from affluent individuals and expatriates on short business stints.
II. Hospitality Sector
During the week, Tourism Cabinet Secretary Najib Balala announced plans to rehabilitate Kisumu’s Sunset Hotel into a conference center. The center, set to be complete by 2021, will have a 10,000-capacity with an estimated cost of Kshs 300.0 mn. As per KNBS Economic Survey 2018, local conferences and delegates increased by 2.4% and 17.1%, respectively, in 2017, partly on account of numerous political strategy activities held, thus, creating an opportunity for conferencing centers especially away from Nairobi. Thus, Kisumu being one of Kenya’s political activities hotspots, we expect this to boost the county’s tourism earnings especially in the wake of the next election period of 2022. In our view, therefore, this is bound to benefit Kisumu’s tourism industry as conference tourism continues to shape Kenya’s hospitality sector’s performance and earnings coupled with infrastructural developments. In Kisumu, these include upgrading of the Kisumu airport to international status and development of roads such as the Nyamasaria - Magadi- Manyatta Road and Kisumu - Kisian Highway.
III. Infrastructure
During the week, Kiambu County’s Senator Paul Wamatangi announced plans to revamp Kiambu Road to a dual carriageway from Muthaiga to Githunguri Town. The road, set to be complete by 2022, will also connect to the Uplands- Githunguri - Ruiru Road, which is currently under reconstruction and connects Thika Superhighway and Nairobi - Nakuru Highway. Kiambu Road serves various real estate investment hotspots such as Ridgeways, Runda, Runda Mumwe, and Thindigua. Over recent years, estates along the road have experienced a rapid change in landscape from being largely agricultural to becoming a real estate investment hub. This is attributable to;
- Close proximity to commercial hubs such as the Central Business District and Westlands,
- Availability of amenities including shopping facilities such as Ridgeways mall, Two Rivers mall along the Northern Bypass, and the recently completed Ciata City and Kiambu Malls, and,
- Infrastructural developments with the Northern Bypass completed in 2016 creating an easy access route to other areas such as Ruaka, Ruiru and Thika Road.
The planned improvement will lead to better accessibility and reduce traffic congestion that is usually rampant during peak hours. Consequently, we expect this to result in increased demand for property in the area thus driving prices upwards.
Other Highlights
- SACCOs Societies Regulatory Authority (SASRA) released a report on SACCO’s sectoral lending in Kenya for the period ending December 2016. According to the report, land and housing sectors received the largest proportion of the credit facilities over the period, accounting for 36.2% of the total loans amounting to Kshs 328.4 bn. Building construction and land purchases took the bulk of the total loan value extended to land and housing sectors with 46.5% and 46.0%, respectively, with a paltry of the loan amounts going towards renovations and land processes such as valuation and surveying. This confirms the critical role played by SACCOs in housing provision in Kenya, especially in the wake of the financial crunch resulting from low private sector credit growth by banks. SACCO loans are characterized by favorable interest rates, flexible collateralization and customized to specific low-income groups,
- Cabinet approved a bill on sectional property, which seeks to simplify the registration of sectional property titles in Kenya. Currently, the process is dictated by Sectional Properties Act No. 21 of 1987, which has often been touted as cumbersome. Common practice, therefore, among developers is setting up a corporation, which owns the freehold to the property or the main lease, and sub-leases are then offered to homebuyers together with a share in the corporation, which gives them rights to the common areas. However, this method restricts the rights of the property owners to the terms of the sub-lease, which may also be unacceptable as collateral for bank loans. Therefore, the new bill, if signed into law, will allow high-rise property owners to own sectional titles, which can be collateralized, thus, improving real estate transactions, as clients also tend to shy away from purchasing flats/apartments due to the unclear law around ownership in such shared projects
Our outlook for the real estate performance remains neutral with a bias to positive owing to various saturated markets across all themes. However, we expect select nodes coupled with differentiated concepts such as affordable housing, Grade A and serviced offices, and infrastructural improvements, to continue boosting its performance and opening up new areas for investors.
In line with our regional coverage strategy, we continue to carry out research on various markets in Kenya, with our focus areas being in counties such as Nakuru, Mombasa, Kisumu, Laikipia, Meru, Nyeri and Uasin Gishu. The exercise is aimed at identifying the best real estate investment opportunities for our investors outside Nairobi. In January 2018, we published the Nyeri Investment Opportunity 2017, highlighting that the area recorded an average rental yield and capital appreciation of 8.8% and 17.3%, respectively. This week, we update our findings on the Nyeri real estate market, having collected and analyzed our research data as at January 2019. In summary, we found that the Nyeri market improved in terms of investment returns with the average rental yield coming in at 5.1% for the residential sector from 4.1% in 2017, a slight decline in the commercial sector to 12.1%, from 13.5% in 2017, and a growth in capital appreciation to 19.1%, from 17.3% recorded in 2017. The improved performance is attributed to a continued increase in the property value fueled by demand and a general increase in economic activities, despite the limited number of institutional developers, especially in the residential sector.
To comprehensively review the real estate investment opportunity in Nyeri Town, we will cover the following;
- Overview of Nyeri Town,
- Factors Driving Real Estate Investment in Nyeri,
- Challenges Facing the Real Estate Sector in Nyeri,
- Nyeri Real Estate Market Performance,
- Regional Comparative Analysis, and,
- Investment Opportunity and Outlook.
- Overview of Nyeri Town
Nyeri Town is situated in the Central Highlands of Kenya, about 150 km north of Kenya's capital city Nairobi, between the eastern base of the Aberdare Range, which forms part of the eastern end of the Great Rift Valley, and the western slopes of Mount Kenya. It is the largest town and the headquarters of Nyeri County, and the former central administrative headquarters of Central Province.
In terms of demographics, Nyeri town recorded a population of 119,273 in 2009, thus being ranked 3rd in Nyeri County after Mathira and Kieni constituencies whose population stood at 192,294 and 175,812, respectively.
The population of Nyeri County has however been growing at a relatively low average growth rate of 0.5% p.a, compared to neighboring counties such as Nyandarua and Laikipia, with an annual growth rate of 3.3% and 2.5%, respectively, and the country’s average of 2.6%, attributed to birth control measures according to National Council for Population and Development (NCPD). The rate of urbanization has also been relatively low at 1.9%, compared to Nyandarua at 5.1%, and the country’s rate of 4.3%.
|
Nyeri County Population |
||
|
Constituency |
2009 |
2019F |
|
Mathira |
192,294 |
202,128 |
|
Kieni |
175,812 |
184,803 |
|
Nyeri Town |
119,273 |
125,373 |
|
Othaya |
87,374 |
91,842 |
|
Mukurwe-ini |
83,932 |
88,224 |
|
Tetu |
78,320 |
82,325 |
|
Total |
737,005 |
774,696 |
|
||
Source: Kenya National Bureau of Statistics (KNBS)
- Factors Driving Real Estate Investment in Nyeri
Nyeri is primarily an agricultural area, but over the last 5-years, the area has witnessed increased real estate activities in the town and its environs driven by:
- Devolution – Being a county headquarter, devolution has continued to open up Nyeri Town, attracting government institutions such as the Independent Policing Oversight Authority (IPOA) and private investors such as Davis & Shirtliff, an international company that deals with equipment and services in the water and energy sectors, thus creating demand for office space, retail space and residential units to host investors and government officials,
- Mt. Kenya Regional Headquarters – Nyeri is centrally located and borders over five counties in the Mt. Kenya Region, such as Nyandarua, Laikipia, Meru, Embu and Murang’a. This has attracted Mt. Kenya Regional offices for both local and international companies such as the Safaricom Mt. Kenya regional hub, National Construction Authority (NCA) Mt. Kenya Regional Office, and Coca Cola Mt. Kenya Bottlers Ltd, thus creating demand for office space, retail and in the housing sector,
- Relatively High Income - According to the recently released Gross County Product report 2019 by the Kenya National Bureau of Statistics (KNBS), Nyeri was ranked the 12th richest county in terms of GDP per capita in the country at USD 958, with Nairobi coming in 1st with USD 2,063 per capita. The relatively high income, compared to the national average at USD 711, is mainly boosted by the agricultural sector, which accounted for 34.4% of the gross county product, and illustrates higher purchasing power thus a growing demand for property in Nyeri. Below is a graph showing the Top 15 Counties in Kenya as per their GDP per Capita:
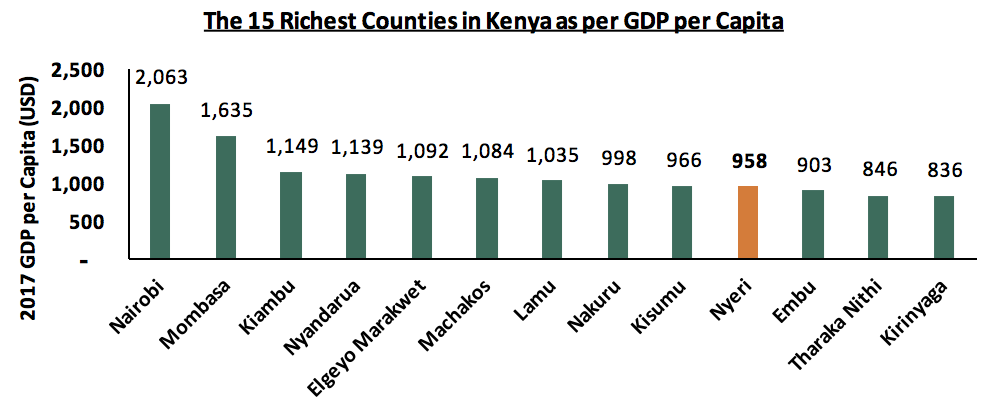
*Conversion rate: USD 1= Kshs 103
Source: Kenya National Bureau of Statistics, 2019
- Tourism – Nyeri County hosts key tourist attractions such as the Lord and Lady Baden Powell graves, Mount Kenya and the Aberdare National Park. The county thus acts as a major tourist circuit to Mt. Kenya and the Northern Region, enhancing demand for hospitality services which continues to promote the hospitality sector,
- Growth of Small and Medium Enterprises (SMEs) – The ease of doing business, boosted by the short period of a maximum of 2 weeks for business registration, continues to result in an increase in the number of SMEs. Currently, Nyeri hosts many of these companies, and requires office space and housing for the employees, hence driving the demand for real estate, and,
- Improving Infrastructure - Nyeri County is expected to benefit from the improving infrastructure, i.e. the ongoing rehabilitation of Kuku Lane, the reconstruction of Baden Powell – Muhoya road in Nyeri town and the proposed construction of the Kenol-Nyeri-Isiolo Highway, which will result in an increased property value in areas served by the roads. In addition, the government has announced plans to re-carpet access roads in rural areas and we expect this to open up the areas for development and result in increased property value.
- Challenges Facing Real Estate in Nyeri
Despite the above factors supporting the real estate sector in Nyeri, the market continues to face challenges, which include;
- Lack of Structured Planning Regulations – The County currently lacks structured planning regulations outlining areas zoned for commercial, residential and special needs. This is likely to lead to urban sprawl in urban centers and thus reduced land use maximization. The County Government is however working on setting up zoning regulations to formulate land use standards, zoning schemes and ordinances for all urban settlements in the county,
- Inadequate Infrastructure - Most of the access roads in the county are earth roads making the areas they serve difficult to access during the rainy season, while the drainage systems in the town are not well maintained thus making the area unattractive to investors resulting in the slow growth of real estate,
- Unavailability of Development Land – Availability of land for development in Nyeri Town has been low thus resulting in relatively high land prices of up to Kshs 120 mn per acre in the CBD, compared to that in the outskirts at approximately Kshs 10 mn per acre. In addition, ownership of ancestral land has resulted in minimal land sales as people have sentimental attachment, thus leading to slow investment growth, and,
- Demand for Residential Units - Most of the prospective home-owners in Nyeri prefer to build their own houses. As a result, the build for sale model is still underdeveloped with the National Housing Corporation (NHC), probably being the only institutional developer. Given the fast uptake of these units with an annualized uptake of 23% having started selling in 2014, we expect the market to eventually embrace the model in the coming years.
- Nyeri Real Estate Market Performance
Our market research focused on;
- Plinth Area - Research on the size of the units found in the market allows us to gauge the current offering, and establish the home buyer’s preferences for sizes of houses,
- Annual Uptake - This allows the investor to appreciate the rate at which available property is sold over a specific period, thus helps him/her gauge how fast they can exit the market,
- Prices - Research on prices will be used in comparison with our products against the market prices,
- Rental Rates - Research on rental rates allows us to inform prospective investors on the rental yield they can gain from investing in the Nyeri Real Estate Market.
We covered the residential, commercial (mixed-use-developments and offices) and the land sectors. The performance per theme was as follows:
- Residential Sector
The residential housing sector in Nyeri has been slowly picking up, with most of the estates, having existed for less than 6-years, driven by among other factors; government decentralisation, urbanisation and growth of middle class in the region. In the county, some of the key residential areas are distributed in the outskirts of the CBD and include: Ring-road, Kamakwa and King’ong’o areas, with the key estates being Garden Estate, Mountain View Estate and Ring-road Estate, which comprise mainly of owner-built and occupied standalone houses.
The residential market is mainly rental, in and around Nyeri Town as the market, with majority of the residential houses being owner-built, and The National Housing Corporation (NHC) probably being the only institutional developer in Nyeri, having constructed residential bungalows for sale.
The performance was as follows:
All values in Kshs unless stated otherwise
|
Residential Detached Units Performance |
|||||||||||||
|
Typology |
Unit Plinth Area(SQM) |
Price per SQM 2017 |
Price per SQM (2019) |
Monthly Rent (2017) |
Monthly Rent (2019) |
Monthly Rent per SQM 2017 |
Monthly Rent per SQM 2019 |
Occupancy 2017 |
Occupancy 2019 |
Annual Sales 2019 |
Rental Yield (2017) |
Rental Yield (2019) |
|
|
1-bedroom |
42 |
76,190 |
76,190 |
10,000 |
15,000 |
238 |
357 |
80% |
80% |
20% |
3.8% |
4.5% |
|
|
2-bedroom |
54 |
74,074 |
74,074 |
20,000 |
20,000 |
370 |
370 |
71% |
80% |
25% |
4.3% |
4.8% |
|
|
3-bedroom |
69 |
63,768 |
63,768 |
28,000 |
28,000 |
406 |
406 |
67% |
100% |
25% |
5.1% |
7.6% |
|
|
Average |
71,344 |
71,344 |
338 |
378 |
73% |
87% |
23% |
4.4% |
5.6% |
||||
|
|||||||||||||
Source: Cytonn Research, 2019
- The units recorded an average rental yield of 5.6% in 2019, 1.2% points higher than the 4.4% recorded in 2017, attributed to the increase in the monthly rent charges from Kshs 338 per SQM in 2017 to Kshs 378 per SQM and occupancy rates from 73% to 87%, as most of the units have been enhanced by the owners before renting them out thus charging a higher rent price,
- Key to note, the exit prices remained constant at Kshs 71,344 per square, attributed to the unpopularity of the build to sell model with majority of the homes being owner-built, nevertheless, the homeowners’ willingness to adopt the concept is evidenced by the 23% annual uptake recorded by the existing development.
Apartments’ performance was as follows:
All values in Kshs unless stated otherwise
|
Residential Apartments Performance- Nyeri 2019 |
||||||||||||
|
Typology |
Unit Plinth Area (SQM) |
Monthly Rent (2017) |
Monthly Rent per SQM 2017 |
Monthly Rent (2019) |
Monthly Rent per SQM 2019 |
Monthly Rent/SQM ∆ |
Occupancy 2017 |
Occupancy 2019 |
Occupancy ∆ |
Rental Yield 2017 |
Rental Yield (2019) |
Rental Yield ∆ |
|
1-bedroom |
40 |
8,000 |
191 |
11,000 |
272 |
43% |
95% |
92% |
(3.0%) |
3.1% |
4.1% |
1.0% |
|
2-bedroom |
64 |
14,250 |
214 |
17,125 |
285 |
33% |
77% |
88% |
11.0% |
2.8% |
4.2% |
1.4% |
|
3-bedroom |
89 |
28,500 |
313 |
28,500 |
313 |
100% |
100% |
5.3% |
5.3% |
|||
|
Average |
239 |
290 |
38% |
91% |
93% |
3.8% |
3.7% |
4.5% |
1.2% |
|||
|
||||||||||||
* The calculation of the rental yield assumed an exit price of Kshs 71,344 per square metre, similar to that of the standalone units as the market lacks apartments for sale
Source: Cytonn Research, 2019
- The current average rent per month for apartments is approximately 290 per square metre, 38% higher than the Kshs 239 per square metre recorded in 2017, attributable to the entry of new developments in the market, which have been noted to be charging slightly higher rates,
- 3-bedroom apartments recorded the highest rental yield at 5.3%, attributed to the high rent per square metre and occupancy rates at an average of Kshs 313 and 100%, respectively, boosted by the low supply of the typology in the market,
- On the other hand, 1-bedroom apartments recorded a relatively low average rental yield of 4.1% at an average occupancy rate of 92%, attributable to a decline in occupancy rates by 3.0% from xx in 2017, attributable to the growing supply with the entry of new developments into the market.
All values in Kshs unless stated otherwise
|
Summary of the Residential Sector Performance |
|||||||||||
|
|
Price per SQM 2017 |
Price per SQM 2019 |
Rent Per SQM 2017 |
Rent per SQM 2019 |
Monthly Rent/SQM ∆ |
Occupancy 2017 |
Occupancy 2019 |
Occupancy ∆ |
Rental Yield 2017 |
Rental Yield (2019) |
Rental Yield ∆ |
|
Apartments |
239 |
290 |
21.3% |
91% |
93% |
3.0% |
3.7% |
4.5% |
0.8% |
||
|
Standalone |
71,344 |
71,344 |
338 |
378 |
11.8% |
73% |
87% |
14.0% |
4.4% |
5.6% |
1.2% |
|
Grand Average |
71,344 |
71,344 |
289 |
334 |
17.0% |
82% |
90% |
8.0% |
4.0% |
5.1% |
1.0% |
|
|||||||||||
Source: Cytonn Research, 2019
- Standalone units recorded the highest rental yield at 5.6%, compared to the 4.5% recorded by the apartments in the market, attributed to the relatively higher rental rates for standalone units, indicating higher demand, and,
- The residential market is still nascent and is yet to embrace the build for sale model with only one project currently offering units for sale.
- Commercial Sector
The commercial sector in Nyeri has continued to perform well over the years with a rental yield of above 10.0%, despite the fact that the market has no Grade A or B offices, with most of the offices being in a poor state of repair. In the last 2-years, we have seen the establishment of new buildings such as the County Mall and Khimji Deshi Shah (KDS) Centre and renovation of older buildings such as Lamesh Building. The market has low supply of formal shopping malls with only the recently built County Mall, which brought to the market 65,000 square feet of mixed-use space.
Currently, the key retailers serving the market include; Samrat, Naivas and Mathai Supermarket.
The performance was as follows:
All Values in Kshs Unless Stated Otherwise
|
Commercial Property (MUDs) Market Performance |
|||
|
2017 |
2019 |
Annualized ∆ |
|
|
Rent per SQFT (Retail) |
103 |
101 |
(1.4%) |
|
Rent per SQFT (Office) |
70 |
67 |
(3.2%) |
|
Occupancy (%) |
89% |
87% |
1.6% points |
|
Rental yield (%) |
13.5% |
12.1% |
1.0% points |
|
|||
Source: Cytonn Research, 2019
- The monthly rent for commercial office space in Nyeri, ranges from Kshs 50 to Kshs 100 per SQFT, while the monthly rent for retail space ranges from Kshs 70 to above Kshs 100 per SQFT,
- The slight change in rent charges per square foot, for both commercial office and retail space, is mainly attributed to an increase in the sample set compared to those considered in 2017,
- Commercial properties in the market recorded a 1.0%-points decline in rental yield attributed to the decline in occupancy rates to 87% from 89% recorded in 2017, with some of the new buildings such as the County Mall off Baden Powell’s Road and KDS Centre along Kimathi Street, recording lower occupancy levels of about 30%, having been introduced into the market within the last 1 year
- Land Sector
Land prices in Nyeri are highly dependent on the proximity to the roads, the level of servicing and proximity to the CBD. In the CBD, the land price is relatively high at an average price of up to Kshs 120 mn per acre, while an acre in the outskirts costs approximately Kshs 1.8 mn. Most of the land in Nyeri is ancestral, thus, minimal sales are recorded as people have sentimental attachment. In the last 3-years, however, the market has embraced the site and service concept with several developers having entered the market, some of whom include; Madiba Properties, Optiven Limited and Mhasibu Housing Company Limited.
The most common plots for sale in the market are ¼ acre and 1/8 acres, whose price ranges from Kshs 0.4 mn to 1.4 mn, and Kshs 2.0 mn to Kshs 4.5 mn, respectively, and recorded average annual sales of 30%, attributed to a growing demand for the development of residential houses.
All Values in Kshs Unless Stated Otherwise
|
Site & Service Scheme Performance |
||||||
|
Size of Plots (Acres) |
Selling Price(Kshs) 2017 |
Sale price (Kshs) 2019 |
Annual Sales Achieved 2017 |
Annual Sales Achieved 2019 |
Annualized Capital App. 2017 |
Annualized Capital App. 2019 |
|
1/8 |
0.8 mn |
0.9 mn |
30.8% |
29.2% |
17.5% |
20.9% |
|
1/4 |
2.4 mn |
3.9 mn |
24.3% |
30.8% |
17.0% |
17.3% |
|
Average |
27.6% |
30.0% |
17.3% |
19.1% |
||
|
||||||
Source: Cytonn Research 2019
- The plots for sale in the market are mainly in 1/8 acres and 1/4 acres at an average price of Kshs 0.9mn and Kshs 3.9mn, respectively,
- On average, the plots recorded an annual capital appreciation of 19.1% in 2019, 1.8% points higher than the 17.3% recorded in 2017, attributable to the growing demand for development land.
Nyeri Real Estate Market Performance Summary
|
Nyeri Real Estate Market Performance 2019 |
|||
|
Theme |
Occupancy Rates |
Rental Yield |
Capital Appreciation |
|
Residential |
90% |
5.1% |
|
|
Commercial Properties |
87% |
12.1% |
|
|
Site & Service |
19.1% |
||
|
Average |
88% |
8.6% |
19.1% |
Source: Cytonn Research
- The average rental yield stood at 8.6%, 0.2% points lower than the 8.8% recorded in 2017, attributed to a decrease in rent prices in the commercial sector resulting from a growing supply of commercial space in the market,
- The market recorded a capital appreciation of 19.1%, 1.8% points higher than the 17.3% recorded in 2017, attributed to the increased demand for property, fuelled by the positive demographics and devolution.
- Regional Comparative Analysis
Comparing across the five counties we have tracked so far;
- In the residential sector, yields are generally similar across all counties, with Kisumu recording the highest at 5.2%, followed by Nyeri and Mombasa at 5.1%. Nakuru County recorded the lowest at 4.2%,
- For commercial property, Nyeri recorded the highest rental yield of 12.1%, while Kisumu, Nairobi, Mombasa and Nakuru recorded yields of 9.2%, 8.3%, 6.7% and 6.5%, respectively. This indicates that, in comparison to the other four regions, Nyeri offers a better investment opportunity for commercial property, and we attribute this to low supply of quality office spaces in the market.
Below is the comparison of the performance of the five counties:
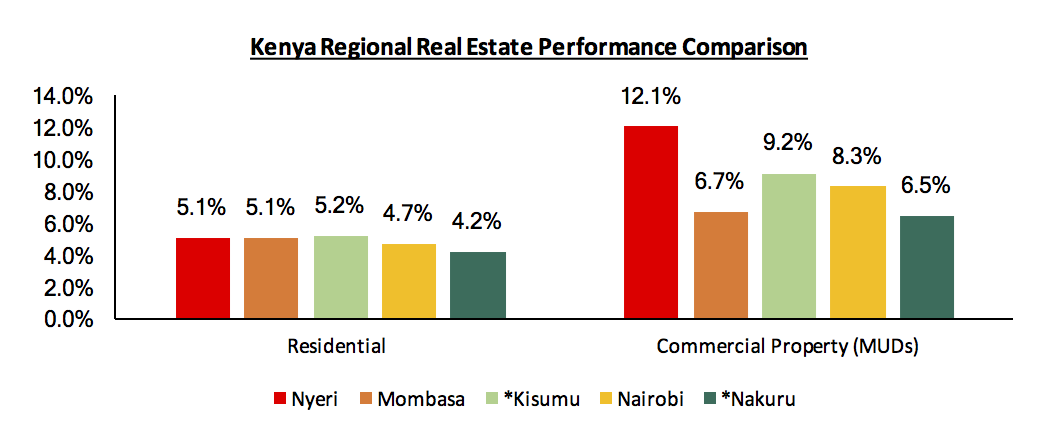
*2017 Data
Source: Cytonn Research
- Investment Opportunity & Outlook
We have a positive outlook for two sectors; commercial and land sector and a neutral outlook for the residential sector in Nyeri. The opportunity is in both the commercial and land sectors (site and service schemes), supported by the increasing demand for development land and an existing market gap for quality commercial buildings.
The table below shows a summary of the outlook and investment opportunity:
|
Thematic Performance and Outlook |
||||
|
Theme |
Performance (2017) |
Performance (2019) |
Investment Opportunity |
Outlook |
|
Residential |
The residential sector recorded total returns of 8.3% on average with rental yield of 3.9% and price appreciation of 4.4% |
The residential sector has an average rental yield of 5.1% and a 90% occupancy rate. The sale of residential units is still at a nascent stage, with prospective homeowners preferring to build their own houses. |
There’s an opportunity for investment in stand-alone units for sale, given the low supply, and relatively high annual uptake of 23% and higher yields of 5.6% compared to apartments For apartments, the focus should be on the rental units given the high demand for the same evidenced by the average occupancy rates of approximately 93% |
Neutral |
|
Commercial Properties |
The commercial properties sector had an average rental yield of 13.5% and average occupancy of 89%. |
The commercial properties sector has yields of 12.1% and average occupancy of 87%. |
The market lacks grade A and B offices with most the offices being in a poor state of repair and lack facilities such as lifts. This thus presents an investment opportunity for quality commercial buildings supported by the relatively high rental yield of above 10.0% and occupancy rates of above 80% |
Positive |
|
Site and service schemes |
Site and service schemes recorded an average annual capital appreciation of 17.3% at an annual uptake of 27.6% |
Site and service schemes recorded an average annual capital appreciation of 19.1% at an annual uptake of 30.0% |
Site and service schemes present an investment opportunity in Nyeri, with increased demand for development land mainly for building their own homes |
Positive |
We have a positive outlook for the Nyeri real estate market, driven by devolution, positive demographics, and the growing housing demand in addition to the improving infrastructural development. For investment, we recommend investment in site and service sector, and the commercial sector given the relatively high capital appreciation and existing market gap for quality commercial buildings.
Disclaimer: The views expressed in this publication are those of the writers where particulars are not warranted. This publication, which is in compliance with Section 2 of the Capital Markets Authority Act Cap 485A, is meant for general information only and is not a warranty, representation, advice or solicitation of any nature. Readers are advised in all circumstances to seek the advice of a registered investment advisor.

- Talk to us
- Kenya
- P.O Box 20695 - 00200, Nairobi, Kenya
- Cell +254709101200
- Tel +254709101200
- WhatsApp +254741676635
- United States
- +254709101200
- DOWNLOAD OUR APP
-


- Kenya
- 8th Floor, Pinetree Plaza, Kaburu Drive, Ngong Road, Nairobi, Kenya
- USA
- Suite 1150, 1775 Eye Street NW, USA, Washington DC 20006, USA
- Investments
- High Yield
- Private Equity
- Real Estate
- Real Estate
- RiverRun Estates
- Cytonn Towers
- The Ridge
- Taraji Heights
- The Alma