Potential Effects COVID-19 Might Have on Money Market Funds, & Cytonn Weekly #12/2020
By Research Team, Mar 22, 2020
Executive Summary
Fixed Income
During the week, T-bills were undersubscribed for the first time in 10-weeks, with the subscription rate coming in at 87.9%, down from 264.0% the previous week. The undersubscription is attributable to investor’s preference to hold on to their cash due to low confidence in the market attributable to the Coronavirus outbreak. The subscription rate of the 91-day, 182-day and 364-day paper declined to 13.7%, 36.1% and 169.4% from 201.8%, 92.5% and 460.4%, respectively, the previous week. The yields on the 91-day paper and 364-day paper remained unchanged at 7.3% and 9.1%, respectively, while the yield on the 182-day paper declined by 0.1% point to 8.0%, from the 8.1% recorded the previous week. The Monetary Policy Committee (MPC) is set to meet on Monday, 23rd March 2020, to review the outcome of its previous policy decisions and recent economic developments, and to make a decision on the direction of the Central Bank Rate (CBR). We expect MPC to reduce the Central Bank Rate (CBR) by 100 bps to 7.25% from 8.25%, this decision will be driven by factors such as the instability in the Kenyan shilling and the expected cost-push inflation caused by shortages arising from supply chain disruptions. During the week, the Central Bank of Kenya (CBK), under Sections 9 and 51 of the CBK Act and following approval by the CBK Board, announced that it has transferred Kshs 7.4 bn from its General Reserve Fund to the Government Consolidated Fund in support of the fight against Coronavirus;
Equities
During the week, the equities market was on a downward trajectory, with NASI, NSE 20 and NSE 25 declining by 0.5%, 4.7% and 3.4%, respectively, taking their YTD performance to losses of 20.1%, 23.7% and 21.4%, for the NASI, NSE 20 and NSE 25, respectively. During the week, Equity Group, Co-operative Bank, DTB and Stanchart Bank, released their FY’2019 financial results, recording core eps growths of 13.8%, 12.4%, 1.6% and 1.7%, respectively;
Real Estate
During the week, Kenya National Bureau of Statistics (KNBS) released the Leading Economic Indicators, January 2020 report, which highlighted that cement consumption declined by 1.3% to 5.8 mn tons in 2019, from 5.9 mn tons in 2018. In the retail sector, Naivas Supermarket, a local retailer, opened its 63rd store in Mountain View Mall, along Waiyaki Way, and Optica, a local eye-wear retailer, opened its 40th Kenyan outlet at Two Rivers Mall, along Limuru Road. In the hospitality sector, the President of Kenya, H.E Hon. Uhuru Kenyatta, temporarily revoked the ban restricting government corporations from holding conferences in privately-owned hotels, and in the logistics sector, Twiga Foods, a local agribusiness company backed by top American investment bank Goldman Sachs, signed up for space in ALP (Africa Logistics Properties) North warehouse facilities located in Tatu City Industrial Park in Ruiru;
Focus of the Week
We previously wrote about the novel Coronavirus in our Topical last week, titled Impact of Coronavirus to the Kenyan Economy. This week, following inquiries from our clients, we revisit the topic to focus on possible effects the Coronavirus might have on Money Market Funds; evaluating the current situation in the macroeconomic environment and Kenyan Fixed Income market. We look at the constituents of money market funds & impact of coronavirus on each asset class and outline the overall effect on Money Market Funds.
- Weekly Rates:
- Cytonn Money Market Fund closed the week at a yield of 11.0% p.a. To subscribe, just dial *809#;
- Cytonn High Yield Fund closed the week at a yield of 13.9% p.a. To subscribe, email us at sales@cytonn.com;
- In response to the recently announced measures to contain COVID-19 as announced by H.E. President Uhuru Kenyatta, Cytonn Investments has put in the following measures to ensure we continue serving our clients even as we comply with the safety measures. Please see our client communication here;
- David Kingoo, Senior Risk and Compliance Associate at Cytonn Investments, attended an interview on Milele FM where he talked about the Impact of the Coronavirus on businesses in Kenya. Watch David here;
- Beatrice Mwangi, Real Estate Research Analyst at Cytonn Investments, attended an interview on NTV (Property Focus Show) where she discussed the factors to consider for parties interested in the real estate industry such as budget and location. Watch Beatrice here;
- Felix Otieno, Investment Analyst at Cytonn Investments, attended an interview on CNBC about the Nairobi Securities Exchange, which has shed more than half a trillion Kenya Shillings as investors react to cases of COVID-19. Watch Felix here;
- Felix Otieno, Investments Analyst at Cytonn Investments, attended an interview on CNBC to talk about how Coronavirus affected the global economy. Watch Felix here;
- Maryanne Ng’ang’a, Investment Analyst at Cytonn Investments, attended an interview on CNBC, where she discussed the agreement between the Central Bank of Kenya (CBK) and banks to waive mobile transfer charges to push for cashless payments to curb the spread of Coronavirus. Watch Maryanne here;
- Shiv Arora, Chief Operating Officer at Cytonn Investments, attended an interview on Citizen TV to discuss the impact of Coronavirus on the Kenyan economy. Watch Shiv here;
- Shiv Arora, Chief Operating Officer at Cytonn Investments, attended an interview on NTV to talk about the impact of Coronavirus on the Kenyan economy. Watch Shiv here;
- Having completed and handed over Phase 1 of The Alma, and on track to hand over Phase 2, we have now turned our attention towards construction of The Ridge in Ridgeways. The Ridge is Cytonn’s 800-unit residential mixed-use development on the Northern Bypass. For more information please email us at sales@cytonn.com;
- Phase 1 of The Alma is now 100% sold with early buyers having achieved up to 55% capital appreciation. We are now running a promotion in Phase 2: Buy a unit in Phase 2 with a 15-year payment plan and 0% deposit. For inquiries, please email us on clientservices@cytonn.com. The site is open between 8 am - 5 pm, 7-days a week for site visits;
- For an exclusive tour of Cytonn’s real estate developments, visit: Sharp Investor's Tour and for more information, email us at sales@cytonn.com;
- We continue to hold weekly workshops and site visits on how to build wealth through real estate investments. The weekly workshops and site visits target both investors looking to invest in real estate directly and those interested in high yield investment products to familiarize themselves with how we support our high yields. Watch progress videos and pictures of The Alma, Amara Ridge, and The Ridge;
- We continue to see very strong interest in our weekly Private Wealth Management Training (largely covering financial planning and structured products). The training is at no cost and is open only to pre-screened participants. We also continue to see institutions and investment groups interested in the training for their teams. Cytonn Foundation, under its financial literacy pillar, runs the Wealth Management Training. If interested in our Private Wealth Management Training for your employees or investment group, please get in touch with us through wmt@cytonn.com. To view the Wealth Management Training topics, click here;
- For recent news about the company, see our news section here;
- We have 10 investment-ready projects, offering attractive development and buyer targeted returns. See further details here: Summary of Investment-Ready Projects.
Money Markets, T-Bills & T-Bonds Primary Auction:
During the week, T-bills were undersubscribed for the first time in 10-weeks, with the subscription rate coming in at 87.9%, down from 264.0% the previous week. The undersubscription is attributable to investor’s preference to hold on to their cash due to low confidence in the market attributable to the Coronavirus outbreak. The subscription rate of the 91-day, 182-day and 364-day paper declined to 13.7%, 36.1% and 169.4% from 201.8%, 92.5% and 460.4%, respectively, the previous week. The yields on the 91-day paper and 364-day paper remained unchanged at 7.3% and 9.1%, respectively, while the yield on the 182-day paper declined by 0.1% point to 8.0%, from the 8.1% recorded the previous week. The acceptance rate increased to 99.7%, from 35.6% recorded the previous week, with the government accepting Kshs 21.0 bn of the Kshs 21.1 bn bids received.
T-bond Performance
During the week, the Central Bank of Kenya released the auction results for the recently issued bond, FXD1/2018/20 and the reopened FXD1/2018/25 with effective tenors of 18.0-years and 23.0-years, respectively, and coupon rates of 13.2% and 13.4%, respectively, in a bid to raise Kshs 50.0 bn for budgetary purposes. The overall subscription rate came in at 70.3%, with the government receiving bids worth Kshs 31.1 bn, lower than the quantum of Kshs 50.0 bn. The low performance is mainly attributable to the relatively long tenor periods of the two bonds with most investors trying to minimize duration risk. The yield on the 20-year bond came in at 13.5%, while the yield on the 25-year bond came in at 13.8%, compared to our expectations of 12.9% - 13.0% and 13.4% - 13.6% for the 20-year bond and 25-year bond, respectively. The government accepted Kshs 22.9 bn out of the Kshs 35.1 bn worth of bids received, translating to an acceptance rate of 65.2%.
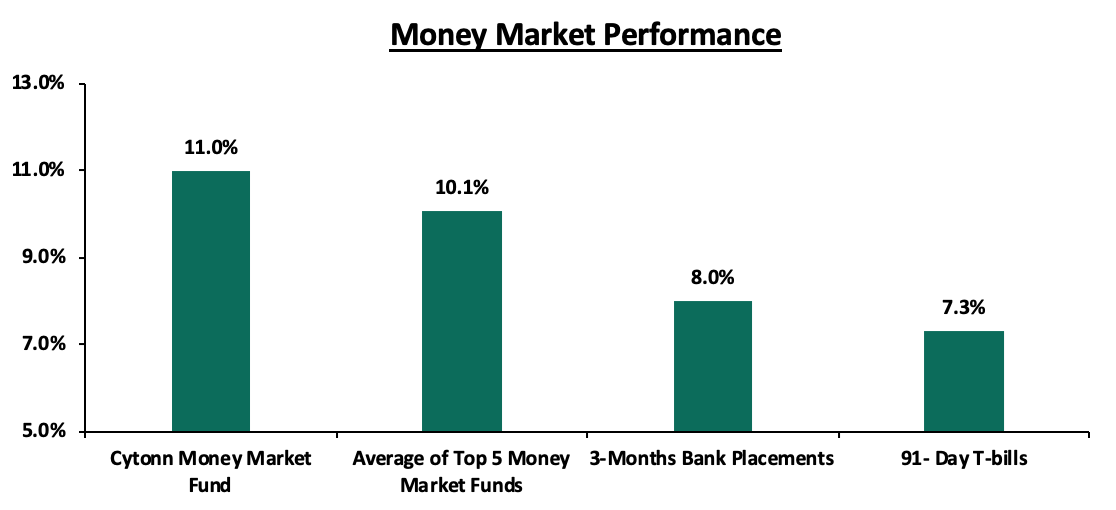
In the money markets, 3-month bank placements ended the week at 8.0% (based on what we have been offered by various banks), the 91-day T-bill and the average of Top 5 Money Market Funds remained unchanged at 7.3% and 10.1%. The yield on the Cytonn Money Market came in at 11.0%, unchanged from the previous week.
Liquidity:
During the week, liquidity in the money markets declined marginally, with the average interbank rate increasing to 4.3%, from 4.2% the previous week, attributed to tax payments with VAT having been due on 20th March 2020. Commercial banks’ excess reserves came in at Kshs 15.9 bn in relation to the 5.25% cash reserves requirement (CRR). The average interbank volumes increased by 159.2% to Kshs 14.0 bn, from Kshs 5.4 bn recorded the previous week.
Kenya Eurobonds:
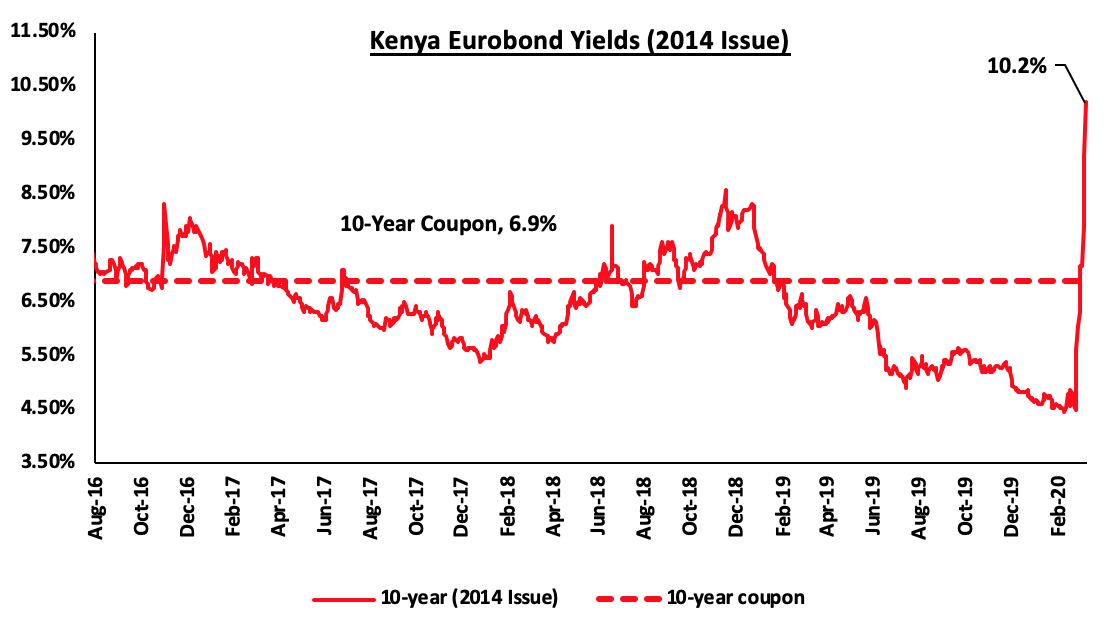
During the week, the yields on all the Eurobonds continued to increase significantly for the second week running, an indication that investors are now attaching a higher risk premium on the country due to the anticipation of slower economic growth attributable to the confirmation of the Coronavirus infection within Kenya’s borders and locust invasion. According to Reuters, the yield on the 10-year Eurobond issued in June 2014 increased by 3.0% points to 10.2%, from 7.2%, recorded the previous week.
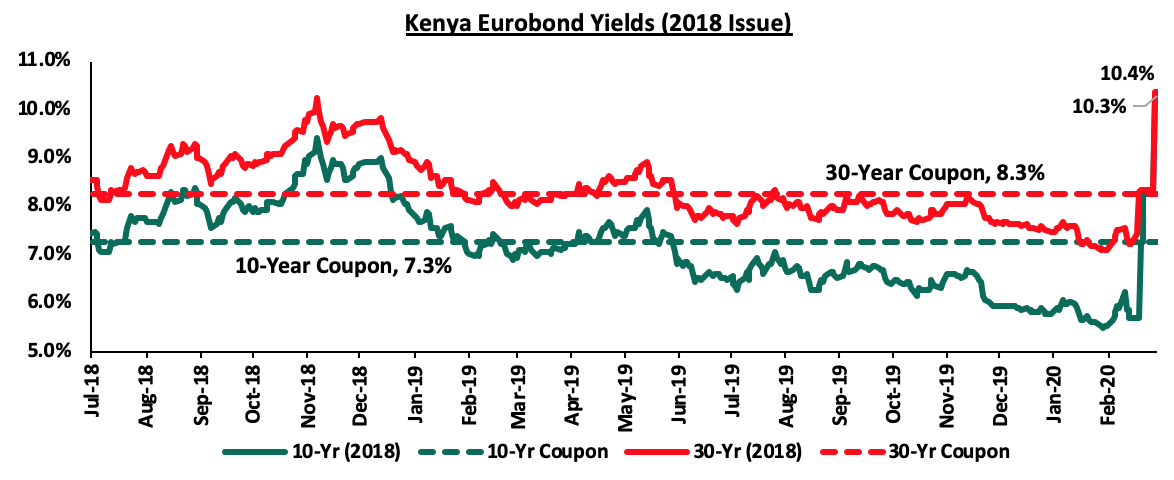
During the week, both the yields on the 10-year and 30-year Eurobonds issued in 2018, increased by 2.0% points to 10.3% and 10.4%, respectively, from 8.3% and 8.4% recorded previous week.
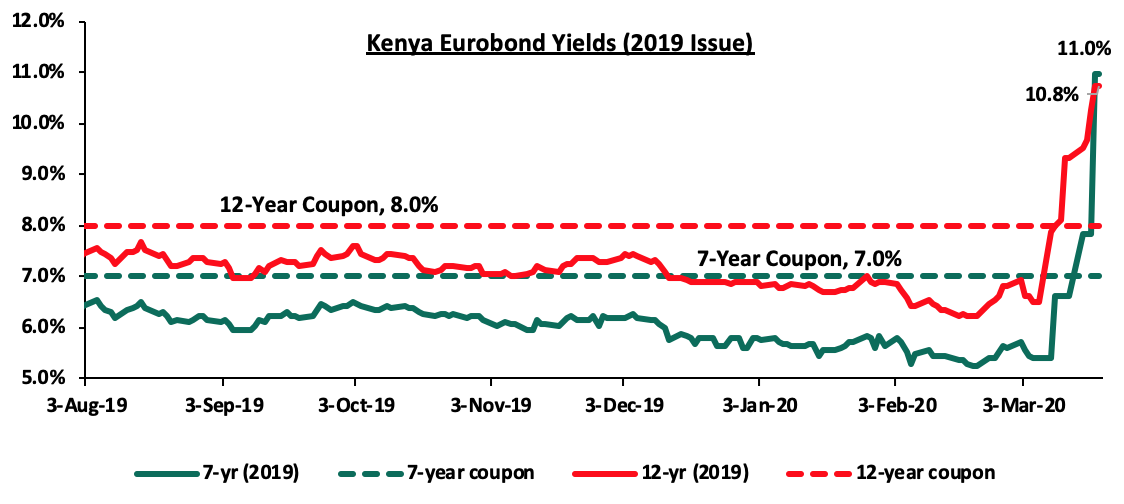
During the week, the yields on the 7-year and 12-year Eurobonds issued in 2019 increased by 4.4% points and 1.2% points, to 11.0% and 10.8%, respectively, from 6.6% and 9.3%, recorded the previous week.
Overall, all Kenyan Eurobond yields have been increasing over the last 2-weeks, a clear indication of investors increased risk perception of lower economic growth in Kenya. The spread between developed markets rates, considering the US 10-year Government Bond and Kenyan Eurobond has increased from 4.0% 2-weeks ago to 9.3% currently.
Kenya Shilling:
The Kenya Shilling depreciated by 4.2% against the US Dollar to Kshs 105.1, from Kshs 102.4 recorded last week, taking the shilling to its lowest level in the last 4.5-years due to persistent worries about the impact of the Coronavirus outbreak on export earnings, prompting CBK to sell dollars to limit the losses. On a YTD basis, the shilling has depreciated by 3.7% against the dollar, in comparison to the 0.5% appreciation in 2019. We expect depreciation of the shilling in 2020 as a result of:
- Rising uncertainties in the global market due to the Coronavirus outbreak, which has seen the disruption of global supply chains. The shortage of imports from China for instance, which accounts for an estimated 21.0% of the country’s imports, is likely to cause local importers to look for alternative import markets, which may be more expensive and as such higher demand for the dollar from merchandise importers, and,
- Subdued diaspora remittances growth following the close of the 10.0% tax amnesty window in July 2019. We also foresee reduced diaspora remittances, owing to the decline in economic activities globally hence a reduction in disposable incomes. This coupled with increased prices of household items abroad might see a reduction in money expatriated into the country.
The shilling is however expected to be supported by:
- High levels of forex reserves, currently at USD 8.2 bn (equivalent to 5.0-months of import cover), above the statutory requirement of maintaining at least 4.0-months of import cover, and the EAC region’s convergence criteria of 4.5-months of import cover,
- CBK’s supportive activities in the money markets, with the Central Bank of Kenya (CBK) having already indicated that it’s looking to purchase USD 400.0 mn from banks for four months beginning from March to bolster the forex reserves.
Monetary Policy:
The Monetary Policy Committee (MPC) is set to meet on Monday, 23rd March 2020, to review the outcome of its previous policy decisions and recent economic developments, and to make a decision on the direction of the Central Bank Rate (CBR). In their previous meeting held on 27th January 2020, MPC lowered the CBR by 25 bps to 8.25% from 8.5%, citing that the economy was operating below its potential level and concluding that there was room for accommodative monetary policy to support economic activity. This was lower than our expectations as per our MPC Note at a rate of 8.5%.
During the meeting on Monday, 23rd March 2020, we expect the MPC to reduce the Central Bank Rate (CBR) by 100 bps to 7.25% from 8.25%, with their decision mainly being supported by:
- Cost-Push Inflation may be a threat to the economy due to supply-side shortages caused by lockdowns across the globe. According to the Kenya National Bureau of Statistics Economic Survey, imports of goods and services stood at around 23.0% of the country’s GDP. The prices of consumer and capital goods in the market may rise to exorbitant levels as the supply will be unable to meet the demand in the market. The locust invasion has plagued the country since the end of 2019 which may greatly affect the agricultural sector, causing a further increase in food prices which has a weight of 36.0% in the Consumer Price Index.
- The instability of the Kenyan Shilling having already lost by 3.7% YTD in 2020 and recording the lowest performance in the last four and a half years, reflecting a less stable economic environment. The country is experiencing high dollar demand from foreigners exiting the market as they direct their funds to safer havens, and,
- The need to avail more money to importers who can import goods from alternative markets, other than China, as they may be more expensive, in a bid to reduce the supply side shortages. The MPC may also cut the rate to encourage financial institutions to lend money to the private sector as most businesses may need to take up loans for business continuity purposes due to subdued revenues.
For our detailed MPC analysis, please see our MPC Note for the 23rd March 2020 meeting here.
Weekly Highlight
During the week, the Central Bank of Kenya (CBK), under Sections 9 and 51 of the CBK Act and following approval by the CBK Board, announced that it has transferred Kshs 7.4 bn from its General Reserve Fund to the Government Consolidated Fund in support of the fight against Coronavirus. The transferred funds were as a result of the demonetization exercise of the older series Kshs 1,000 notes, aimed at addressing the concern of illicit financial flows, and the emerging risk of counterfeits. CBK had highlighted that all the old Kshs 1,000 bank notes in circulation were valued at Kshs 217.6 bn. After the exercise, Kshs 7.4 bn worth of the older Kshs 1,000 notes were rendered worthless. The majority of the money was cash held by individuals who were unable or unwilling to subject themselves to the robust checks the institution had put in place. The transfer was executed by crediting the Ministry of Finance’s Deposit Account at CBK. As such, by issuing the Kshs 7.4 bn to the Treasury, the CBK effectively put the same amount it had withdrawn back into circulation.
We are of the view that this will be an effective measure in sustaining economic output and implementing measures to support businesses. As per the sentiments in our MPC Analysis, signaling an accommodation by lowering the CBR will not be sufficient in combating the effects emanating from the COVID-19 pandemic, as banks will still exercise increased caution on lending especially to businesses that rely on imports hence inhibiting private credit sector growth due to the high risk of credit default, with the possibility of heightened Non Performing Loans if the pandemic is to continue. Despite this, we still believe what businesses and the economy as a whole needs is financial relief to ensure survival during this period of uncertainties. Some of the measures that would be effective include:
- Encourage banks to give concessionary loans at lower rates to facilitate businesses, and as well provide moratoriums on loans that are due,
- Grant tax breaks to companies seeking to increase their capacity to produce import substitute goods, which could even mean zero-rating VAT for the next 3-months,
- Release VAT refunds to assist businesses with managing their cash flow,
- Announce and provide for a Business Stabilization Fund to cushion the impact of the coronavirus, especially for Small & Medium Enterprises (SME’s),
- Consider reducing corporate tax for industries that have been highly affected by the virus such as the aviation industry, or waiving corporate tax for 3 months as well as a reduction in payroll tax for the next 3 months for the low-income bracket workers, and,
- Strengthen the local supply chain for traders to be able to access import substitute goods.
Inflation Projection:
We are projecting the y/y inflation rate for March 2020 to come in within the range of 5.8% - 6.0%, a decline compared to 6.4% recorded in February mainly due to the base effect, as well as the following factors:
- A decline in the transport index, which has a weighting of 8.7% contribution to GDP, with petrol prices having declined by 2.7% to Kshs 110.9 per litre from Kshs 113.9 per litre previously, and diesel prices having declined by 2.6% to Kshs 101.7 per litre, from Kshs 104.4 per litre previously,
- A decline in the housing, water, electricity, gas, and other fuels index mainly driven by the 7.0% decline in kerosene prices to Kshs 95.5 per litre, from 102.7 per litre previously, and,
- As at the time inflation data is collected, which is usually the 2nd and 3rd week of the month of March, supply constraints as a result of Coronavirus had not been felt in the economy, and as such there was no witnessed increase in the prices of everyday items that constitute the basket of goods to calculate inflation. The effects of supply chain disruptions on inflation (due to higher prices) will be felt in the coming months.
We, however, expect the declines to be mitigated by:
- A rise in the food and non-alcoholic beverages index, which has a weighting of 36.0%, mainly driven by the rise in some food prices. We expect the rise to be at a slower pace as compared to February due to the decline in some other food prices with maize flour having slightly gone down as pressure on supply eases following the harvesting of the short-rains crop.
Rates in the fixed income market have remained relatively stable as the government rejects expensive bids. The government is 48.3% ahead of its domestic borrowing target, having borrowed Kshs 325.3 bn against a pro-rated target of Kshs 219.5 bn. We expect an improvement in private sector credit growth considering the repeal of the interest rate cap. This will result in increased competition for bank funds from both the private and public sectors, resulting in upward pressure on interest rates. Owing to this, our view is that investors should be biased towards short-term fixed-income securities to reduce duration risk.
Market Performance
During the week, the equities market was on a downward trajectory, with NASI, NSE 20 and NSE 25 declining by 0.5%, 4.7% and 3.4%, respectively, taking their YTD performance to losses of 20.1%, 23.7% and 21.4%, for the NASI, NSE 20 and NSE 25, respectively. The performance in NASI was driven by losses recorded by large-cap stocks such as EABL, Bamburi, Equity Bank and NCBA of 13.9%, 8.2%, 7.0% and 5.7%, respectively. The losses are attributable to the ongoing Coronavirus pandemic, with investors selling out of the equities market.
Equities turnover decreased by 8.8% during the week to USD 50.0 mn, from USD 54.8 mn recorded the previous week, taking the YTD turnover to USD 390.9 mn. Foreign investors remained net sellers for the week, with a net selling position of USD 28.9 mn, from a net selling position of USD 32.2 mn recorded the previous week. The trend reflects the global equity markets with foreign investors disposing riskier assets in favor of safe havens.
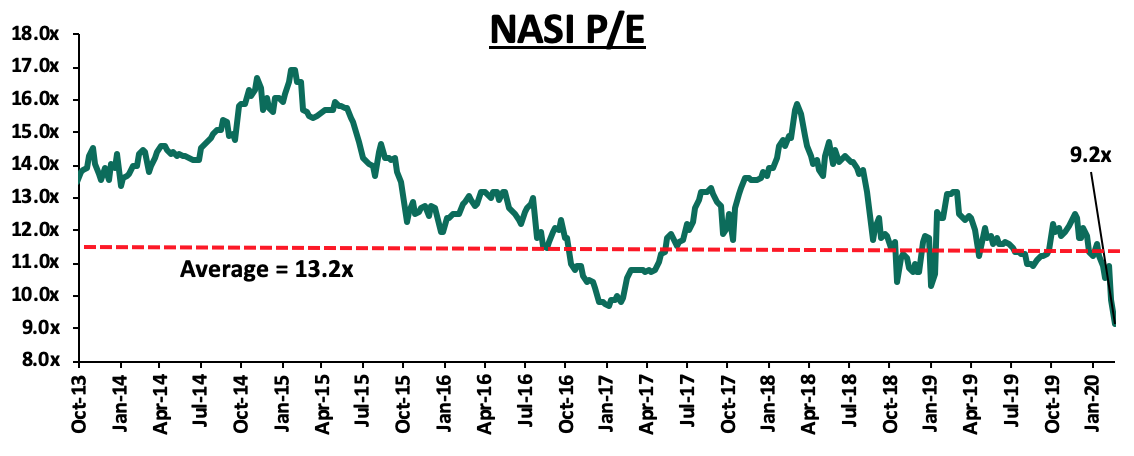
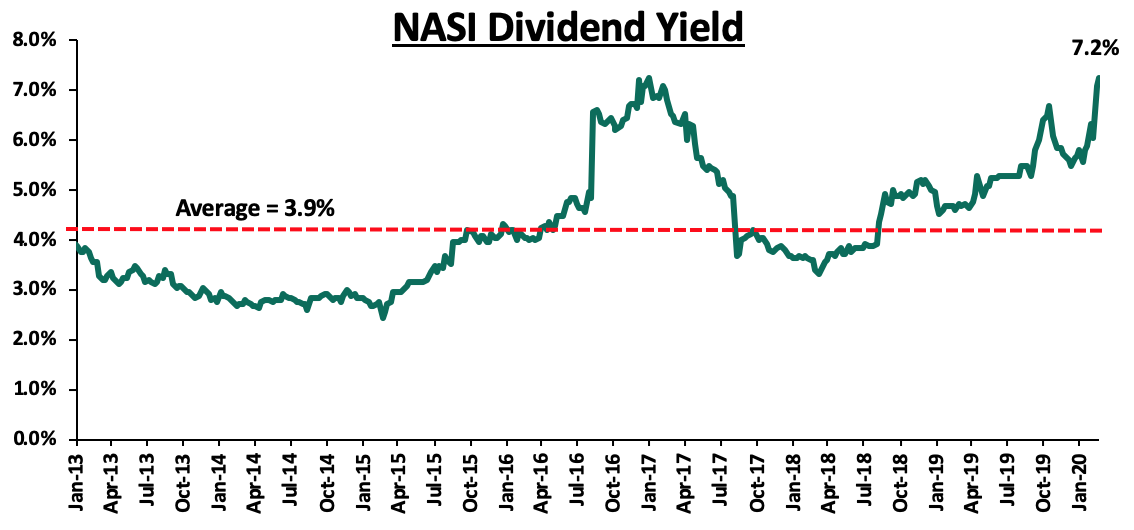
The market is currently trading at a price to earnings ratio (P/E) of 9.2x, 30.7% below the historical average of 13.2x, and a dividend yield of 7.2%, 3.2% points above the historical average of 4.0%. With the market trading at valuations below the historical average, we believe there is value in the market. The current P/E valuation of 9.2x is 5.6% below the most recent trough valuation of 9.7x experienced in the first week of February 2017, and 10.4% above the previous trough valuation of 8.3x experienced in December 2011. The charts below indicate the historical P/E and dividend yields of the market.
Earnings Release
During the week, Equity Group, Co-operative Bank, DTB and Stanchart Bank, released their FY’2019 financial results. Below is a summary of their earnings.
Equity Group Holdings;
Income Statement
- Core earnings per share increased by 13.8% to Kshs 6.0, from Kshs 5.3 in FY’2018, slower than our projections of a 17.6% increase to Kshs 6.2. The performance was driven by a 12.6% increase in total operating income. The variance in core earnings per share growth against our expectations was largely due to the 14.1% rise in total operating expenses to Kshs 44.3 bn, from Kshs 38.8 bn in FY’2018, which was higher than our expectation of a 10.1% increase,
- Total operating income rose by 12.6% to Kshs 75.8 bn, from Kshs 67.3 bn in FY’2018. This was driven by an 8.6% increase in Net Interest Income (NII) to Kshs 45.0 bn, from Kshs 41.4 bn in FY’2018, coupled with a 19.0% rise in Non-Funded Income (NFI) to Kshs 30.8 bn, from Kshs 25.9 bn in FY’2018,
- Interest income rose by 12.2% to Kshs 59.7 bn, from Kshs 53.2 bn in FY’2018. This was driven by a 13.8% increase in interest income on loans and advances to Kshs 41.5 bn, from Kshs 36.4 bn in FY’2018. Interest income on government securities, on the other hand, rose by 3.5% to Kshs 16.9 bn, from Kshs 16.3 bn in FY’2018. The slightly stronger growth in interest income on loans as compared to interest from government securities is indicative of the benefits accruing to Equity Group Holding’s strategy to increase lending to the private sector, focusing on Small and Medium Enterprises. Consequently, the yield on interest-earning assets grew by 0.3% points to 11.3%, from 11.0% in FY’2018, due to the 11.2% growth in interest income outpacing the 8.6% growth in average interest-earning assets,
- Interest expenses rose by 24.8% to Kshs 14.7 bn from Kshs 11.8 bn in FY’2018, following the 17.5% increase in the interest expense on customer deposits to Kshs 11.1 bn, from Kshs 9.4 bn in FY’2018, coupled with a 60.5% increase in other interest expenses to Kshs 3.0 bn, from Kshs 1.8 bn in FY’2018. The cost of funds increased to 2.9%, from 2.7% in FY’2018, owing to a slower increase in interest-bearing liabilities that rose by 15.3% to Kshs 539.5 bn, from Kshs 467.9 bn in FY’2018 that was outpaced by the 24.8% rise in interest expenses. The Net Interest Margin (NIM) remained unchanged at 8.5%, as the NII and average interest-earning assets grew at a similar rate of 8.6% during the year,
- Non-Funded Income (NFI) recorded a 19.0% growth to Kshs 30.8 bn, from Kshs 25.9 bn in FY’2018. The growth was mainly driven by a 41.6% increase in other income to Kshs 6.1 bn, from Kshs 4.3 bn in FY’2018. The growth was also supported by the 13.5% growth in fees and commissions on loans income to Kshs 5.6 bn, from Kshs 4.9 bn in FY’2018, and a 17.1% growth in other fees and commissions to Kshs 15.6 bn, from Kshs 13.3 bn in FY’2018. Forex trading income, on the other hand, grew by 5.9% to Kshs 3.5 bn, from Kshs 3.3 bn in FY’2018, with management noting that the forex income segment benefited from FinTech innovations. As a result, the revenue mix shifted to 59:41 from 62:38 funded to non-funded income, owing to the faster growth in NFI as compared to growth in NII,
- Total operating expenses rose by 14.1% to Kshs 44.3 bn, from Kshs 38.8 bn in FY’2018, largely driven by a 42.8% increase in Loan Loss Provisions (LLP) to Kshs 5.3 bn, from Kshs 3.7 bn in FY’2018, coupled with an 11.8% rise in staff costs to Kshs 12.8 bn, from Kshs 11.5 bn in FY’2018, and a 10.7% growth in other operating expenses to Kshs 26.2 bn, from Kshs 23.7 bn in FY’2018,
- As a result of the 42.8% rise in Loan Loss Provisions (LLP), Cost to Income Ratio (CIR) deteriorated by 0.8% points to 58.5%, from 57.7% in FY’2018. However, without LLP, the CIR improved by 0.7% points to 51.5%, from 52.2% in FY’2018,
- Profit before tax increased by 10.6% to Kshs 31.5 bn, up from Kshs 28.5 bn in FY’2018. Profit after tax recorded a 13.8% growth to Kshs 22.6 bn, from Kshs 19.8 bn, with the difference in growth attributable to the decrease in the effective tax rate to 28.3% from 30.4% in FY’2018, and the deferred tax benefit of Kshs 1.11 bn compared to the deferred tax liability of Kshs 0.7 bn, and,
- The bank recommends a first and final dividend per share of Kshs 2.5, which is a 25.0% rise from the Kshs 2.0 per share paid in FY’2018, which translates to a dividend yield of 6.4% at the current price of Kshs 38.95, and a payout ratio of 41.8%.
Balance Sheet
- The balance sheet recorded an expansion as total assets increased by 17.5% to Kshs 673.7 bn, from Kshs 573.4 bn in FY’2018. Growth was supported by a 23.3% increase in the loan book to Kshs 366.4 bn, from Kshs 297.2 bn, coupled with a 6.2% increase in government securities to Kshs 138.6 bn from Kshs 130.4 bn in FY’2018,
- Total liabilities rose by 17.4% to Kshs 561.9bn from Kshs 478.4 bn in FY’2018, driven by a 14.2% increase in customer deposits to Kshs 482.8 bn, from Kshs 422.8 bn in FY’2018. Deposits per branch increased by 9.9% to Kshs 1.6 bn, from Kshs 1.5 bn in FY’2018, with the number of branches also increasing by 9 to 294 branches. Borrowings, on the other hand, rose by 28.1% to Kshs 56.6 bn, from Kshs 44.2 bn in FY’2018,
- The faster growth in loans as compared to the growth in deposits, led to a growth in the loan to deposit ratio to 75.9%, from 71.3% in FY’2018,
- Gross Non-Performing Loans (NPLs) rose by 23.4% to Kshs 36.6 bn in FY’2019, from Kshs 29.4 bn in FY’2018. Consequently, the NPL ratio deteriorated to 9.5% in FY’2019, from 9.2% in FY’2018, attributable to a 23.4% growth in Non-Performing Loans, which outpaced the 20.5% growth in gross loans. The main sectors that contributed to the deterioration in asset quality were SMEs and Large Enterprise sectors contributing 11.3% and 9.4%, respectively, to total NPLs. The group’s Tanzania subsidiary contributed 38.1% of the NPLs, with South Sudan and Congo contributing 15.5% and 11.5%, respectively. With general Loan Loss Provisions increasing by 34.8% to Kshs 12.9 bn, from Kshs 9.6 bn in FY’2018, the NPL coverage improved to 47.5% in FY’2019 from 43.9% in FY’2018.
- Shareholders’ Funds grew by 17.7% to Kshs 110.7 bn in FY’2019 from Kshs 94.1 bn in FY’2018, supported by a 15.8% increase in retained earnings to Kshs 89.7 bn from Kshs 77.5 bn,
- Equity Group remains sufficiently capitalized with a core capital to risk-weighted assets ratio of 16.3%, 5.8% points above the statutory requirement of 10.5%. In addition, the total capital to risk-weighted assets ratio came in at 19.8%, exceeding the statutory requirement of 14.5% by 5.3% points. Adjusting for IFRS 9, the core capital to risk-weighted assets stood at 16.7%, while total capital to risk-weighted assets came in at 20.2%, and,
- The bank currently has a Return on Average Assets (ROaA) of 3.6%, and a Return on Average Equity (ROaE) of 22.0%.
Key Take-Outs:
- The bank’s geographical diversification strategy has continued to emerge as a net positive, with the bank’s various subsidiaries in Uganda, DRC, Rwanda, Tanzania and South Sudan cumulatively contributing 18.0% of the bank’s total profitability and 27.0% of the group’s total asset base. Improved efficiencies in the subsidiaries saw their cost structure contribution to the Group, improve to 35.0%, from 37.0% in 2018,
- Increased innovation and digitization have seen 97.0% of all transactions of the bank being done on alternative channels, with mobile transactions taking up 79.0% of all loan transactions, and agency banking contributing 11.0% of all transactions. However, in terms of the value of transactions, branches contributed 49.0% of the value of all transactions, while mobile and agency banking contributed 26.0% and 17.0%, respectively. This highlights the transformation of branches to handle high-value transactions. This transformation aids the bank by offering its ecosystem banking products to corporate and SME clients,
- The Group’s Non-Funded Income recorded a 19.0% growth to Kshs 30.8 bn, from Kshs 25.9 bn in FY’2018. The growth was mainly driven by a 16.1% increase in total fees and commissions on loans to Kshs 21.2 bn, from Kshs 18.3 bn in FY’2018, coupled with a 5.9% increase in foreign exchange trading income to Kshs 3.5 bn, from Kshs 3.3 bn in FY’2018. However, with the bank’s alternative channels gaining prominence in the frequency of transactions, we expect this to contribute positively towards the NFI revenue stream. With the banks’ NFI contribution to total income currently at 40.6%, it is still above the current industry average of 38.0%, and,
- The bank’s asset quality deteriorated, with the NPL ratio deteriorating to 9.5% in FY’2019 from 9.2% in FY’2018 but still below the industry average of 12.1%. The main sectors that contributed to the slight deterioration in asset quality are SMEs and Large Enterprise sectors contributing 11.3% and 9.4%, respectively, to total NPL. The group’s Tanzania subsidiary contributed 38.1% of the NPLs, with South Sudan and Congo contributing 15.5% and 11.5%, respectively. With the repeal of interest rate cap law, the bank has ramped up its loan disbursement to its customers in the region and will have to improve on its credit assessment in these markets to bring down the high NPL ratios in some of its regional subsidiaries.
Going forward, the factors that would drive the bank’s growth would be:
- Channeled diversification is likely to further improve on efficiency with emphasis on alternative channels of transactions, as the bank rides on the digital revolution wave, thereby further improving the cost to income ratio by cost rationalization and revenue expansion. This will likely propel the bank’s prospects of achieving sustainable growth, as it replicates its successful business model across its various regional subsidiaries, and,
- The bank’s operating model of enhancing balance sheet agility is likely to place the bank in a prime position to take advantage of any opportunities that may arise, such as attractive inorganic growth via acquisitions or fast lending with the repeal of the interest rate cap law. The bank’s balance sheet agility is seen with a liquidity ratio of 52.1%, loan deposit ratio of 75.9% and a core capital to risk-weighted asset ratio of 19.8%.
For a comprehensive analysis, please see our Equity Group FY’2019 Earnings Note.
Co-operative Bank;
Income Statement
- Core earnings per share increased by 12.4% to Kshs 2.4 in FY’2019, from Kshs 2.2 in FY’2018, which was not in line with our projections of a 4.1% increase. The performance was driven by a 10.9% increase in total operating income to Kshs 48.5 bn in FY’2019, from Kshs 43.7 in FY’2018, which outpaced the 8.2% increase in total operating expenses. The variance in core earnings per share growth against our expectations was largely due to the 8.2% rise in total operating expenses to Kshs 27.8 bn in FY’2019, from Kshs 25.7 bn in FY’2018, which was not in line with our expectation of an 11.3% increase to Kshs 28.6 bn,
- Total operating income increased by 10.9% to Kshs 48.5 bn in FY’2019, from Kshs 43.7 in FY’2018. This was due to a 33.1% increase in Non-Funded Income (NFI) to Kshs 17.2 bn from Kshs 12.9 bn in FY’2018. The growth was also supported by the 1.7% marginal growth in Net Interest Income (NII) to Kshs 31.3 bn from Kshs 30.8 bn in FY’2018,
- Interest income rose by 1.4% to Kshs 43.6 bn in FY’2019, from Kshs 43.0 bn in FY’2018. The marginal growth recorded was as a result of a 3.5% decline in interest income from loans and advances to Kshs 31.8 bn, from Kshs 32.9 bn in FY’2018, which weighed down the 16.0% rise in interest income from government securities to Kshs 11.4 bn from Kshs 9.8 bn in FY’2018. Consequently, the yield on interest-earning assets declined to 11.8%, from 12.7% in FY’2018 due to the faster 14.7% growth in interest-earning assets compared to the 1.4% growth in interest income,
- Interest expenses rose marginally by 0.8% to Kshs 12.3 bn in FY’2019, from Kshs 12.2 bn in FY’2018, largely due to a 28.7% rise in other interest expenses to Kshs 1.6 bn from Kshs 1.2 bn in FY’2018. This was offset by interest expense on customer deposits, which declined by 2.1% to Kshs 10.7 bn from Kshs 10.9 bn in FY’2018. The cost of funds declined to 3.6%, from 3.8% in FY’2018, owing to an 8.7% rise in interest-bearing liabilities to Kshs 359.4 bn, from Kshs 330.5 bn in FY’2018 which outpaced the 0.8% rise in interest expenses,
- Non-Funded Income rose by 33.1% to Kshs 17.2 bn in FY’2019, from Kshs 12.9 bn in FY’2018. The increase was mainly driven by the 460.7% increase in fees and commissions on loans to Kshs 3.2 bn, from Kshs 0.6 bn in FY’2018, as well as a 7.2% increase in other fees and commissions to Kshs 9.6 bn from Kshs 8.9 bn in FY’2018. The improvement in NFI was however weighed down by the 6.0% decline in forex trading income to Kshs 2.1 bn, from Kshs 2.3 bn in FY’2018. As a consequence, the revenue mix shifted to 65:35, from 70:30 in FY’2018 owing to the fast growth in NFI,
- Total operating expenses rose by 8.2% to Kshs 27.8 bn in FY’2019, from Kshs 25.7 bn in FY’2018, largely driven by the 37.9% rise in Loan Loss Provisions (LLP) to Kshs 2.5 bn from Kshs 1.8 bn in FY’2018, coupled with staff costs increase of 8.1% to Kshs 12.4 bn in FY’2019 from Kshs 11.5 bn in FY’2018,
- The Cost to Income Ratio (CIR) improved to 57.4%, from 58.8% in FY’2018, following the faster rise in total operating profit that outpaced total operating expenses. Without LLP, the cost to income ratio also improved to 52.1% from 54.6% in FY’2018,
- The bank registered a growth of 12.4% in profit after tax to Kshs 14.3 bn in FY’2019 from Kshs 12.7 bn in FY’2018 and a 14.0% growth in profit before tax to Kshs 20.7 bn from Kshs 18.2 bn in FY’2018, with the effective tax rate declining to 31.6% in FY’2019 from 32.7% seen in FY’2018, and,
- The bank recommends a final dividend per share of Kshs 1.0, unchanged from the Kshs 1.0 per share paid in FY’2018, which translates to a dividend yield of 7.8% at the current price of Kshs 12.75, and a payout ratio of 41.0%.
Balance Sheet
- The balance sheet recorded an expansion as total assets grew by 10.5% to Kshs 457.0 bn in FY’2019 from Kshs 413.4 bn in FY’2018, owing to the increases in government securities by 46.8% to Kshs 117.8 bn in FY’2019 from Kshs 80.3 bn, and net loans and advances by 8.7% to Kshs 266.7 bn in FY’2019 from Kshs 245.4 bn in FY’2018, despite a decrease in placements by 36.1% to Kshs 9.7 from Kshs 15.2bn,
- Total liabilities grew by 9.9% to Kshs 376.2 bn in FY’2019 from Kshs 342.2 bn in FY’2018, which was largely attributable to the 8.7% rise in customer deposits to Kshs 332.8 bn in FY’2019, from Kshs 306.1 bn in FY’2018. Borrowings also recorded a 10.3% rise by to Kshs 26.4 bn from Kshs 23.7 bn in FY’2018,
- The slightly faster 8.72% growth in deposits which outpaced the 8.68% growth in net loans and advances, led to a marginal decline in the loan to deposit ratio to 80.1%, from 80.2% in FY’2018. Deposits per branch increased by 6.0% to Kshs 2.1 bn from Kshs 2.0 bn in FY’2018, as the number of branches increased by 4 to 159 branches,
- Gross Non-Performing Loans (NPLs) increased by 7.5% to Kshs 31.6 bn in FY’2019, from Kshs 29.4 bn in FY’2018. The NPL ratio, however, improved to 11.2% in FY’2019, from 11.3% in FY’2018 owing to faster growth in gross loans by 9.1% outpacing the 7.5% growth in gross non-performing loans,
- General Loan Loss Provisions increased by 13.2% to Kshs 11.3 bn, from Kshs 9.9 bn in FY’2018. The NPL coverage ratio thus improved to 51.8% in FY’2019 from 48.1% in FY’2018, due to the faster growth in General Loan Loss Provisions which outpaced the growth in Gross Non-Performing Loans (NPLs),
- Shareholders’ funds increased by 13.6% to Kshs 79.3 bn in FY’2019 from Kshs 69.9 bn in FY’2018, mainly driven by a 15.6% increase in the retained earnings to Kshs 62.4 bn, from Kshs 54.0 bn in FY’2018,
- Co-operative Bank remains sufficiently capitalized with a core capital to risk-weighted assets ratio of 16.3%, 5.8% points above the statutory requirement of 10.5%. In addition, the total capital to risk-weighted assets ratio came in at 16.8%, exceeding the statutory requirement of 14.5% by 2.3% points. Adjusting for IFRS 9, the core capital to risk-weighted assets stood at 16.3%, while total capital to risk-weighted assets came in at 16.8%, and,
- The bank currently has a Return on Average Assets (ROaA) of 3.3%, and a Return on Average Equity (ROaE) of 19.2%.
Key Take-Outs:
- Non-Funded Income rose by 33.1% to Kshs 17.2 bn in FY’2019, from Kshs 12.9 bn in FY’2018, exceeding the industry average growth of 18.5%. The increase was mainly driven by the 460.7% increase in fees and commissions on loans to Kshs 3.2 bn, from Kshs 0.6 bn in FY’2018, as well as a 7.2% increase in other fees and commissions to Kshs 9.6 bn from Kshs 8.9 bn in FY’2018. However, the improvement in NFI was weighed down by the 6.0% decline in forex trading income to Kshs 2.1 bn, from Kshs 2.3 bn in FY’2018. As a consequence, the revenue mix shifted to 65:35, from 70:30 in FY’2018 owing to the fast growth in NFI, which was attributable to the increased focus on E-Credit and its mobile banking platform M-Coop Cash to grow commissions, and,
- The bank’s asset quality improved, with the NPL ratio reducing marginally to 11.2% in FY’2019, from 11.3% in FY’2018 owing to faster growth in gross loans by 9.1% outpacing the 7.5% growth in gross non-performing loans, which is attributable to the implementation of credit management strategies implemented since the beginning of the year such as adherence to credit risk appetite and limits, credit risk early warning indicators, proper credit appraisal and approval mechanisms. The main sectors that contributed to Non-Performing Loans are Trade, Personal Consumer and Manufacturing sectors contributing 32.0%, 18.0% and 16.0%, respectively, to total NPL.
Going forward, the factors that would drive the bank’s growth would be:
- Business Model Restructuring - The banks’ has continued implementation of “Soaring Eagle” transformation initiatives is expected to drive growth and increase efficiency. The initiatives are set on the following eight key pillars; branch transformation, MSME transformation, sales force effectiveness, shared services and digitization, NPL management and credit processes, cost management, data analytics, and staff productivity. We expect the initiatives to culminate into improved revenue levels, and,
- Interest Rate Cap Repeal - With the repeal of the interest rate cap, we expect the bank’s Net Interest Margin (NIM) to recover. However, proper credit management strategies should be maintained to prevent the deterioration of the loan book’s quality.
For a comprehensive analysis, please see our Co-operative Bank FY’2019 Earnings Note.
Standard Chartered Bank Kenya;
Income Statement
- Core earnings per share increasing by 1.7% to Kshs 24.0 from Kshs 23.6 in FY’2018, below our expectations of a 9.8% increase to Kshs 25.9. The performance was driven by a 0.4% increase in total operating income, coupled with a 1.3% decline in total operating expenses. The variance in core earnings per share growth against our expectations was due to the 0.4% increase in total operating income, which was lower than our expectation of a 4.7% increase,
- Total operating income increased marginally by 0.4% to Kshs 28.7 bn from Kshs 28.6 bn in FY’2018. The rise was due to a 0.3% increase in Non-Funded Income (NFI) to Kshs 9.23 bn from Kshs 9.20 bn in FY’2018, coupled with a 0.4% increase in Net Interest Income (NII) to Kshs 19.5 bn, from Kshs 19.4 bn in FY’2018,
- Interest income declined by 5.9% to Kshs 25.3 bn, from Kshs 26.9 bn in FY’2018. This was driven by a 15.0% decline in interest income from government securities to Kshs 10.6 bn, from Kshs 12.5 bn in FY’2018. This was however offset by a 2.1% increase in interest income on loans and advances to Kshs 13.4 bn, from Kshs 13.1 bn in FY’2018. The yield on interest-earning assets declined by 0.9% points to 9.6%, from 10.5% in FY’2018, attributed to a decline in yields on government securities, which saw interest income declining by 5.9% despite the 1.9% growth recorded in the average interest-earning assets,
- Interest expense declined by 22.4% to Kshs 5.8 bn, from Kshs 7.5 bn in FY’2018, attributable to a 19.9% decline in interest on customer deposits to Kshs 5.2 bn from Kshs 6.4 bn in FY’2018, coupled with a 40.2% decline in other interest expenses to Kshs 0.6 bn, from Kshs 1.0 bn in FY’2018. Consequently, the cost of funds declined to 2.7% from 3.3% in FY’2018, owing to the faster 22.4% decline in interest expense that outpaced the 3.8% decline in the average interest-bearing liabilities. Net Interest Margin (NIM) declined marginally to 7.4%, from 7.5% in FY’2018, owing to the 0.4% growth in Net Interest Income (NII) which grew slower than the 1.9% growth in the average interest-earning assets,
- Non-Funded Income (NFI) rose by 0.3% to Kshs 9.23 bn, from Kshs 9.2 bn in FY’2018. The increase was mainly driven by an 11.6% rise in foreign exchange trading income to Kshs 3.2 bn, from Kshs 2.8 bn in FY’2018. However, this was offset by a 4.7% decline in total fees and commissions to Kshs 5.1 bn, from Kshs 5.4 bn in FY’2018. The revenue mix remained unchanged at 68:32 funded to non-funded income, owing to a comparable increase in NII and NFI,
- Total operating expenses declined by 1.3% to Kshs 16.5 bn, from Kshs 16.8 bn, largely driven by a 70.3% decline in loan loss provisions to Kshs 0.6 bn from Kshs 1.9 bn coupled with a 3.1% decline in staff costs to Kshs 7.1 bn, from Kshs 7.4 bn in FY’2018. The large decline in loan loss provisions was however offset by a 53.6% rise in depreciation and amortization charges to Kshs 1.3 bn from Kshs 0.8 bn in FY’2018,
- Due to the 70.3% decline in Loan Loss Provisions (LLP), Cost to Income Ratio (CIR) improved to 57.6%, from 58.6% in FY’2018. Without LLP however, the cost to income deteriorated to 55.6%, from 51.8% in FY’2018, an indication of reduced efficiency,
- Profit before tax increased by 2.8% to Kshs 12.2 bn, from Kshs 11.8 bn in FY’2018. Profit after tax grew by 1.7% to Kshs 8.2 bn in FY’2019, from Kshs 8.1 bn in FY’2018, as the effective tax rate increased to 32.3% from 31.6% in FY’2018, and,
- The bank recommends a final dividend of Kshs 15.0 per share, translating to a total Dividend Per Share (DPS) of Kshs 20.0 for the year. This is a 5.3% rise from the Kshs 19.0 per share paid in FY’2018, which translates to a dividend yield of 10.3% at the current price of Kshs 193.25, and a payout ratio of 83.4%.
Balance Sheet
- The balance sheet recorded an expansion as total assets increased by 5.9% to Kshs 302.1 bn, from Kshs 285.4 bn in FY’2018. This growth was largely driven by the 8.5% increase in the loan book to Kshs 128.7 bn, from Kshs 118.7 bn in FY’2018, coupled with a 5.5% increase in placements to Kshs 39.5 bn, from Kshs 37.5 bn in FY’2018 and a 0.9% marginal increase in government securities to Kshs 99.6 bn, from Kshs 98.7 bn in FY’2018,
- Total liabilities increased by 6.5% to Kshs 254.4 bn from Kshs 238.8 bn in FY’2018. This was driven by a 5,047.3% increase in placements to Kshs 8.0 bn, from Kshs 0.2 bn in FY’2018, despite the banks’ strategy in 2019 to shift focus from corporate banking to retail banking, coupled with a 1.8% increase in customer deposits to Kshs 228.4 bn, from Kshs 224.3 bn in FY’2018. Deposits per branch increased by 1.8% to Kshs 6.3 bn, from Kshs 6.2 bn in FY’2018, with the number of branches as at the end of 2019 being 36, an increase from 34 as at end of 2018,
- The faster 8.5% growth of loans, which outpaced the 1.8% growth in deposits, led to an increase in the loan to deposit ratio to 56.3%, from 52.9% in FY’2018. The loan growth to Kshs 128.7 bn, from Kshs 118.7 bn in FY’2018 outpaced the deposit growth to Kshs 228.4 bn, from Kshs 224.3 bn in FY’2018,
- Gross Non-Performing Loans (NPLs) declined by 7.4% to Kshs 20.1 bn in FY’2019, from Kshs 21.7 bn in FY’2018. Consequently, the NPL ratio improved to 13.9% in FY’2019 from 16.3% in FY’2018, owing to the slower 7.4% decline in non-performing loans despite the 8.5% growth in gross loans (after adding back interest suspense). General Loan Loss Provisions (LLPs) declined by 70.3% to Kshs 0.6 bn, from Kshs 1.9 bn in FY’2018 consequently, the NPL coverage increased to 78.7% in FY’2019, from 67.0% in FY’2018, owing to the Kshs 1.6 bn decline in NPLs, compared to the Kshs 1.4 bn decline in LLPs,
- Shareholders’ funds increased by 2.4% to Kshs 47.8 bn in FY’2019 from Kshs 46.6 bn in FY’2018, attributable to a 7.0% rise in proposed dividends to Kshs 5.2 bn, from Kshs 4.9 bn in FY’2018,
- Standard Chartered Bank is currently sufficiently capitalized with a core capital to risk-weighted assets ratio of 14.7%, 4.2% points above the statutory requirement of 10.5%. In addition, the total capital to risk-weighted assets ratio was 17.7%, exceeding the statutory requirement of 14.5% by 3.2% points. Adjusting for IFRS 9, the core capital to risk-weighted assets stood at 14.8%, while total capital to risk-weighted assets came in at 17.8%, and,
- The bank currently has a Return on Average Assets (ROaA) of 2.8%, and a Return on Average Equity (ROaE) of 17.5%.
Key Take-Outs:
- There was a decline in efficiency levels as the cost to income ratio without LLP worsened to 55.6% from 51.8% in FY’2018. The deterioration was largely attributable to an 18.3% rise in other operating expenses, which depressed the bottom line. The rising inefficiency was largely due to the bank’s investment in the development of robust ICT systems to enhance service delivery to clients, and,
- The bank’s asset quality improved, with the NPL ratio declining to 13.9%, from 16.3% in FY’2018. The improving NPL ratio is attributable to a 7.4% decline in gross non-performing loans to Kshs 20.1 bn, from Kshs 21.7 bn in FY’2018 compared to the 8.5% growth in gross loans to Kshs 144.5 bn, from Kshs 133.2 bn in FY’2018.
Going forward, we expect the bank’s growth to be driven by:
- Continued focus on promoting the usage of the bank’s alternative channels is likely to continue boosting the company’s Non-Funded Income (NFI) as well as aiding in improving operational efficiency levels, which deteriorated in FY’2019 as evidenced by the worsening of the cost to income ratio to 55.6% from 51.8% in FY’2018. Revenue expansion coupled with cost containment will be key in boosting the bank’s bottom line.
For a comprehensive analysis, please see our Standard Chartered Bank Kenya FY’2019 Earnings Note.
Diamond Trust Bank Kenya;
Income Statement
- Diamond Trust Bank Kenya released their FY’2019 financial results, with core earnings per share increasing by 1.6% to Kshs 24.3, from Kshs 23.9 in FY’2018, slower than our expectation of a 3.7% increase to Kshs 24.8 per share. The performance was driven by an 8.7% decline in total operating expenses, which mitigated the 3.8% decline in total operating income. The variance in core earnings per share growth against our expectations was largely due to the slower 8.7% decline in total operating expense, against our 12.3% expectations,
- Total operating income declined by 3.8% to Kshs 24.5 bn from Kshs 25.5 bn in FY’2018. This was due to a 6.5% decline in Net Interest Income (NII) to Kshs 18.7 bn, from Kshs 20.0 bn in FY’2018, offsetting the 6.2% increase in Non-Funded Income (NFI) to Kshs 5.8 bn, from Kshs 5.4 bn in FY’2018,
- Interest income declined by 6.9% to Kshs 32.9 bn from Kshs 35.3 bn in FY’2018. This was driven by a 9.1% decline in interest income from loans and advances to Kshs 20.0 bn, from Kshs 22.0 bn in FY’2018, coupled with a 3.9% decline in interest income from government securities to Kshs 12.5 bn from Kshs 13.0 bn in FY’2018. The interest income from deposit placements however increased by 32.2% to Kshs 0.4 bn from Kshs 0.3 bn in FY’2018. The yield on interest-earning assets declined to 9.9% from 10.9% in FY’2018, largely attributable to a decline in yields on government securities as well as a decline in lending rates, which saw interest income decline by 6.9%, coupled up with by the 2.6% decline recorded in the average interest-earning assets,
- Interest expenses declined by 7.3% to Kshs 14.1 bn from Kshs 15.3 bn in FY’2018, following a 9.9% decline in interest expense on customer deposits to Kshs 12.1 bn from Kshs 13.5 bn in FY’2018, coupled with a 20.0% decline in interest expense on placement liabilities to Kshs 0.6 bn from Kshs 0.8 bn in FY’2018. Cost of funds, however, declined to 4.5% from 4.9% in FY’2018, owing to the faster 7.3% decline in interest expenses that outpaced the 0.2% decline in interest-bearing liabilities to Kshs 314.0 bn from Kshs 314.7 bn in FY’2018. Net Interest Margin (NIM) declined to 5.6%, from 6.2% in FY’2017 due to a 6.5% decline in NII coupled up with a 2.6% decline in average interest-earning assets
- Non-Funded Income (NFI) rose by 6.2% to Kshs 5.8 bn, from Kshs 5.4 bn in FY’2018. The increase was mainly driven by the 4.3% increase in fees and commissions to Kshs 1.34 bn from Kshs 1.28 in FY’2018 coupled up 16.5% growth in the forex trading income to Kshs 1.8 bn from Kshs 1.6 bn in FY’2018. The growth in NFI was however weighed down by the 7.2% decline in other non-interest income, to Kshs 0.39 bn from Kshs 0.42 in FY’2018. As a result, the revenue mix shifted to 76:24 from 79:21 funded to non-funded income, owing to the faster growth in NFI as compared to the decline in NII,
- Total operating expenses declined by 8.7% to Kshs 13.2 bn from Kshs 14.9 bn in FY’2018, largely driven by the 55.6% decline in Loan Loss Provisions (LLP) to Kshs 1.3 bn from Kshs 3.0 bn in FY’2018 and, staff costs, which rose by 11.4%, to Kshs 4.7 bn from Kshs 4.2 bn in FY’2018. However, this was offset by other operating expenses which declined by 1.1% to Kshs 7.2 bn from Kshs 7.3 bn in FY’2018,
- The Cost to Income Ratio (CIR) improved to 54.0 %, from 56.9% in FY’2018. However, without LLP, the cost to income ratio deteriorated to 48.6%, from 45.2% in FY’2018, highlighting a decline in the levels of efficiency,
- Profit before tax rose by 2.4% to Kshs 11.3 bn, from Kshs 11.0 bn in FY’2018. Profit after tax grew by 2.7% to Kshs 7.3 bn in FY’2019, from Kshs 7.1 bn in FY’2018, with the effective tax rate declining marginally to 35.5% from 35.6% in FY’2018,
- The bank recommends a first and final dividend of Kshs 2.7 per share, which is a 3.8% rise from Kshs 2.6 per share paid in FY’2018. This translates to a dividend yield of 2.9% at the current price of Kshs 90.0, and a payout ratio of 10.4%.
Balance Sheet
- The balance sheet recorded an expansion as total assets increased by 2.3% to Kshs 386.2 bn from Kshs 377.7 bn in FY’2018. This growth was largely driven by a 12.9% increase in government securities to Kshs 132.5 bn from Kshs 117.3 bn in FY’2018, coupled with a 45.3% increase in other assets to Kshs 13.1 bn from Kshs 9.0 bn in FY’2018. The loan book on the other hand expanded by 3.1% to Kshs 199.1 bn from Kshs 193.1 bn in FY’2018. The growth in assets was however slowed down by a 41.2% decrease in placements to Kshs 8.3 bn from Kshs 14.2 bn in FY’2018,
- Total liabilities rose by 0.9% to Kshs 321.7 bn from Kshs 318.8 bn in FY’2018, driven by a 31.0% increase in placement liabilities to Kshs 22.5 bn from Kshs 17.1 bn in FY’2018, coupled with the 89.0% increase in other liabilities to Kshs 7.7 bn from Kshs 4.1 bn in FY’2018. The growth was however mitigated by the 22.7% decline in borrowings to Kshs 11.4 bn from Kshs 14.7 bn in FY’2018, coupled with the 0.9% decline in customer deposits to Kshs 280.2 bn from Kshs 282.9 bn in FY’2018. Deposits per branch declined by 0.9% to Kshs 2.05 bn from Kshs 2.06 bn in FY’2018, as the number of branches remaining unchanged at 137 in FY’2019,
- Loans to deposit ratio increased to 71.1% from 68.3% in FY’2018, owing to the growth in net loans, coupled with declining customer deposits during the period,
- Gross Non-Performing Loans (NPLs) rose by 16.9% to Kshs 15.9 bn in FY’2019 from Kshs 13.6 bn in FY’2018. Consequently, the NPL ratio deteriorated to 7.6% in FY’2019 from 6.8% in FY’2018. General Loan Loss Provisions increased by 67.6% to Kshs 9.1 bn from Kshs 5.4 bn in FY’2018. Consequently, the NPL coverage increased to 71.6% in FY’2019 from 50.6% in FY’2018,
- Shareholders’ funds increased by 9.7% to Kshs 58.9 bn in FY’2019 from Kshs 53.7 bn in FY’2018, largely due to the 12.9 % increase in the retained earnings to Kshs 47.5 bn, from Kshs 42.1 bn in FY’2018,
- Diamond Trust Bank is currently sufficiently capitalized with a core capital to risk-weighted assets ratio of 19.1%, 8.6% points above the statutory requirement. In addition, the total capital to risk-weighted assets ratio was 20.9%, exceeding the 14.5% statutory requirement by 6.4% points. Adjusting for IFRS 9, the core capital to risk-weighted assets stood at 19.9%, while total capital to risk-weighted assets came in at 21.8%,
- The bank currently has a Return on Average Assets (ROaA) of 1.9%, and a Return on Average Equity (ROaE) of 12.9%.
Key Take-Outs:
- The bank’s asset quality deteriorated, with the NPL ratio increasing to 7.6% from 6.7% in FY’2018. The decline in asset quality is attributable to a 16.9% increase in the gross NPLs to Kshs 15.9 bn in FY’2019 from Kshs 13.6 bn in FY’2018,
- The bank recorded an improved performance on the NFI income segment, which recorded a 6.2% growth y/y, largely supported by the 16.5% increase in forex trading income, coupled with a 4.3% increase in fees and commissions. Consequently, NFI contribution to total income rose to 23.6% from 21.3% in FY’2018. This, however, remains below the current industry average of 38.0%,
- There was a decline in efficiency levels as the cost to income ratio without LLP worsened to 48.6% from 45.2% in FY’2018. The deterioration was largely attributable to an 11.4% rise in staff cost, which depressed the bottom line.
Going forward, we expect the bank’s growth to be driven by:
- Geographical diversification - The bank’s forays into other markets such as Tanzania, Uganda, and Burundi, may aid the bank’s growth, given the lack of loan pricing controls in those markets. Continued focus on those markets would aid in alleviating the compressed interest income regime in the Kenyan market.
For a comprehensive analysis, please see our Diamond Trust Bank Kenya FY’2019 Earnings Note.
The table below summarizes the performance of listed banks that have released their FY’2019 results:
|
Bank |
Core EPS Growth |
Interest Income Growth |
Interest Expense Growth |
Net Interest Income Growth |
Net Interest Margin |
Non-Funded Income Growth |
NFI to Total Operating Income |
Growth in Total Fees & Commissions |
Deposit Growth |
Growth in Government Securities |
Loan to Deposit Ratio |
Loan Growth |
Return on Average Equity |
|
Equity Group |
13.8% |
12.2% |
24.8% |
8.6% |
8.5% |
19.0% |
40.6% |
16.1% |
14.2% |
6.2% |
75.9% |
23.3% |
22.8% |
|
Co-op |
12.4% |
1.4% |
0.8% |
1.7% |
8.5% |
33.1% |
5.9% |
34.7% |
8.7% |
46.8% |
80.1% |
8.7% |
19.2% |
|
KCB Group |
3.6% |
12.2% |
4.4% |
15.0% |
8.2% |
22.6% |
33.4% |
39.0% |
27.7% |
41.0% |
78.0% |
17.4% |
20.4% |
|
SCBK |
1.7% |
(5.9%) |
(22.4%) |
0.4% |
7.4% |
0.3% |
32.2% |
(4.7%) |
1.8% |
0.9% |
56.3% |
8.5% |
17.5% |
|
Stanbic |
1.6% |
8.1% |
7.1% |
10.7% |
5.2% |
14.0% |
46.1% |
11.7% |
2.4% |
(12.7%) |
85.1% |
9.3% |
13.6% |
|
DTBK |
1.6% |
(6.9%) |
(7.3%) |
(6.5%) |
5.6% |
6.2% |
23.6% |
3.1% |
(0.9%) |
12.9% |
71.1% |
3.1% |
12.9% |
|
FY'19 Mkt Weighted Average* |
7.5% |
6.7% |
6.0% |
7.5% |
7.8% |
18.5% |
31.7% |
21.3% |
13.5% |
20.0% |
74.9% |
15.2% |
19.6% |
|
FY'18 Mkt Weighted Average** |
13.8% |
6.5% |
10.6% |
2.6% |
7.9% |
3.8% |
33.2% |
(1.0%) |
10.3% |
9.1% |
75.5% |
4.3% |
19.0% |
|
*Market cap weighted as at 20/03/2020 |
|||||||||||||
|
**Market cap weighted as at 31/12/2018 |
|||||||||||||
The key take-outs from the table above include:
- Six banks have released their FY’2019 financial results, recording a 7.5% average increase in core Earnings Per Share (EPS), compared to a growth of 13.8% in FY’2018 for the entire banking sector,
- The banks that have released results have recorded a deposit growth of 13.5%, faster than the 10.3% growth recorded in FY’2018. Despite the relatively fast deposit growth, interest expenses growth of 6.0% was slower than the 10.6% growth recorded in FY’2018, indicating that banks have been able to mobilize relatively cheaper deposits after the September 2018 implementation of the Finance Act 2018, which saw the removal of the minimum interest rate payable on deposits, which stood at 70.0% of the Central Bank Rate (CBR). This helped mitigate high increments in interest expense, despite the relatively fast deposit growth,
- Average loan growth came in at 15.2%, which was faster than the 4.3% recorded in FY’2018, indicating that there was an improvement in credit extension, with banks targeting select segments such as corporate entities and Small and Medium Enterprises (SMEs), the growth in loans was accelerated towards the tail end of FY’2019 following the repeal of interest rate cap in November 2019. Government securities, on the other hand, recorded a growth of 20.0% y/y, which was faster compared to the loans and the 9.1% growth recorded in FY’2018. This highlights banks’ continued preference towards investing in government securities, which offer better risk-adjusted returns. Interest income increased by 6.7%, compared to a growth of 6.5% recorded in FY’2018. The faster growth in interest income may be attributable to the 15.2% growth in loans and increased allocation to government securities. Consequently, the Net Interest Margin (NIM) now stands at 7.8%, compared to the 7.9% recorded in FY’2018 for the whole banking sector, and,
- Non-Funded Income grew by 18.5% y/y, faster than 3.8% recorded in FY’2018. The growth in NFI was supported by the 21.3% average increase in total fee and commission income, which was faster than the (1.0%) growth recorded in FY’2018.
Universe of Coverage
|
Banks |
Price at 13/03/2020 |
Price at 20/03/2021 |
w/w change |
YTD Change |
Year Open |
Target Price* |
Dividend Yield |
Upside/ Downside** |
P/TBv Multiple |
Recommendation |
|
Kenya Reinsurance |
2.5 |
2.3 |
(8.3%) |
(23.4%) |
3.0 |
4.8 |
19.4% |
109.1% |
0.3x |
Buy |
|
Diamond Trust Bank |
93.8 |
90.0 |
(4.0%) |
(17.4%) |
109.0 |
189.0 |
3.0% |
104.6% |
0.4x |
Buy |
|
I&M Holdings*** |
46.3 |
46.2 |
(0.2%) |
(14.4%) |
54.0 |
75.2 |
8.4% |
70.9% |
0.8x |
Buy |
|
KCB Group*** |
42.7 |
40.6 |
(4.9%) |
(24.9%) |
54.0 |
64.2 |
8.6% |
59.2% |
1.1x |
Buy |
|
Sanlam |
14.0 |
15.0 |
7.5% |
(12.8%) |
17.2 |
21.7 |
0.0% |
55.6% |
0.6x |
Buy |
|
Jubilee Holdings |
302.5 |
296.0 |
(2.1%) |
(15.7%) |
351.0 |
453.4 |
3.0% |
52.9% |
1.0x |
Buy |
|
Co-op Bank*** |
13.3 |
12.8 |
(3.8%) |
(22.0%) |
16.4 |
18.1 |
7.8% |
44.4% |
1.1x |
Buy |
|
Equity Group*** |
41.9 |
39.0 |
(7.0%) |
(27.2%) |
53.5 |
56.7 |
6.4% |
41.7% |
1.5x |
Buy |
|
Liberty Holdings |
7.6 |
8.2 |
7.3% |
(20.8%) |
10.4 |
10.1 |
6.1% |
37.8% |
0.7x |
Buy |
|
NCBA |
30.0 |
28.3 |
(5.7%) |
(23.3%) |
36.9 |
37.0 |
5.3% |
28.8% |
0.6x |
Buy |
|
ABSA Bank*** |
11.6 |
11.0 |
(5.2%) |
(17.6%) |
13.4 |
13.0 |
10.0% |
22.1% |
1.4x |
Buy |
|
Standard Chartered |
190.0 |
193.3 |
1.7% |
(4.6%) |
202.5 |
211.6 |
10.3% |
21.7% |
1.5x |
Buy |
|
Stanbic Holdings |
95.5 |
99.0 |
3.7% |
(9.4%) |
109.3 |
103.1 |
7.1% |
15.1% |
1.0x |
Accumulate |
|
CIC Group |
2.3 |
2.3 |
(1.3%) |
(14.2%) |
2.7 |
2.6 |
0.0% |
13.2% |
0.8x |
Accumulate |
|
HF Group |
4.1 |
4.2 |
1.5% |
(35.3%) |
6.5 |
4.2 |
0.0% |
1.9% |
0.2x |
Lighten |
|
Britam |
6.8 |
6.8 |
(0.6%) |
(24.9%) |
9.0 |
6.8 |
0.0% |
(0.7%) |
0.7x |
Sell |
|
*Target Price as per Cytonn Analyst estimates **Upside/ (Downside) is adjusted for Dividend Yield ***Banks in which Cytonn and/or its affiliates are invested in |
||||||||||
We are “Positive” on equities for investors as the sustained price declines have seen the market P/E decline to below its historical average. We expect increased market activity, and possibly increased inflows from foreign investors, as they take advantage of the attractive valuations, to support the positive performance.
- Industry Reports
During the week, Kenya National Bureau of Statistics (KNBS) released the Leading Economic Indicators, January 2020, a report that tracks changes in Kenya’s macroeconomic indicators such as Consumer Price Indices (CPI), inflation, interest and exchange rates. Key take-outs from the report were as follows:
- Cement consumption came in at 5.8 mn tons for the period between January and December 2019, a decline of 1.3% from 5.9 mn tons in the same period in 2018. In our view, the reduction in consumption of cement is mainly attributable to (i) a decline in construction activity in the wake of the tough economic climate that was largely characterized by a slowdown in private sector credit growth, and (ii) decreased public sector consumption of the same owing to the completion of major infrastructural projects such as the Phase I and 2A of the Standard Gauge Railway.
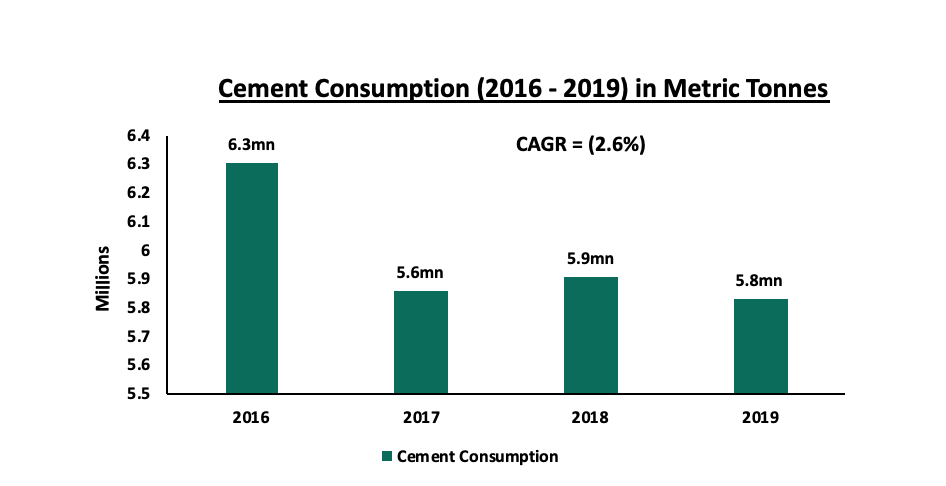
Source: Kenya National Bureau of Statistics (KNBS)
- The value of approved residential buildings in 2019 dropped by 4.6% to Kshs 131.8 bn, as compared to Kshs 138.2 bn that was recorded in 2018. Non-residential buildings approvals also recorded a 1.3% drop in the same duration, recording Kshs 77.4 bn in 2019 as compared to Kshs 78.5 bn recorded in 2018. The drop in approvals is attributed to delays in approvals by the Nairobi County Government from June 2019, which was a major setback for private developers leading to unnecessarily high development costs. We expect the aggregate value for building approvals to improve as measures such as the introduction of e-permits have been taken up by county governments like Nairobi to address the challenge.
- Retail Sector
During the week, Naivas Supermarket, a local retailer, opened its 63rd store in Mountain View Mall, along Waiyaki Way. This is the second branch that Naivas has opened in 2020, following the opening at the Kamakis store on the Eastern Bypass on January 2020. The retailer seeks to grow its footprint across the country in the fight for market share in an increasingly competitive market after it recently sold 30% of its stake to the French private equity firm, Amethis Finance. The retailer’s countrywide expansion is enabled by; (i) positive demographics as Kenya’s urban population continues to expand at an annual rate of 4.3% as per the World Bank, increasing the need for formal retail, (ii) rising consumerism which is creating a niche for both local and international retailers alike, (iii) continued investment in infrastructure which has encouraged growth in mall space, encouraging tenancy as well, and (iv) changes in tastes and preferences by the growing middle class thus fueling the growth of retail chains.
The increased interest by retailers into Westlands is supported by (i) positive demographics with the area supporting the upper-middle-income and high-end population who enjoy an increased purchasing power, (ii) adequate supply of mall spaces to suit demand, with the completion of malls such as Mountain View mall and the expansion of Sarit Centre and Westgate shopping malls, and (iii) adequate infrastructure, with the expansion of Waiyaki Way which will boost the area's growth.
Westlands remains an attractive location for retail investors recording attractive rental yields of 9.2% in 2019, 1.2% points higher than the market average of 8.0% according to the Cytonn Kenya Retail Report 2019.
The performance of the key retail nodes is as shown below:
(All values in Kshs unless stated otherwise)
|
Nairobi Metropolitan Area Retail Sector Performance 2019 |
|||
|
Location |
Rent Per SQFT |
Occupancy Rate |
Rental Yield |
|
Kilimani |
170.4 |
87.2% |
9.9% |
|
Ngong Road |
179.4 |
83.1% |
9.2% |
|
Westlands |
203.6 |
84.6% |
9.2% |
|
Karen |
207.9 |
77.0% |
9.1% |
|
Eastlands |
145.0 |
74.5% |
7.5% |
|
Thika road |
165.4 |
73.5% |
7.5% |
|
Kiambu Road |
166.0 |
61.7% |
6.8% |
|
Mombasa Road |
148.1 |
64.0% |
6.3% |
|
Satellite Towns |
131.4 |
70.3% |
6.0% |
|
Average |
168.6 |
75.1% |
8.0% |
Source: Cytonn Research 2019
Optica, a local eye-wear retailer, opened its 40th Kenyan outlet at Two Rivers Mall along Limuru Road. The 1,000 SQFT space is part of the retailer’s expansion strategy to widen its customer base. The entry of the retailer means higher occupancy for the 65,000-SQM, mall and is supported by (i) the strategic positioning within affluent neighbourhoods such as Gigiri and Ridgeways hosting middle to high-income earners with relatively high purchasing power, (ii) adequate infrastructure as the area is mainly served by Limuru Road, Kiambu road and the Northern by-pass, and (iii) provision of high-quality mixed-use spaces attracting relatively high footfall
Hospitality Sector
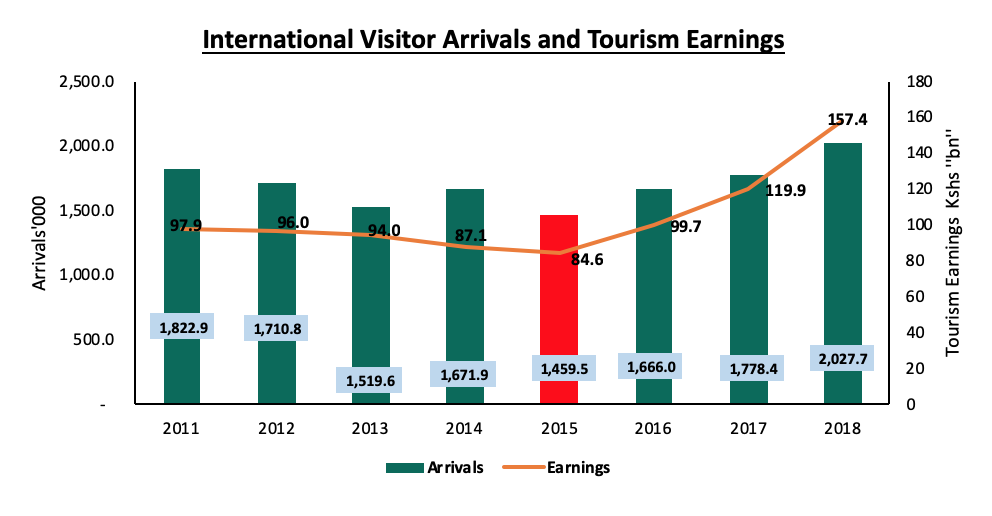
In the wake of the Coronavirus pandemic, the President of Kenya, H.E Hon. Uhuru Kenyatta, during the week, temporarily revoked the ban restricting government corporations from holding conferences in privately-owned hotels. The lift is intended to cushion the hospitality sector’s earnings, as hotels occupancy rates continue to plummet owing to the sudden shortage of tourist arrivals. The government has in response to the pandemic introduced a raft of measures to contain the pandemic’s rapid spread in the country including banning meetings, conferences and events of international nature as well as imposing travel restrictions on travellers from the worst affected countries, most of which are in Europe and Asia. This is set to dampen the sector’s 2020 performance as the majority of hotel-bed occupancies come from European and Asian visitors, accounting for 56.8% and 13.9%, respectively, as shown below:
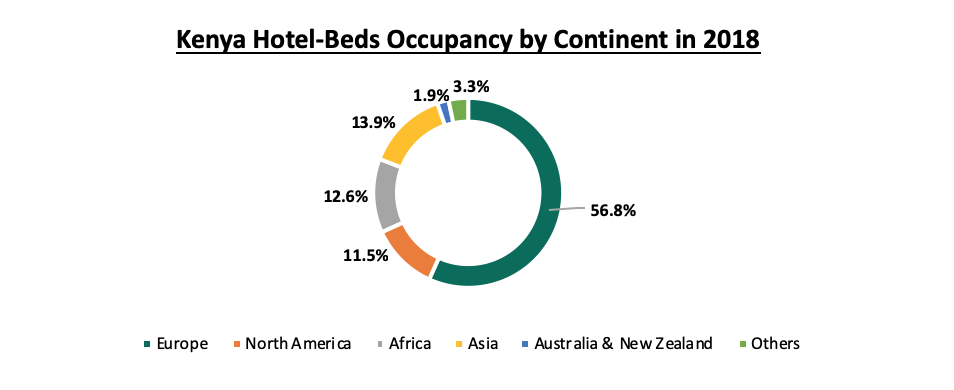
Source: KNBS
Historically, the sector’s worst challenge has been security concerns associated with terrorist attacks. The year 2015 was one of the worst years in terms of performance records following the year’s terrorist attacks on Moi University Garissa and Westgate Mall. The year recorded a drop in tourist earnings and arrivals drop by 2.9% and 12.7%, respectively, the lowest since 2011.
Source: KNBS
However, we expect that the sector will pick up in Q3 and Q4’2020, which tend to record the highest numbers of visitors assuming the pandemic is contained by the end of H1’2020.
- Industrial Sector
During the week, Twiga Foods, a local agribusiness company backed by top American investment bank Goldman Sachs, signed up for space in Africa Logistics Properties (ALP) industrial park in Tatu City. ALP, a specialist integrated property investment and development company, owns ALP North warehouse, which is set on 50,000 SQM of space in Tatu City Industrial Park located in Ruiru. Other firms that have signed for leasing space with the ALP industrial park include 2,000 SQM for Mapei East Africa. Since its inception, Tatu City Industrial Park has continued to attract notable companies such as Unilever, Chandaria and Dormans, an indicator for the high demand for top-grade warehousing space in the region. ALP is putting up a second facility, ALP west warehouse, on 49 acres in Tilisi located in Rironi, Limuru.
We continue to see a rise in demand for modern warehouses which provide affordable and high-quality storage for goods with features such as (i) high floor load-bearing capacity, (ii) lower operating costs due to environmental features such as solar-powered electricity, and (iii) 12 m operating heights which make it possible to stack more goods. The demand stems from the prevalence of outdated warehouses in the majority of the industrial nodes in Kenya and as such, we continue to see industrial investors shifting focus to areas like Ruiru due to (i) relatively good infrastructural network such as the Eastern Bypass that connects directly to Mombasa Road, and (ii) availability of affordable development land
We expect to see an increase in uptake and occupancy of warehouse space fuelled by (i) expansion of local and international retailers seeking storage space for goods, (ii) government focus on the Big 4 Agenda on manufacturing which is expected to influence demand for warehouses used to manufacture products, and (iii) improvement of infrastructure, for instance, the construction of SGR phase two which will increase the output of Special Economic Zones.
We retain a neutral outlook for the real estate sector with the coronavirus pandemic expected to continue affecting the real estate in Kenya especially the hospitality sector as a result of travel restrictions. However, we expect the sector to continue recording activities fueled by increased uptake of retail space in malls by local and international players, continued investment in infrastructure and the focus on the provision of affordable housing.
Introduction
The novel Coronavirus, better known as COVID-19 in the medical community, is a group of viruses that causes respiratory tract illnesses. COVID-19 was first reported on 31st December 2019 in the city of Wuhan, China and currently, the disease has spread to over 104 countries with major economies such as Italy, Japan, South Korea, France, Spain, Australia, and the US reporting thousands of cases of the virus within their borders, and deaths related to the virus. The first case of Coronavirus infection within Kenya’s borders was reported on the 13th of March 2019, and so far, Kenya has reported seven confirmed cases. The impact felt in the local financial market mirrors what has equally been witnessed in the global setting. The uncertainty brought about by the disease, more so with World Health Organization (WHO) declaring it a pandemic, has seen investors selling-off risky assets such as equities in favor of safe havens such as gold and US Treasuries.
Last week, we discussed the Impact of Coronavirus to the Kenyan Economy, covering how the pandemic started, the current state of affairs, noting that despite the virus spreading, emotional contagion also played a significant role in amplifying the effects of the pandemic on the global economy. We analyzed the effects the pandemic has had on the global economy weighing in on how the virus has negatively impacted international trade, the financial & commodity markets, and the global macroeconomic environment. Closer home, we focused on the effects experienced so far in the Kenyan economy where we had already witnessed, with the major ones being:
- Equities Sell Offs – We have witnessed massive sell-offs in the equities market as investors divest away from risky assets, which saw the Nairobi All Share Index (NASI) drop by 0.5% between 13th March 2020 and 20th March 2020 and 20.1% on a year-to-date basis, and the resultant heightened demand for fixed income instruments as investors sought safe havens,
- Currency Volatility - The Kenyan Shilling has experienced a lot of volatility, due to persistent concerns about the impact of the Coronavirus and heightened worries about the potential drop of hard currency inflows. This has seen the Kenyan Shilling depreciating by 3.7% against the US Dollar YTD, to close at a 4.5-year low of Kshs 105.1 this week, and,
- Disrupted Supply Chains- The spread of the virus has also disrupted the global supply chain and Kenya has not been spared either. Imports from China account for approximately 21.0% of Kenya’s total imports and with the current lockdown, activities within the manufacturing sector are likely to be disrupted.
Following last week’s Focus Note, several of our readers requested us to focus on the effect on Money Market Funds. Consequently, this week, we revisit the topic, with our focus being on the possible effects the Coronavirus might have on Money Market Funds. Under this, we shall be discussing the following;
- Current Situation of the Kenyan Macroeconomic Environment,
- Current Situation of the Fixed Income Market in Kenya:
- Interest Rates,
- Bond Yields, and
- Bank Deposits.
- Constituents of Money Market Funds & Impact of Coronavirus on Each Asset Class, and
- Conclusion – Overall Impact on Money Market Funds.
Section I: Current Situation of the Kenyan Macroeconomic Environment
In the Cytonn 2020 Markets Outlook, we projected Kenya’s 2020 GDP growth to come within the range of 5.6% - 5.8%, supported by expected improvements in private sector growth, coupled with anticipation for stable growth of the agricultural sector and public infrastructural investments to be driven by budgetary allocations in infrastructural projects. However, since the outbreak of the virus coupled with the invasion of locust in the country, key sectors such as the Agricultural sector have already taken a bad hit, and has resulted in severe implications for macroeconomic indicators in the country as highlighted below:
|
Indicators |
Impact |
Effect |
|
GDP Growth |
· The key sectors of the economy affected by the Coronavirus pandemic include the Tourism, Agricultural, and Manufacturing sectors which were hit the hardest hit due to shutdowns in major markets and the disruption of the global supply chain. Combined, the 3 sectors account for 43.8% of Kenya’s GDP in 2018. · Based on the impacts witnessed so far, we believe that Coronavirus may have a 10.0% to 25.0% impact on GDP growth for the year 2020. The 10.0% impact is an optimistic case in the event the outbreak is contained, and a 25.0% impact in the event it is not contained. As such, the coronavirus could reduce Kenya’s GDP growth to a range of 4.3% to 5.2% for the year 2020 depending on the severity of the outbreak and economic implications for Kenya. |
Negative |
|
Inflation |
· There are expectations of inflationary pressure emanating from the effects of the world Pandemic-Coronavirus, driven by supply-side shortages owing to lockdowns across the globe which have disrupted supply chains, further heightening cost-push inflation. |
Neutral |
|
Currency |
· The Kenyan Shilling has experienced a lot of volatility, due to persistent concerns about the impact of the coronavirus and heightened worries about the potential drop of hard currency inflows. This saw the Shilling depreciating by 4.2% against the US Dollar during the week to close at Kshs 105.1, from Kshs 102.4 recorded last week, making it a 4.5-years low, prompting Central Bank of Kenya to sell dollars to limit the losses. · Going forward, the global uncertainty surrounding the outbreak of the virus is likely to continue exerting pressure on the shilling due to the supply chain disruptions, and subdued diaspora remittances growth. |
Negative |
|
Fiscal Position |
· As per the Budget Policy Statement, the fiscal deficit for FY2019/20 was estimated at 6.3% of GDP and although the government continues to pursue the fiscal consolidation policy, risks abound from possible reallocation of funds in a bid to contain the spread of the Coronavirus. This is expected to further widen the fiscal deficit away from the projected decline to 4.9% of GDP in FY 2020/21. · On this front, the Central Bank of Kenya (CBK), this week under Sections 9 and 51 of the CBK Act and following approval by the Board, announced that it had transferred Kshs 7.4 bn from its General Reserve Fund to the Government Consolidated Fund in support of the fight against Coronavirus. |
Negative |
|
Private Sector Credit Growth |
· This week, Kenya Bankers Association (KBA) announced that commercial banks will provide relief with the loan repayment tenor extended by a period up to 12-months for all personal loans that were current on 2nd March 2020 and a possible loan restructuring for SMEs and corporate borrowers, a further indication of the defaults expectations. · The effects of the coronavirus pandemic are expected to negatively affect the financial sector. We expect to see increased caution on lending especially to businesses that rely on imports hence inhibiting private credit sector growth due to the high risk of credit default, with the possibility of heightened Non Performing Loans if the pandemic is to continue. |
Negative |
Section II: Current Situation of the Fixed Income Market in Kenya
Fixed Income markets are markets where securities such as certificates of deposits, corporate & government bonds and other money market instruments. In light of the Coronavirus pandemic, we weigh in on the current situation of the Fixed Income Market in Kenya;
- Interest Rates - Around the globe, we have seen several central banks ease monetary policies to support the economy amid the negative macroeconomic effects emanating from the Coronavirus pandemic. The table below shows how Central Banks of major global economies have moved to cut interest so far;
|
No. |
Country |
Central Bank |
Reduction Margin |
Current Rate |
|
1 |
USA |
Federal Reserve |
1.00% Point |
0%-0.25% |
|
2 |
Australia |
Reserve Bank of Australia |
0.25% Points |
0.50% |
|
3 |
China |
People's Bank of China |
0.10% Points |
4.10% |
|
4 |
Malaysia |
Central Bank of Malaysia |
0.25% Points |
2.75% |
|
5 |
England |
Bank of England |
0.50% Points |
0.25% |
Locally, the Monetary Policy Committee (MPC) is set to meet on 23rd March 2020 to review the outcome of its previous policy decisions and recent economic developments. Similar to the actions of other Central Banks, we expect the MPC to maintain the status quo and reduce the Central Bank Rate (CBR) by up to 100 basis points to 7.25% from 8.25% in a bid to boost the economy amid the uncertainty and supply chain shortages caused by the Coronavirus.
However, we do not expect this to pass on to bank rates. The enactment of the Banking (Amendment) Act 2015 in September 2016, introducing interest rate controls, reduced the effectiveness of the monetary policy and made it difficult for the CBK to adjust the monetary policy rates in response to economic developments. Following the repeal of Section 33B of the Banking Act, the implementation of expansionary monetary policy continues to be difficult because with the tough and uncertain economic environment, banks find it even more difficult to price for risk at lower interest rates. In such an event, banks will also not increase their deposit rates.
On this premise, we believe that a big part of the solution to broken supply chains, and the sharp fall in demand in industries acutely affected by the virus, is fiscal, and as such monetary policy might not be effective in injecting the requisite liquidity to the economy, owing to the fact that Banks are expected to take a cautious stance in lending due to the heightened likelihood of defaults and as such we do not foresee a decline in lending interest rates, and also do not expect an increase in deposit rates at banks. Consequently, we believe this is the main reason that has driven the Kenyan Government to take a rather unconventional type of quantitative easing by transferring Kshs 7.4 bn obtained from the demonetization exercise of the older series Kshs 1,000 notes from its General Reserve Fund to the Government Consolidated Fund in a bid to inject new money into the money supply,
- Bond Yields - Over the last two weeks, the bond market recorded reduced activity with bonds worth Kshs 30.1 bn transacted, 13.8% lower compared to Kshs 34.9 bn registered in the last two weeks before the first case of Coronavirus was recorded in the country. We attribute dampened activity to large players such as commercial banks preferring to hold excess liquidity in the current uncertain environment. This week, only the 1-year, 5-Year and 11-Year yields recorded price gains as their yields decline with the other bonds recording price losses as yields rose across the board. We expect the yields on government securities to remain stable despite the expected cut on the CBR, with a bias to an upward readjustment in the yield curve. We believe that in the absence of credit risk, the main feature associated with Government-issued securities, the value of the cash flows accrued to such investors becomes a function of their required return based on inflation expectations, which presents a risk of effectively eroding the purchasing power of such securities future cash flows. With the expectations of heightened inflationary pressures, we believe that investors will continue demanding higher yields to compensate for the inflation risk, which will possibly lead to higher yields, and,
- Bank Deposits – Despite the corona pandemic, liquidity in the money market has remained relatively favorable with the interbank rate averaging 4.2%, below the 4.3% average for the entire year so far. We believe favorable liquidity conditions will persist in the money markets, following the drive by the Government as well as the industry players to discourage cash transactions in the economy in favor of mobile money transactions, card payments, and internet banking to reduce the risk of transmission of Covid-19 via hard currency. This directive has also seen financial industry players waive costs associated with the transfer of money between their mobile wallets and bank accounts. However, given the prevailing environment and movement of funds away from the equities market, towards investor perceived safe havens such as bank deposits, government instruments and gold, we do not expect any changes in deposit rates, given that supply of funds towards the banking sector will not be affected.
Section III: Constituents of Money Market Funds & Impact of Coronavirus on Each Asset Class
Money Market Funds are conservative funds designed to serve the needs of investors whose primary goal is capital preservation, and who are willing to accept a modest return on their investment portfolio in return for more safety and liquidity. Therefore, to achieve this objective, Money Market Funds primarily invest in securities with short maturities and pose minimal investment risks such as fixed deposits, Government-issued securities, and commercial paper. As at 31st December 2019, the Money Market industry’s exposure to Cash and Fixed Deposit and Securities Issued by the Government of Kenya stood at 31.2% and 55.7%, respectively, bringing the combined exposure to 86.8%. The table below highlights the Capital Markets Authority’s provisions for the above-mentioned asset classes, their investment limits, actual exposure as at 31st December 2019 and our expectations on the effects potent to them from the current ongoing pandemic:
|
Money Market Funds Investment Instruments |
|
|||
|
Asset Class |
Impact |
Effect |
*Investment Limits |
**Actual Exposure |
|
Cash, Demand Deposits and Fixed Deposits |
· Owing to the continued favorable conditions in the money markets and the continued drive by the Banking industry players as well as the Government to push for cashless transactions which have seen Banks waive costs associated with the transfer of money between their mobile wallets and bank accounts, we believe Banks will not be facing liquidity crunches. However, given the prevailing environment and movement of funds away from the equities market, towards investor perceived safe havens such as bank deposits, government instruments and gold, we do not expect any changes in deposit rates, given that supply of funds towards the banking sector will not be affected. · With reduced monetary policy effectiveness, we do not foresee any cut in the Central Bank Rate (CBR) affecting bank deposit and lending rates. |
Neutral |
100.0% |
31.2% |
|
Securities Issued by the GoK (Government T-Bills and Bonds) |
· We expect the yields on government securities to remain stable despite the expected cut on the CBR, with a bias to an upward readjustment in the yield curve. We believe that in the absence of credit risk, the main feature associated with Government-issued securities, the value of the cash flows accrued to such investors becomes a function of their required return based on inflation expectations which presents a risk of effectively eroding the purchasing power of such securities future cash flows. With the expectations of heightened inflationary pressures, we believe that investors will continue demanding higher yields to compensate for the inflation risk |
Positive |
80.0% |
55.7% |
|
Securities Listed on NSE Excluding GoK & Any Other Unlisted Securities & Other Collective Investment Schemes |
· Investments away from the bank deposits and government securities ie. securities listed in the NSE excluding GoK, any other unlisted securities and other collective investment schemes exposes money market funds to higher returns while providing diversification. During this period of uncertainties, investment managers and investors may look for a slight premium on such investments; however we foresee little to no additional allocation away from bank deposits and government securities. |
Neutral |
25.0% for Each |
13.1% |
|
*Investment Limits are the maximum allowable limits for Money Market Funds as per the Capital Markets Regulations. ** Source: CMA, Q4’2019 Collective Investment Schemes Report |
||||
Based on the above-mentioned factors, we expect the yields on Money Market Funds to remain stable, with a likelihood of going higher. The table below highlights the yields of Money Market Funds in the market as published on 21st March 2020;
|
Fund Managers' Money Market Fund Yields as Published on 21/03/2020 |
|||
|
Rank |
Fund Manager |
Daily Yield |
Effective Annual Rate |
|
1 |
Cytonn Money Market Fund |
10.41% |
10.96% |
|
2 |
Zimele Money Market Fund |
9.56% |
9.91% |
|
3 |
Nabo Africa Money Market Fund |
9.46% |
9.89% |
|
4 |
Alphafrica Kaisha Money Market Fund |
9.19% |
9.81% |
|
5 |
CIC Money Market Fund |
9.40% |
9.75% |
|
6 |
Sanlam Money Market Fund |
9.23% |
9.67% |
|
7 |
Madison Money Market Fund |
9.11% |
9.54% |
|
8 |
Dry Associates Money Market Fund |
8.66% |
9.02% |
|
9 |
Co-op Money Market Fund |
8.51% |
8.85% |
|
10 |
Apollo Money Market Fund |
9.31% |
8.72% |
|
11 |
GenCapHela Imara Money Market Fund |
8.20% |
8.52% |
|
12 |
NCBA Money Market Fund |
8.18% |
8.49% |
|
13 |
British-American Money Market Fund |
8.02% |
8.32% |
|
14 |
Amana Money Market Fund |
8.00% |
8.20% |
|
15 |
ICEA Lion Money Market Fund |
7.87% |
8.19% |
|
16 |
AA Kenya Shillings Fund |
7.21% |
7.45% |
|
17 |
STANLIB Money Market Fund |
6.15% |
6.32% |
|
18 |
Old Mutual Money Market Fund |
4.91% |
4.80% |
|
|
Average |
8.41% |
8.69% |
Source: Daily Newspaper Publishing for Money Market Fund Yields
Money Market industry’s exposure to Securities Issued by the Government of Kenya continues to be the highest coming in at 55.6%, as at the end of 2019. The expectations of stability in yields on government securities will provide an adequate buffer on the Money Market Funds effective annual yields. In the event that interest rates from Cash, Demand Deposits and Fixed Deposits decline, we expect to see a readjustment in the Money Market Funds Portfolios to skew towards increased exposure in Government securities to abate any reinvestment risks (the possibility that an investor will be unable to reinvest cash flows at a rate comparable to their current rate of return).
Conclusion
In conclusion, we believe that for Money Market Funds;
- Returns for Money Market Funds will remain stable with a bias to a slight increase upwards should rates on government securities increase, and,
- They will remain the most liquid of all mutual funds providing a short-term parking bay that earns higher income yields compared to deposits and savings accounts.
Further, with increased digitization and automation, liquidity is enhanced and an investor should receive their funds within 3 to 5 working days if they are withdrawing to their bank accounts, and immediate access to funds when withdrawing via M-Pesa. Also, as investors are fleeing to the Fixed Income market in light of current economic conditions, we believe that due to economies of scale, small investors are unable to do so. Money Market Funds allow such investors to re-align their investments with their risk appetites by pooling money together and invest in safe havens. Also noting that historically markets have shown an ability to bounce back from events that sparked volatility, we are of the view that the coronavirus pandemic will be no exception. Thus, it is important that investors remain calm even in the face of uncertainty.
Disclaimer: The views expressed in this publication are those of the writers where particulars are not warranted. This publication is meant for general information only and is not a warranty, representation, advice or solicitation of any nature. Readers are advised in all circumstances to seek the advice of a registered investment advisor.

- Talk to us
- Kenya
- P.O Box 20695 - 00200, Nairobi, Kenya
- Cell +254709101200
- Tel +254709101200
- WhatsApp +254741676635
- United States
- +254709101200
- DOWNLOAD OUR APP
-


- Kenya
- 8th Floor, Pinetree Plaza, Kaburu Drive, Ngong Road, Nairobi, Kenya
- USA
- Suite 1150, 1775 Eye Street NW, USA, Washington DC 20006, USA
- Investments
- High Yield
- Private Equity
- Real Estate
- Real Estate
- RiverRun Estates
- Cytonn Towers
- The Ridge
- Taraji Heights
- The Alma