Progress of Retirement Benefits Schemes in Kenya - 2024, & Cytonn Weekly #21/2024
By Research Team, May 26, 2024
Executive Summary
Fixed Income
During the week, T-bills were oversubscribed for the fourth consecutive week, with the overall oversubscription rate coming in at 100.1%, albeit lower than the oversubscription rate of 194.8% recorded the previous week. Investors’ preference for the shorter 91-day paper persisted, with the paper receiving bids worth Kshs 7.1 bn against the offered Kshs 4.0 bn, translating to an oversubscription rate of 177.6%, significantly lower than the oversubscription rate of 325.4% recorded the previous week. The subscription rate for the 182-day and 364-day papers decreased to 116.5% and 52.8% from 180.4% and 156.8% respectively recorded the previous week. The government accepted a total of Kshs 23.7 bn worth of bids out of Kshs 24.0 bn bids received, translating to an acceptance rate of 98.7%. The yields on the government papers were on an upward trajectory, with the yields on the 91-day, 182-day, and 364-day papers increasing by 0.8 bps, 4.6 bps, and 9.4 bps to 15.95%, 16.56%, and 16.62% from 15.94%, 16.52% and 16.53% respectively recorded the previous week;
During the week, the Kenya National Bureau of Statistics (KNBS) released the 2024 Economic Survey, highlighting that the Kenyan economy recorded a 5.6% growth in FY’2023, faster than the 4.9% growth recorded in FY’2022. The main contributor to Kenyan GDP remains to be the Agriculture, Fishing and Forestry sector which grew by 6.5% in FY’2023 compared to a contraction of 1.5% in FY’2022. All sectors in FY’2023, except Mining and Quarrying, recorded positive growths, with varying magnitudes across activities. Most sectors recorded improved growth compared to FY’2022, with Agriculture, Forestry and Fishing, Accommodation and Food Services, and Real Estate Sectors recording the highest growth improvements of 7.9% points, 6.8% points, and 2.8% points, respectively;
Also, during the week, the Kenya National Bureau of Statistics released the FY’2023 Economic Survey Report highlighting that Kenya’s balance of payments position improved by 46.4% in FY’2023, coming in at a deficit of Kshs 134.8 bn, from a deficit of Kshs 251.5 bn in FY’2022, and a slight deterioration from the Kshs 131.5 bn deficit recorded in Q3’2023;
Additionally, we are projecting the y/y inflation rate for May 2024 to come in at the range of 4.7% - 5.1% mainly on the back of reduced fuel prices, the maintenance of the Central Bank Rate (CBR) at 13.00%, the strengthening of the Kenyan Shilling and the reduction in electricity costs;
Equities
During the week, the equities market was on an upward trajectory, with NSE 10 gaining the most by 4.0%, while NASI, NSE 25, and NSE 20 gained by 2.3%, 2.7%, and 0.7% respectively, taking the YTD performance to gains of 29.2%, 24.5%, 23.0%, and 13.8% for NSE 10, NSE 25, NASI and NSE 20 respectively. The equities market performance was driven by gains recorded by large-cap stocks such as KCB Group, NCBA, and Cooperative Bank of 10.4%, 7.2%, and 4.3% respectively. The performance was, however, weighed down by losses recorded by large-cap stocks such as Stanbic Bank of 12.8%;
During the week, four of the listed banks released their Q1’2024 results. KCB Group released its Q1’2024 financial results, with its Core Earnings per Share (EPS) increasing by 69.0% to Kshs 5.1, from Kshs 3.0 in Q1’2023. HF group released its Q1’2024 financial results, with its Core Earnings per Share (EPS) increasing by 80.4% to Kshs 0.4 bn, from Kshs 0.2 bn in Q1’2023. NCBA Group released its Q1’2024 financial results, with its Core Earnings per Share (EPS) increasing by 4.7% to Kshs 3.2, from Kshs 3.1 in Q1’2023. Lastly, I&M Group released its Q1’2024 financial results, with its Core Earnings per Share (EPS) increasing by 35.4% to Kshs 2.2, from Kshs 1.2 in Q1’2023;
Real Estate
During the week, the Kenya Bureau of Statistics released the 2024 Economic Survey, which highlighted the performance of various sectors of the economy. The report indicated a general improvement in the hospitality and tourism sectors, with notable gains in the number of international arrivals and monthly bed occupancy;
In the infrastructure sector, President Ruto signed an agreement with Everstrong Capital, a U.S. firm, for the construction of the 440-kilometer Nairobi-Mombasa Expressway. The project, estimated to cost Kshs 470.0 bn (USD 3.6 bn), will be a six-lane dual carriageway. The project received approval from the National Assembly last year to proceed under a public-private partnership model;
In the industrial sector, President Ruto's visit to the U.S. resulted in an agreement being signed between G42 and Microsoft to build a data center worth Kshs 131.0 bn (USD 1.0 bn) at the KenGen Green Park in Olkaria. The data center will run on 100% renewable geothermal power from the Olkaria Geothermal fields in Naivasha, Nakuru County;
In the REITs segment, Acorn Holdings secured Ksh 23.6 bn (USD 180 mn) in funding from the U.S. Development Finance Corporation (DFC) for affordable student housing. The funding will be channeled towards the development of 35 affordable student housing units, adding 48,000 student beds to Acorn Holdings’ portfolio;
Additionally, Laptrust released the FY’2023 financial results for the Imara I-REIT for the period ended 31st December 2023. Rental and related income for the REIT stood at Kshs 305.2 mn in FY’2023, an 82.6% increase from Kshs 167.1 mn in H1’2023, implying a gross rental yield of 4.5% in FY’2023 on interest-earning assets, higher than the 2.4% rental yield recorded during H1’2023. This increase in rental income was driven by upward review in rental prices for several properties within the portfolio;
On the Unquoted Securities Platform, Acorn D-REIT and I-REIT traded at Kshs 24.5 and Kshs 22.0 per unit, respectively, as of 17th May 2024. The performance represented a 22.5% and 10.0% gain for the D-REIT and I-REIT, respectively, from the Kshs 20.0 inception price;
Focus of the Week
According to the Retirement Benefits Authority (RBA) Industry report for December 2023, assets under management for retirement benefits schemes increased by 9.4% to Kshs 1.7 tn in December 2023 from the Kshs 1.6 tn recorded in 2022. The growth of the assets can be attributed to the enhanced contributions to the mandatory scheme, NSSF, which began in earnest in February 2023 following the court of appeal ruling that set aside the initial ruling of the Employment and Labour Relations Court which had suspended implementation of the NSSF Act. The Act, which increased the contribution rates from Kshs 400 to 12.0% of an employee’s monthly earnings, with a 6% deduction from the employee and an equivalent 6% deduction from the employer, had been rendered unconstitutional by the lower court. Despite the continued growth, Kenya remains characterized by a low saving culture with research by the Federal Reserve Bank showing that only 14.2% of the adult population in the labor force save, including for their retirement in Retirement Benefits Schemes (RBSs), lower than Nigeria’s 26.3%, but higher than South Africa’s 13.6%. According to the World Bank, our gross savings to GDP stands at just 16.0%, indicating that more still needs to be done to boost the savings numbers. On a semi-annual basis, however, the assets grew by a paltry 1.3% to Kshs 1.73 tn in December from the Kshs 1.70 tn recorded in June 2023. This subdued growth of assets under management during the period is majorly attributed to negative movement in some asset classes such as quoted equities, listed corporate bonds, unquoted equities, and commercial papers. Quoted equities, for instance, recorded a 3.0% decline in Q4’2023;
On a separate note, according to the ACTSERV Q1’2024 Retirement Benefits Schemes Investments Performance Survey, segregated retirement benefits schemes recorded a 6.0% return in Q1’2024, up from the 0.8% recorded in Q1’2023. The increase was largely supported by the performance of equities investments made by the schemes which recorded a significant 25.6% gain, a reversal from the 7.2% decline recorded in 2022, on the back of positive investor sentiment following the successful Eurobond buyback, easing inflation and the shilling appreciation which gradually slowed down investor flight from the market. This week, we shall focus on understanding Retirement Benefits Schemes and look into the historical and current state of retirement benefits schemes in Kenya with a key focus on 2023 and what can be done going forward;
Investment Updates:
- Weekly Rates:
- Cytonn Money Market Fund closed the week at a yield of 17.67% p.a. To invest, dial *809# or download the Cytonn App from Google Play store here or from the Appstore here;
- We continue to offer Wealth Management Training every Monday, from 10:00 am to 12:00 pm. The training aims to grow financial literacy among the general public. To register for any of our Wealth Management Trainings, click here;
- If interested in our Private Wealth Management Training for your employees or investment group, please get in touch with us through wmt@cytonn.com;
- Cytonn Insurance Agency acts as an intermediary for those looking to secure their assets and loved ones’ future through insurance namely; Motor, Medical, Life, Property, WIBA, Credit and Fire and Burglary insurance covers. For assistance, get in touch with us through insuranceagency@cytonn.com;
- Cytonn Asset Managers Limited (CAML) continues to offer pension products to meet the needs of both individual clients who want to save for their retirement during their working years and Institutional clients that want to contribute on behalf of their employees to help them build their retirement pot. To more about our pension schemes, kindly get in touch with us through pensions@cytonn.com;
Real Estate Updates:
- For more information on Cytonn’s real estate developments, email us at sales@cytonn.com;
- Phase 3 of The Alma is now ready for occupation and the show house is open daily. To join the waiting list to rent, please email properties@cytonn.com;
- For Third Party Real Estate Consultancy Services, email us at rdo@cytonn.com;
- For recent news about the group, see our news section here;
Hospitality Updates:
- We currently have promotions for Staycations. Visit cysuites.com/offers for details or email us at sales@cysuites.com;
Money Markets, T-Bills Primary Auction:
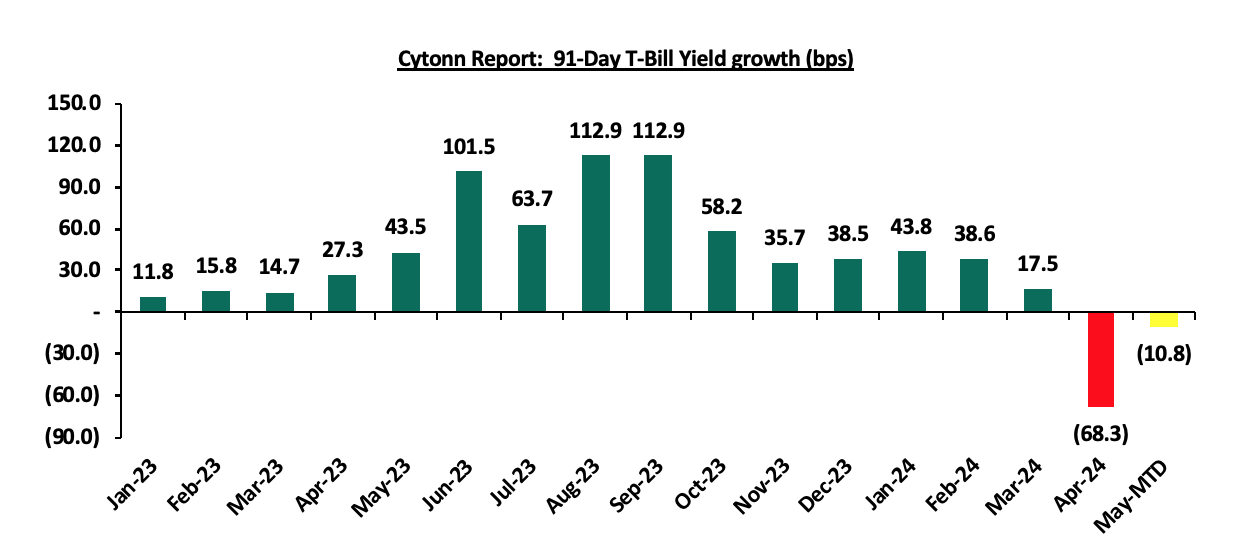
During the week, T-bills were oversubscribed for the fourth consecutive week, with the overall oversubscription rate coming in at 100.1%, albeit lower than the oversubscription rate of 194.8% recorded the previous week. Investors’ preference for the shorter 91-day paper persisted, with the paper receiving bids worth Kshs 7.1 bn against the offered Kshs 4.0 bn, translating to an oversubscription rate of 177.6%, significantly lower than the oversubscription rate of 325.4% recorded the previous week. The subscription rate for the 182-day and 364-day papers decreased to 116.5% and 52.8% from 180.4% and 156.8% respectively recorded the previous week. The government accepted a total of Kshs 23.7 bn worth of bids out of Kshs 24.0 bn bids received, translating to an acceptance rate of 98.7%. The yields on the government papers were on an upward trajectory, with the yields on the 91-day, 182-day, and 364-day papers increasing by 0.8 bps, 4.6 bps, and 9.4 bps to 15.95%, 16.56%, and 16.62% from 15.94%, 16.52% and 16.53% respectively recorded the previous week. The chart below shows the yield growth rate for the 91-day paper over the period:
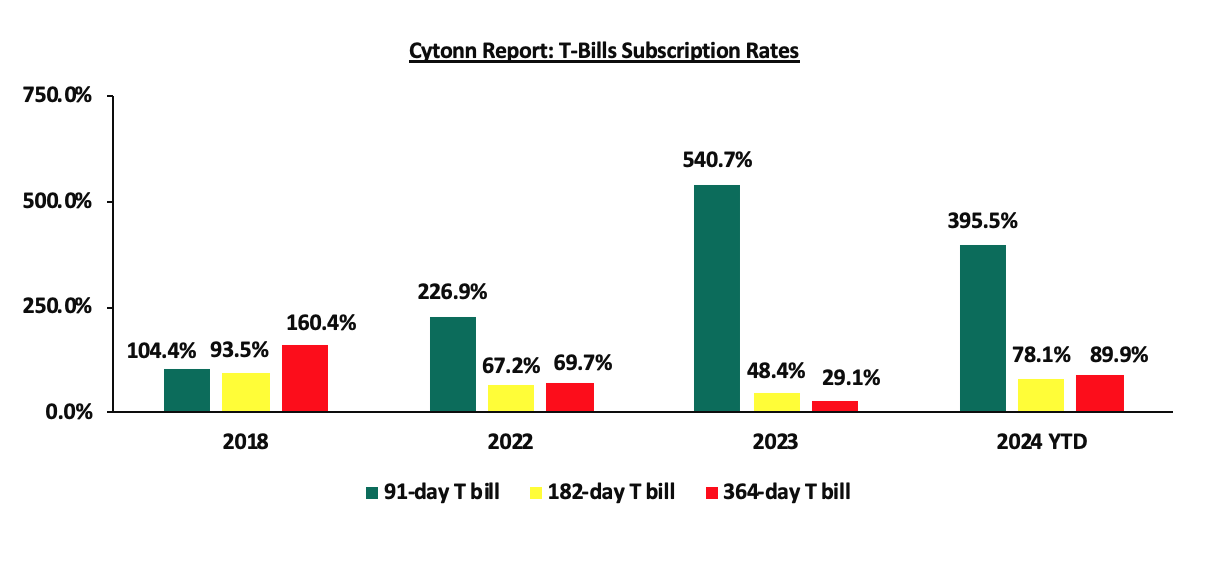
The chart below compares the overall average T-bill subscription rates obtained in 2018, 2022, 2023, and 2024 Year-to-date (YTD):
Money Market Performance:
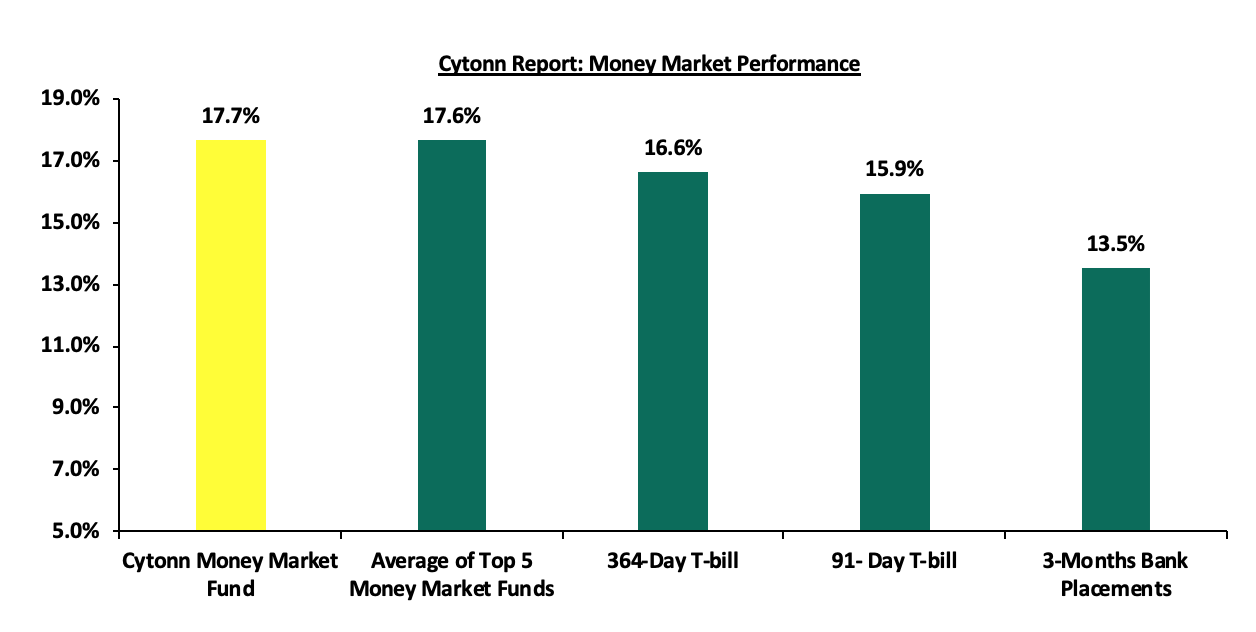
In the money markets, 3-month bank placements ended the week at 13.5% (based on what we have been offered by various banks), and the yields on the government papers were on an upward trajectory, with the yields on the government papers were on an upward trajectory, with the yields on the 91-day and 364-day papers increasing by 0.8 bps and 9.4 bps to 15.95% and 16.62% from 15.94% and 16.53% respectively recorded the previous week. The yields on the Cytonn Money Market Fund increased by 60.0 bps to 17.7% from 17.1% recorded the previous week, while the average yields on the Top 5 Money Market Funds increased by 28.8 bps to 17.6% from the 17.4% recorded the previous week.
The table below shows the Money Market Fund Yields for Kenyan Fund Managers as published on 24th May 2024:
|
Cytonn Report: Money Market Fund Yield for Fund Managers as published on 24th May 2024 |
||
|
Rank |
Fund Manager |
Effective Annual Rate |
|
1 |
Lofty-Corban Money Market Fund |
18.3% |
|
2 |
Etica Money Market Fund |
18.1% |
|
3 |
Cytonn Money Market Fund (Dial *809# or download the Cytonn App) |
17.7% |
|
4 |
Kuza Money Market fund |
17.5% |
|
5 |
Nabo Africa Money Market Fund |
16.6% |
|
6 |
GenAfrica Money Market Fund |
16.4% |
|
7 |
Jubilee Money Market Fund |
15.9% |
|
8 |
Enwealth Money Market Fund |
15.9% |
|
9 |
Apollo Money Market Fund |
15.8% |
|
10 |
Madison Money Market Fund |
15.7% |
|
11 |
Co-op Money Market Fund |
15.6% |
|
12 |
KCB Money Market Fund |
15.6% |
|
13 |
GenCap Hela Imara Money Market Fund |
15.6% |
|
14 |
Absa Shilling Money Market Fund |
15.4% |
|
15 |
Mali Money Market Fund |
15.3% |
|
16 |
Sanlam Money Market Fund |
15.3% |
|
17 |
AA Kenya Shillings Fund |
15.2% |
|
18 |
Mayfair Money Market Fund |
14.9% |
|
19 |
Dry Associates Money Market Fund |
14.0% |
|
20 |
Equity Money Market Fund |
13.9% |
|
21 |
Orient Kasha Money Market Fund |
13.9% |
|
22 |
Old Mutual Money Market Fund |
13.4% |
|
23 |
CIC Money Market Fund |
13.2% |
|
24 |
ICEA Lion Money Market Fund |
12.3% |
|
25 |
British-American Money Market Fund |
10.1% |
Source: Business Daily
Liquidity:
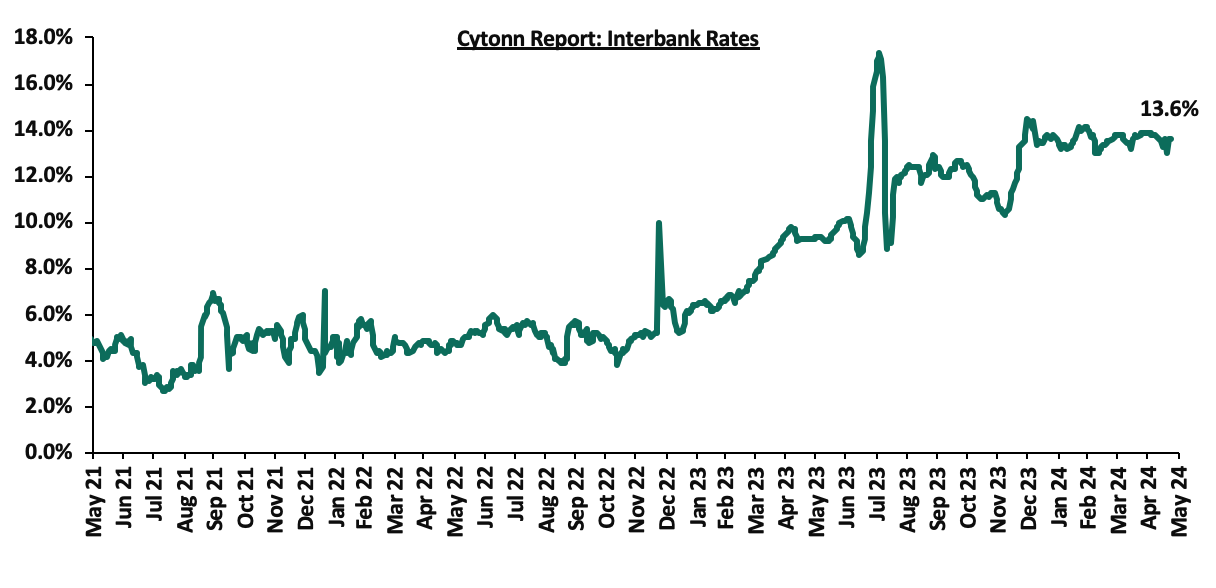
During the week, liquidity in the money markets eased, with the average interbank rate decreasing marginally by 0.8 bps, to remain relatively unchanged at 13.5% recorded the previous week, partly attributable to government payments that offset tax remittances. The average interbank volumes traded increased by 19.7% to Kshs 22.1 bn from Kshs 18.4 bn recorded the previous week. The chart below shows the interbank rates in the market over the years:
Private Sector Credit Growth:
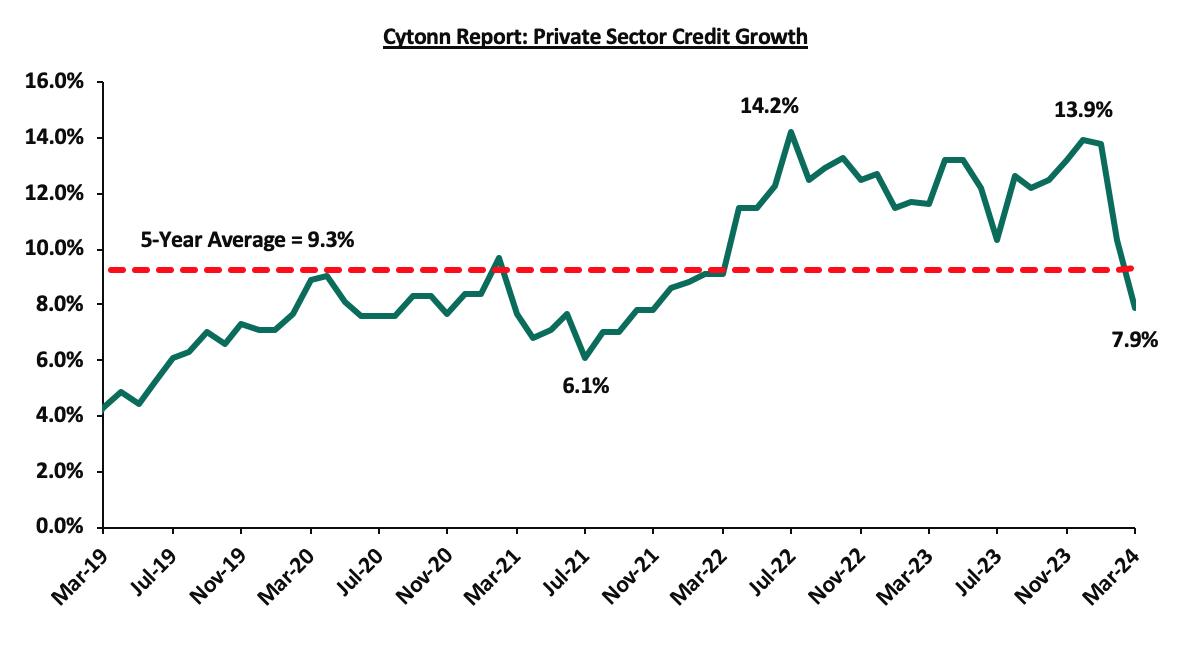
The Kenyan private sector credit growth declined to 7.9% in March from 10.3% recorded in February 2024. This is partly attributable to the impact of monetary policy tightening following the Monetary Policy Committee’s (MPC) to maintain the Central Bank Rate (CBR) at 13.0% in addition to the effect of exchange rate appreciation on foreign currency. Notably, the 7.9% growth rate recorded in March 2024 is the lowest recorded figure in 28 months and is 1.4% points below the 5-year average growth rate of 9.3%. The chart below shows the movement of the private sector credit growth:
Kenya Eurobonds:
During the week, the yields on Eurobonds were on an upward trajectory, with the yields on the 7-year Eurobond issued in 2019 increasing the most by 53.0 bps to 9.1% from 8.5% recorded the previous week. The table below shows the summary of the performance of the Kenyan Eurobonds as of 23rd May 2024;
|
Cytonn Report: Kenya Eurobonds Performance |
||||||
|
|
2018 |
2019 |
2021 |
2024 |
||
|
Tenor |
10-year issue |
30-year issue |
7-year issue |
12-year issue |
13-year issue |
7-year issue |
|
Amount Issued (USD) |
1.0 bn |
1.0 bn |
0.9 bn |
1.2 bn |
1.0 bn |
1.5 bn |
|
Years to Maturity |
3.8 |
23.8 |
3.0 |
8.0 |
10.1 |
6.8 |
|
Yields at Issue |
7.3% |
8.3% |
7.0% |
7.9% |
6.2% |
10.4% |
|
1-Jan-24 |
9.8% |
10.2% |
10.1% |
9.9% |
9.5% |
|
|
1-May-24 |
9.3% |
10.2% |
9.3% |
10.0% |
10.0% |
10.0% |
|
17-May-24 |
8.8% |
9.8% |
8.5% |
9.4% |
9.4% |
9.4% |
|
20-May-24 |
8.8% |
9.8% |
8.6% |
9.4% |
9.5% |
9.4% |
|
21-May-24 |
9.0% |
9.9% |
8.7% |
9.5% |
9.6% |
9.5% |
|
22-May-24 |
9.0% |
10.0% |
8.8% |
9.6% |
9.7% |
9.6% |
|
23-May-24 |
9.2% |
10.1% |
9.1% |
9.8% |
9.8% |
9.8% |
|
Weekly Change |
0.4% |
0.3% |
0.5% |
0.4% |
0.4% |
0.4% |
|
MTD Change |
(0.2%) |
(0.0%) |
(0.2%) |
(0.2%) |
(0.2%) |
(0.2%) |
|
YTD Change |
(0.7%) |
(0.1%) |
(1.0%) |
(0.1%) |
0.3% |
9.8% |
Source: Central Bank of Kenya (CBK) and National Treasury
Kenya Shilling:
During the week, the Kenya Shilling depreciated against the US Dollar by 0.8%, to close at Kshs 131.7, from Kshs 130.7 recorded the previous week. On a year-to-date basis, the shilling has appreciated by 16.1% against the dollar, a contrast to the 26.8% depreciation recorded in 2023.
We expect the shilling to be supported by:
- Diaspora remittances standing at a cumulative USD 4,457.5 mn in the 12 months to April 2024, 11.9% higher than the USD 3,984.9 mn recorded over the same period in 2023, which has continued to cushion the shilling against further depreciation. In the April 2024 diaspora remittances figures, North America remained the largest source of remittances to Kenya accounting for 54.0% in the period, and,
- The tourism inflow receipts which came in at USD 352.5 bn in 2023, a 31.5% increase from USD 268.1 bn inflow receipts recorded in 2022, and owing to tourist arrivals that improved by 27.6% to 182,000 in the 12 months to January 2024, from 151,000 recorded during a similar period in 2023.
The shilling is however expected to remain under pressure in 2024 as a result of:
- An ever-present current account deficit which came at 4.0% of GDP in FY’2023 from 5.1% recorded in FY’2022,
- The need for government debt servicing, continues to put pressure on forex reserves given that 67.3% of Kenya’s external debt was US Dollar denominated as of December 2023, and 72.0% of revenues goes into debt services as of April 2024, and,
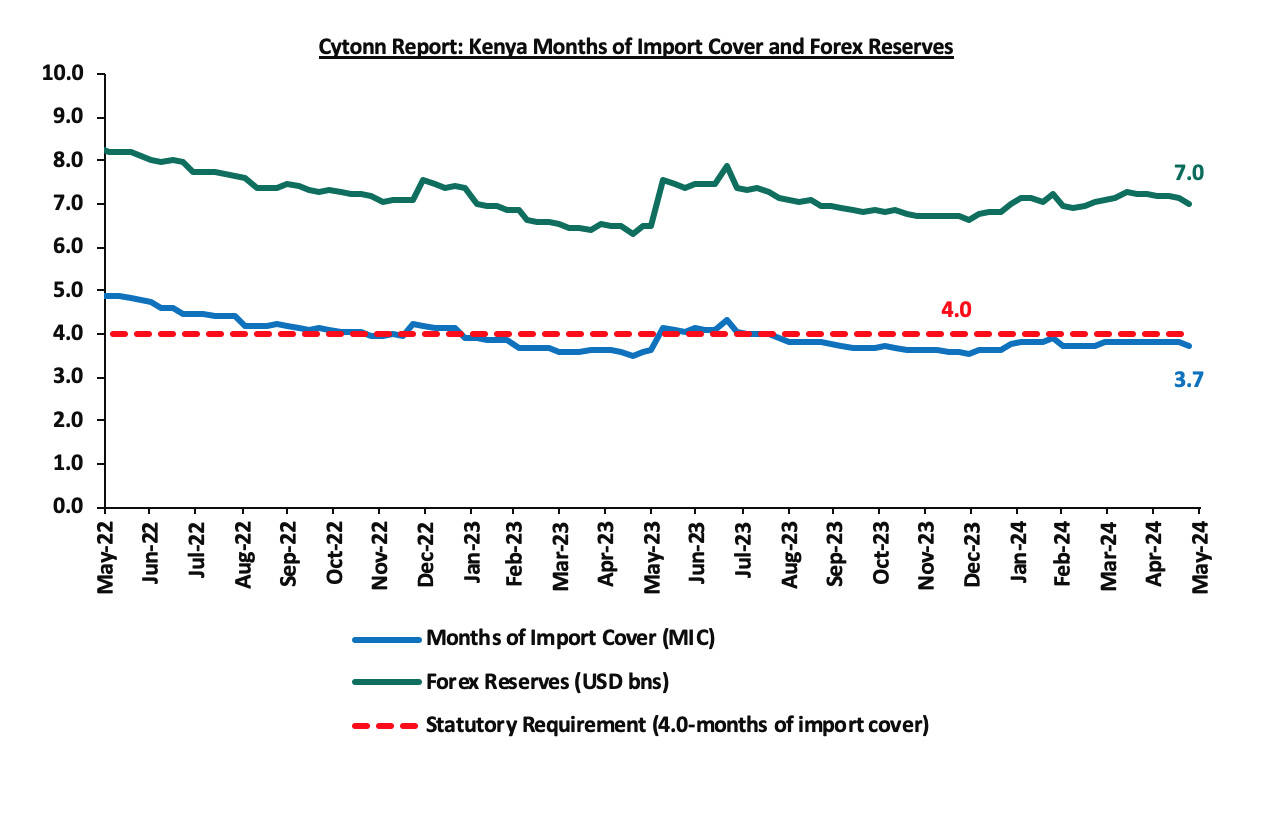
- Dwindling forex reserves, currently at USD 7.0 mn (equivalent to 3.7 months of import cover), which is below the statutory requirement of maintaining at least 4.0 months of import cover.
Key to note, Kenya’s forex reserves decreased by 2.0% during the week to USD 7.0 bn from USD 7.1 bn recorded the previous week, equivalent to 3.7 months of import cover down from 3.8 recorded the previous week, and remained below the statutory requirement of maintaining at least 4.0-months of import cover.
The chart below summarizes the evolution of Kenya's months of import cover over the years:
Weekly Highlights
- Kenya’s FY’2023 Gross Domestic Product (GDP) Growth
During the week, the Kenya National Bureau of Statistics (KNBS) released the 2024 Economic Survey, highlighting that the Kenyan economy recorded a 5.6% growth in FY’2023, faster than the 4.9% growth recorded in FY’2022. The main contributor to Kenyan GDP remains to be the Agriculture, Fishing and Forestry sector which grew by 6.5% in FY’2023 compared to a contraction of 1.5% in FY’2022. All sectors in FY’2023, except Mining and Quarrying, recorded positive growths, with varying magnitudes across activities. Most sectors recorded improved growth compared to FY’2022 with Agriculture, Forestry and Fishing, Accommodation and Food Services, and Real Estate Sectors recording the highest growth improvements of 7.9% points, 6.8% points, and 2.8% points, respectively. Other sectors that recorded expansion in growth rate, from what was recorded in FY’2022 were Financial Services Indirectly Measured, Transport and Storage and Health sectors, of 2.5%, 0.3%, and 1.5% points respectively.
The key take-outs from the report include;
- Sectoral Contribution to Growth - The biggest gainer in terms of sectoral contribution to GDP was the Financial and Insurance sector, increasing by 0.4% points to 9.5% in FY’2023 from 9.1% in FY’2022, while the Manufacturing sector was the biggest loser, declining by 0.3% points to 8.2% in FY’2023, from 8.4% in FY’2022. Real Estate was the second largest contributor to GDP at 10.3% in FY’2023, up from 10.1% recorded in FY’2022, indicating sustained growth. The Accommodation and Food Services sector recorded the highest growth rate in FY’2023 growing by 33.6%, faster than the 26.8% growth recorded in FY’2022. The chart below shows the top contributors to GDP by sector in FY’2023:
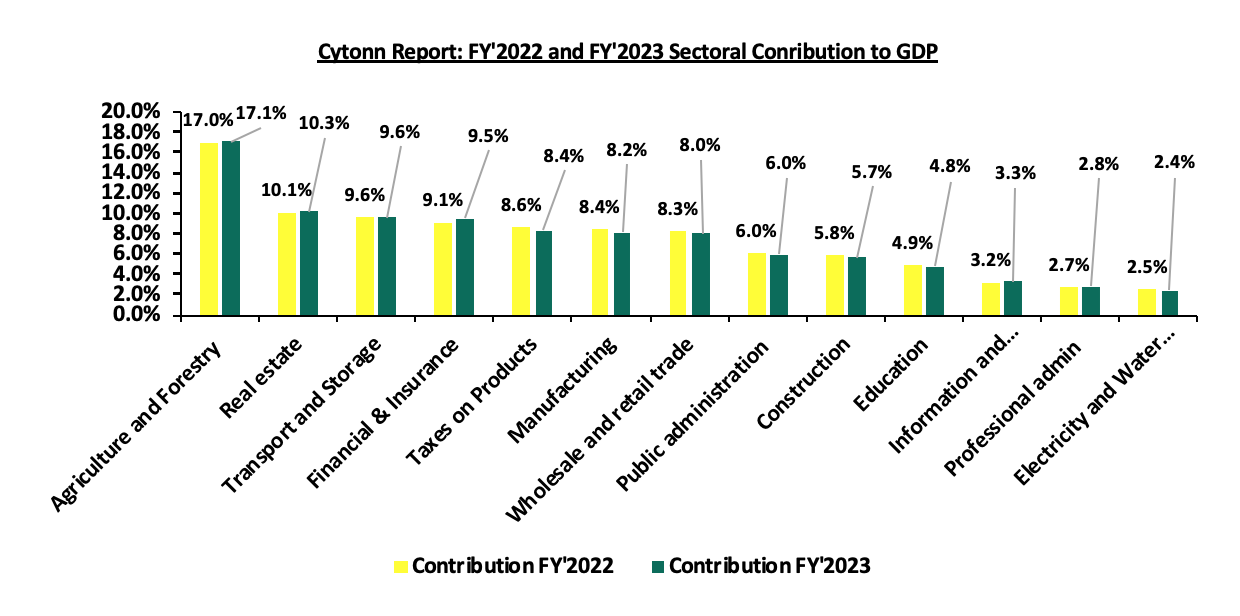
Source: KNBS FY’2022 and FY’2023 GDP Report
- Rebound in the Agricultural Sector– Agriculture and Forestry recorded a growth of 6.5% in FY’2023. The performance was an increase of 8.1% points, from the contraction of 1.5% recorded in FY’2022. The positive growth recorded during the quarter was mainly attributable to favourable weather conditions that boosted crop and livestock production. Production of key food crops such as maize, beans, and potatoes increased significantly during the year
- Increased growth in the Transport and Storage Sector: The Transport and Storage sector registered a growth of 0.4% points to 6.2% in FY’2023 compared to the 5.8% in FY’2022. Some of the notable improvements include:
-
- Passenger and freight movements via Standard Gauge Railway (SGR) grew by 14.1% and 7.3% to 2,729 thousand passengers and 6,533.0 thousand tonnes, respectively, in 2023 from 2,392 thousand passengers and 6,088.5 thousand tonnes respectively in 2022,
- The total passenger air traffic expanded by 19.2% to 12,205.8 thousand passengers from 10,239.7 thousand passengers recorded in 2022, and,
- The volume of cargo traffic handled at the Port of Mombasa grew by 6.2% to 35,978 thousand metric tonnes in 2023 from 33,880 thousand metric tonnes in 2022.
- Decelerated growth in the manufacturing sector - The manufacturing sector recorded a decelerated growth of 2.0% in FY’2023 compared to a 2.6% growth in a similar period of review in 2022. Additionally, the sectoral contribution to GDP decreased to 8.2% in FY’2023, from 8.4% recorded in FY’2022.
- Significant growth in the Accommodation and Food Service sector: Accommodation and Food Services sector recorded the highest growth rate among all the sectors in FY’2023, having expanded by 6%, higher than the 26.8% recorded in FY’2022. Additionally, the contribution to GDP increased by 0.3% points, to 1.3% in FY’2023, compared to 1.0% recorded in FY’2022.
The chart below shows the different sectoral GDP growth rates for FY’2023
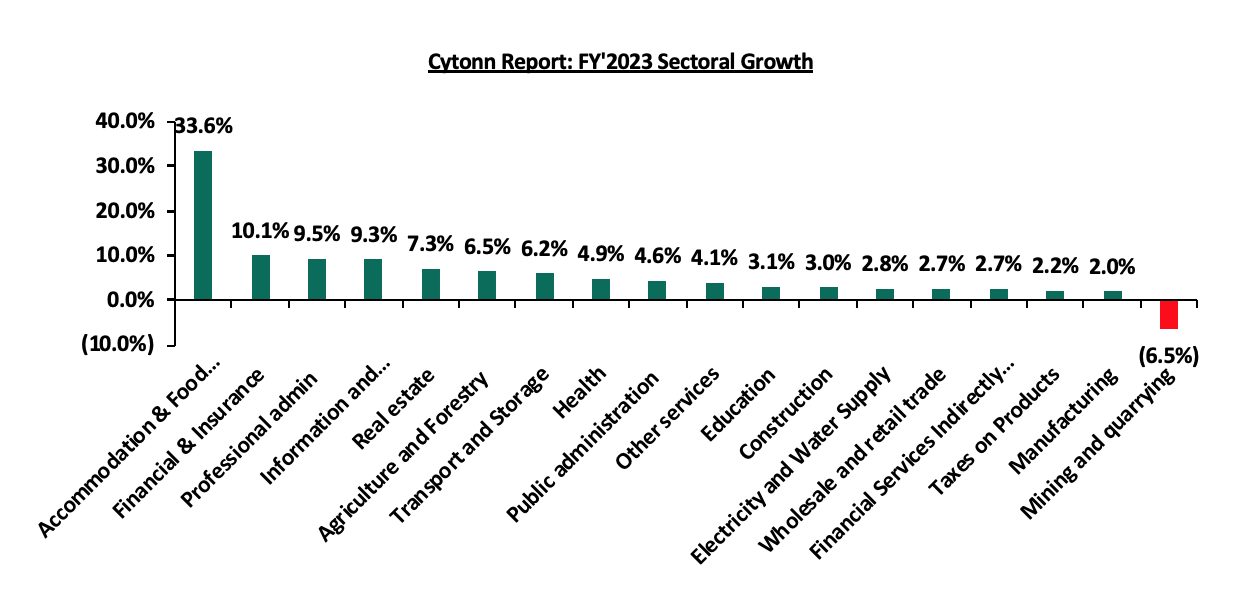
Source: KNBS FY’2023 GDP Report
In the near-term, we expect the economy to grow at a slower pace given the restrained business as a result of the difficult economic environment caused by increasing taxes, and an overall rise in the cost of living. Additionally, the Central Bank of Kenya’s Monetary Policy Committee’s (MPC) decision on 3rd April 2024 to maintain the Central Bank Rate (CBR) at 13.0% in a bid to curb inflation and maintain price stability is expected to curtail economic growth. The higher CBR is set to maintain the cost of credit issued by lenders high, hence discouraging borrowing, which will in turn lead to reduced investment spending in the economy by both individuals and businesses. Additionally, the inflation in the country remains within the Central Bank’s range of 2.5%-7.5%, and risks going high mainly on the back of a possible increase in fuel prices due to an increase in international fuel prices resulting from geo-political tensions. Thus, the consumer purchasing power remains low, resulting in reduced demand for goods and services and consequentially slowed economic growth. However, we expect the agricultural sector to continue backing economic growth in the country, as the country continues to experience sufficient rain during the year. The sector remains Kenya’s largest contributor to GDP, as well as food prices being a major contributor to headline inflation. Additionally, we expect we expect the economy to benefit from the strengthening Shilling and the ease in inflationary pressures.
For a more detailed analysis, see our FY’2023 GDP Note.
- Kenya’s FY’2023 Balance of Payments (BOP)
Kenya’s balance of payment (BoP) position improved by 46.4% in FY’2023, with the deficit narrowing to Kshs 134.8 bn, from a deficit of Kshs 251.5 bn in FY’2022, and a slight deterioration from the deficit of Kshs 131.5 bn recorded in Q3’2023. The y/y positive performance in BoP was mainly driven by a 13.0% improvement in the current account balance to a deficit of Kshs 603.7 bn in FY’2023, from a deficit of Kshs 694.2 bn in FY’2022, and the 4.6% increase in capital account balance to Kshs 17.3 bn from Kshs 16.5 bn recorded in a similar period in 2022. The performance was however weighed down by a 21.2% decrease in the financial account balance to a surplus of Kshs 384.7 bn from a surplus of Kshs 488.4 bn in FY’2022. The table below shows the breakdown of the various balance of payments components, comparing FY’2023 and FY’2022:
|
Cytonn Report: Kenya’s Balance of Payments |
||||
|
Item |
FY'2022 |
Q3'2023 |
FY'2023 |
Y/Y % Change |
|
Current Account Balance |
(694.2) |
(122.5) |
(603.7) |
(13.0%) |
|
Capital Account Balance |
16.5 |
3.4 |
17.3 |
4.6% |
|
Financial Account Balance |
488.4 |
(20.6) |
384.7 |
(21.2%) |
|
Net Errors and Omissions |
(62.3) |
8.3 |
66.9 |
(207.5%) |
|
Balance of Payments |
(251.5) |
(131.5) |
(134.8) |
(46.4%) |
All values in Kshs bns
Key take-outs from the table include;
- The current account deficit (value of goods and services imported exceeds the value of those exported) narrowed by 13.0% to Kshs 603.7 bn, from Kshs 694.2 bn in FY’2022, mainly attributable to a 0.3% improvement in the merchandise trade balance deficit to Kshs 1,401.6 bn, from Kshs 1,405.4 bn recorded in FY’2022,
- The financial account balance deficit (the difference between the foreign assets purchased by domestic buyers and the domestic assets purchased by the foreign buyers) recorded a surplus of Kshs 384.7 bn in FY’2023, a decrease of 21.2% from the surplus of Kshs 488.4bn recorded in FY’2022. Notably, reserve assets were depleted by Kshs 80.4 bn, and the government received Kshs 54.5 bn from the International Monetary Fund (IMF), a 27.7% decline from Kshs 75.3 bn in 2022, and,
- Consequently, the Balance of Payments (BoP) position improved to a deficit of Kshs 134.8 bn in FY’2023, from a deficit of Kshs 251.5 bn recorded in FY’2022.
Current Account Balance
Kenya’s current account deficit narrowed by 13.0% to Kshs 603.7 bn in FY’2023 from the Kshs 694.2 bn deficit recorded in FY’2022. The y/y contraction registered was driven by:
- The contraction of the merchandise trade (a scenario where imports are greater than exports of goods resulting in a negative net foreign investment) by 0.3% to Kshs 1,401.6 bn in FY’2023, from Kshs 1,405.4 bn recorded in FY’2022, and,
- A 27.2% improvement in the secondary income (transfer) balance to a surplus of Kshs 977.9 bn from a surplus of Kshs 768.8 bn in FY’2022.
The table below shows the breakdown of the various current account components, comparing FY’2022 and FY’2023:
|
Cytonn Report: Kenya’s Current Account Balance |
|||
|
Item |
FY'2022 |
FY'2023 |
Y/Y % Change |
|
Merchandise Trade Balance |
(1,405.4) |
(1,401.6) |
(0.3%) |
|
Services Trade Balance |
149.9 |
84.2 |
(43.9%) |
|
Primary Income Balance |
(207.4) |
(263.9) |
27.2% |
|
Secondary Income (transfer) Balance |
768.8 |
977.6 |
27.2% |
|
Current Account Balance |
(694.2) |
(603.7) |
(13.0%) |
All values in Kshs bns
Kenya's balance of payments improved in FY'2023, mainly on the back of a 13.0% improvement in the current account to a deficit of Kshs 603.7 bn in 2023, from a deficit of Kshs 694.2 bn in 2022 reflecting significant improvements in the country's external economic position. This positive shift was primarily driven by a 0.3% contraction in the merchandise trade deficit, occasioned by robust growth in merchandise exports, notably in horticulture and tea, coupled with a favourable exchange rate movement due to the depreciation of the Kenyan Shilling. Additionally, the secondary income balance saw a substantial increase, bolstered by strong growth in diaspora remittances. Looking ahead, the outlook for Kenya's current account is optimistic, as continued growth in key export sectors and sustained diaspora remittances are expected to further improve the current account balance. Efforts to diversify exports and enhance value addition in agricultural products, along with prudent fiscal and monetary policies, will be crucial in sustaining this positive trajectory. Furthermore, the ongoing strengthening of the Kenyan Shilling against most trading currencies is expected to lower the import bill hence narrowing the current account deficit. We expect that the current administration’s focus on fiscal consolidation will improve the balance of payments performance by minimizing the costs of servicing external debts. Additionally, the favorable weather conditions are set to boost agricultural production in the country, thereby increasing the export of agricultural products, and supporting the current account. We anticipate that the balance of payments will be more stable with the help of multiple trade agreements, such as the one between Kenya and the EU and the one among the EAC, SADC, and COMESA, as the agreements will boost the amount and variety of exports that are needed and offer more opportunities to sell them.
For a more detailed analysis, see our FY’2023 BOP Note
- May 2024 Inflation Projection
We are projecting the y/y inflation rate for May 2024 to come in at the range of 4.7% - 5.1% mainly on the back of:
- Reduced Fuel Prices – The prices for Super Petrol, Diesel, and Kerosene decreased by Kshs 1.0, Kshs 1.2, and Kshs 1.3 each respectively, and will retail at Kshs 192.8, Kshs 179.2, and Kshs 168.7 per litre respectively from the April 2024 prices of Kshs 193.8, Kshs 180.4 and Kshs 170.0 respectively according to the latest EPRA report, following the government's efforts to stabilize pump prices through the petroleum pump price stabilization mechanism which has so far expended Kshs 9.9 bn in the FY’2023/24 to cushion the increases applied to the petroleum pump prices. This decline in fuel prices is likely to contribute to the easing of inflationary pressures as it provides a stabilizing effect on consumer purchasing power as well as business operational costs since fuel is a major input cost for businesses,
- The maintenance of the Central Bank Rate (CBR) at 13.0% – In February this year, the monetary policy committee noted that there was need to tighten the monetary policy following the sustained depreciation of the Kenyan shilling as well as the heightened inflationary pressures which came in at 6.9% in the month of January, 0.3% points increase from the 6.6% in December and remaining within the upper bound of the inflation target range of 2.5% to 7.5%. In line with this, the committee increased the CBR by 50 bps to 13.00% from 12.50% in February. Additionally, on 3rd April 2024, the monetary policy committee decided to maintain the CBR at 13.0% to give the new rate time to take further effect in the economy, with inflation easing to 5.0% in April from 5.7% recorded in March 2024. Raising the CBR increases interest rates, which in turn reduces borrowing and spending, helping to curb inflation by cooling down demand in the economy.
- Strengthening of the Kenya Shilling against the US Dollar – The Kenya Shilling has recorded a 1.2% month-to-date gain to Kshs 131.7 as of 24th May 2024 from the Kshs 133.3 recorded at the beginning of the month in addition to the 16.1% year-to-date gain from the Kshs 157.0 recorded at the beginning of the year. This can be attributed to the recent buyback of the USD 2.0 bn Eurobond, alleviating the debt-risk on the country, the inflows from foreign loans and the infrastructure bond, which increased dollar supply in the economy coupled with the monetary policy committee’s decision to maintain the CBR at 13.0%. This gain in the exchange rate is expected to ease inflation further on the back of reduced import and input prices, and,
- Reduction in electricity prices – In April, EPRA announced a Kshs 3.3 decrease per unit in electricity consumer prices on the back of a reduction in the cost of fuel as a result of the strengthening of the Shilling against the dollar, with the Fuel Energy Cost decreasing to Kshs 3.3 from Kshs 4.7 and the foreign exchange rate fluctuation decreasing to Kshs 2.0 in April from Kshs 3.7 per unit in March. With electricity being one of the major inputs of inflation, this decline is expected to reduce production costs for businesses as well as reduce electricity costs for households thus easing inflation.
Going forward, we expect inflationary pressures to alleviate in the short term, while remaining in the CBK’s target range of 2.5%-7.5% aided by the strengthening of the Kenya shilling against the US Dollar, which has continued to contribute to a reduction in fuel prices. Furthermore, the decision to maintain the CBR at 13.0% during the latest MPC meeting is meant to continue reducing money supply, in turn easing inflation as well as support the exchange rate. We also anticipate that government initiatives to subsidize key inputs in agricultural production, such as fertilizers, will drive down the costs of farming inputs and support the easing of inflation in the long term.
Rates in the Fixed Income market have been on an upward trend given the continued high demand for cash by the government and the occasional liquidity tightness in the money market. The government is 21.7% ahead of its prorated net domestic borrowing target of Kshs 370.1 bn, and 10.7% ahead of the total domestic net borrowing target of Kshs 407.0 bn for FY’2023/2024, having a net borrowing position of Kshs 450.4 bn. However, we expect a downward readjustment of the yield curve in the short and medium term, with the government looking to increase its external borrowing to maintain the fiscal surplus, hence alleviating pressure in the domestic market. As such, we expect the yield curve to normalize in the medium to long-term and hence investors are expected to shift towards the long-term papers to lock in the high returns.
Market Performance:
During the week, the equities market was on an upward trajectory, with NSE 10 gaining the most by 4.0%, while NASI, NSE 25, and NSE 20 gained by 2.3%, 2.7%, and 0.7% respectively, taking the YTD performance to gains of 29.2%, 24.5%, 23.0% and 13.8% for NSE 10, NSE 25, NASI and NSE 20 respectively. The equities market performance was driven by gains recorded by large-cap stocks such as KCB Group, NCBA, and Cooperative Bank of 10.4%, 7.2%, and 4.3% respectively. The performance was, however, weighed down by losses recorded by large-cap stocks such as Stanbic Bank of 12.8%;
During the week, equities turnover increased significantly by 151.2% to USD 16.9 mn from USD 6.7 mn recorded the previous week, taking the YTD total turnover to USD 219.6 mn. Foreign investors became net buyers with a net buying position of USD 4.1 mn, from a net selling position of USD 0.02mn recorded the previous week, taking the YTD foreign net selling position to USD 3.6 mn.
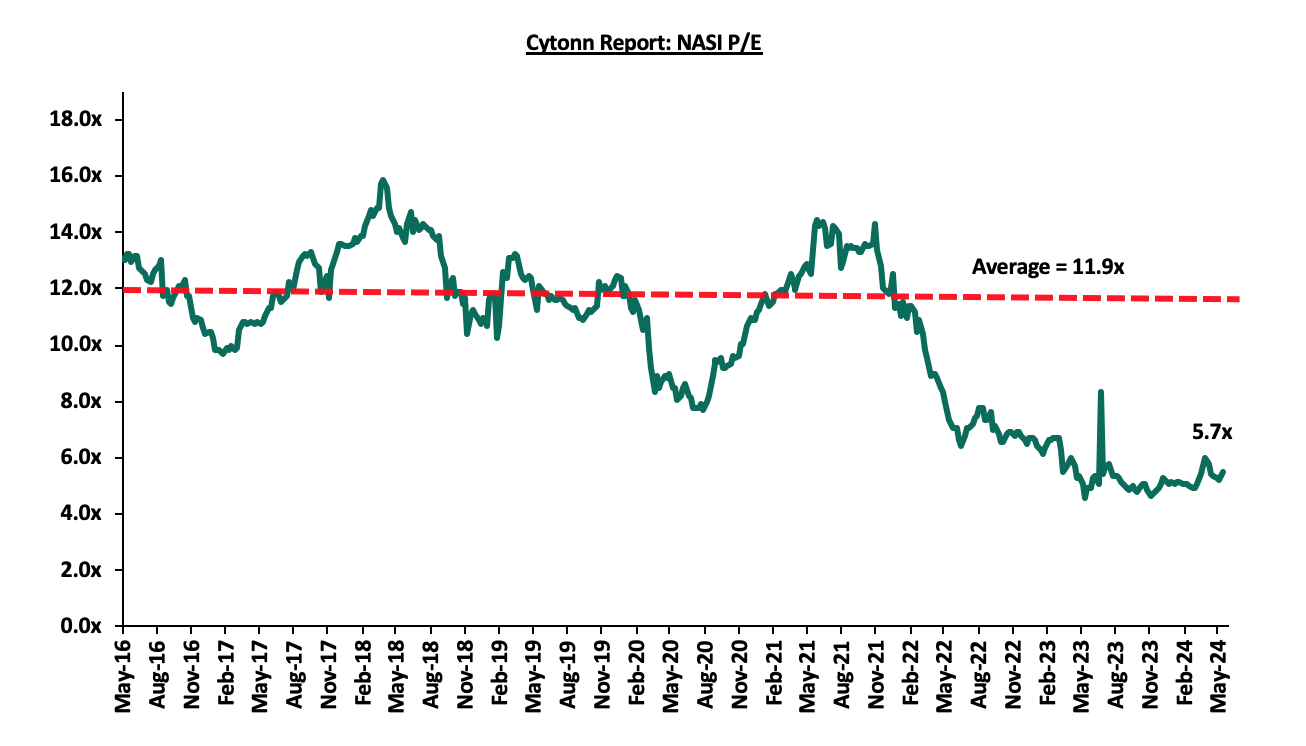
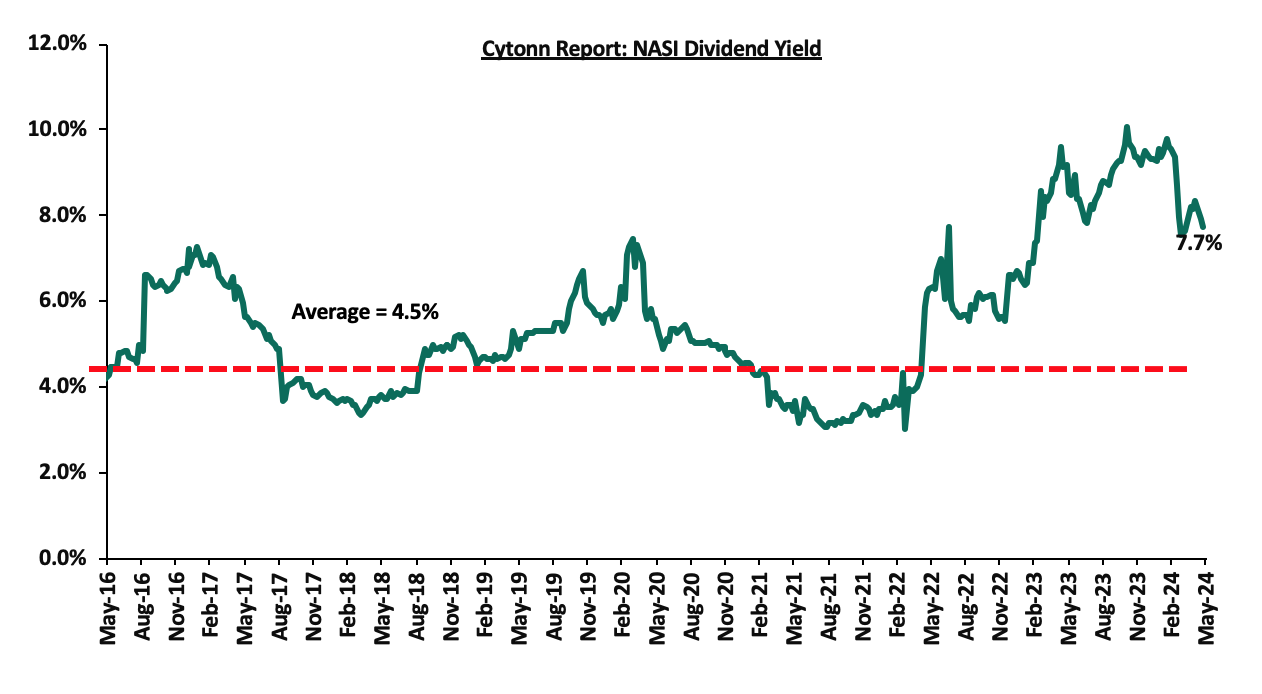
The market is currently trading at a price-to-earnings ratio (P/E) of 5.7x, 52.3% below the historical average of 11.9x. The dividend yield stands at 7.7%, 3.2% points above the historical average of 4.5%. Key to note, NASI’s PEG ratio currently stands at 0.7x, an indication that the market is undervalued relative to its future growth. A PEG ratio greater than 1.0x indicates the market is overvalued while a PEG ratio less than 1.0x indicates that the market is undervalued. The charts below indicate the historical P/E and dividend yields of the market:
Universe of Coverage:
|
Cytonn Report: Equities Universe of Coverage |
|||||||||
|
Company |
Price as at 17/05/2024 |
Price as at 24/05/2024 |
w/w change |
YTD Change |
Target Price* |
Dividend Yield |
Upside/ Downside** |
P/TBv Multiple |
Recommendation |
|
Stanbic Holdings |
124.8 |
108.8 |
(12.8%) |
2.6% |
145.3 |
14.1% |
47.7% |
0.7x |
Buy |
|
Jubilee Holdings |
176.0 |
184.8 |
5.0% |
(0.1%) |
260.7 |
6.5% |
47.6% |
0.3x |
Buy |
|
NCBA*** |
38.3 |
41.1 |
7.2% |
5.7% |
55.2 |
11.6% |
46.0% |
0.8x |
Buy |
|
Sanlam |
6.4 |
6.2 |
(2.5%) |
3.7% |
8.8 |
0.0% |
41.7% |
1.8x |
Buy |
|
Co-op Bank*** |
12.8 |
13.3 |
4.3% |
17.2% |
17.2 |
11.3% |
40.6% |
0.6x |
Buy |
|
Diamond Trust Bank*** |
50.0 |
50.0 |
0.0% |
11.7% |
65.2 |
10.0% |
40.4% |
0.2x |
Buy |
|
ABSA Bank*** |
13.0 |
13.5 |
4.2% |
16.9% |
17.3 |
11.5% |
39.6% |
1.1x |
Buy |
|
Equity Group*** |
44.9 |
46.5 |
3.7% |
36.0% |
60.2 |
8.6% |
38.1% |
0.9x |
Buy |
|
Standard Chartered*** |
185.0 |
187.0 |
1.1% |
16.7% |
225.2 |
15.5% |
35.9% |
1.3x |
Buy |
|
Kenya Reinsurance |
2.0 |
2.0 |
0.0% |
8.1% |
2.5 |
10.0% |
35.5% |
0.2x |
Buy |
|
I&M Group*** |
18.1 |
18.6 |
2.5% |
6.3% |
22.5 |
13.7% |
35.0% |
0.4x |
Buy |
|
CIC Group |
2.3 |
2.2 |
(1.3%) |
(3.1%) |
2.8 |
5.9% |
32.0% |
0.7x |
Buy |
|
KCB Group*** |
31.9 |
35.2 |
10.4% |
60.1% |
45.7 |
0.0% |
29.9% |
0.5x |
Buy |
|
Britam |
5.6 |
5.4 |
(3.2%) |
5.4% |
6.5 |
0.0% |
19.9% |
0.7x |
Accumulate |
|
Liberty Holdings |
5.5 |
5.6 |
1.8% |
45.1% |
6.1 |
6.7% |
15.6% |
0.4x |
Accumulate |
|
HF Group |
4.3 |
4.2 |
(3.7%) |
20.9% |
4.6 |
0.0% |
9.2% |
0.2x |
Hold |
Weekly Highlights
Earnings Release
- KCB Group’s Q1’2024 Financial Performance
During the week, KCB Bank Kenya released their Q1’2024 financial results. Below is a summary of the performance:
|
Balance Sheet Items |
Q1’2023 |
Q1’2024 |
y/y change |
|
Government Securities |
252.1 |
351.9 |
39.6% |
|
Net Loans and Advances |
928.8 |
1,017.4 |
9.5% |
|
Total Assets |
1,630.6 |
1,996.2 |
22.4% |
|
Customer Deposits |
1,196.6 |
1,501.0 |
25.4% |
|
Deposits per branch |
2.0 |
2.5 |
27.3% |
|
Total Liabilities |
1,415.8 |
1,757.6 |
24.1% |
|
Shareholders’ Funds |
208.1 |
231.5 |
11.2% |
|
Balance Sheet Ratios |
Q1’2023 |
Q1’2024 |
% points change |
|
Loan to Deposit Ratio |
77.6% |
67.8% |
(9.8%) |
|
Government Securities to Deposit Ratio |
21.1% |
23.4% |
2.4% |
|
Return on average equity |
20.9% |
20.1% |
(0.8%) |
|
Return on average assets |
2.9% |
2.4% |
(0.5%) |
|
Income Statement |
Q1’2023 |
Q1’2024 |
y/y change |
|
Net Interest Income |
22.1 |
31.1 |
40.8% |
|
Net non-Interest Income |
14.8 |
17.4 |
17.8% |
|
Total Operating income |
36.9 |
48.5 |
31.6% |
|
Loan Loss provision |
(4.1) |
(6.3) |
53.4% |
|
Total Operating expenses |
(23.0) |
(27.3) |
18.8% |
|
Profit before tax |
13.9 |
21.2 |
52.7% |
|
Profit after tax |
9.8 |
16.5 |
69.0% |
|
Core EPS |
3.0 |
5.1 |
69.0% |
|
Income Statement Ratios |
Q1’2023 |
Q1’2024 |
% points change |
|
Yield from interest-earning assets |
10.2% |
11.6% |
1.4% |
|
Cost of funding |
3.2% |
4.6% |
1.4% |
|
Net Interest Spread |
7.1% |
7.0% |
(0.1%) |
|
Net Interest Margin |
7.3% |
7.4% |
0.1% |
|
Cost of Risk |
11.2% |
13.0% |
1.9% |
|
Net Interest Income as % of operating income |
59.9% |
64.1% |
4.2% |
|
Non-Funded Income as a % of operating income |
40.1% |
35.9% |
(4.2%) |
|
Cost to Income Ratio |
62.4% |
56.4% |
(6.0%) |
|
Cost to Income Ratio (without LLPs) |
51.2% |
43.3% |
(7.9%) |
|
Capital Adequacy Ratios |
Q1’2023 |
Q1’2024 |
% points change |
|
Core Capital/Total Liabilities |
15.0% |
15.6% |
0.6% |
|
Minimum Statutory ratio |
8.0% |
8.0% |
0.0% |
|
Excess |
7.0% |
7.6% |
0.6% |
|
Core Capital/Total Risk Weighted Assets |
13.6% |
17.6% |
4.0% |
|
Minimum Statutory ratio |
10.5% |
10.5% |
0.0% |
|
Excess |
3.1% |
7.1% |
4.0% |
|
Total Capital/Total Risk Weighted Assets |
17.0% |
20.0% |
3.0% |
|
Minimum Statutory ratio |
14.5% |
14.5% |
0.0% |
|
Excess |
2.5% |
5.5% |
3.0% |
|
Liquidity Ratio |
43.7% |
47.9% |
4.2% |
|
Minimum Statutory ratio |
20.0% |
20.0% |
0.0% |
|
Excess |
23.7% |
27.9% |
4.2% |
Key Take-Outs:
- Increased earnings - Core earnings per share (EPS) increased by 69.0% to Kshs 5.1, from Kshs 3.0 in Q1’2023,
- Declined asset quality – The bank’s gross NPL ratio increased to 17.9% in Q1’2024, from 17.1% in Q1’2023, with a 16.3% increase in Gross non-performing loans to Kshs 205.3 bn, from Kshs 176.5 bn in Q1’2023, compared to the 11.2% increase in gross loans to Kshs 1,144.8 bn, from Kshs 1,029.9 bn recorded in Q1’2023, and,
- Improved Lending – The Group’s loan book recorded an expansion of 9.5% to Kshs 1,017.4 bn, from Kshs 928.8 bn in Q1’2023.
For a more detailed analysis, please see the KCB Group’s Q1’2024 Earnings Note
- HF Group‘s Q1’2024 Financial Performance
During the week, HF Group released their Q1’2024 financial results. Below is a summary of the performance:
|
Balance Sheet Items (Kshs bn) |
Q1'2023 |
Q1'2024 |
y/y change |
|
Net loans |
37.0 |
38.1 |
3.1% |
|
Government Securities |
9.5 |
10.1 |
6.4% |
|
Total Assets |
59.0 |
62.3 |
5.6% |
|
Customer Deposits |
41.2 |
43.8 |
6.2% |
|
Deposits Per Branch |
1.9 |
2.0 |
6.2% |
|
Total Liabilities |
50.2 |
53.3 |
6.1% |
|
Shareholder's Funds |
8.8 |
9.0 |
2.4% |
|
Balance Sheet Ratios |
Q1'2023 |
Q1'2024 |
% y/y change |
|
Loan to deposit ratio |
89.7% |
87.1% |
(2.6%) |
|
Government Securities to deposit ratio |
23.0% |
23.1% |
0.1% |
|
Return on Average Equity |
3.8% |
5.1% |
1.3% |
|
Return on Average Assets |
0.6% |
0.8% |
0.2% |
|
Income Statement (Kshs bn) |
Q1'2023 |
Q1'2024 |
y/y change |
|
Net Interest Income |
0.6 |
0.7 |
7.6% |
|
Net non-Interest Income |
0.3 |
0.4 |
40.7% |
|
Total Operating income |
0.9 |
1.1 |
17.7% |
|
Loan Loss provision |
(0.1) |
(0.1) |
7.2% |
|
Total Operating expenses |
(0.8) |
(0.9) |
11.2% |
|
Profit before tax |
0.1 |
0.2 |
76.2% |
|
Profit after tax |
0.1 |
0.2 |
80.4% |
|
Core EPS |
0.2 |
0.4 |
80.4% |
|
Income Statement Ratios |
Q1'2023 |
Q1'2024 |
y/y change |
|
Yield from interest-earning assets |
9.8% |
11.4% |
1.6% |
|
Cost of funding |
4.8% |
6.3% |
1.5% |
|
Net Interest Spread |
5.0% |
5.1% |
0.2% |
|
Net Interest Margin |
5.0% |
5.4% |
0.3% |
|
Cost of Risk |
11.3% |
10.3% |
(1.0%) |
|
Net Interest Income as % of operating income |
69.6% |
63.7% |
(6.0%) |
|
Non-Funded Income as a % of operating income |
30.4% |
36.3% |
6.0% |
|
Cost to Income Ratio (with LLP) |
90.0% |
85.1% |
(5.0%) |
|
Cost to Income Ratio (without LLP) |
78.8% |
74.8% |
(4.0%) |
|
Capital Adequacy Ratios |
Q1'2023 |
Q1'2024 |
% points change |
|
Core Capital/Total Liabilities |
6.7% |
4.5% |
(2.2%) |
|
Minimum Statutory ratio |
8.0% |
8.0% |
0.0% |
|
Excess |
(1.3%) |
(3.5%) |
(2.2%) |
|
Core Capital/Total Risk Weighted Assets |
7.2% |
5.2% |
(2.0%) |
|
Minimum Statutory ratio |
10.5% |
10.5% |
0.0% |
|
Excess |
(3.3%) |
(5.3%) |
(2.0%) |
|
Total Capital/Total Risk Weighted Assets |
11.0% |
8.8% |
(2.2%) |
|
Minimum Statutory ratio |
14.5% |
14.5% |
0.0% |
|
Excess |
(3.5%) |
(5.7%) |
(2.2%) |
|
Liquidity Ratio |
24.7% |
24.9% |
0.2% |
|
Minimum Statutory ratio |
20.0% |
20.0% |
0.0% |
|
Excess |
4.7% |
4.9% |
0.2% |
Key Take-Outs:
- Strong earnings growth - Core earnings per share (EPS) increased by 80.4% to Kshs 0.4 from Kshs 0.2 in Q1’2023,
- Asset quality deterioration – The bank’s gross NPL ratio increased to 24.1% in Q1’2024 from 19.9% in Q1’2023, attributable to the faster growth of 27.6% in Gross non-performing loans to Kshs 11.2 bn in Q1’2024 from Kshs 8.8 bn in Q1’2023, which outpaced the 5.3% increase in gross loans to Kshs 46.5 bn, from Kshs 44.1 bn recorded in Q1’2023, and,
- Sustained Efficiency – Cost to Income Ratio (CIR) improved by 5.0% points to 85.1%, from 90.0% in Q1’2024, owing to the 17.7% increase in total operating income to Kshs 1.1 bn from Kshs 0.9 bn in Q1’2023, which outpaced the 11.2% increase in total operating expenses to Kshs 0.9 bn, from Kshs 0.8 bn in Q1’2023. The cost-to-income ratio without loan loss provisions declined by 4.0% points to 74.8%, from 78.8% in Q1’2023.
For a more detailed analysis, please see the HF Group’s Q1’2024 Earnings Note
- NCBA Group’s Q1’2024 Financial Performance
During the week, NCBA Group released their Q1’2024 financial results. Below is a summary of the performance:
|
Balance Sheet |
Q1'2023 (Kshs bn) |
Q1'2024 (Kshs bn) |
y/y change |
|
Net Loans and Advances |
287.2 |
320.5 |
11.6% |
|
Kenya Government Securities |
207.1 |
178.0 |
(14.0%) |
|
Total Assets |
628.8 |
694.9 |
10.5% |
|
Customer Deposits |
499.7 |
548.1 |
9.7% |
|
Deposits Per Branch |
4.9 |
5.0 |
1.6% |
|
Total Liabilities |
540.9 |
596.1 |
10.2% |
|
Shareholders' Funds |
87.9 |
98.8 |
12.4% |
|
Key Ratios |
Q1'2023 |
Q1'2024 |
% point change |
|
Loan to Deposit ratio |
57.5% |
58.5% |
1.0% |
|
Government Securities to Deposits ratio |
41.4% |
32.5% |
(9.0%) |
|
Return on Average Equity |
18.4% |
23.2% |
4.9% |
|
Return on Average Assets |
2.5% |
3.3% |
0.7% |
|
Income Statement |
Q1'2023 (Kshs bn) |
Q1'2024 (Kshs bn) |
y/y change |
|
Net interest Income |
8.4 |
8.3 |
(1.2%) |
|
Net non-interest income |
7.2 |
7.7 |
7.4% |
|
Total Operating income |
15.5 |
16.0 |
2.8% |
|
Loan loss provision |
2.0 |
1.4 |
(30.9%) |
|
Total Operating expenses |
9.2 |
9.4 |
3.1% |
|
Profit before tax |
6.4 |
6.5 |
2.2% |
|
Profit after tax |
5.1 |
5.3 |
4.7% |
|
Core EPS |
3.1 |
3.2 |
4.7% |
|
Income Statement Ratios |
Q1'2023 |
Q1'2024 |
y/y change |
|
Yield from interest-earning assets |
10.4% |
12.2% |
1.8% |
|
Cost of funding |
4.6% |
6.5% |
1.9% |
|
Net Interest Margin |
6.0% |
6.0% |
0.0% |
|
Net Interest Income as % of operating income |
53.8% |
51.7% |
(2.1%) |
|
Non-Funded Income as a % of operating income |
46.2% |
48.3% |
2.1% |
|
Cost to Income Ratio |
58.9% |
59.1% |
0.2% |
|
Cost to Income without LLP |
46.3% |
50.6% |
4.3% |
|
Capital Adequacy Ratios |
Q1'2023 |
Q1'2024 |
% points change |
|
Core Capital/Total Liabilities |
16.8% |
17.1% |
0.3% |
|
Minimum Statutory ratio |
8.0% |
8.0% |
|
|
Excess |
8.8% |
9.1% |
0.3% |
|
Core Capital/Total Risk Weighted Assets |
17.7% |
18.5% |
0.8% |
|
Minimum Statutory ratio |
10.5% |
10.5% |
|
|
Excess |
7.2% |
8.0% |
0.8% |
|
Total Capital/Total Risk Weighted Assets |
17.8% |
18.6% |
0.8% |
|
Minimum Statutory ratio |
14.5% |
14.5% |
|
|
Excess |
3.3% |
4.1% |
0.8% |
|
Liquidity Ratio |
53.1% |
51.6% |
(1.5%) |
|
Minimum Statutory ratio |
20.0% |
20.0% |
|
|
Excess |
33.1% |
31.6% |
(1.5%) |
Key Take-Outs:
- Increased earnings - Core earnings per share (EPS) grew by 4.7% to Kshs 3.2, from Kshs 3.1 in Q1’2023,
- Improved asset quality – The bank’s gross NPL ratio decreased to 11.7% in Q1’2024, from 12.8% in Q1’2023, attributable to the slower 1.1% increase in Gross non-performing loans to Kshs 40.2 bn, from Kshs 39.7 bn in Q1’2023, compared to the 10.7% increase in gross loans to Kshs 342.9 bn, from Kshs 309.7 bn recorded in Q1’2023, and,
- Reduced Provisioning - On the back of reduced credit risk occasioned by the improving business environment, the bank decreased its provisions holdings meant to cover for anticipated losses in the future, with its general provisions decreasing by 13.3% to Kshs 12.6 bn, from Kshs 14.4 bn recorded in Q1’2023. Further, loan loss provisions expense reduced by 30.9% to Kshs 1.4 bn, from Kshs 2.0 bn recorded in Q1’2023.
For a more detailed analysis, please see the NCBA Group’s Q1’2024 Earnings Note
- I&M Group’s Q1’2024 Financial Performance
During the week, I&M Group released their Q1’2024 financial results. Below is a summary of the performance:
|
Balance Sheet Items |
Q1’2023 |
Q1’2024 |
y/y change |
|
Government Securities |
72.7 |
73.3 |
0.8% |
|
Net Loans and Advances |
257.7 |
291.5 |
13.1% |
|
Total Assets |
473.5 |
533.0 |
12.5% |
|
Customer Deposits |
324.7 |
383.9 |
18.2% |
|
Deposits per Branch |
3.9 |
4.5 |
15.4% |
|
Total Liabilities |
389.1 |
439.3 |
12.9% |
|
Shareholders’ Funds |
79.0 |
87.2 |
10.5% |
|
Balance Sheet Ratios |
Q1’2023 |
Q1’2024 |
% points change |
|
Loan to Deposit Ratio |
79.4% |
75.9% |
(3.4%) |
|
Government Securities to Deposit Ratio |
22.4% |
19.1% |
(3.3%) |
|
Return on average equity |
14.4% |
15.0% |
0.7% |
|
Return on average assets |
2.6% |
2.6% |
0.0% |
|
Income Statement |
Q1’2023 |
Q1’2024 |
y/y change |
|
Net Interest Income |
6.1 |
8.4 |
37.7% |
|
Net non-Interest Income |
3.5 |
3.2 |
(9.4%) |
|
Total Operating income |
9.6 |
11.5 |
20.6% |
|
Loan Loss provision |
(1.6) |
(1.5) |
(6.4%) |
|
Total Operating expenses |
(6.0) |
(6.6) |
10.0% |
|
Profit before tax |
3.7 |
5.1 |
36.2% |
|
Profit after tax |
2.7 |
3.6 |
35.4% |
|
Core EPS |
1.6 |
2.2 |
35.4% |
|
Income Statement Ratios |
Q1’2023 |
Q1’2024 |
% points change |
|
Yield from interest-earning assets |
10.9% |
14.5% |
3.6% |
|
Cost of funding |
4.2% |
6.3% |
2.1% |
|
Net Interest Margin |
6.7% |
8.0% |
1.4% |
|
Net Interest Income as % of operating income |
63.6% |
72.6% |
9.0% |
|
Non-Funded Income as a % of operating income |
36.4% |
27.4% |
(9.0%) |
|
Cost to Income Ratio |
63.0% |
57.5% |
(5.5%) |
|
CIR without LLP |
45.8% |
44.2% |
(1.7%) |
|
Cost to Assets |
0.9% |
1.0% |
0.1% |
|
Capital Adequacy Ratios |
Q1’2023 |
Q1’2024 |
% points change |
|
Core Capital/Total Liabilities |
22.0% |
20.5% |
(1.5%) |
|
Minimum Statutory ratio |
8.0% |
8.0% |
|
|
Excess |
14.0% |
12.5% |
(1.5%) |
|
Core Capital/Total Risk Weighted Assets |
15.6% |
15.0% |
(0.6%) |
|
Minimum Statutory ratio |
10.5% |
10.5% |
|
|
Excess |
5.1% |
4.5% |
(0.6%) |
|
Total Capital/Total Risk Weighted Assets |
19.9% |
18.3% |
(1.7%) |
|
Minimum Statutory ratio |
14.5% |
14.5% |
|
|
Excess |
5.4% |
3.8% |
(1.7%) |
|
Liquidity Ratio |
46.2% |
44.2% |
(2.0%) |
|
Minimum Statutory ratio |
20.0% |
20.0% |
|
|
Excess |
26.2% |
24.2% |
(2.0%) |
Key Take-Outs:
- Strong earnings growth - Core earnings per share increased by 35.4% to Kshs 2.2 from Kshs 1.6 in Q1’2023, mainly driven by 20.6% growth in total operating income to Kshs 11.5 bn in Q1’2024 from Kshs 9.6 bn in Q1’2023. The performance was however weighed down by the 10.0% increase in total operating expenses to Kshs 6.6 bn, from Kshs 6.0 bn in Q1’2023, and,
- Improved Lending – The Group’s loan book recorded an expansion of 13.1% to Kshs 291.5 bn in Q1’2024 from Kshs 257.7 bn in Q1’2023.
For a more detailed analysis, please see the I&M Group’s Q1’2024 Earnings Note
Asset Quality:
The table below shows the asset quality of listed banks that have released their Q1’2024 results using several metrics:
|
Cytonn Report: Listed Banks Asset Quality in Q1’2024 |
||||||
|
|
Q1'2024 NPL Ratio* |
Q1'2023 NPL Ratio** |
% point change in NPL Ratio |
Q1'2024 NPL Coverage* |
Q1’2023 NPL Coverage** |
% point change in NPL Coverage |
|
Stanbic Bank |
8.9% |
11.7% |
(2.9%) |
72.3% |
66.7% |
5.6% |
|
Equity Group |
14.2% |
10.0% |
4.2% |
58.3% |
62.0% |
(3.8%) |
|
Co-operative Bank of Kenya |
15.9% |
14.1% |
1.8% |
58.6% |
62.2% |
(3.6%) |
|
KCB Group |
17.9% |
17.1% |
0.8% |
62.0% |
57.3% |
4.8% |
|
NCBA |
11.7% |
12.8% |
(1.1%) |
55.7% |
56.8% |
(1.0%) |
|
I&M Group |
10.8% |
10.6% |
0.3% |
58.3% |
65.8% |
(7.5%) |
|
HF Group |
24.1% |
19.9% |
4.2% |
74.4% |
81.4% |
(7.0%) |
|
Mkt Weighted Average* |
14.3% |
12.6% |
1.7% |
60.1% |
63.7% |
(3.6%) |
|
*Market cap weighted as at 24/05/2024 |
||||||
|
**Market cap weighted as at 15/06/2023 |
||||||
Key take-outs from the table include;
- Asset quality for the listed banks that have released declined during Q1’2024, with market-weighted average NPL ratio increasing by 1.7% points to 14.3% from 12.6% in Q1’2023, and,
- Market-weighted average NPL Coverage for the listed banks decreased by 3.6% points to 60.1% in Q1’2024 from 63.7% recorded in Q1’2023. The decrease was attributable to I&M Group’s coverage ratio decreasing by 7.5% to 58.3% from 65.8% in Q1’2023, coupled with HF Group’s NPL coverage ratio decreasing by 7.0% points to 74.4% from 81.4% in Q1’2023. The performance was however supported by Stanbic Bank’s NPL Coverage ratio increasing by 5.6% to 72.3% from 66.7% in Q1’2023.
Summary Performance
The table below shows the performance of listed banks that have released their Q1’2024 results using several metrics:
|
Cytonn Report: Listed Banks Performance in Q1’2024 |
||||||||||||||
|
Bank |
Core EPS Growth |
Interest Income Growth |
Interest Expense Growth |
Net Interest Income Growth |
Net Interest Margin |
Non-Funded Income Growth |
NFI to Total Operating Income |
Growth in Total Fees & Commissions |
Deposit Growth |
Growth in Government Securities |
Loan to Deposit Ratio |
Loan Growth |
Return on Average Equity |
|
|
Stanbic |
2.8% |
53.9% |
130.2% |
19.6% |
8.4% |
(34.0%) |
36.9% |
(10.4%) |
22.2% |
(28.4%) |
71.9% |
11.1% |
20.8% |
|
|
Equity |
25.2% |
32.7% |
41.4% |
28.4% |
8.2% |
21.0% |
44.4% |
22.6% |
11.3% |
16.2% |
63.0% |
3.0% |
23.8% |
|
|
COOP Bank |
7.7% |
24.7% |
60.8% |
8.6% |
7.8% |
(0.3%) |
37.7% |
(7.3%) |
14.8% |
11.7% |
78.5% |
5.0% |
19.7% |
|
|
KCB Group |
69.0% |
46.0% |
56.0% |
40.8% |
7.4% |
17.8% |
35.9% |
2.4% |
25.4% |
39.6% |
67.8% |
9.5% |
20.1% |
|
|
NCBA |
4.7% |
29.8% |
70.8% |
(1.2%) |
6.0% |
7.4% |
48.3% |
16.9% |
9.7% |
(14.0%) |
58.5% |
11.6% |
23.2% |
|
|
I&M Group |
35.4% |
53.1% |
76.0% |
37.7% |
8.0% |
(9.4%) |
27.4% |
24.4% |
18.2% |
0.8% |
75.9% |
13.1% |
15.0% |
|
|
HF Group |
80.4% |
28.5% |
52.4% |
7.6% |
5.4% |
40.7% |
36.3% |
56.0% |
6.2% |
6.4% |
87.1% |
3.1% |
5.1% |
|
|
Q1'24 Mkt Weighted Average* |
28.4% |
37.0% |
61.1% |
23.9% |
7.7% |
8.8% |
40.3% |
10.2% |
16.1% |
12.0% |
67.5% |
7.2% |
21.4% |
|
|
Q1'23 Mkt Weighted Average* |
25.0% |
26.2% |
40.2% |
20.1% |
7.3% |
48.1% |
41.3% |
30.0% |
19.0% |
(1.2%) |
73.1% |
19.6% |
22.1% |
|
|
*Market cap weighted as at 24/05/2024 |
||||||||||||||
|
**Market cap weighted as at 15/06/2023 |
||||||||||||||
Key take-outs from the table include:
- The listed banks recorded a 28.4% growth in core Earnings per Share (EPS) in Q1’2024, compared to the weighted average growth of 25.0% in Q1’2023, an indication of improved performance attributable to the improved operating environment experienced during Q1’2024,
- Interest income recorded a weighted average growth of 37.0% in Q1’2024, compared to 26.2% in Q1’2023. Similarly, interest expenses recorded a market-weighted average growth of 61.1% in Q1’2024 compared to a growth of 40.2% in Q1’2023,
- The Banks’ net interest income recorded a weighted average growth of 23.9% in Q1’2024, an increment from the 20.1% growth recorded over a similar period in 2023, while the non-funded income grew by 8.8% in Q1’2024 slower than the 48.1% growth recorded in Q1’2023 despite the revenue diversification strategies implemented by most banks, and,
- The Banks recorded a weighted average deposit growth of 16.1%, lower than the market-weighted average deposit growth of 19.0% in Q1’2023.
We are “Neutral” on the Equities markets in the short term due to the current tough operating environment and huge foreign investor outflows, and, “Bullish” in the long term due to current cheap valuations and expected global and local economic recovery. With the market currently being undervalued for its future growth (PEG Ratio at 0.7x), we believe that investors should reposition towards value stocks with strong earnings growth and that are trading at discounts to their intrinsic value. We expect the current high foreign investors’ sell-offs to continue weighing down the equities outlook in the short term.
- Industry Reports
During the week, the Kenya Bureau of Statistics released the 2024 Economic Survey, which highlighted the performance of various sectors of the economy. The report indicated a general improvement in the hospitality and tourism sectors, with notable gains in the number of international arrivals and monthly bed occupancy. Below is a breakdown of the performance;
- International Arrivals
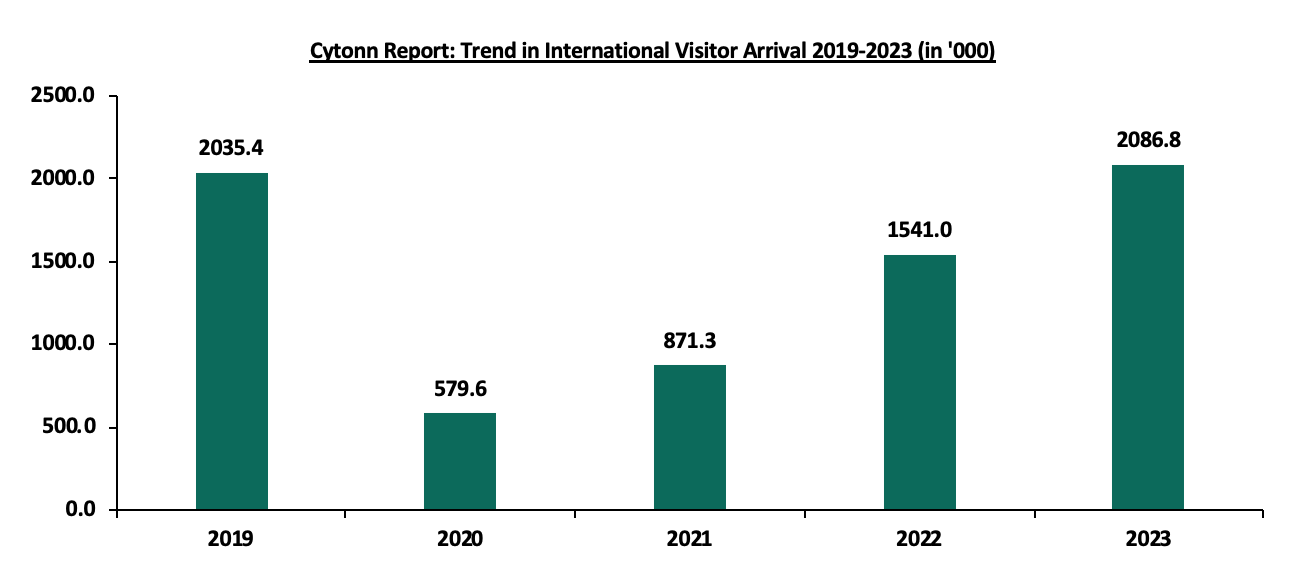
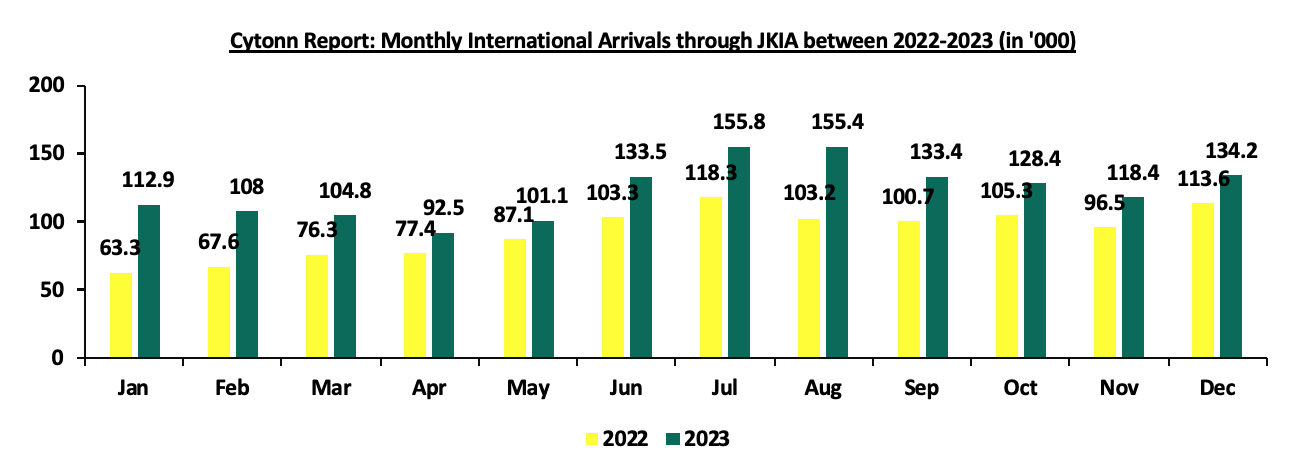
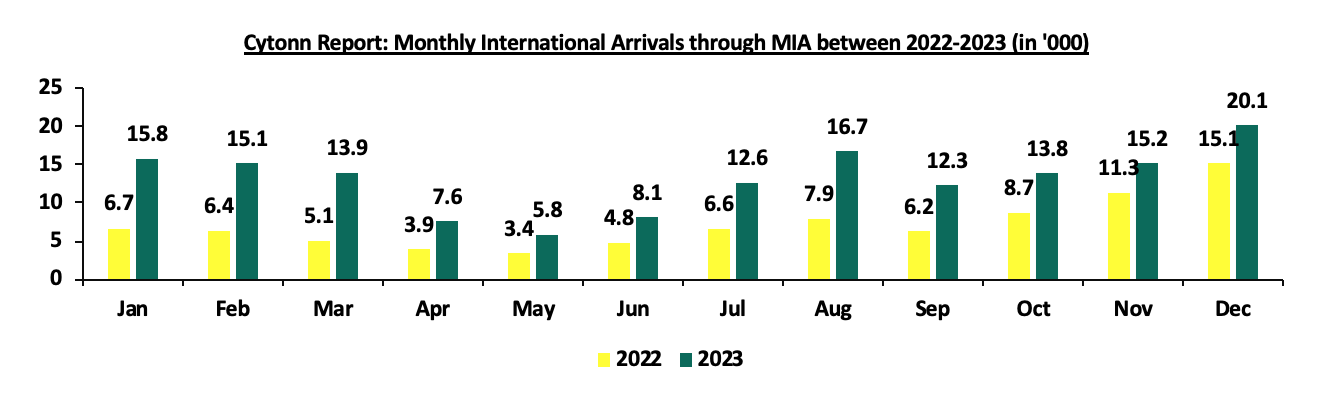
The number of international arrivals grew by 35.4%, reaching 2,086,800 in 2023 from 1,541,000 in 2022. This performance was supported by key developments in the aviation sector, including the introduction of direct flights by three new airlines: IndiGo (Mumbai-Nairobi), Fly Dubai (Dubai-Mombasa), and Airlink (Johannesburg-Nairobi). Additionally, major international conferences such as the Africa Climate Summit 2023 and the EU-Kenya Business Forum contributed to this growth. The number of international arrivals was further bolstered by Nairobi City being honored as the top city in the world by Lonely Planet, a United States-based travel agency. Moreover, the period under review saw an increase in the number of international conferences by 9.0%, rising to 977 from 896 in 2022. The number of local conferences grew by 11.0%, reaching 10,725 from 9,662 recorded in 2022. The charts below show the trend in international arrivals between 2019-2023 and the monthly international visitor arrivals through Moi International Airport (MIA) and Jomo Kenyatta International Airport (JKIA) between 2022-2023;
Source: KNBS, Economic Survey 2024
Source: KNBS, Economic Survey 2024
Source: KNBS, Economic Survey 2024
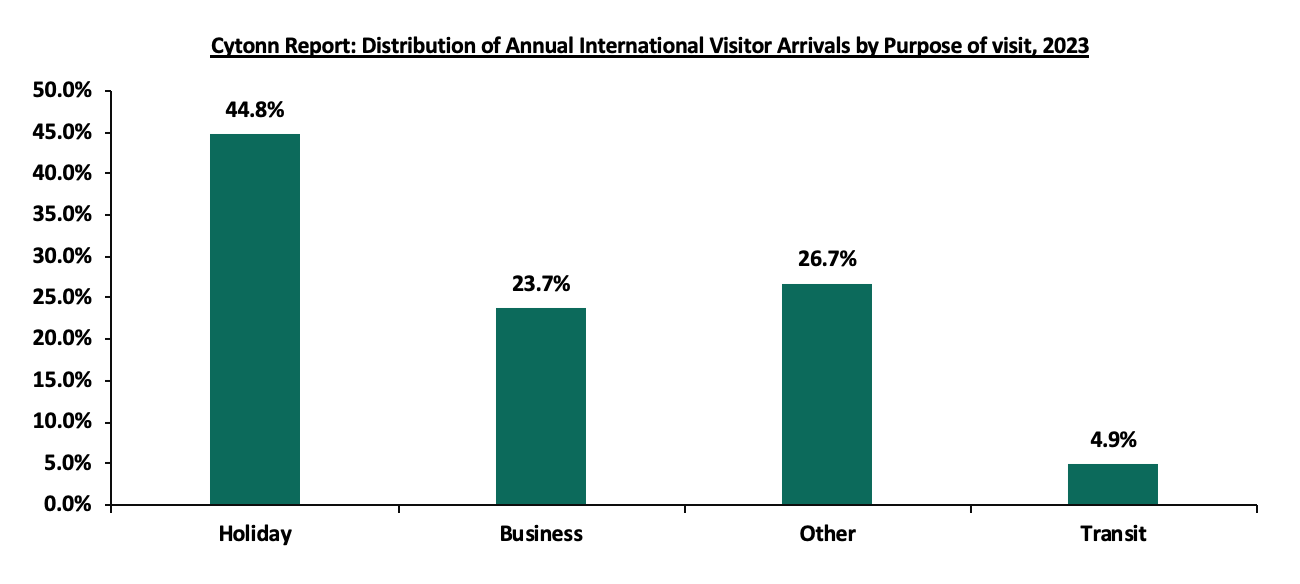
Futhermore, in the period under review, the number of visitor arrivals on holiday accounted for 44.8% of all international arrivals while those on business purposes accounted for 23.7%. The figure below shows the Annual Distribution of International Visitors Arrivals in 2023;
Source: KNBS, Economic Survey 2024
- Hotel bed occupancy
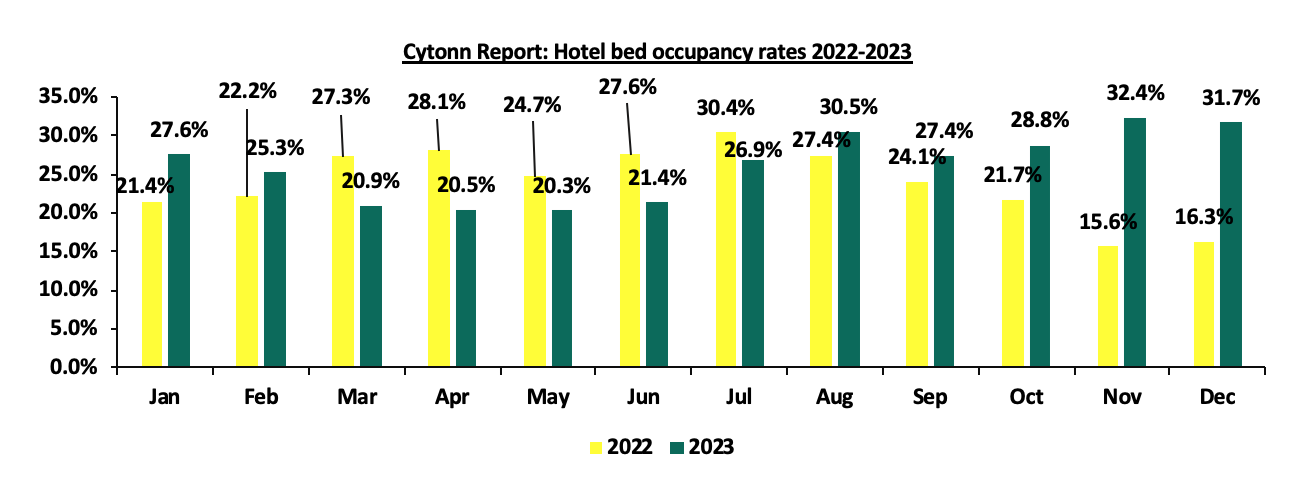
During the period under review, hotel bed occupancy in the country saw significant growth. November was the best-performing month, with a bed occupancy rate of 32.4%. This increase can be attributed to more people traveling within the country in preparation for Christmas Eve and to escape the harsh winter conditions in Europe. The National Statistician noted that the sector continues to stay alert to emerging trends, focusing on the development of wellness tourism, boutique hotels, technological advancements, and sustainable tourism practices. The figure below shows hotel bed occupancy rates in Kenya between 2022-2023;
Source: KNBS, Economic Survey 2024
We expect the sector to remain resilient, supported by several key factors. These include an increased number of international arrivals, continued development activities in the aviation sector, and expansion efforts in the hotel industry, such as the recent opening of the JW Marriott. Additionally, Nairobi's recognition as a major travel destination and the growing regional preference to hold international conferences in the city will further bolster the sector. However, we anticipate that the sector's performance may face challenges such as unpredictable weather conditions, leading to frequent flooding in the country, increased construction costs, and a rise in non-performing loans within the segement which are likely to impede the sector’s growth.
- Infrastructure Sector
During the week, President Ruto signed an agreement with Everstrong Capital, a U.S. firm, for the construction of the 440-kilometer Nairobi-Mombasa Expressway. The project, estimated to cost Ksh 470.0 bn (USD 3.6 bn), will be a six-lane dual carriageway. The project received approval from the National Assembly last year to proceed under a public-private partnership (PPP) model. It aims to reduce traffic congestion and decrease travel time between the two cities from the current average of 10.5 hours to 4 hours. Everstrong Capital will be responsible for designing the road and sourcing funds for its construction expected to take 4 years. Upon completion, the firm will operate the road for 30 years, charging toll charges on motorists to recoup the costs of construction and maintenance. The project is expected to attract investments from international investors, development agencies, pension funds, and Kenyan private investors. Additionally, the Usahihi Expressway will feature rest stops, electric vehicle charging infrastructure, and wildlife observation points.
The project is anticipated to offer job opportunities to local communities, promote business activities in the region, increase economic activity, reduce travel time by alleviating congestion, and bolster Kenya's status as a major economic hub.
- Industrial Sector
During the week, President Ruto's visit to the U.S. resulted in the signing of an agreement between G42 and Microsoft to build a data center worth Ksh 131.0 bn (USD 1.0 bn) at the KenGen Green Park in Olkaria. The data center will run on 100.0% renewable geothermal power from the Olkaria Geothermal fields in Naivasha, Nakuru County. G42, in collaboration with other partners, will design and construct the state-of-the-art facility, which will provide access to Microsoft Azure through a new East Africa Cloud Region. This region is expected to become operational within 24 months of the signing of the definitive agreements and will offer customers scalable, secure, high-speed cloud and AI services, thereby accelerating cloud adoption and the digital transformation of businesses, customers, and partners across Kenya and East Africa.
The project is expected to: i) promote the growth of the industrial sector and encourage industrialization in the region, ii) affirm Kenya’s position as a digital leader within Sub-Saharan Africa, and iii) open up Kenya to more global investment opportunities.
- Real Estate Investments Trusts (REITs)
During the week, Acorn Holdings secured Ksh 23.6 bn (USD 180 mn) in funding from the U.S. Development Finance Corporation (DFC) for affordable student housing. The funding will be channeled towards the development of 35 affordable student housing units, adding 48,000 student beds to Acorn Holdings’ portfolio. This will bring the total student bed capacity in Kenya to 69,000 and create over 50,000 direct jobs. The funding is concessional and will be backed by a USD 380.0 mn special arrangement with Stanbic Bank to manage foreign exchange.
Acorn aims to raise an additional USD 315.0 mn from Kenya’s capital markets, which will include domestic pension funds and asset managers, for a total financing of USD 700.0 mn over the 18-year life of the transaction. Acorn Student Accommodation Development-REIT will receive USD 90 mn for the construction of new Purpose-Built Student Accommodations (PBSAs). Additionally, Acorn plans to recycle funds up to two times during the loan tenure, facilitating up to USD 270.0 mn in financing through redeployment. The remaining USD 90.0 mn will be channeled towards the Acorn Student Accommodation Income-Real Estate Investment Trust (ASA I-REIT) for the acquisition of stabilized PBSAs from the D-REIT.
Additionally, during the week, Laptrust released the FY’2023 financial results for the Imara I-REIT for the period ended 31st December 2023. The table below includes a summary of the REIT’s performance in FY’2023.
Below is a summary of the Laptrust Imara I-REIT’s FY’2023 Performance;
|
Figures in Kshs bn unless stated otherwise |
|||
|
Balance Sheet |
H1'2023 |
FY'2023 |
FY'2023/H1'2023 Change |
|
Total Assets |
7.3 |
7.3 |
(0.6%) |
|
Total Equity |
7.0 |
7.0 |
(0.6%) |
|
Total Liabilities |
0.3 |
0.3 |
(1.3%) |
|
Income Statement |
FY'2023 |
|
Rental Income |
305.2 |
|
Income from Other Sources |
115.8 |
|
Operating Expenses |
176.4 |
|
Profit/Loss |
57.2 |
|
Basic EPS (Kshs) |
0.2 |
|
Figures in Kshs mn unless stated otherwise |
|||
|
Ratios Summary |
H1'2023 |
FY'2023 |
FY'2023/H1'2023 Change |
|
ROA |
2.74% |
0.79% |
(2.0%) |
|
ROE |
2.86% |
0.82% |
(2.0%) |
|
Debt Ratio |
4.2% |
4.2% |
(0.03%) |
|
PBT Margin |
59.6% |
18.8% |
(40.9%) |
|
Rental Yield |
2.4% |
4.5% |
2.1% |
- The basic earnings per unit came in at Kshs 0.2 in FY’2023, a 42.6% decline from 0.3 recorded in H1’2023. The performance was driven by a 42.6% decline in net earnings to Kshs 57.2 mn in FY’2023 from Kshs 99.6 mn recorded in H1’2023,
- Rental and related income for the REIT stood at Kshs 305.2 mn in FY’2023, implying a gross rental yield of 4.5% in FY’2023 on interest-earning assets. This rental income was driven by an upward review in rental prices for several properties within the portfolio. For instance, rental prices at Pension Towers increased from Kshs 78 per SQFT in Q2'2023 to Kshs 100 per SQFT in Q4'2023; a 33.3% increase. Moreover, there was a 14.8% increase in rental prices at CPF House to Kshs 463 per SQFT in 2024 from Kshs 403 per SQFT in 2023. The annual rental yield currently stands at 4.5%,
- Total operating expenses for the REIT came in at Kshs 176.4 mn, attributed to Kshs 62.8 mn incurred in utility expenses, 47.9 mn in property expenses, and Kshs 65.7 mn in fund operating expenses. Notably, property valuation fees stood at 2.9 mn, accounting for 6.1% of the total property expenses in FY’2023,
- Trustee fees in FY’2023 stood at Kshs 37.4 mn, accounting for 56.9% of the total fund operation expenses. Key to note, expenses made up 41.9% of the total operating income.
- Total assets for the REIT stood at Kshs 7.29 bn in FY’2023, a 0.6% decrease from Kshs 7.33 bn recorded in H1’2023, comprising of Kshs 6.7 bn in investment property that saw a 2.7% decrease from Kshs 6.9 bn in H1’2023 attributable to a fair value adjustment of Kshs 187.4 mn, Kshs 0.4 bn in cash and cash equivalents, and Kshs 0.1 bn in trade and other receivables,
- Total liabilities in FY’2023 came in at Kshs 304.2 mn, recording a 1.3% decrease from Kshs 308.1 mn in H1’2023 wholly attributable to a decrease in trade and other payables,
- The shareholder’s funds decreased by 0.6% to Kshs 6.98 mn from Kshs 7.02 bn in H1’2023, attributable to 6.9 bn in trust capital which recorded no change, and 57.2 mn in retained earnings which saw a 42.6% decline from 99.6 mn recorded in H1’2023, and,
- The REIT currently has a Return on Asset and a Return on Equity of 0.79% and 0.82% respectively.
For a more comprehensive analysis, please see our LapTrust Imara I-REIT FY’2023 Earnings Note.
On the Unquoted Securities Platform, Acorn D-REIT and I-REIT traded at Kshs 24.5 and Kshs 22.0 per unit, respectively, as of 17th May 2024. The performance represented a 22.5% and 10.0% gain for the D-REIT and I-REIT, respectively, from the Kshs 20.0 inception price. The volumes traded for the D-REIT and I-REIT came in at 12.3 mn and 30.7 mn shares, respectively, with a turnover of Kshs 257.5 mn and Kshs 633.8 mn, respectively, since inception in February 2021.REITs provide various benefits like tax exemptions, diversified portfolios, and stable long-term profits. However, the continuous deterioration in the performance of Kenyan REITs and the restructuring of their business portfolios is hampering major investments that had previously been made. The other general challenges include; i) inadequate comprehension of the investment instrument among investors, ii) prolonged approval processes for REIT creation, iii) high minimum capital requirements of Kshs 100.0 mn for trustees, and, iv) minimum investment amounts set at Kshs 5.0 mn, continue to limit the performance of the Kenyan REITs market.
We expect the performance of Kenya’s real estate sector to be supported by: i) increased investment activities by international investors driving growth in the industrial and retail sectors, ii) collaboration between Kenya and major economies promoting development in the infrastructure sector, iii) an increased number of international arrivals and Nairobi’s recognition as a major travel destination bolstering the hospitality sector, and iv) positive demographics driving housing demand in the country. However, factors such as rising construction costs, strain on infrastructure development like drainage systems, limited investor knowledge in REITs, and existing oversupply in select real estate sectors will continue to hinder the optimal performance of the sector by limiting developments and investments.
According to the Retirement Benefits Authority (RBA) Industry report for December 2023, assets under management for retirement benefits schemes increased by 9.4% to Kshs 1.7 tn in December 2023 from the Kshs 1.6 tn recorded in 2022. The growth of the assets can be attributed to the enhanced contributions to the mandatory scheme, NSSF, which began in earnest in February 2023 following the court of appeal ruling that set aside the initial ruling of the Employment and Labour Relations Court suspending implementation of the NSSF Act. The Act, which increased the contribution rates from Kshs 400 to 12.0% of an employee’s monthly earnings, with a 6% deduction from the employee and an equivalent 6% deduction from the employer, had been rendered unconstitutional by the lower court. Despite the continued growth, Kenya remains characterized by a low saving culture with research by the Federal Reserve Bank showing that only 14.2% of the adult population in the labor force save, including for their retirement in Retirement Benefits Schemes (RBSs), lower than Nigeria’s 26.3%, but higher than South Africa’s 13.6%. According to the World Bank, our gross savings to GDP stands at just 16.0%, indicating that more still needs to be done to boost the savings numbers. On a semi-annual basis, however, the assets grew by a paltry 1.3% to Kshs 1.73 tn in December from the Kshs 1.70 tn recorded in June 2023. This subdued growth of assets under management during the period is majorly attributed to negative movement in some asset classes such as quoted equities, listed corporate bonds, unquoted equities, and commercial papers. Quoted equities, for instance, recorded a 3.0% decline in Q4’2023.
Additionally, funds held by the National Social Security Fund increased by 4.3% to Kshs 308.3 bn in 2023 from the Kshs 295.7 bn held in 2022. Of these assets, NSSF managed Kshs 46.6 bn internally while Kshs 250.0 bn were managed externally by six fund managers.
On a separate note, according to the ACTSERV Q1’2024 Retirement Benefits Schemes Investments Performance Survey, segregated retirement benefits schemes recorded a 6.0% return in Q1’2024, up from the 0.8% recorded in Q1’2023. The increase was largely supported by the performance of equities investments made by the schemes which recorded a significant 25.6% gain, a reversal from the 7.2% decline recorded in 2022, on the back of positive investor sentiment following the successful Eurobond buyback, easing inflation and the shilling appreciation which gradually slowed down investor flight from the market.
Notably, The recently introduced Finance Bill of 2024 introduced a raft of changes to the retirement landscape in Kenya. With the bill currently in the public participation stage, here are some of the proposed changes in the pensions sector:
- Registration of Retirement Funds – Currently, individual retirement Funds and Pension Funds need to be registered with the Commissioner for the enjoyment of tax deductions of up to Kshs 20,000 monthly per individual. The bill proposes that this requirement of registration with the Commissioner be eliminated, and bring this under the purview of the Retirement Benefits Authority (RBA),
- Tax exemptions on withdrawals – The current law grants tax exemptions for withdrawal of pensions for individuals who are sixty-five years old or more. With the proposed change, Pension benefits from registered pension funds, provident funds, individual retirement funds, or National Social Security Fund are now exempted from income tax upon reaching retirement age. This exemption also applies if a person retires early due to ill health or withdraws from the fund after twenty years of membership. This expansion of the exemption to include early retirement seeks to cover for unfortunate occurrences that were earlier not provided for in law,
- Pension withdrawal period – Currently, the law provides for reduced tax rates if payments are made 15 years from the start of contributions into a registered retirement benefits scheme or upon retirement. The bill proposes an extension of this period from the current 15 years to 20 years. This is aimed at encouraging individuals to keep money saved for retirement invested longer, and reduce dependency on government upon retirement, and,
- Gratuity Paid to Pension funds – as it stands, the law currently exempts tax on amounts paid to pension funds for up to Kshs 20,000 monthly per individual. This finance bill proposes that the amount be increased to Kshs 30,000. This will offer further relief for individuals contributing to the pension schemes, although it is worth noting that this will majorly benefit high-income earners able to contribute up to Kshs 30,000 monthly to their retirement.
We have been tracking the performance of Kenya’s Pension schemes with the most recent topicals being, Kenya Retirement Benefits Schemes Q4’2023 Performance, Progress of Kenya’s Pension Schemes-2022 done on August 2022 and Kenya Retirement Benefits Schemes FY’2021 Performance done on March 2022. This week, we shall focus on understanding Retirement Benefits Schemes and look into the historical and current state of retirement benefits schemes in Kenya with a key focus on 2023 and what can be done going forward. We shall also analyze other asset classes such as REITs that the schemes can tap into to achieve higher returns. Additionally, we shall look into factors and challenges influencing the growth of the RBSs in Kenya as well as the actionable steps that can be taken to improve the pension industry. We shall do this by looking into the following:
- Introduction to Retirement Benefits Schemes in Kenya,
- Historical and Current State of Retirement Benefits Schemes in Kenya,
- Factors Influencing the Growth of Retirement Benefits Scheme in Kenya
- Challenges that Have Hindered the Growth of Retirement Benefit Schemes, and,
- Recommendations on Enhancing the Performance of Retirement Benefits Schemes in Kenya;
Section I: Introduction to Retirement Benefits Schemes in Kenya
A retirement benefits scheme refers to a savings platform allowing individuals to make regular contributions during their working years where the contributed funds are invested in order to generate returns. The various schemes allow members to make regular contributions during their working years and once a member retires either after attaining the retirement age or earlier due to other factors, mainly ill-health, these contributions plus accrued interest are utilized to provide retirement income to the member. Further, a retirement plan is essential in cushioning retirees from reduced income and ensures decent living after retirement thus reducing old-age dependency. According to the Retirement Benefits Authority (RBA), retirement schemes in Kenya are categorized based on contributions, mode of payment at retirement, membership, and mode of investment. The categories are explained as follows:
- Based on Contributions:
- Defined Benefits Schemes – Defined benefit plans are funded either exclusively by employer contributions or sometimes require employee contributions. The cost of the promises being earned each year is calculated in advance, to advise on the required amount that needs to be contributed each year to keep the scheme healthy, and,
- Defined Contribution Scheme – Here, member’s and employer’s contributions are fixed either as a percentage of pensionable earnings or as a shilling amount. However, members have the freedom to contribute more than the defined rate (Additional Voluntary Contribution). The scheme’s benefits are usually not known and the level of retirement income will depend on the level of contributions made over the period, fees by the service provider, investment returns, and the cost of buying benefits.
- Based on Mode of Payment at Retirement:
- Pension Scheme – At retirement, a member of a pension scheme may access up to a third of their contributions and contributions made on their behalf plus accrued interest as a lump sum, and then the remainder is used to purchase an annuity (pension) that pays a periodic income to the pensioner in their retirement years, usually monthly, and,
- Provident Fund – The scheme offers members payments of lump sums and other accrued benefits to employees upon retirement or to their dependents upon death.
- Type of Membership:
- Occupational Retirement Benefits Scheme - These are schemes that are set up by an employer where only members of their staff are eligible to join. The employees contribute to the scheme and automatically leave once their contract with the employer is over,
- Umbrella Retirement Benefits Scheme – Here, the retirement scheme pools the retirement contributions of multiple employers on behalf of their employees. It is a cost-effective scheme reducing the average cost per member and enhancing the overall returns of both the employer and the employees’ contributions, and,
- Individual Retirement Benefits Scheme – These are schemes run by independent financial institutions and individuals contribute directly towards saving for their retirement. The contributions are flexible to accommodate individuals with varying financial capabilities.
- Mode of Investment:
- Segregated Funds – Refers to schemes where contributions by members are invested directly by the Trustees through an appointed Fund Manager. Notably, the Trustees establish an appropriate Investment Policy which is then implemented by the Fund Manager. The scheme directly holds the investments and the returns are fully accrued to the scheme to earn interest for the members, and,
- Guaranteed Funds - These are funds offered by insurance companies where the members’ contributions are pooled together and the insurance company guarantees a minimum rate of return. However, should the actual return surpass the minimum guaranteed rate, the insurance company may either top up the minimum rate with a bonus rate of return or reserve the extra return.
One of the biggest reasons people should save for retirement is so that they can be able to afford the lifestyle they lead in their working days. Below are some of the reasons why an individual should join an appropriate Retirement Benefits Scheme:
- Compounded and Tax-free Interest – Savings in retirement benefits schemes earn compounded interest. This means that your money grows faster as even the interest earned is reinvested and grows. Additionally, the investment income of retirement schemes is tax-exempt meaning that the schemes have more to reinvest,
- Tax-exemptions on Contributions – Members of retirement benefits schemes enjoy monthly tax relief on their contributions of up to Kshs 20,000.0 per month, Kshs 240,000 per annum or 30.0% of their monthly salary, whichever is less. The proposed amendments,
- to the Finance Bill 2024 will revise the amount upwards to Kshs 30,000 per month. As such, this lessens the total income tax deducted from one’s earnings and ensures more capital preservation,
- Use of Pensions Benefit as Mortgage Security – When applying for a mortgage, one can use his savings in the various schemes as security. This is essential as it will enable individuals to own homes without the need to look for security,
- Financial Independence upon Retirement – Old age poverty and dependency is currently a scourge where most parents depend on their children and relatives for survival. According to the World Bank, Kenya’s age dependency ratio stands at 69.0%, indicating that the working population has to support most of the non-working population who are individuals below the age of 15 and people above 64 years. However, having a concrete retirement plan ensures that an individual remains financially independent upon retirement and avoids being a burden to relatives and other family members ensuring a dignified life,
- Ascertaining Income Security – Saving in a Retirement benefits schemes allow individuals to be financially secure by accessing funds in case of job loss, retirement, or contract termination as a result of ill-health. Savings will ascertain a continued income stream even if you stop working hence protecting you from being dependent and enabling you to live comfortably, and,
- Earn Returns – Saving for retirement through the Schemes give you an opportunity to be part of an investment portfolio that is structured to optimize investment returns and offer the members above-market average returns. A fund manager and a team of qualified personnel conduct the market research and make investment decisions so you don’t have to worry about it.
Section II: Historical and the Current State of Retirement Benefits Schemes in Kenya
- Growth of Retirement Benefits Schemes
According to the Retirement Benefits Authority (RBA) Industry report for December 2023, assets under management for retirement benefits schemes increased by 9.4% to Kshs 1.7 tn in December 2023 from the Kshs 1.6 tn recorded in 2022. The growth of the assets can be attributed to the enhanced contributions to the mandatory scheme, NSSF, which began in earnest in February 2023 following the court of appeal ruling. The growth of the assets can be attributed to the enhanced contributions to the mandatory scheme, NSSF, which began in earnest in February 2023 following the court of appeal ruling which has now since gone to the supreme court and been reverted back to the lower courts, awaiting determination.
The graph below shows the growth of Assets under Management of the retirement benefits schemes over the last 10 years:
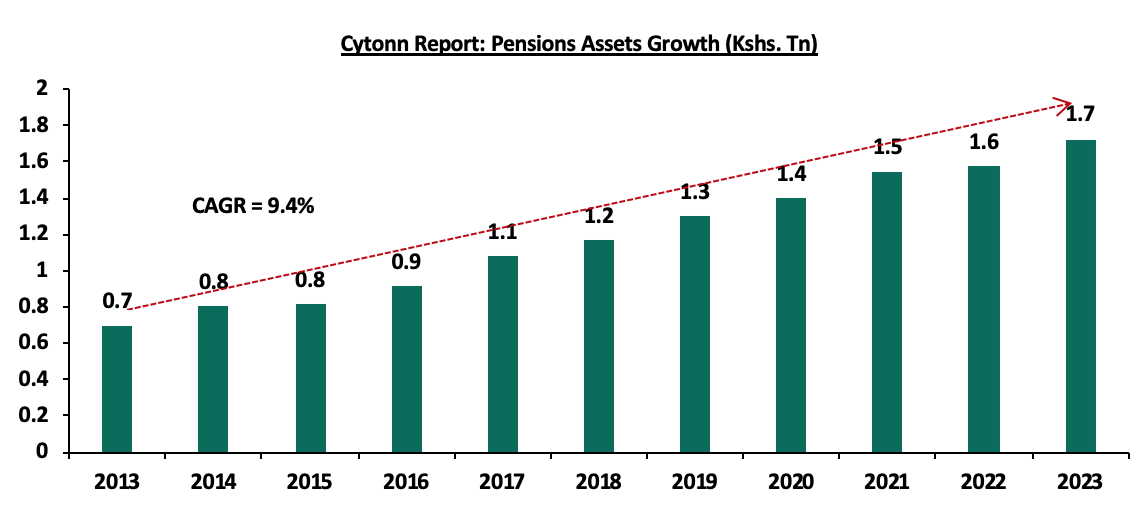
The 9.4% increase in Assets Under Management is a 7.5% increase in growth from the 1.9% growth that was recorded in 2022, demonstrating the significant role that the enhanced NSSF contributions made to the recovery of the industry’s performance following a difficult period in 2022.
The chart below shows the y/y changes in the assets under management for the schemes over the years.
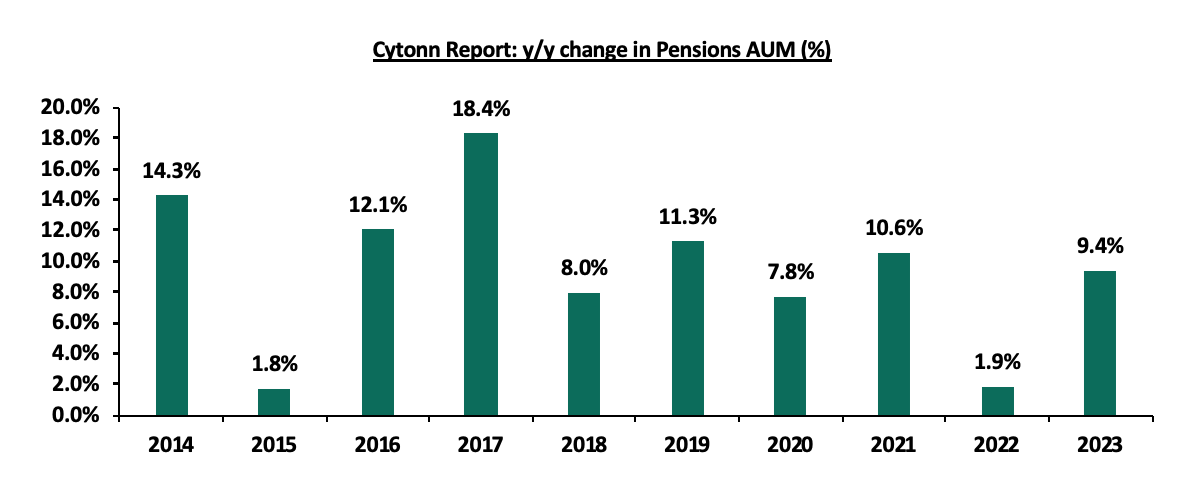
On a bi-annual basis, however, the assets grew by a paltry 1.3% to Kshs 1.73 tn in December from the Kshs 1.70 tn recorded in June 2023. This subdued growth of assets under management during the period is majorly attributed to negative movement in some asset classes such as quoted equities, listed corporate bonds, unquoted equities, and commercial papers. Quoted equities, for instance, recorded a 3.0% decline in Q4’2023. Despite the continued growth, Kenya is characterized by a low saving culture with research by the Federal Reserve Bank only 14.2% of the adult population in the labor force save for their retirement in Retirement Benefits Schemes (RBSs).
The graph below shows the Assets under Management of Pensions against other Capital Markets products and bank deposits:
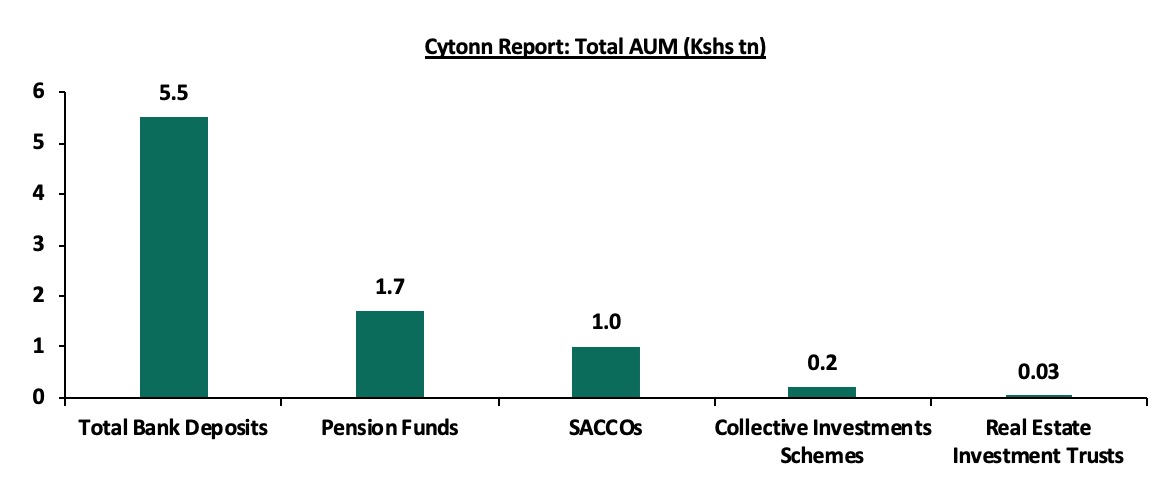
Sources: CMA, RBA, SASRA and REIT Financial Statements
- Retirement Benefits Schemes Allocations and Various Investment Opportunities
Retirement Benefits Schemes allocate funds to various available assets in the markets aimed at the preservation of the members’ contributions as well as earning attractive returns. There are various investment opportunities that Retirement Benefits Schemes can invest in such as the traditional asset classes including equities and fixed income as well as alternative investment options such as Real Estate. As such, the performance of Retirement Benefits Schemes in Kenya depends on a number of factors such as;
- Asset allocation,
- Selection of the best-performing security within a particular asset class,
- Size of the scheme,
- Risk appetite of members and investors, and,
- Investment horizon.
The Retirement Benefits (Forms and Fees) Regulations, 2000 offers investment guidelines for retirement benefit schemes in Kenya in terms of the asset classes to invest in and the limits of exposure to ensure good returns and that members’ funds are hedged against losses. According to RBA’s Regulations, the various schemes through their Trustees can formulate their own Investment Policy Statements (IPS) to Act as a guideline on how much to invest in the asset option and assist the trustees in monitoring and evaluating the performance of the Fund. However, IPSs often vary depending on risk-return profile and expectations mainly determined by factors such as the scheme’s demography and the economic outlook. The table below represents how the retirement benefits schemes have invested their funds in the past:
|
Cytonn Report: Kenyan Pension Funds’ Assets Allocation |
||||||||||||||
|
Asset Class |
2014 |
2015 |
2016 |
2017 |
2018 |
2019 |
2020 |
2021 |
2022 |
2023 |
Average |
Limit |
||
|
Government Securities |
31.0% |
29.8% |
38.3% |
36.5% |
39.4% |
42.0% |
44.7% |
45.7% |
45.8% |
47.5% |
40.5% |
90.0% |
||
|
Quoted Equities |
26.0% |
23.0% |
17.4% |
19.5% |
17.3% |
17.6% |
15.6% |
16.5% |
13.7% |
8.4% |
17.5% |
70.0% |
||
|
Immovable Property |
17.0% |
18.5% |
19.5% |
21.0% |
19.7% |
18.5% |
18.0% |
16.5% |
15.8% |
14.0% |
17.4% |
30.0% |
||
|
Guaranteed Funds |
11.0% |
12.2% |
14.2% |
13.2% |
14.4% |
15.5% |
16.5% |
16.8% |
18.9% |
20.8% |
15.4% |
100.0% |
||
|
Listed Corporate Bonds |
6.0% |
5.9% |
5.1% |
3.9% |
3.5% |
1.4% |
0.4% |
0.4% |
0.5% |
0.4% |
2.7% |
20.0% |
||
|
Fixed Deposits |
5.0% |
6.8% |
2.7% |
3.0% |
3.1% |
3.0% |
2.8% |
1.8% |
2.7% |
4.8% |
3.4% |
30.0% |
||
|
Offshore |
2.0% |
0.9% |
0.8% |
1.2% |
1.1% |
0.5% |
0.8% |
1.3% |
0.9% |
1.6% |
1.2% |
15.0% |
||
|
Cash |
1.0% |
1.4% |
1.4% |
1.2% |
1.1% |
1.2% |
0.9% |
0.6% |
1.1% |
1.5% |
1.2% |
5.0% |
||
|
Unquoted Equities |
0.0% |
0.4% |
0.4% |
0.4% |
0.3% |
0.3% |
0.2% |
0.2% |
0.3% |
0.2% |
0.4% |
5.0% |
||
|
Private Equity |
0.0% |
0.0% |
0.0% |
0.0% |
0.1% |
0.1% |
0.1% |
0.2% |
0.2% |
0.3% |
0.1% |
10.0% |
||
|
REITs |
0.0% |
0.0% |
0.1% |
0.1% |
0.1% |
0.0% |
0.0% |
0.0% |
0.0% |
0.6% |
0.1% |
30.0% |
||
|
Commercial Paper, non-listed bonds by private companies |
0.0% |
0.0% |
0.0% |
0.0% |
0.0% |
0.0% |
0.0% |
0.0% |
0.0% |
0.0% |
0.0% |
10.0% |
||
|
Others e.g. unlisted commercial papers |
0.0% |
0.0% |
0.0% |
0.0% |
0.0% |
0.0% |
0.0% |
0.1% |
0.2% |
- |
0.0% |
10.0% |
||
|
Total |
100.0% |
100.0% |
100.0% |
100.0% |
100.0% |
100.0% |
100.0% |
100.0% |
100.0% |
100.0% |
100.0% |
100.0% |
||
Source: Retirement Benefits Authority
Key Take-outs from the table above are;
- Schemes in Kenya allocated an average of 58.0% of their members’ funds towards government securities and Quoted Equities between the period of 2013 and 2023. The 40.5% average allocation to government securities is the highest among the asset classes attributable to safety assurances of members’ funds because of low-risk investments and the elevated yields in the country in 2023,
- The allocation towards quoted equities declined to 8.4% as of December 2023, from 13.7% in 2022 on the back of increased capital flight as foreign investors sold off their investments in the Kenyan equities market due to macroeconomic uncertainties in the country as well a series of interest rate hikes in the developed economies, and,
- Retirement Benefits Schemes investments in offshore markets increased by 0.7% points to 1.6% as of December 2023, from 0.9% in 2022 as a result of the weakening Kenyan currency which made offshore investments attractive to preserve the value of investments and take advantage of exchange rate gains.
The chart below shows the allocation by pension schemes on the three major asset classes over the years:
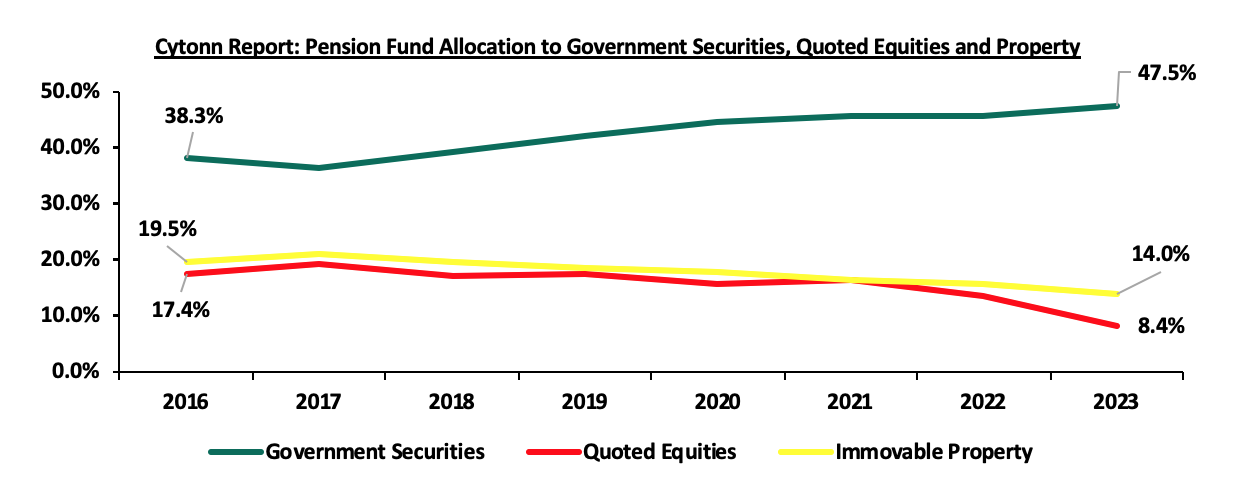
Source: RBA Industry report
Performance of the Retirement Benefit Schemes
According to the ACTSERV Q4’2023 Pension Schemes Investments Performance Survey, the ten-year average return for segregated schemes over the period 2015 to 2024 was 10.0% with the performance fluctuating over the years to a high of 18.7% in 2017 and a low of 1.4% in 2015 reflective of the markets performance. Notably, segregated retirement benefits scheme returns increased by 6.0% return in Q1’2024, up from the 0.8% recorded in Q1’2023.
The chart below shows the quarterly performance of segregated pension schemes since 2021:
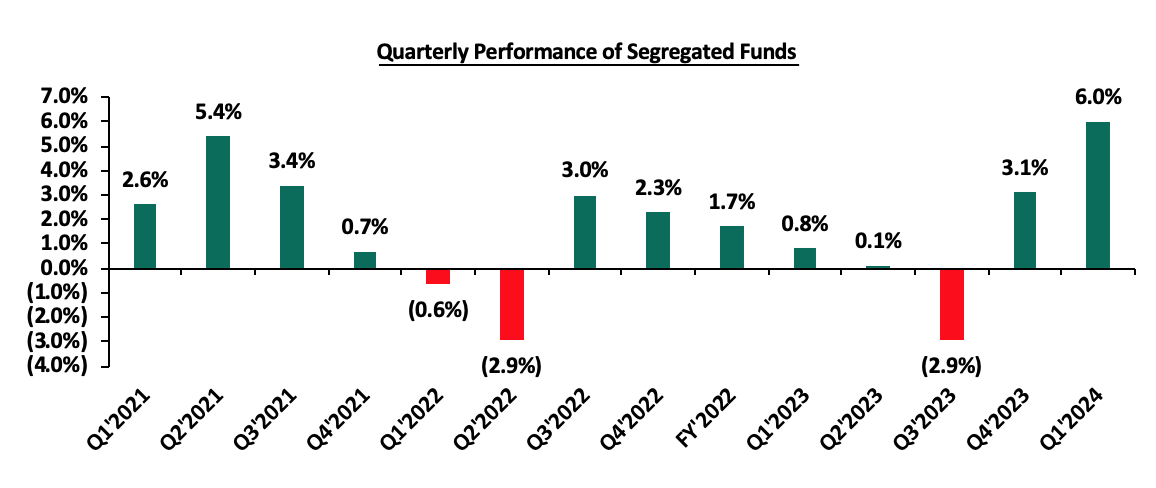
Source: ACTSERV Survey Reports (Segregated Schemes)
The key take-outs from the graph include:
- Schemes recorded a 6.0% gain in Q1’2024, representing a 2.9% increase from the 3.1% gain recorded in Q4’2023. The performance was largely driven by a 25.6% gain in Equities investments in comparison to the 3.0% decline recorded in Q4’2023, largely attributable to positive investor sentiment following the successful Eurobond buyback, easing inflation and the shilling appreciation which gradually slowed down investor flight from the market. This was despite the 1.1% decrease in fixed income returns to 2.9% from 2.9 recorded in Q4’2023. The performance was, however, weighed down by the 9.2% decline in offshore investments, and,
- Overall returns for Q4’2023 increased by 5.2% points to 6.0%, from 0.8% in Q1’2023 largely due to a 25.6% gain in Equities investments in comparison to the 7.2% decline recorded in Q1’2023.
The survey covered the performance of asset classes in three broad categories: Fixed Income, Equity, Offshore, and Overall Return.
Below is a graph showing the first quarter performances over the period 2020-2024:
|
Cytonn Report: Quarterly Performance of Asset Classes (2020 – 2024) |
||||||
|
|
Q1'2020 |
Q1'2021 |
Q1'2022 |
Q1'2023 |
Q1'2024 |
Average |
|
Fixed Income |
2.6% |
1.6% |
1.1% |
2.6% |
2.9% |
2.2% |
|
Equity |
(23.9%) |
5.6% |
(4.8%) |
(7.2%) |
25.6% |
(0.9%) |
|
Offshore |
(14.9%) |
0.3% |
(8.7%) |
16.0% |
(9.2%) |
(3.3%) |
|
Overall Return |
(4.4%) |
2.6% |
(0.6%) |
0.8% |
6.0% |
0.9% |
Source: ACTSERV Surveys
Key take-outs from the table above include;
- Returns from Equity investments recorded a significant increase by 32.8% points to a 25.6% gain in Q1’2024, from the 7.2% decline recorded in Q1’2023. The performance was partly attributable to positive investor sentiment following the successful Eurobond buyback, easing inflation and the shilling appreciation which gradually slowed down investor flight from the market. The performance of the equities markets was further evidenced in the Kenyan equities market which was on an upward trajectory, with NSE 10 gaining the most by 27.3%, while NSE 25, NASI, and NSE 20 gained by 25.0%, 22.8%, and 16.7% respectively. Notably, the allocation towards the asset class had declined to 8.4% in 2023, from 17.3% in 2019 as a result of the sustained poor performance and uncertainty in the bourse, which is now on a recovery path,
- Returns from Fixed Income recorded an increase of 0.3% points to 2.9% in Q1’2024 from the 2.6% recorded in Q1’2023. This performance in Q4’2023 is partially attributable to increased yields as a result of elevated inflationary pressures and aggressive government borrowing. The Central Bank, during the quarter, increased the base lending rate by 0.5% points to 13.0%, which caused a ripple effect on the interest rates. The yields on all the treasury bills, for instance, were on an upward trajectory with the average yields on the 364-day, 182-day, and 91-day papers increasing by 119.4 bps, 118.3 bps, and 114.0 bps to 16.7%, 16.6%, and 16.4%, from 15.5%, 15.4% and 15.3%, respectively, recorded in Q4’2023. Fixed income has continued to offer stable returns with little volatility over the years, recording the highest return in Q4’2023, and,
- Returns from the Offshore investments recorded a sharp decline of 25.2% in Q1’2024, to a 9.2% decline from the 16.0% return recorded in Q1’2023. The performance was partly attributable to sustained high interest rates as policymakers prioritize inflation control, pushing back anticipated rate cuts to the second half of the year, appreciation of the currency, and rising geopolitical tensions, with the instability in Ukraine and Israel. In Q1’2024, the Kenya Shilling gained against the US Dollar by 16.0%, to close at Kshs 131.8, from Kshs 157.0 recorded at the start of the quarter. This appreciation led to a decrease in returns on offshore investments denominated in foreign currencies.
Other Asset Classes that Retirement Benefit Schemes Can Leverage on
Retirement benefits schemes have for a long time skewed their investments towards traditional assets, mostly, government securities and the equities market, averaging 58.0% as of 2023, leaving only 42.0% for the other asset classes. In the asset allocation, alternative investments that include immovable property, private equity as well as Real Estate Investments Trusts (REITs) account for an average of only 15.4% against the total allowable limit of 70.0%. This is despite the fact that these asset classes such as REITs offer benefits such as low-cost exposure to Real Estate and tax incentives hence the potential for better returns. It is vital to note, however, that FY’2023 recorded one of the most significant increase in investments in Real Estate Investment Trusts by 3,871.4% to 11.1 bn from 0.3 bn recorded in FY’2022. This is partly attributable to the unveiling of the Local Authorities Pension Trust (LAPTRUST) during the year, as the first pension-driven REIT listed in the Nairobi Securities Exchange (NSE). Additionally, allocation to Private Equity increased by 61.2% to Kshs 5.7 bn from Kshs 3.6 bn in FY’2023.
The graph below shows the y/y change in allocation to the various asset classes;
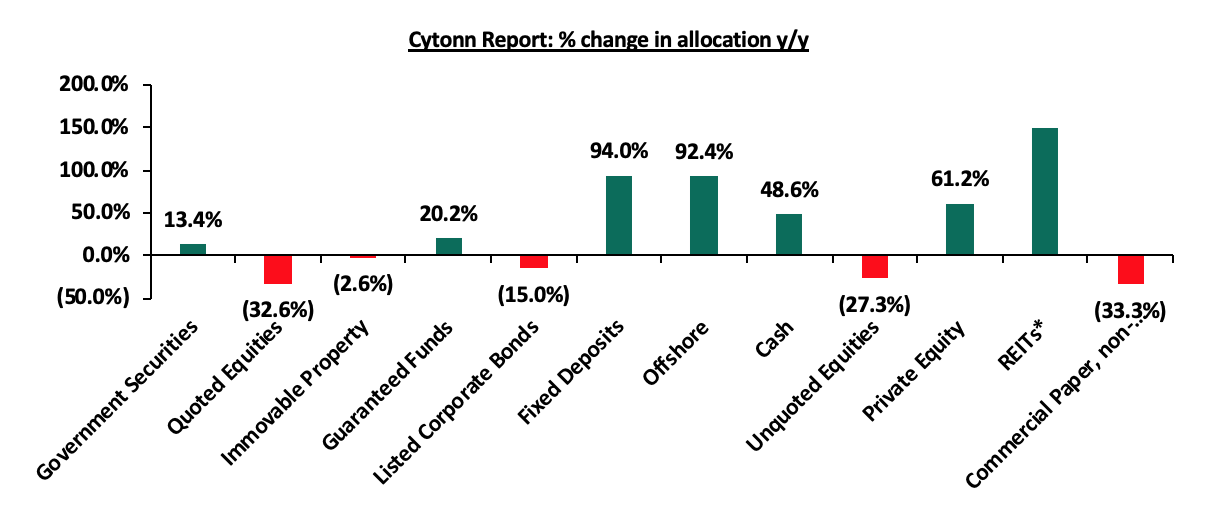
Source: RBA Industry Report
However, in terms of overall asset allocation, alternative investments still lagged way behind the other asset classes, as has been the norm over the years as demonstrated in the graph below;
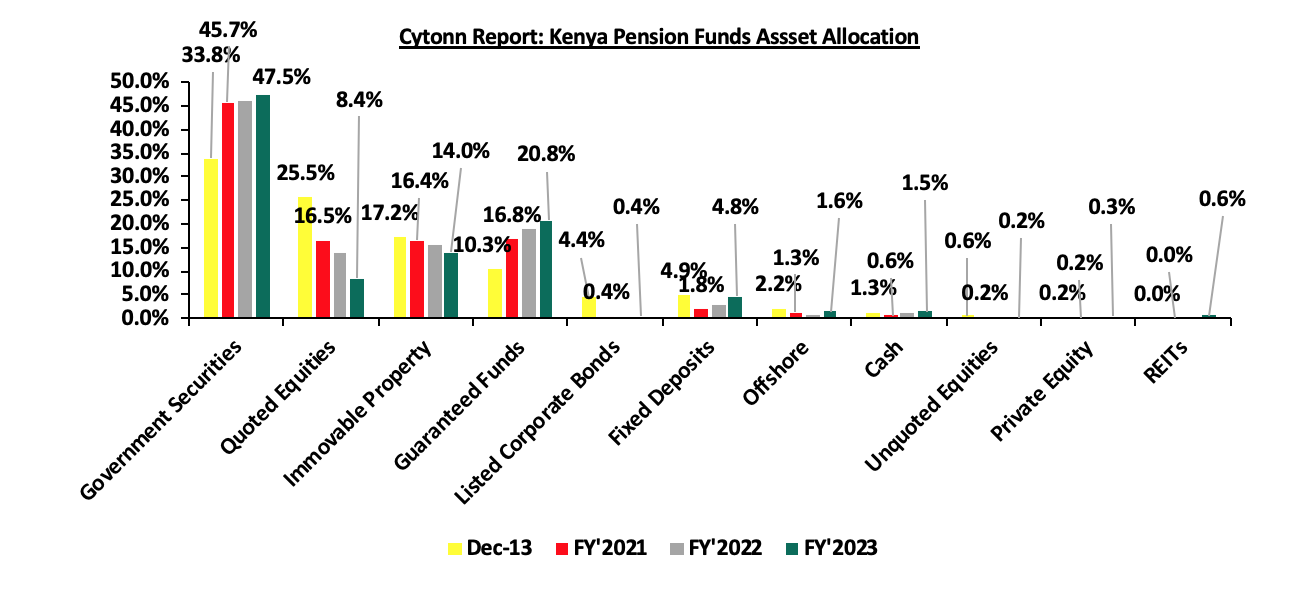
Source: RBA Industry report
We believe Alternative Investments including REITs would play a big role in improving the performance of retirement benefits schemes;
- Alternative Investments (Immovable Property, Private Equity and REITs)
Refers to investments that are supplemental strategies to traditional long-only positions in equities, bonds, and cash. They differ from traditional investments on the basis of complexity, liquidity, and regulations and can invest in immovable property, private equity, and Real Estate Investment Trusts (REITs) to a limit of 70.0% exposure. The schemes’ allocation to alternative investments has averaged only 6.1% in the period 2014 to 2023, with the allocation to immovable property at an average of 17.8% during the period. The low allocation is partly attributable to bureaucracies and insufficient expertise and experience with these asset classes as investing in them requires adequate research and expertise.
According to RBA regulations, schemes can invest up to 70.0% of their assets in private equity, immovable property, and REITs. However, the allocation between 2013 and 2021 has averaged 13.9%, with Q1’2024 allocation coming in at 15.4%.
Additionally, asset classes such as listed REITs have experienced numerous challenges and performed poorly over time. It is vital to note, however, that FY’2023 recorded one of the most significant increase in investments in Real Estate Investment Trusts by 3,871.4% to 11.1 bn from 0.3 bn recorded in FY’2022. This follows the unveiling of the Local Authorities Pension Trust (LAPTRUST) during the year, as the first pension-driven REIT listed in the Nairobi Securities Exchange (NSE). Despite the growth in allocation, Kshs 11.0 bn is still a drop in the ocean compared to the assets under management. We believe that there is value in the alternative markets that schemes can take advantage of. Some of the key advantages of alternatives investments include:
- Diversification: Investing in a variety of asset classes such as REITs, fixed income securities and equities helps to reduce risk when incorporated into a single investment, as it spreads the investments across diverse locations, sectors, platforms, and classes. REIT institutions typically own physical assets such as land and buildings, and frequently enter into lengthy leases with their tenants. This makes REITs some of the most dependable investments on the market. This diversification creates the opportunity for a blended portfolio to earn higher returns while reducing the potential for negative or low returns, and,
- Competitive Long-Term Returns: REITs provide robust and long-term yields. This makes them an ideal component of a successful and efficient portfolio.
Section III: Factors Influencing the Growth of Retirement Benefit Schemes
The retirement benefit scheme industry in Kenya has registered significant growth in the past 10 years with assets under management growing at a CAGR of 9.4% to Kshs 1.7 tn in FY’2023, from Kshs 0.7 tn in 2013. The growth is attributable to:
- Increased Pension Awareness – More people are becoming increasingly aware of the importance of pension schemes and as such, they are joining schemes to grow their retirement pot which they will use during their golden years. Over the last 20 years, pension coverage has grown from 12.0% to about 25.0% of the labour force. This growth reflects industry-wide initiatives to increase awareness among Kenyan citizens on the need for retirement planning and innovations,
- Legislation – As earlier discussed, the Finance Bill 2024, is the latest proposed piece of legislation that will affect the pension industry. It adds to the Retirement Benefits (Good Governance Practices) Guidelines, 2018 and Retirement Benefits (Treating Customers Fairly) Guidelines, 2019 which aim to ensure that pension schemes are well anchored on practices that ensure effective and efficient service delivery of the pension schemes. This has raised standards in the way retirement schemes conduct their day-to-day businesses and increased confidence in the pension industry. Additionally, the implementation of the National Social Security Fund Act, 2013 is entering its second year and is expected to foster the growth of the pension industry by allowing both the employees in the formal and informal sector to save towards their retirement, as opposed to the previous NSSF Act cap 258 of 1965, which was only targeting the employees in the formal sector,
- Public-Private partnerships - Public-private partnerships can be instrumental in expanding financial inclusion in the Kenyan pension sector. Collaborations between the government and private financial institutions can lead to the development and promotion of inclusive pension products. In Kenya, the National Social Security Fund (NSSF) is currently licensing and partnering with the private sector (Pension Fund Managers) to invest and manage NSSF Tier II contributions. This is a good example that the government is giving employees, employers, and persons in the informal sector to invest and save for their retirement in the private sector,
- Tax Incentives - Members of Retirement Benefit Schemes are entitled to a maximum tax-free contribution of Kshs 20,000 monthly or 30.0% of their monthly salary, whichever is less. Consequently, pension scheme members enjoy a reduction in their taxable income and pay less taxes. This incentive has motivated more people to not only register but also increase their regular contributions to pension schemes,
- Micro-pension schemes - Micro-pension schemes are tailored to address the needs of Kenyans in the informal sector with irregular earnings. These schemes allow people to make small, flexible contributions towards their retirement. By accommodating their financial realities, micro-pensions can attract a broader segment of the population into the pension sector. Examples of these pension schemes are Mbao Pension Plan and Individual Pension Schemese. Britam Individual Pension Plan where one can start saving voluntarily and any amount towards their retirement.
- Relevant Product Development – Pension schemes are not only targeting people in formal employment but also those in informal employment through individual pension schemes, with the main aim of improving pension coverage in Kenya. To achieve this, most Individual schemes have come up with flexible plans that fit various individuals in terms of affordability and convenience. Additionally, the National Social Security Fund Act, 2013 contains a provision for self-employed members to register as members of the fund, with the minimum aggregate contribution in a year being Kshs 4,800 with the flexibility of making the contribution by paying directly to their designated offices or through mobile money or any other electronics transfers specified by the board,
- Demographics - Kenya’s rising population has played a big role in supporting the pensions industry in Kenya. The young population aged 15-24, currently at a population of 10.4 mn approximately 19.6% of the total population, has grown rapidly with the United Nations projecting that the corresponding population of youth in Kenya aged 15-24 years and ready to join the workforce will increase to 18.0 mn, from 9.5 mn over the period 2015 to 2065. This will support the continuous increase in people joining the workforce and saving for retirement. Which will consequently increase scheme membership significantly,
- Technological Advancement – The adoption of technology into pension schemes has improved the efficiency and management of pension schemes. Additionally, the improvement of mobile penetration rate and internet connectivity has enabled members to make contributions and track their benefits from the convenience of their mobile phones, and,
- Financial literacy programs - Financial literacy programs play a vital role in promoting the growth of retirement benefit schemes by enhancing financial inclusion among the public. Educating the public about the benefits of retirement savings and how to navigate pension schemes can empower individuals to take control of their financial future. The Retirement Benefits Authority (RBA) is at the forefront of ensuring the public is educated on financial literacy by organizing free training.
Section IV: Challenges that Have Hindered the Growth of Retirement Benefit Schemes
Despite the growth of the Retirement Benefit industry, the industry still faces a number of challenges that impede its growth. Some of the factors that hinder growth include:
- Market Volatility – For segregated schemes, the investment returns are not guaranteed and vary depending on the market volatility. In 2023, market volatility was witnessed in the in the equities investments which recorded a decline of 3.0% in Q4’2023, and a subsequent 25.6% return in Q1’2024,
- High Unemployment Rate – According to the Kenya National Bureau of Statistics Q4’2022 labour report, 6% of Kenya’s 29.1 mn working-age population aged between 15-64 years was unemployed. Such a status makes it extremely difficult for them to commit to pension contributions towards their retirement,
- Access of Savings before Retirement - In retirement benefit schemes, members of Individual pension schemes can be able to access 100.0% of their contributions, provided that those contributions do not consist of the contributions made by a former employer when transferring into the scheme. As for umbrella and occupation schemes, employees can only access 50.0% of their total benefits. This gives employees access to their savings before actually retiring because of losing a job or leaving a particular employer. However, such actions can always prove to be short-sighted since they significantly deplete the value of savings upon retirement and will reduce the growth of the sector,
- Low Pension Coverage in the Informal Sector – The informal sector constitutes an important part of the Kenyan economy. It is often characterized by irregular income and lack of job security. According to the Retirement Benefit Statistical Digest 2021, there are 266,764 members registered in the individual pension schemes. This is significantly low considering that according to the Kenya National Bureau of Statistics Economic Survey Report 2022, there are 15.2 mn people engaged in the informal sector translating to 83.2% of the total working population. These individuals may prioritize immediate financial needs over long-term retirement planning. Traditional pension schemes may not cater to their unique financial circumstances.
- Unremitted Contributions – Umbrella schemes and occupational schemes have over the years grappled with the issue of unremitted contributions from employers due to financial challenges and this has led to some pension schemes being underfunded. Consequently, according to the Retirement Benefit Statistical Digest 2021, this has resulted in the total unremitted contributions increasing to Kshs 42.8 bn in 2021, from Kshs 34.7 bn in 2020, and,
- Delayed Processing and Payment of Benefits - Payments of members’ benefits undergo a number of processes. From the determination of total accrued benefits by the pension scheme administrator to approval of payment by the Trustees of pensions schemes and in the case of Occupational or umbrella schemes, the employer has to give approval, before the benefits finally reach the members. Delays may occur as the benefits files move from one service provider to there. This is quite disadvantageous, especially for those members who have reached the age of retirement. These delays, consequently, discourage those not in pension schemes from joining.
Section V: Recommendations on Enhancing the growth and penetration of Retirement Benefit Schemes in Kenya
Employment serves as the bedrock of the retirement savings landscape, providing the primary means through which individuals accumulate the necessary funds for their post-working years. Employers have a significant impact on employees' capacity to achieve a secure retirement. Their role encompasses the offering of retirement benefits, creating a welcoming environment for workers of all ages, fostering work-life balance, and adapting business practices to support transitions to retirement. Employers also provide valuable non-retirement benefits that can help their employees protect their health, income, and savings. As such, we shall discuss and give recommendations to both employers and employees on how to improve their retirement prospects and increase the likelihood of sufficient income during retirement years by investing in the appropriate scheme;
Recommendations for Employer:
- Offer a Retirement Plan or join an Umbrella Retirement Plan – Firms can offer retirement plans to their employees to encourage them to save for their retirement. However, if the employer has no occupational retirement scheme for the employees or does not have the capacity to start one, they can join an Umbrella Pension Schemes which reduces the average cost per member and provides an avenue to save for retirement,
- Increase efforts to reduce the number of withdrawals in the retirement plan- Employers should create awareness among employees about the ramifications of undertaking premature withdrawals from retirement accounts. Employees should understand and come up with ways of dealing with non-routine and emergency expenses, which will offer employees alternative ways as opposed to withdrawing the retirement benefits,
- Help pre-retirees plan their transition into retirement – Employers can help pre-retirees by educating them about retirement income strategies to efficiently manage savings and retirement plan distribution options,
- Allow part-time employees to join retirement schemes – Firms should encourage part-time employees to join retirement schemes by extending retirement plan eligibility to such groups, and the necessity of backup plan if forced into early retirement,
- Expected returns – Employers should select providers whose return rate is high enough to ensure a sizeable growth for retirement savings. The appropriate rate of return should always be higher than the inflation rate to ensure a positive real return by not losing value over time, and,
- Extra benefits – Employers should recommend to workers schemes that will offer extra benefits in terms of insurance covers and health care benefits. Such complimentary benefits would improve the quality of a retirement plan.
Recommendations for Employees:
- Creating a budget – Employees should have a budget to guide them on how to spend on expenses and maintain income to save for retirement in a suitable scheme,
- Have a backup plan – Employees should have backup plans in case of job loss or early retirement arising from accidents or ill health,
- Affordability and flexibility – As an employee, it is essential to select a retirement plan that will not strain you in terms of contributions. Additionally, you should look into the flexibility of the plan in terms of changing the contribution amount and measures, if any, should you miss a contribution,
- Understand the various options available – It is prudent to understand how your money will be treated, its accessibility, and the mode of payment at the time of retirement to ensure that its features align with your objectives. Schemes have different provisions on whether you can use your savings to secure mortgage facilities or even buy a residential house, and,
- Select a manager you trust – Retirement benefits plan is a long-term affair and the only way to feel secure about your contributions is by selecting a manager you trust. Key to note, a trustworthy manager should have good governance structures and management experience.
Even as we commend the government for its role in legislation and regulation that has led to growth in the industry, we believe that the current pension system still leaves many pockets of society uncovered or with insufficient funds for retirement. We note that more people continue to use banks as a savings channel, as evidenced by the increasing bank deposits at Kshs 5.5 tn compared to the Kshs 1.7 tn pension assets under management as of December 2023. As such, the pensions uptake remains low in the country putting more people at risk of old age poverty. Going forward, we expect the growth trend to continue in the coming years as the economy continues to recover and more people understand the importance of saving for retirement. We hope the recommendations for the industry in the Finance Bill will be adopted, and they will signal a continued government interest in driving pension savings penetration in the country forward.
Disclaimer: The views expressed in this publication are those of the writers where particulars are not warranted. This publication, which is in compliance with Section 2 of the Capital Markets Authority Act Cap 485A, is meant for general information only and is not a warranty, representation, advice, or solicitation of any nature. Readers are advised in all circumstances to seek the advice of a registered investment advisor.

- Talk to us
- Kenya
- P.O Box 20695 - 00200, Nairobi, Kenya
- Cell +254709101200
- Tel +254709101200
- WhatsApp +254741676635
- United States
- +254709101200
- DOWNLOAD OUR APP
-


- Kenya
- 8th Floor, Pinetree Plaza, Kaburu Drive, Ngong Road, Nairobi, Kenya
- USA
- Suite 1150, 1775 Eye Street NW, USA, Washington DC 20006, USA
- Investments
- High Yield
- Private Equity
- Real Estate
- Real Estate
- RiverRun Estates
- Cytonn Towers
- The Ridge
- Taraji Heights
- The Alma