Proposed Crowdfunding Regulations in Kenya, & Cytonn Weekly #32/2021
By Research Team, Aug 15, 2021
Executive Summary
Fixed Income
During the week, T-bills were significantly undersubscribed, with the overall subscription rate coming in at 29.3%, a decrease from the 99.8% recorded the previous week attributable to the concurrent primary bonds issue. The 91-day paper recorded the highest subscription rate, receiving bids worth Kshs 2.8 bn against the offered Kshs 4.0 bn, translating to a subscription rate of 70.3%, a decline from the 152.3% recorded the previous week. Investors’ continued interest in the 91-day paper during the week is mainly attributable to the paper’s higher return on a risk adjusted basis. The subscription rate for the 182-day paper declined to 31.3%, from 150.2% recorded the previous week, while the subscription rate for the 364-day paper also declined to 10.9%, from 28.3% recorded the previous week. The yields on the 91-day and 182-day papers increased by 1.4 bps and 7.1 bps to 6.5% and 7.1%, respectively, while the yield on the 364-day paper remained unchanged at 7.4%. In the Primary Bond Market, there was an oversubscription for this month’s bond offers, FXD3/2019/10, FXD1/2018/20 and FXD1/2021/20, with the overall subscription rate coming in at 174.4% with bids worth Kshs 104.6 bn being received compared to Kshs 60.0 bn on offer. The high subscription rate can be attributed to both the high liquidity in the money market as well as the investors seeking to lock in higher yields in long-term bonds.
During the week, the Energy and Petroleum Regulatory Authority (EPRA) released their monthly statement on the maximum wholesale and retail prices for fuel prices in Kenya effective 15th August 2021 to 14th September 2021 highlighting that the price of Super Petrol, Diesel and Kerosene remained unchanged at Kshs 127.1 per litre, Kshs 107.7 per litre, and Kshs 97.9 per litre, respectively
Equities
During the week, the equities market recorded a mixed performance, with NASI and NSE 25 gaining by 1.5% and 0.8%, respectively, while NSE 20 declined by 0.7%, taking their YTD performance to gains of 19.2%, 15.8% and 4.7% for NASI, NSE 25 and NSE 20, respectively. The equities market performance was mainly driven by gains recorded by stocks such as Safaricom, Equity Group, Co-operative Bank and KCB Group, which gained by 2.1%, 2.0%, 1.1% and 0.9%, respectively. The gains were however weighed down by losses recorded by stocks such as NCBA and Diamond Trust Bank (DTB-K) which declined by 3.1% and 1.9%, respectively. During the week, Stanbic Holdings released their H1’2021 financial results, highlighting a 37.2% increase in their Core earnings per share to Kshs 8.9, from Kshs 6.5 in H1’2020;
Real Estate
During the week, Knight Frank Kenya, a real estate consultancy firm, released their Kenya Market Update H1’2021 report highlighting that the average selling prices for prime residential buildings realized a 0.1% y/y marginal improvement, whereas the commercial office and retail sectors recorded rental rate declines of 1.8% and 4.8%, respectively, from Kshs 457.4 per SQFT and Kshs 122.0 per SQFT recorded in FY’2020 to Kshs 435.6 per SQFT and Kshs 119.8 per SQFT, respectively, in H1’2021. In the residential sector, Centum Real Estate through its subsidiary Vipingo Development Limited (VDL) announced the completion of its 10-acre Palm Ridge Estate phase one project worth Kshs 1.5 bn in Kilifi County. The National Housing Corporation (NHC), a state owned firm, announced plans to build 2,000 affordable housing units in various parts of Kiambu County, in addition to also signing a land lease agreement with Konza City that will see the firm develop 5,000 units beginning November 2021. In the hospitality sector, the United States of America (USA), raised Kenya’s travel advisory alert from level two to level three, amidst concerns of the increasing Covid 19-Delta variant;
Focus of the Week
The Cabinet Secretary for the National Treasury and Planning, through the Capital Markets Authority (CMA), recently published the Draft Capital Markets Investment Based Crowdfunding Regulations, 2021. The proposed rules seek to regulate the raising of funds through online platforms by licensing and approving all persons who operate or intend to operate an investment-based crowdfunding platform. Investors invest through crowdfunding since it allows them to invest small amount of funds, share risks and diversify their investments into multiple campaigns and companies while issuers are able to access larger pools of accredited investors faster and at a lower transaction cost;
Investment Updates:
- Weekly Rates:
- Cytonn Money Market Fund closed the week at a yield of 10.45%. To invest, just dial *809#;
- Cytonn High Yield Fund closed the week at a yield of 15.51% p.a. To invest, email us at sales@cytonn.com and to withdraw the interest you just dial *809#;
- We continue to offer Wealth Management Training daily, from 9:00 am to 11:00 am, through our Cytonn Foundation. The training aims to grow financial literacy among the general public. To register for any of our Wealth Management Trainings, click here;
- If interested in our Private Wealth Management Training for your employees or investment group, please get in touch with us through wmt@cytonn.com;
- Cytonn Insurance Agency acts as an intermediary for those looking to secure their assets and loved ones’ future through insurance namely; Motor, Medical, Life, Property, WIBA, Credit and Fire and Burglary insurance covers. For assistance, get in touch with us through insuranceagency@cytonn.com;
- Cytonnaire Savings and Credit Co-operative Society Limited (SACCO) provides a savings and investments avenue to help you in your financial planning journey. To enjoy competitive investment returns, kindly get in touch with us through clientservices@cytonn.com;
Real Estate Updates:
- For an exclusive tour of Cytonn’s real estate developments, visit: Sharp Investor's Tour, and for more information, email us at sales@cytonn.com;
- Phase 3 of The Alma is now ready for occupation. To rent please email properties@cytonn.com;
- We have 8 investment-ready projects, offering attractive development and buyer targeted returns. See further details here: Summary of Investment-ready Projects;
- For recent news about the group, see our news section here.
Hospitality Updates:
- We currently have promotions for Staycations, visit cysuites.com/offers for details or email us at sales@cysuites.com;
- Share a meal with a friend during the Sunday Brunch at The Hive Restaurant at Cysuites Hotel and Apartment. Every Sunday from 11.00 AM to 4.00 PM at a price of Kshs 2,500 for Adults and Kshs 1,500 for children under 12 years;
Money Markets, T-Bills & T-Bonds Primary Auction:
During the week, T-bills remained undersubscribed, with the overall subscription rate coming in at 29.3%, a decrease from the 99.8% recorded the previous week attributable to the concurrent primary bonds issue. The 91-day paper recorded the highest subscription rate, receiving bids worth Kshs 2.8 bn against the offered Kshs 4.0 bn, translating to a subscription rate of 70.3%, a decline from the 152.3% recorded the previous week. Investors’ continued interest in the 91-day paper during the week is mainly attributable to the paper’s higher return on a risk adjusted basis. The subscription rate for the 182-day paper declined to 31.3%, from 150.2% recorded the previous week, while the subscription rate for the 364-day paper also declined to 10.9%, from 28.3% recorded the previous week. The yields on the 91-day and 182-day papers increased by 1.4 bps and 7.1 bps to 6.5% and 7.1%, respectively, while the yield on the 364-day paper remained unchanged at 7.4%. The government continued to take advantage of the low yields and the high liquidity in the market by accepting Kshs 7.01 bn out of the Kshs 7.04 bn worth of bids received, translating to an acceptance rate of 99.6%.
In the Primary Bond Market, the three bonds offered by the government for the month of August recorded an oversubscription of 174.4% attributable to the high liquidity in the market and the demand by investors for higher yields which are only in the longer dated bonds. The government sought to raise Kshs 60.0 bn and accepted Kshs 80.3 bn out of the Kshs 104.6 bn worth of bids received, translating to an acceptance rate of 76.7%. Investors preferred the longer dated paper, FXD1/2021/20 which received bids worth Kshs 43.5 bn, FXD3/2019/10 received bids worth Kshs 38.3 bn while FXD1/2018/20 received bids worth Kshs 22.8 bn. The coupons for the bonds were 11.5%, 13.2% and 13.4%, and the weighted average yield rates during the issues were 12.3%, 13.3% and 13.5% for FXD3/2019/10, FXD1/2018/20 and FXD1/2021/20, respectively.

In the money markets, 3-month bank placements ended the week at 7.7% (based on what we have been offered by various banks), while the yield on the 91-day T-bill increased by 1.4 bps to 6.5%. The average yield of the Top 5 Money Market Funds declined marginally by 0.1% points to 9.8%, from the 9.9% recorded the previous week. The yield on the Cytonn Money Market Fund declined by 0.2% points to 10.5%, from 10.7% recorded last week.
The table below shows the Money Market Fund Yields for Kenyan Fund Managers as published on 13th August 2021:
|
Money Market Fund Yield for Fund Managers as published on 13th August 2021 |
|||
|
Rank |
Fund Manager |
Daily Yield |
Effective Annual Rate |
|
1 |
Cytonn Money Market Fund |
9.94% |
10.45% |
|
2 |
Nabo Africa Money Market Fund |
9.52% |
9.95% |
|
3 |
Zimele Money Market Fund |
9.56% |
9.91% |
|
4 |
Madison Money Market Fund |
8.96% |
9.38% |
|
5 |
CIC Money Market Fund |
8.80% |
9.20% |
|
6 |
Sanlam Money Market Fund |
8.73% |
9.04% |
|
7 |
Co-op Money Market Fund |
8.34% |
8.70% |
|
8 |
GenCap Hela Imara Money Market Fund |
8.33% |
8.65% |
|
9 |
Dry Associates Money Market Fund |
8.26% |
8.61% |
|
10 |
Orient Kasha Money Market Fund |
8.28% |
8.60% |
|
11 |
British-American Money Market Fund |
8.20% |
8.51% |
|
12 |
ICEA Lion Money Market Fund |
8.02% |
8.32% |
|
13 |
NCBA Money Market Fund |
7.99% |
8.31% |
|
14 |
Apollo Money Market Fund |
8.40% |
8.27% |
|
15 |
Old Mutual Money Market Fund |
6.99% |
7.22% |
|
16 |
AA Kenya Shillings Fund |
6.57% |
6.77% |
Liquidity:
During the week, liquidity in the money markets eased further, with the average interbank rate declining by 0.5% points to 2.8% from 3.2% recorded the previous week, partly attributable to government payments, including term auction deposits maturities of Kshs 74.5 bn which offset the settlements of government securities and tax remittances. The average interbank volumes increased by 31.7% to Kshs 13.1 bn, from Kshs 9.9 bn recorded the previous week.
Kenya Eurobonds:
During the week, the yields on Eurobonds remained relatively unchanged, with the yields on the 10-year bond issued in 2018, 30-year bond issued in 2018, 7-year bond issued in 2019, and, 12-year bond issued in 2019 remaining unchanged at 5.3%, 7.3%, 4.8%, and 6.2%, respectively, similar to what was recorded the previous week. On the other hand, the yields on the 10-year bond issued in 2014 and 12-year bond issued in 2021 both declined by 0.1% points to 3.1% and 6.1%, respectively. Below is a summary of the performance:
|
Kenya Eurobond Performance |
||||||
|
|
2014 |
2018 |
2019 |
2021 |
||
|
Date |
10-year issue |
10-year issue |
30-year issue |
7-year issue |
12-year issue |
12-year issue |
|
31-Dec-2020 |
3.9% |
5.2% |
7.0% |
4.9% |
5.9% |
- |
|
30-Jul-21 |
3.3% |
5.2% |
7.3% |
4.6% |
6.2% |
6.2% |
|
6-Aug-21 |
3.2% |
5.3% |
7.3% |
4.8% |
6.2% |
6.1% |
|
9-Aug-21 |
3.2% |
5.3% |
7.3% |
4.8% |
6.2% |
6.1% |
|
10-Aug-21 |
3.1% |
5.3% |
7.3% |
4.8% |
6.2% |
6.2% |
|
11-Aug-21 |
3.1% |
5.3% |
7.3% |
4.8% |
6.2% |
6.1% |
|
12-Aug-21 |
3.1% |
5.3% |
7.3% |
4.8% |
6.2% |
6.1% |
|
13-Aug-21 |
3.1% |
5.3% |
7.3% |
4.8% |
6.2% |
6.1% |
|
Weekly Change |
(0.1%) |
0.0% |
0.0% |
0.0% |
0.0% |
(0.1%) |
|
MTD Change |
(0.1%) |
(0.1%) |
0.0% |
0.0% |
0.0% |
(0.1%) |
|
YTD Change |
(0.8%) |
0.1% |
0.3% |
(0.1%) |
0.3% |
- |
Source: Reuters
Kenya Shilling:
During the week, the Kenyan shilling depreciated by 0.4% against the US dollar to close the week at Kshs 109.2, from Kshs 108.7 recorded the previous week, mainly due to increased dollar demand especially from the energy sector outweighing the supply of dollars from exporters. On a YTD basis, the shilling has remained unchanged similar to the Kshs 109.2 recorded at the start of the year, in comparison to the 7.7% depreciation recorded in 2020. Despite the appreciation against the US Dollar for the better part of the year, we expect the shilling to remain under pressure for the remainder of 2021 as a result of:
- Rising uncertainties in the global market due to the Coronavirus pandemic, which has seen investors continue to prefer holding their investments in dollars and other hard currencies and commodities,
- The widened current account position which increased by 0.2% points to 5.4% of GDP in the 12 months to June 2021 from 5.2% of GDP for a similar period in 2020, and,
- Demand from energy importers as they beef up their hard currency positions in the prevailing rise in global oil prices.
The shilling is however expected to be supported by:
- The Forex reserves, currently at USD 9.3 bn (equivalent to 5.7 months of import cover), which is above the statutory requirement of maintaining at least 4.0-months of import cover, and the EAC region’s convergence criteria of 4.5-months of import cover, and,
- Improving diaspora remittances evidenced by a 6.0% y/y increase to USD 305.9 mn in June 2021, from USD 288.5 mn recorded over the same period in 2020, which has continued to cushion the shilling against further depreciation.
Weekly Highlight
- Monthly Fuel Prices
During the week, the Energy and Petroleum Regulatory Authority (EPRA) released their monthly statement on the maximum wholesale and retail prices for fuel prices in Kenya effective 15th August 2021 to 14th September 2021. Below are the key take-outs from the statement:
- The price of Super Petrol, Diesel and Kerosene remained unchanged at Kshs 127.1 per litre, Kshs 107.7 per litre, and Kshs 97.9 per litre, respectively, despite increased landed cost of imported crude. Notably, this is the fifth consecutive month that the Diesel and Kerosene prices have remained unchanged,
- Below is the summary of the performance of the imported petroleum during the month;
- The average landed costs for Super Petrol increased by 6.2% to USD 552.4 per cubic meter in July 2021, from USD 520.0 per cubic meter in June 2021,
- The average landed costs for Diesel increased by 7.4% to USD 514.3 per cubic meter in July 2021, from USD 479.0 per cubic meter in June 2021,
- The average landed costs for Kerosene increased by 9.8% to USD 493.5 per cubic meter in July 2021, from USD 449.4 per cubic meter in June 2021,
- The Free on Board (FOB) price of Murban crude oil increased by 5.3% in July 2021 to USD 66.7 per barrel, from USD 63.4 per barrel in June 2021, and,
- The Kenyan shilling depreciated by 0.4% against the dollar to close at Kshs 108.3 in July 2021, from Kshs 107.8 in June 2021.
We expect the upward pressure on the inflation basket going forward to remain muted given the stabilizing global oil prices – the prices have declined by 4.7% in the first half of the month of August 2021, compared to a 46.5% increase in H1’2021. Further, the global oil prices are expected to remain stable due to (i) increased supply from non-OPEC oil producing countries, and, (ii) slowdown in global economy recovery and (iii) a slower demand growth due to the new COVID-19 variants and related restrictions.
Rates in the fixed income market have remained relatively stable due to the high liquidity in the money markets, coupled with the discipline by the government as they reject expensive bids. The government is 79.1% ahead its prorated borrowing target of Kshs 88.6 bn having borrowed Kshs 158.8 bn in FY’2021/2022. We expect a gradual economic recovery going into FY’2021/2022 as evidenced by KRA collecting Kshs 1.7 tn in FY’2020/2021, a 3.9% increase from Kshs 1.6 tn collected in the prior fiscal year. However, despite the projected high budget deficit of 7.5% and the lower credit rating from S&P Global to 'B' from 'B+', we believe that the monetary support from the IMF and World Bank will mean that the interest rate environment may stabilize since the government will not be desperate for cash.
Markets Performance
During the week, the equities market recorded a mixed performance, with NASI and NSE 25 gaining by 1.5% and 0.8%, respectively, while NSE 20 declined by 0.7%, taking their YTD performance to gains of 19.2%, 15.8% and 4.7% for NASI, NSE 25 and NSE 20, respectively. The equities market performance was mainly driven by gains recorded by stocks such as Safaricom, Equity Group, Co-operative Bank and KCB Group, which gained by 2.1%, 2.0%, 1.1% and 0.9%, respectively. The gains were however weighed down by losses recorded by stocks such as NCBA and Diamond Trust Bank (DTB-K) which declined by 3.1% and 1.9%, respectively.
During the week, equities turnover increased by 64.2% to USD 22.5 mn, from USD 13.7 mn recorded the previous week, taking the YTD turnover to USD 763.2 mn. Foreign investors turned net buyers, with a net buying position of USD 6.2 mn, from a net selling position of USD 2.2 mn recorded the previous week, taking the YTD net selling position to USD 22.2 mn.
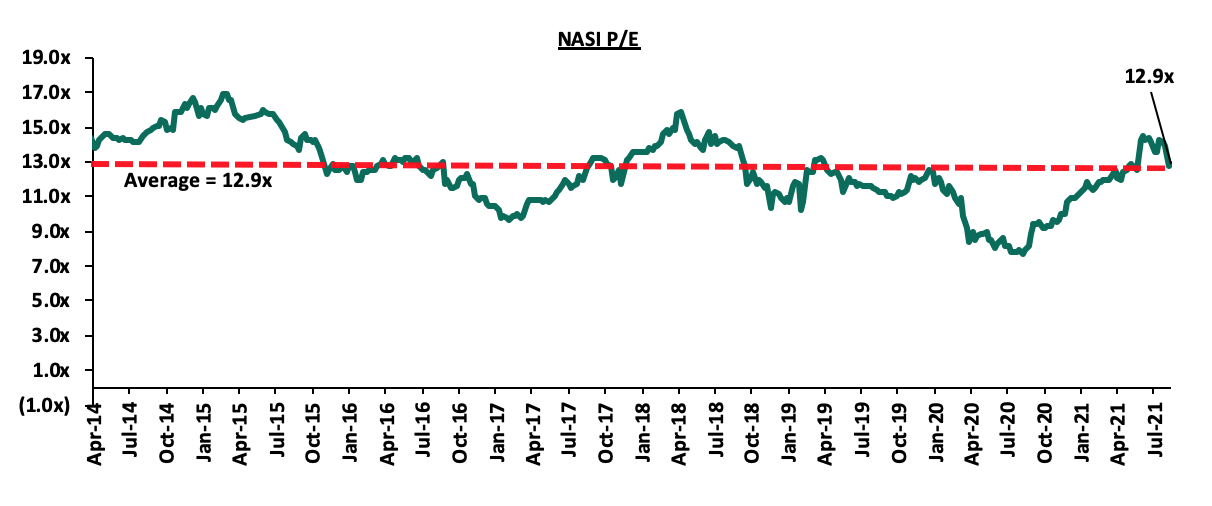
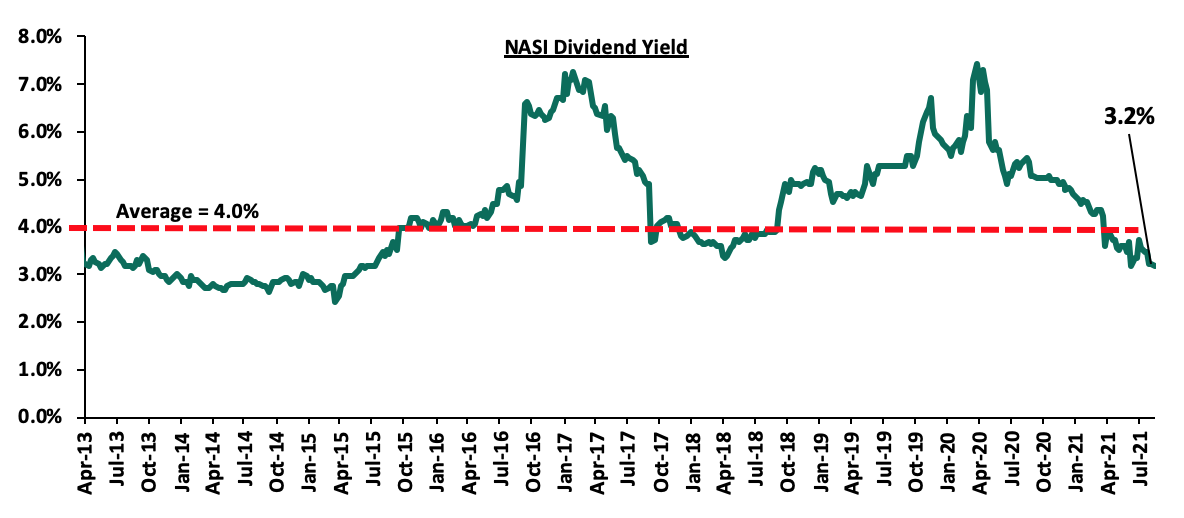
The market is currently trading at a price to earnings ratio (P/E) of 12.93x, 0.1% above the historical average of 12.92x, and a dividend yield of 3.2%, 0.8% points below the historical average of 4.0%. Key to note, NASI’s PEG ratio currently stands at 1.5x, an indication that the market is trading at a premium to its future earnings growth. Basically, a PEG ratio greater than 1.0x indicates the market may be overvalued while a PEG ratio less than 1.0x indicates that the market is undervalued. Excluding Safaricom, the market is trading at a P/E ratio of 12.0x and a PEG ratio of 1.4x. The current P/E valuation of 12.9x is 67.9% above the most recent trough valuation of 7.7x experienced in the first week of August 2020. The charts below indicate the historical P/E and dividend yields of the market.
Earnings Releases
During the week, Stanbic Holdings released their H1’2021 financial results. Below is a summary of the performance;
|
Stanbic Bank Kenya H1’2021 Key Highlights |
|||
|
Balance Sheet |
|||
|
Balance Sheet items |
H1’2020 (Kshs bns) |
H1’2021 (Kshs bns) |
y/y change |
|
Net Loans and Advances |
235.1 |
207.6 |
(11.7%) |
|
Total Assets |
364.5 |
329.5 |
(9.6%) |
|
Customer Deposits |
287.0 |
260.0 |
(9.4%) |
|
Deposits per Branch |
11.5 |
10.4 |
(9.4%) |
|
Total Liabilities |
312.2 |
276.0 |
(11.6%) |
|
Shareholders’ Funds |
49.3 |
53.5 |
8.4% |
|
Income Statement |
|||
|
Income Statement Items |
H1’2020 (Kshs bns) |
H1’2021 (Kshs bns) |
y/y change |
|
Net Interest Income |
6.3 |
6.9 |
9.5% |
|
Net non-Interest Income |
5.0 |
5.5 |
10.5% |
|
Total Operating income |
11.3 |
12.4 |
9.9% |
|
Loan Loss provision |
(2.0) |
(1.5) |
(24.2%) |
|
Total Operating expenses |
(5.2) |
(6.1) |
17.6% |
|
Profit before tax |
4.1 |
4.8 |
16.7% |
|
Profit after tax |
2.6 |
3.5 |
37.2% |
|
Core EPS |
6.5 |
8.9 |
37.2% |
|
Key Ratios |
|||
|
Ratios |
H1’2020 |
H1’2021 |
% point change |
|
Yield from interest-earning assets |
3.2% |
3.2% |
(0.0%) |
|
Cost of funding |
1.3% |
1.2% |
(0.1%) |
|
Net Interest Margin |
4.5% |
4.4% |
(0.1%) |
|
Non- Performing Loans (NPL) Ratio |
8.5% |
9.5% |
1.0% |
|
NPL Coverage |
64.8% |
51.2% |
(13.6%) |
|
Cost to Income with LLP |
45.7% |
48.9% |
3.2% |
|
Loan to Deposit Ratio |
81.9% |
79.9% |
(2.0%) |
|
Return on Average Assets |
1.5% |
1.8% |
0.3% |
|
Return on Average Equity |
10.9% |
11.9% |
1.0% |
|
Capital Adequacy Ratios |
|||
|
Ratios |
H1'2020 |
H1'2021 |
% point change |
|
Core Capital/Total Liabilities |
15.1% |
18.2% |
3.1% |
|
Minimum Statutory ratio |
8.0% |
8.0% |
0.0% |
|
Excess |
7.1% |
10.2% |
3.1% |
|
Core Capital/Total Risk Weighted Assets |
15.4% |
16.1% |
0.7% |
|
Minimum Statutory ratio |
10.5% |
10.5% |
0.0% |
|
Excess |
4.9% |
5.6% |
0.7% |
|
Total Capital/Total Risk Weighted Assets |
17.9% |
18.1% |
0.2% |
|
Minimum Statutory ratio |
14.5% |
14.5% |
0.0% |
|
Excess |
3.4% |
3.6% |
0.2% |
|
Liquidity Ratio |
58.4% |
53.3% |
(5.1%) |
|
Minimum Statutory ratio |
20.0% |
20.0% |
0.0% |
|
Excess |
38.4% |
33.3% |
(5.1%) |
Key take-outs from the earnings release include;
- Core earnings per share increased by 37.2% to Kshs 8.9, from Kshs 6.5 in H1’2020. The performance was primarily driven by a 31.1% decrease in Loan loss provisions to Kshs 1.2 bn, from Kshs 1.7 bn in H1’2020, coupled with a 9.9% increase in total operating income to Kshs 12.4 bn in H1’2021, from Kshs 11.3 bn in H1’2020. The increase was however weighed down by the 17.6% increase in total operating expenses to Kshs 6.1 bn, from Kshs 5.2 bn in H1’2020 due to a 7.0% increase in staff costs to Kshs 2.9 bn, from Kshs 2.7 bn in H1’2020,
- The bank’s Interest income grew by 2.1% to Kshs 9.8 bn in H1’2021, from Kshs 9.6 bn in H1’2020. This was largely due to a 24.2% increase on interest income from government securities to Kshs 2.4 bn, from Kshs 2.0 bn in H1’2020. The growth in interest income was however weighed down by a 0.4% decline in interest income from loans and advances to Kshs 7.10 bn, from Kshs 7.13 bn in H1’2020, coupled with a 49.7% decline in interest income from deposits with banking institutions to Kshs 0.3 bn in H1’2021, from Kshs 0.5 bn in H1’2020.
- The yield on interest-earning assets declined marginally to 3.19%, from 3.22% in H1’2020, following the 3.0% growth in the average interest earning assets, which outpaced the 2.1% increase in interest income,
- Interest expense declined by 9.9% to Kshs 3.3 bn, from Kshs 3.6 bn in H1’2020, following a 23.8% decline in interest expenses on Deposits and placements from banking institutions to Kshs 0.2 bn, from Kshs 0.3 bn in H1’2020. There was however 0.6% increase in the interest expense on customer deposits to Kshs 2.83 bn, from Kshs 2.8 bn in H1’2020. Cost of funds, on the other hand, declined marginally to 1.2%, from 1.3% in H1’2020, owing to the 9.9% decline in interest expense to Kshs 3.3 bn from Kshs 3.6 bn recorded in H1’2020, coupled with the 3.4% growth in average interest bearing liabilities to Kshs 278.9 bn from Kshs 269.8 bn in H1’2020,
- Net Interest Margin declined to 4.4%, from 4.5% in H1’2020 on the back of the 3.0% increase in the average interest earning assets to Kshs 306.7 bn from Kshs 297.7 bn in H1’2020, which outpaced the 0.7% increase in trailing Interest Income to Kshs 13.4 bn in H1’2021 from Kshs 13.3 bn,
- Total operating expenses increased by 17.6% to Kshs 6.1 bn in H1’2021, from Kshs 5.2 bn in H1’2020, largely driven by a 7.0% increase in staff costs to Kshs 2.9 bn, from Kshs 2.7 bn in H1’2020. Notably, Loan loss provisions decreased by 31.1% to Kshs 1.2 bn, from Kshs 1.7 bn in H1’2020,
- The balance sheet recorded a contraction as total assets declined by 9.6% to Kshs 329.5 bn, from Kshs 364.5 bn in H1’2020. The decline was largely driven by an 11.7% decline in the net loans to Kshs 207.6 bn, from Kshs 235.2 bn in H1’2020, coupled with a 2.7% decline in investment securities to Kshs 82.2 bn from Kshs 84.5 bn recorded in H1’2020,
- Total liabilities declined by 11.6% to Kshs 276.0 bn, from Kshs 312.2 bn in H1’2020, largely driven by a 9.4% decrease in customer deposits Kshs 260.0 bn in H1’2021, from Kshs 287.0 bn in H1’2020. Deposits per branch decreased by 9.4% to Kshs 10.4 bn, from Kshs 11.5 bn in H1’2020, as the number of branches remained unchanged at 25,
- Gross Non-Performing Loans (NPLs) declined by 2.3% to Kshs 20.7 bn in H1’2021, from Kshs 21.1 bn in H1’2020 taking the NPL ratio to 9.5% in H1’2021, from 8.5% in H1’2020. The deterioration in the group’s asset quality is attributable to the slower 2.3% decline in Gross Non-Performing Loans (NPLs), compared to the 12.3% decline in Gross Loans,
- The NPL coverage ratio declined to 51.2% in H1’2021, from 64.8% in H1’2020, due to the faster 15.4% decline in General Loan Loss provisions, which outpaced the 2.3% decline in Gross Non-Performing Loans, and,
- Stanbic Bank is currently sufficiently capitalized with a core capital to risk weighted assets ratio of 16.1%, 5.6% points above the statutory requirement of 10.5%. In addition, the total capital to risk weighted assets ratio was 18.1%, exceeding the statutory requirement of 14.5% by 3.6% points. Adjusting for IFRS 9, core capital to risk weighted assets ratio was at 16.2% while total capital to risk weighted assets was 18.3%, indicating that the bank’s total capital relative to its risk-weighted assets declined by 0.2% points due to the implementation of IFRS 9.
For a comprehensive analysis, please see our Stanbic Bank H1’2021 Earnings Note
Universe of Coverage
|
Company |
Price as at 06/08/2021 |
Price as at 13/08/2021 |
w/w change |
YTD Change |
Year Open 2021 |
Target Price* |
Dividend Yield |
Upside/ Downside** |
P/TBv Multiple |
Recommendation |
|
I&M Group*** |
22.6 |
22.8 |
0.9% |
(49.3%) |
44.9 |
29.8 |
9.9% |
40.9% |
0.3x |
Buy |
|
Kenya Reinsurance |
2.6 |
2.5 |
(3.1%) |
8.2% |
2.3 |
3.1 |
8.0% |
32.0% |
0.3x |
Buy |
|
NCBA*** |
26.2 |
25.4 |
(3.1%) |
(4.5%) |
26.6 |
29.5 |
5.9% |
22.0% |
0.6x |
Buy |
|
Standard Chartered*** |
131.0 |
130.8 |
(0.2%) |
(9.5%) |
144.5 |
134.5 |
8.0% |
10.9% |
1.0x |
Accumulate |
|
ABSA Bank*** |
9.8 |
9.8 |
(0.2%) |
2.7% |
9.5 |
10.7 |
0.0% |
9.4% |
1.1x |
Hold |
|
Diamond Trust Bank*** |
65.8 |
64.5 |
(1.9%) |
(16.0%) |
76.8 |
70.0 |
0.0% |
8.5% |
0.3x |
Hold |
|
Sanlam |
10.8 |
11.6 |
6.9% |
(11.2%) |
13.0 |
12.4 |
0.0% |
7.4% |
1.0x |
Hold |
|
Co-op Bank*** |
13.7 |
13.8 |
1.1% |
10.0% |
12.6 |
13.8 |
7.2% |
7.2% |
1.0x |
Hold |
|
Stanbic Holdings |
92.5 |
86.0 |
(7.0%) |
1.2% |
85.0 |
89.1 |
2.0% |
5.6% |
0.8x |
Hold |
|
KCB Group*** |
46.8 |
47.2 |
0.9% |
22.8% |
38.4 |
48.6 |
2.1% |
5.2% |
1.1x |
Hold |
|
Equity Group*** |
50.0 |
51.0 |
2.0% |
40.7% |
36.3 |
51.2 |
0.0% |
0.4% |
1.5x |
Lighten |
|
Liberty Holdings |
9.1 |
8.4 |
(7.3%) |
9.1% |
7.7 |
8.4 |
0.0% |
0.0% |
0.6x |
Sell |
|
Jubilee Holdings |
370.0 |
358.8 |
(3.0%) |
30.1% |
275.8 |
330.9 |
2.5% |
(5.3%) |
0.7x |
Sell |
|
HF Group |
3.8 |
3.7 |
(0.8%) |
18.5% |
3.1 |
3.2 |
0.0% |
(14.0%) |
0.2x |
Sell |
|
Britam |
7.9 |
8.3 |
5.1% |
18.6% |
7.0 |
6.7 |
0.0% |
(19.3%) |
1.5x |
Sell |
|
CIC Group |
3.1 |
3.2 |
1.6% |
49.3% |
2.1 |
1.8 |
0.0% |
(42.9%) |
1.1x |
Sell |
|
Target Price as per Cytonn Analyst estimates as at Q1’2021. We are currently reviewing our target prices for the banking sector coverage **Upside/ (Downside) is adjusted for Dividend Yield ***For Disclosure, these are stocks in which Cytonn and/or its affiliates are invested in Key to note, I&M Holdings YTD share price change is mainly attributable to the counter trading ex-bonus issue |
||||||||||
We are “Neutral” on the Equities markets in the short term. With the market currently trading at a premium to its future growth (PEG Ratio at 1.5x), we believe that investors should reposition towards companies with a strong earnings growth and are trading at discounts to their intrinsic value. Additionally, we expect the recent discovery of new strains of COVID-19 coupled with the introduction of strict lockdown measures in major economies to continue dampening the economic outlook.
- Industry Reports
During the week, Knight Frank Kenya, a real estate consultancy firm, released their Kenya Market Update H1’2021 report which highlights the performance of key real estate sectors. The following were the key take outs from the report:
- In the residential sector, average selling prices for prime residential buildings realized a 0.1% y/y marginal improvement in H1’2021 compared to 5.1% decline realized in H1’2020, mainly attributed to developers resuming their construction plans which were halted in 2020 and sellers also being more flexible with property prices through negotiations in order to facilitate their uptake. Rental rates for the prime residential buildings declined by 6.0% under the review period compared to the 7.6% decline recorded in H1’2020 as landlords adjusted rental rates to a lower price in order to retain existing tenants and attract new ones,
- The average prime commercial office rents realized a 1.8% decline to Kshs 119.8 per SQFT under the period of review, from Kshs 122.0 per SQFT recorded in FY’2020, as a result of the decline in demand for spaces thereby causing landlords to lower rental rates to favor existing and prospective clients, coupled with the existing oversupply of office spaces currently at 7.3 mn SQFT within the Nairobi Metropolitan Area. Average occupancy levels flattened coming in at 73.0% in H1’2021 same as H1’2020, however, the absorption for Grade A and B spaces increased by 64.0% when compared to H2’2020 attributed to i) reduced supply of new offices thereby driving uptake of the existing ones, ii) roll out of vaccines thereby boosting confidence of employees to working from their office spaces, and, iii) favorable rental rates from landlords, and,
- The average prime retail rents registered a 4.8% decline from Kshs 457.4 per SQFT recorded in FY’2020 to Kshs 435.6 per SQFT in H1’2021, attributed to landlords cutting down on rental prices as concession measures to retain existing tenants as well as attract new ones amidst the tough economic environment. Average occupancy rates for retail spaces ranged between 70.0% and 80.0 %, similar to last year, with more established malls such as Capital Centre registering up to 90.0% occupancies.
The findings of this report are in line with our Cytonn H1’2021 Markets Review report for two sectors- residential and commercial office whereby the selling prices in all residential segments registered appreciations averaging at 0.6%, apart from apartments in satellite towns which recorded a price correction of 0.8%. The commercial office recorded 0.1% decline in average rental rates to Kshs 92.8 per SQFT in H1’2021 from Kshs 93.1 per SQFT in FY’2020. We expect the residential and retail sectors to record more activities attributed to the improving demand for housing and aggressive uptake of space previously occupied by troubled retailers, however the commercial office is expected to continue registering low rental yields due to minimal demand for physical spaces as firms embrace working from home strategy and may make it a permanent measure as a cost saving mechanism, as well as the existing oversupply in the sector.
- Residential Sector
During the week, Centum Real Estate through its subsidiary Vipingo Development Limited (VDL) completed the construction of its 10-acre Palm Ridge Estate phase one project worth Kshs 1.5 bn in Kilifi County. The phase one of the project consisted of 330 apartments units of 1, 2 and 3 bedrooms. This marks the second major residential project completed by Vipingo Development Limited after the Awali Estate project in Vipingo that was completed in October 2020, three months ahead of schedule. The table below gives a summary of the unit types, sizes and prices for the development;
|
Palm Ridge Estate Phase I Project |
|||
|
Typology |
Unit size (SQM) |
Unit Price (Kshs) |
Price per SQM (Kshs) |
|
1 |
45 |
2.5 mn |
55,556 |
|
2 |
60 |
3.5 mn |
58,333 |
|
3 |
75 |
4.6 mn |
61,333 |
|
Averages |
60 |
3.5 mn |
58,407 |
Source: Cytonn Research
Other projects by the developer include the Kingswood Park, as well as phase 2 of the Palm Ridge Estate consisting of 110 apartments which is also nearing completion. The completion of the phase one project will be beneficial in various ways including; i) provision of descent housing to citizens living within the area thereby improving their living standards, ii) boosting investors’ confidence especially for off plan sales, and, iii) boosting the residential sector performance of the area, among others.
Coastal region where the project is located has proven to attract real estate investment opportunities supported by; i) value for investment money as properties adopting the real estate tourism model generates higher returns due to their exclusivity and ready market, ii) high quality infrastructure with the development situated approximately 600 meters off the Mombasa-Malindi highway and 1 Km away from Vipingo Airstrip, iii) superior location with ability to attract tourists and investors, and, iv) availability of amenities such as shopping malls and reliable security among others. We therefore expect that the conclusion of the Palm Ridge Estate phase one project, to boost investor confidence in the region further boosting the real estate performance coupled with the overwhelming demand for units thereby encouraging more residential development projects.
Also during the week, the National Housing Corporation (NHC), a state owned firm, announced plans to build 2,000 affordable housing units in various parts of Kiambu County, in addition to also signing a land lease agreement with Konza City that will see the firm develop 5,000 units beginning November 2021. The first batch of the project in Kiambu consisting of 500 units is expected to be delivered in Ruiru by December 2021. However, this does not seem possible due to the short timeline presented, whereas the remaining units expected to be delivered in Thika, Kiambu town, Migaa, and, other towns. Kiambu and Machakos where Konza City is situated now joins Laikipia, Muranga and other counties that have signed a Memorandum of Understanding (MoU) with NHC for the development of low cost houses into their respective areas. NHC’s decision to establish low cost housing projects in the aforementioned areas is mainly driven by; i) improved infrastructure with the areas being served by roads such as Thika Superhighway and Mombasa Road, ii) increasing housing demand as a result of high population and urbanization growth rates, iii) availability of land for development, iv) a fast growing middle income class, v) availability of amenities such as malls and schools servicing the areas, and, vi) high demand for affordable homes evidenced by the 320,897 registrations in the Boma Yangu portal against.
NHC which was established in 1953 has the mandate to deliver low cost housing projects in the country, stimulate the building industry, as well as assist in housing research. The corporation has been on an aggressive path to deliver projects in line with its mandate, with some of the affordable housing pipeline projects being the Stoni housing project in Athi River and the Mavoko housing project in Machakos. The government continues to initiate projects towards the Affordable Housing Program (AHP) which has been gaining traction over the past years with the aim of delivering a target of 500,000 units by December 2022, thereby also curbing the existing housing deficit of 2.0 mn units housing deficit which has been growing by 200,000 units every year against a supply of approximately 50,000 units according to Housing Finance Africa. However, the government’s target of 500,000 units by the end of 2022 may not be achieved due to the challenges impeding the timely delivery of the projects such as; i) relatively longer transactions and development approval processes, ii) financial constraints leading to construction halts, and, iii) fraudulent procurement processes causing irregularities and project delays. Despite this, we expect the projects by NHC to boost the low home ownership rates of the urban regions in Kenya currently at 21.3% compared to countries such as South Africa at 53.0%, and further drive government’s Big Four Agenda on affordable housing,
The graph below shows the percentage of home ownership rates in different countries compared to Kenya;
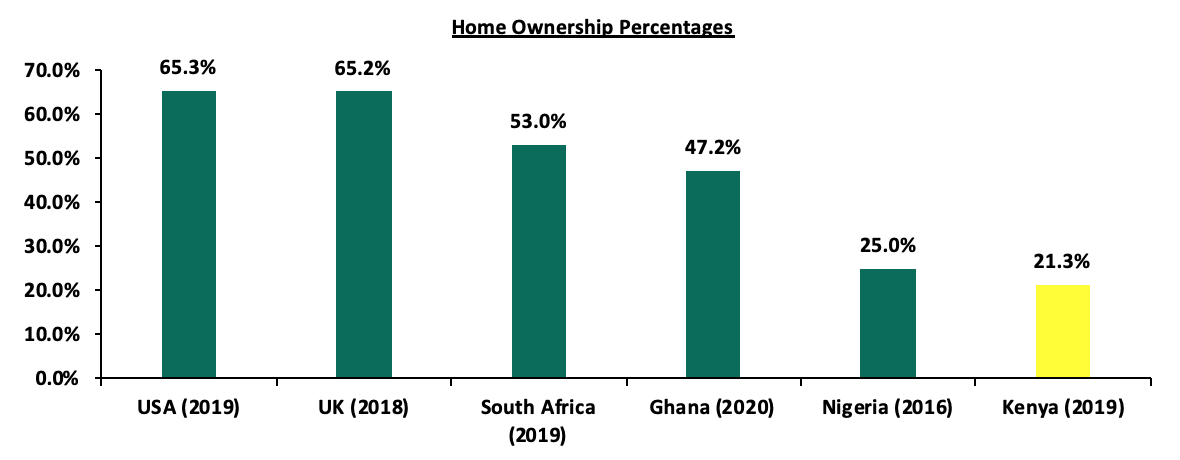
Source: Centre for Affordable Housing Finance in Africa
The residential sector is expected to continue registering robust developments due to the focus on affordable housing projects by the government, supported by factors such as the greater demand for low cost homes, improving infrastructure and amenities, and, favorable demographics.
- Hospitality Sector
During the week, the United States of America (USA), raised Kenya’s travel advisory alert from level two to level three, amidst concerns of the increasing Covid 19-Delta variant. The decision comes barely less than three months after the US government lowered the Kenyan advisory alert to level two in May 2021. The move by the US government is expected to weigh down the performance of the tourism and hospitality sectors in general as its citizens will minimize their travel plans to cushion themselves against the Delta variant. The United States is a top source tourism market for Kenya ranking at position one with 49,178 visitor arrivals, representing 16.1% of the 305,635 total visitor arrivals between January and June 2021 as evidenced by the International Tourism Performance Report January to June 2021 by Tourism Research Institute of Kenya.
The graph below shows the number of international arrivals from January 2020 to June 2021;
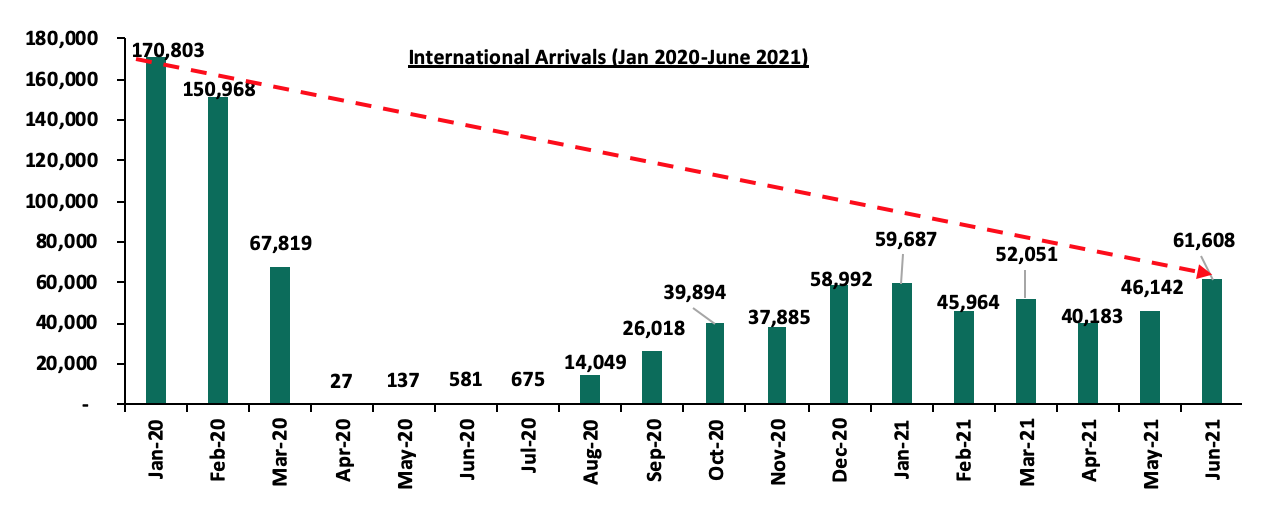
Source: Tourism Research Institute
Despite the strategies implemented to promote the performance of the tourism sector such as the gradual lifting of travel restrictions and lockdowns, introduction of charter flight operations to boost tourism arrivals, World Rally Championships expected to run annually up to 2026 thereby boosting local and international tourism, among others, performance of the hospitality sector which heavily relies on the tourism sector is still expected to be weighed down. This is mainly attributed to factors such as the expected low visitor number arrivals from key source markets like UK which also still retains Kenya in its ‘Red List,’ and the reduced budget allocation for the tourism sector by 11.3% to Kshs 18.1 bn in FY 2021/22 from Kshs 20.4 bn in FY’2020/21.
With the gradual re-opening of the economy and roll out of vaccines, the real estate industry is expected to be on an upward trajectory registering major improved developments, such as the continued focus on the housing developments. However slow growth is expected to be witnessed in the hospitality sector due to the expected low visitor arrivals, and commercial office sector due to the oversupply of 7.3 mn SQFT space and reduced demand for physical spaces.
The Cabinet Secretary for the National Treasury and Planning, through the Capital Markets Authority (CMA), recently published the Draft Capital Markets Investment Based Crowdfunding Regulations, 2021. The proposed rules seek to regulate the raising of funds through online platforms by licensing and approving all persons who operate or intend to operate an investment-based crowdfunding platform. Given that these are new regulations in the capital markets, we found it necessary to demystify the proposed regulations and give our insights on them. We shall do this in five sections, namely:
- Introduction to Crowdfunding,
- Review of the draft regulations,
- Case Study – Australia,
- Recommendation, and,
- Conclusion
Section 1: Introduction to Crowdfunding
Crowdfunding is the act of raising small amounts of money obtained from a large number of individuals or entities to either finance or re-finance a project or business through a website, application or internet-based portal operated by a crowdfunding platform operator. Crowdfunding can be majorly categorized into two; investment-based crowdfunding and donation-based crowdfunding. With investment-based crowdfunding, the issuer raises funds on the crowdfunding platform in exchange for shares, debt securities or any other investment instruments approved by the Authority. Donation-based crowdfunding, on the other hand, involves non-profit projects such as charity, philanthropy, health or social work raising funds from a large number of donors who receive no financial or material return. Examples of crowdfunding platforms locally include M-changa and M-pesa’s Paybill platform which have been mainly used for charitable courses such as fundraising for medical bills and Pezesha a debt-based crowdfunding platform that got approval from CMA in 2020. Internationally, we have examples of Kickstarter and IndieGogo which have been used to raise funds for start-ups.
Investors invest through crowdfunding since it allows them to invest small amount of funds, share risks and diversify their investments into multiple campaigns and companies. Issuers, on the other hand, are able to access larger pools of accredited investors faster and at a lower transaction cost. The main issuers for crowdfunding investments are Micro or Small Enterprises and Start-ups who issue financial instruments such as shares, loans or other approved investments instruments so as to raise funds for their businesses.
Section 2: Review of the draft regulations
The draft CMA regulations on investment crowdfunding are meant to control the raising of finances through the crowdfunding platforms and protect the investors using the platforms. The regulations are aimed at ensuring that crowdfunding platforms are operated by licensed persons only and participation on the platform will only involve eligible issuers and investors. The draft CMA regulations focused on the following:
- Issuers - Issuers eligible to raise funds through a crowdfunding platform are startups with good operating track record and a good corporate governance record and micro or small enterprises incorporated in Kenya with a minimum of two years’ operating track record and a good corporate governance record. According to the Micro and Small Enterprises Act, 2012, a micro enterprise is defined as a firm, trade, service, industry or a business activity whose turnover does not exceed Kshs 500,000.0 annually, which employs less than ten people and whose total assets be as determined by the Cabinet Secretary from time to time. A small enterprise, on the other hand, means a firm, trade, service, industry or a business activity whose annual turnover ranges between Kshs 500,000 to Kshs 5.0 mn, employs 10 to 50 people and whose total assets and financial investment shall be as determined by the Cabinet Secretary from time to time. Within a twelve-month period, an eligible issuer can offer a maximum aggregate amount of investment as follows:
-
- Kshs 100.0 mn for Medium Enterprises,
- Kshs 50.0 mn for Small Enterprises, and,
- Kshs 5.0 mn for Micro Enterprises.
However, a crowdfunding platform operator may apply to CMA for a no-objection whenever an issuer seeks to raise more than the set limit within 12 months. Issuers prohibited from raising funds through the crowdfunding platforms include public listed companies and their subsidiaries, entities with a poor governance record, entities that propose to use the funds raised to provide loans or invest in other entities and any other such entity as may be specified by CMA,
- Investors - Eligible investors for crowdfunding include sophisticated investors and/or individual retail investors subject to an investment limit as prescribed by the platform operator and up to a maximum of Kshs 100,000. Investment instruments allowed for purposes of crowdfunding include shares, bonds or debentures or any other instruments as shall be approved by the Authority,
- Platform Operators - Anyone who operates or intends to operate a crowdfunding platform in Kenya must obtain an approval and licensing from CMA. To be eligible for licensing, the crowdfunding platform operator should be a company limited by shares with a minimum paid up capital of Kshs 10.0 mn. The license will be issued to the eligible operator once they meet all the requirements including an application fee of Kshs 10,000 as well as an annual regulation fee of Kshs 200,000. A platform operator will be deemed operating in Kenya if:
- The crowdfunding platform is established in Kenya,
- The platform is located outside Kenya but actively targets Kenyan investors, or,
- The key components of the platform are physically in Kenya even if any of its components are located outside Kenya.
The CMA may suspend, restrict or revoke a crowdfunding platform operator license in accordance with Section 26 and 26A of The Capital Market Act. According to CMA, a person operating a crowdfunding platform in Kenya without a license commits an offence under these regulations and is liable for a penalty under section 34A of the Act. The platform operator will be responsible for ensuring the funds raised through the platform are used for the stated objective. The crowdfunding platform operator is also mandated to appoint a financial institution duly registered by CMA as a custodian, who shall establish and maintain a separate trust account for each funding round on its platform, and,
- Crowdfunding Transactions - A crowdfunding offering shall not remain open for more than sixty days and where an issuer is unable to meet the prescribed minimum threshold for the targeted amount, the offer shall be withdrawn and the crowdfunding platform operator shall effect a refund of the monies to the investors within 48 hours. The issuer may only commence a fresh crowdfunding offering not earlier than ninety days after the said withdrawal. However, where the crowdfunding transaction is successful, the crowdfunding platform operator shall make the funds available to the issuer within 24 hours after the close of the offer. Moreover, investors are granted a ‘cooling off’ period of 48 hours, which is the period within which the investor can withdraw an offer or agreement to purchase the securities or investment instrument by delivering a notice to the crowdfunding platform operator. A platform operator is expected to prepare and display a warning statement on the crowdfunding platform to all visitors using the platform, investors and on all application investment forms. Investors must then sign the risk acknowledgement form to confirm that they understand that the proposed investment is risky, they can never be able to sell the security, they will be provided with minimal disclosure and they will not have benefits of protection associated with the investment.
The regulations are a commendable move by the National Treasury and the CMA as they will ensure that investors using crowdfunding platforms are protected and raising of finances on crowdfunding platforms is controlled. These regulations will also enhance accountability and transparency of operations in the crowdfunding platforms and will ensure supervision of crowdfunding operations by the CMA. The regulations are also aimed at ensuring investors’ funds are used for the stated purpose by holding the platform operator responsible for ensuring the funds raised through the platform are used for the outlined objective. The other key advantage is the fact that this provides another avenue for businesses to seek funding and diversify the funding sources from banks.
Section 3: Case Study – Australia
According to The 2nd Global Alternative Finance Market Benchmarking Report by Cambridge Centre for Alternative Finance (CCAF), Australia ranked 11th amongst the most active crowdfunding countries globally with crowdfunding volumes of USD 1.2 bn as at 2020. In 2020, its equity-based crowdfunding was worth USD 39.5 mn, a 1.0% increase from USD 39.1 mn in 2019. We have chosen Australia for our case study since the Australian Securities and Investments Commission (ASIC) has provided clear and comprehensive regulation guidelines that control and monitor raising of investment funds through crowdfunding in the country, having in mind most countries have no specific legislations governing crowdfunding.
The Crowd-Sourced Funding (CSF) regime in Pt 6D.3A of the Corporations Act 2001 (Corporations Act) of Australia provides a regulatory framework for investment-based crowd-sourced funding by small unlisted public companies and proprietary companies, enabling them to make offers of ordinary shares to retail clients, through a licensed intermediary’s platform, using a CSF offer document. The eligibility and roles of the different players in investment crowdfunding in Australia as discussed in the Act include:
- Investors – Both institutional and retail investors are eligible to invest into companies making an offer on the crowdfunding platforms. Retail investors have an investment cap of USD 10,000 per company in any 12-month period and a ‘cooling-off’ period allowing them to withdraw from a CSF offer up to 5 days after making an application. Additionally, all investors have 14 days to withdraw their application and be repaid their application money, if a supplementary or replacement CSF offer document is published to correct a defective offer document, and the defect is materially adverse from the point of view of an investor. The investors must also acknowledge that they have read and understood the risk warning statement provided on the platform before applying for shares,
- Issuers – Unlisted public companies and proprietary companies with less than USD 25.0 mn in assets and annual revenue can make offers of ordinary shares to retail clients, through an Australian Financed Services (AFS), a licensed CSF intermediary’s platform, using a CSF offer document. Eligible companies can raise up to USD 5.0 mn in any 12-month period under the CSF regime. Public companies and proprietary companies that have completed a successful CSF offer must comply with certain financial reporting and corporate governance obligations such as consent of directors to the publication of CSF document, lodging of financial statements and audit of financial statements if the company raises over USD 3.0 million through CSF offers,
- Investment crowdfunding intermediary – The Investment crowdfunding intermediary (platform operator) must be licensed by the AFS to be able to offer investment crowdfunding services to companies, SMEs and investors. The intermediary has to demonstrate adequate human and technological resources to prove capacity to carry out financial services in full compliance with the Corporations Act. Surplus Liquid Funds (SLF) of USD 50,000 must be maintained if the intermediary holds clients assets of at least USD 100,000. Cash flow projections will also be required to indicate that the intermediary will hold, at all times covered by the projection, a cash buffer of at least 5.0% of projected 12-month cash outflows or, if higher, the cash outflows of the previous year. This way, the intermediary will demonstrate adequacy of cash and financial resources. The crowdfunding intermediary must lodge annual financial statements and an audit report on those statements with ASIC. The investment crowdfunding intermediary’s platform must provide the following facilities:
- Application facility - All applications must be made through this facility and the intermediary must, as soon as practicable, reject and refund any money paid for any applications made other than through the application facility. This ensures that investors are protected from fraud since the application facility must only be available while the relevant CSF offer is open, and,
- Communication facility - This facility allows potential investors, the company making the CSF offer and the intermediary to communicate with each other about the offer to enhance transparency and help investors make an informed decision.
A CSF intermediary is obligated to suspend a CSF offer if it contains a misleading or defective statement, if it omits relevant information or if new circumstance arises and needs to be included in this document. However, the offering company can prepare a supplementary or replacement CSF offer document to correct the defect. When dealing with retail investors, the intermediary must provide:
- Unconditional cooling-off rights - All retail investors who make an application in response to a CSF offer have an unconditional right to withdraw their application within five business days of making the application,
- Risk acknowledgement – Similar to Kenya, retail investors need to complete an applicant risk acknowledgement containing the exact wording in the Corporation Regulations,
- A cap on investment – The intermediary must reject an application from a retail client where it would breach the USD 10,000 cap in respect of applications for CSF offers made by a particular company via the same intermediary over a 12-month period, and,
- Restrictions on financial assistance – The CSF intermediary must not financially assist a retail client in relation to a CSF offer, or arrange financial assistance for a retail client to acquire shares under a CSF offer, that it is hosting or intending to host.
Lessons Kenya can borrow from Australia’s Investment Crowdfunding Regulations:
- Increased cooling-off period rights for investors – Australia’s CSF regulations require intermediaries to provide retail investors the right to withdraw their application within five business days from day of making the application, compared to Kenya where investors have only 48 hours to reconsider their investment. ASIC also gives all investors the right to withdraw their application within 14 days and be repaid their application money if a supplementary or replacement CSF offer document is published to correct a defective offer document, and the defect is materially adverse from the point of view of an investor,
- Audit requirements - Audit obligations apply only when a company raises over USD 3.0 million through CSF offers in Australia. In Kenya, issuers are supposed to provide two years audited financial statements during application. This could limit startups from raising funds having in mind the CMA has provided that only Micro and SMEs ought to have been in operation for two years. The intermediaries in Australia are also obligated to lodge annual financial statements with ASIC and an audit report on those statements while here in Kenya, the CMA has not obligated platform operators to hand in audited financial statements,
- Guidance on crowdfunding platform structure - As discussed above, the ASIC has clearly stated the most essential facilities to be provided by intermediaries such as a communication facility that will enable investors to make informed decisions and an application facility that will protect investors by ensuring investments are only made on open and viable offers,
- Conflict of Interest management - The ASIC has clearly laid down roles of the intermediaries in managing conflict of interest compared to Kenya’s draft that only states that the platform operator ought to manage any conflict of interest that may arise. In Australia, the intermediary is obligated to have a conflicts of interest policy written down. The policy should contain appropriate measures to identify, document and manage conflicts of interest and should be prepared following general guidance provided by the ASIC on conflicts of interest. The key conflict of interest specific to CSF intermediaries is the conflict that could arise between their various obligations under the CSF regime and the financial benefits they derive from publishing CSF offers and ensuring the success of those offers,
- Computation of the issuer cap - The ASIC has provided a clear formula of calculating issuer cap that is, a sum of:
- The maximum amount sought to be raised by the company under the current CSF offer,
- All amounts raised by the company and its related parties under any other CSF offers made in the last 12 months, and,
- All amounts received in the last 12 months by the company and its related parties under small scale personal offers and offers made via an AFS licensee.
The CMA should also set a clear and standard way of calculating the maximum aggregate funds, that is, the Kshs 100.0 mn for Medium, the Kshs 50.0 mn for Small and the Kshs 5.0 mn for Micro enterprises to be raised or state some ratios on which amounts raised can be pegged on.
Section 4: Recommendation
While the proposed draft regulations are a step in the right direction towards enhancing efficiency in the capital markets, we believe the regulations could offer more clarity to facilitate growth of investment-based crowdfunding and boost investor confidence. In regard to the observations, we recommend the following improvements before having the final regulations;
- Enhanced due diligence and KYC disclosures on investors – The guidelines should be expanded to include an enhanced due diligence on investors, more so on their sources of funds. The disclosure will assist in enhancing Anti-Money Laundering and terrorism financing activities that might be carried out using such platforms,
- Clarity on the issuer cap - The amounts to be raised should be pegged on some ratios or metrics as opposed to absolute numbers. This will enable SMEs to raise enough financing and will also reduce chances of over-funding some startups,
- Definition of a medium enterprise – Although the CMA refers to the Micro and Small Enterprises Act that defines the two types of enterprises, the Act as well as the draft on investment-based crowdfunding do not define a Medium enterprise that is eligible to raise up to Kshs 100.0 mn through investment crowdfunding platforms. The CMA ought to provide a clear framework of classifying an enterprise as a medium enterprise, and,
- Clarity on the startup track record – The CMA should provide guidelines on evaluation of Micro and SME’s track records. This could be done through clarifying financial or corporate governance metrics to be used in evaluating the track record.
Section 5: Conclusion
For economies to grow, there is need for companies to be in a position to access capital to finance their businesses and Investment Crowdfunding platforms provide access to an alternative source of finance. However, according to CMA’s Capital Markets Soundness Report Q4, 2020, 95.0% of capital in Kenya is sourced from banks, meaning that the other sources of capital such as investment crowdfunding platforms remain untapped. In our view, the move of proposing investment crowdfunding regulations is commendable since it will not only control the raising of finances on crowdfunding platforms but also protect investors using such platforms through licensing, regulating and authorizing crowdfunding platforms and the operators. This will ensure that the Investment Based Crowdfunding platforms are managed well and within a legal and regulatory framework, therefore ensuring investor protection and a standardized investment crowdfunding system. However, more clarity should be provided in regard to key issues such as startups’ track record evaluation and issuer cap computation.
Disclaimer: The views expressed in this publication are those of the writers where particulars are not warranted. This publication, which is in compliance with Section 2 of the Capital Markets Authority Act Cap 485A, is meant for general information only and is not a warranty, representation, advice or solicitation of any nature. Readers are advised in all circumstances to seek the advice of a registered investment advisor.

- Talk to us
- Kenya
- P.O Box 20695 - 00200, Nairobi, Kenya
- Cell +254709101200
- Tel +254709101200
- WhatsApp +254741676635
- United States
- +254709101200
- DOWNLOAD OUR APP
-


- Kenya
- 8th Floor, Pinetree Plaza, Kaburu Drive, Ngong Road, Nairobi, Kenya
- USA
- Suite 1150, 1775 Eye Street NW, USA, Washington DC 20006, USA
- Investments
- High Yield
- Private Equity
- Real Estate
- Real Estate
- RiverRun Estates
- Cytonn Towers
- The Ridge
- Taraji Heights
- The Alma