Real Estate Bubble, & Cytonn weekly #28/2021
By Research Team, Jul 18, 2021
Executive Summary
Fixed Income
During the week, T-bills were undersubscribed, with the overall subscription rate coming in at 80.3%, a decline from the 146.0% recorded the previous week attributable to the concurrent primary bonds issue. The 182-day paper recorded the highest subscription rate, receiving bids worth Kshs 11.3 bn against the offered Kshs 10.0 bn, translating to a subscription rate of 113.3%, a decline from the 194.1% recorded the previous week. The subscription rate for the 364-day paper increased to 52.7%, from 43.2% recorded the previous week, while the subscription rate for the 91-day paper declined to 66.8%, from 282.7% recorded the previous week. The yields on all the three papers declined; with the 91-day, 182-day and 364-day paper declining by 9.4 bps, 11.7 bps and 7.0 bps, to 6.5%, 7.0% and 7.5%, respectively. In the Primary Bond Market, there was an oversubscription for this month’s bond offers, FXD1/2012/15, FXD1/2018/15 and FXD1/2012/25, with the overall subscription rate coming in at 194.9%, attributable to the ample liquidity in the money market.
During the week, the Energy and Petroleum Regulatory Authority (EPRA) released their monthly statement on the maximum wholesale and retail prices for fuel prices in Kenya effective 15th July 2021 to 14th August 2021 highlighting that the price of Super Petrol, Diesel and Kerosene remained unchanged at Kshs 127.1 per litre;
Equities
During the week, the equities market was on an upward trajectory, with NASI, NSE 20 and NSE 25 gaining by 2.0%, 1.1% and 1.0%, respectively, taking their YTD performance to gains of 17.5%, 5.3% and 14.4% for NASI, NSE 20 and NSE 25, respectively. The equities market performance was mainly driven by gains recorded by stocks such as Diamond Trust Bank (DTB-K), Bamburi and Safaricom of 12.3%, 4.7% and 3.3%, respectively. The gains were however weighted down by losses recorded by BAT and KCB Group which declined by 2.3% and 1.4%, respectively. During the week, the Ethiopian Communications Authority (ECA) announced the formal issuance of a Telecommunications Operator License to the Global Partnership for Ethiopia (GPE) consortium which had successfully bid USD 850.0 mn (Kshs 91.8 bn) for the telecommunications license. The GPE consortium consists of Safaricom, Sumitomo Corporation, CDC Group Plc and Vodacom with shareholdings of 55.7%, 27.2%, 10.9% and 6.2%, respectively;
Real Estate
During the week, two industry reports were released, namely; Tourism Research Institute’s International Tourism Performance Report January to June 2021, and, Architectural Association of Kenya’s (AAK) Status of the Built Environment Report January-June-2021. In the residential sector, the Harambee Investment Cooperative Society (HICS), the investment vehicle of Harambee Sacco, announced that it is seeking a joint venture partnership with African Development Bank (AfDB) to develop affordable housing units for 596 of its members hence put to use the land they purchase. In the infrastructure sector, the Kenya Roads Board (KRB), the agency overseeing development of roads in Kenya, announced that the estimated value of roads in Kenya is currently at Kshs 3.5 tn. Also, the Cabinet Secretary for Ministry of Transport, Infrastructure, Housing and Urban Development, Hon. James Macharia, announced that the 27.0 Km Nairobi Expressway project will be completed by February 2022. Finally, the Nairobi Metropolitan Services (NMS) through its Deputy Director General, Hon. Kang’ethe Thuku announced that the upgrade of the e-construction permit system which includes the Quick Response (QR) Code System was complete and will be ready to operate beginning August 2021;
Focus of the Week
Real estate bubble is the increase in property prices in the market owed to increased demand against limited supply, leading to a situation where the average population cannot afford the price of properties, and an eventual slump in the demand for the properties in what is called a ‘burst’. Given the recurring question as to whether there is a bubble, we periodically review the topic. This week we analyze the situation in Kenya and to learn from the housing crash in the United States of America (USA) in the 2007-2008 Financial Crisis, and eventually make recommendations on how to prevent the occurrence of a real estate bubble within Kenya;
Investment Updates:
- Weekly Rates:
- Cytonn Money Market Fund closed the week at a yield of 10.68 %. To invest, just dial *809#;
- Cytonn High Yield Fund closed the week at a yield of 15.80% p.a. To invest, email us at sales@cytonn.com and to withdraw the interest you just dial *809#;
- We continue to offer Wealth Management Training daily, from 9:00 am to 11:00 am, through our Cytonn Foundation. The training aims to grow financial literacy among the general public. To register for any of our Wealth Management Trainings, click here;
- If interested in our Private Wealth Management Training for your employees or investment group, please get in touch with us through wmt@cytonn.com;
- Cytonn Insurance Agency acts as an intermediary for those looking to secure their assets and loved ones’ future through insurance namely; Motor, Medical, Life, Property, WIBA, Credit and Fire and Burglary insurance covers. For assistance, get in touch with us through insuranceagency@cytonn.com;
- Cytonnaire Savings and Credit Co-operative Society Limited (SACCO) provides a savings and investments avenue to help you in your financial planning journey. To enjoy competitive investment returns, kindly get in touch with us through clientservices@cytonn.com;
Real Estate Updates:
- For an exclusive tour of Cytonn’s real estate developments, visit: Sharp Investor's Tour, and for more information, email us at sales@cytonn.com;
- Phase 3 of The Alma is now ready for occupation. To rent please email properties@cytonn.com;
- We have 10 investment-ready projects, offering attractive development and buyer targeted returns. See further details here: Summary of Investment-ready Projects;
- For recent news about the group, see our news section here.
Hospitality Updates:
- We currently have promotions for Staycations, visit cysuites.com/offers for details or email us at sales@cysuites.com;
Money Markets, T-Bills & T-Bonds Primary Auction:
During the week, T-bills were undersubscribed, with the overall subscription rate coming in at 80.3%, a decline from the 146.0% recorded the previous week attributable the concurrent primary bonds issue. The 182-day paper recorded the highest subscription rate, receiving bids worth Kshs 11.3 bn against the offered amount of Kshs 10.0 bn, translating to a subscription rate of 113.3%, a decline from the 194.1% recorded the previous week. The subscription rate for the 364-day paper increased to 52.7%, from 43.2% recorded the previous week, while the subscription rate for the 91-day paper declining to 66.8%, from 282.7% recorded the previous week. The yields on all the three papers declined; with the 91-day, 182-day and 364-day paper declining by 9.4 bps, 11.7 bps and 7.0 bps, to 6.5%, 7.0% and 7.5%, respectively. The government continued to reject expensive bids, accepting Kshs 19.2 bn out of the Kshs 19.3 bn worth of bids received, translating to an acceptance rate of 99.6%.
In the Primary Bond Market, the three bonds reopened by the government for the month of July recorded an oversubscription of 194.9% attributable to the high liquidity in the market during the duration of the bond sale. The government sought to raise Kshs 60.0 bn in the three-tranche bond and accepted Kshs 79.9 bn out of the Kshs 116.9 bn worth of bids received, translating to an acceptance rate of 68.4%. Investors preferred the shorter dated paper, FXD1/2012/15, with an effective tenor to maturity of 6.2 years, which received bids worth Kshs 48.8 bn, , FXD1/2021/25 received bids worth Kshs 39.9 bn while FXD1/2018/15 received bids worth Kshs 28.2 bn. The coupons for the bonds were 11.0%, 12.7% and 13.9%, and the weighted average yield rates during the issues were 11.6%, 12.6% and 13.9% for FXD1/2012/15, FXD1/2018/15 and FXD1/2021/25, respectively.
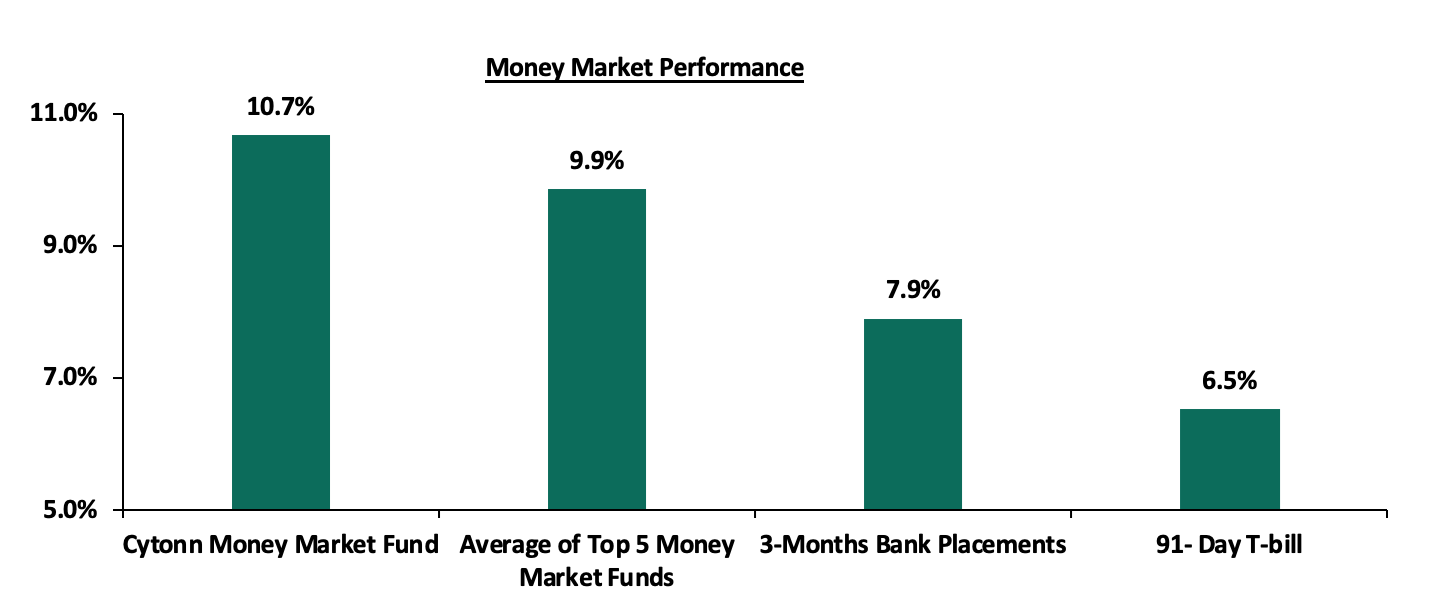
In the money markets, 3-month bank placements ended at 7.9% (based on what we have been offered by various banks), while the 91-day T-bill declined by 9.4 bps to 6.5% from 6.6%, recorded the previous week. The average yield of the Top 5 Money Market Funds increased marginally by 0.1% points to 9.9% from 9.8%, recorded the previous week, while the yield on the Cytonn Money Market (CMMF) increased by 0.5% points to 10.7% from 10.2%, recorded the previous week.
The table below shows the Money Market Fund Yields for Kenyan Fund Managers as published on 16th July 2021:
|
Money Market Fund Yield for Fund Managers as published on 16th July 2021 |
|||
|
Rank |
Fund Manager |
Daily Yield |
Effective Annual Rate |
|
1 |
Cytonn Money Market Fund |
10.14% |
10.68% |
|
2 |
Nabo Africa Money Market Fund |
9.52% |
9.95% |
|
3 |
Zimele Money Market Fund |
9.56% |
9.91% |
|
4 |
Madison Money Market Fund |
8.97% |
9.39% |
|
5 |
CIC Money Market Fund |
9.04% |
9.37% |
|
6 |
Sanlam Money Market Fund |
8.94% |
9.35% |
|
7 |
Orient Kasha Money Market Fund |
8.89% |
9.27% |
|
8 |
Co-op Money Market Fund |
8.55% |
8.92% |
|
9 |
GenCapHela Imara Money Market Fund |
8.40% |
8.76% |
|
10 |
Dry Associates Money Market Fund |
8.31% |
8.63% |
|
11 |
British-American Money Market Fund |
8.21% |
8.53% |
|
12 |
ICEA Lion Money Market Fund |
7.99% |
8.32% |
|
13 |
NCBA Money Market Fund |
8.01% |
8.31% |
|
14 |
Apollo Money Market Fund |
8.40% |
8.27% |
|
15 |
Old Mutual Money Market Fund |
6.74% |
6.95% |
|
16 |
AA Kenya Shillings Fund |
6.73% |
6.94% |
Source: Business Daily
Liquidity:
During the week, liquidity in the money market eased, with the average interbank rate decreasing to 4.2% from 4.9% recorded the previous week, partly attributable to government payments, including Term Auction Deposits (TADs) maturities of Kshs 81.3 bn which offset the settlements of government securities and tax remittances. The average interbank volumes traded declined by 58.4% to Kshs 4.6 bn, from Kshs 11.0 bn recorded the previous week.
Kenya Eurobonds:
During the week, the yields on the Eurobonds recorded a mixed performance. The yields on the 10-year bond issued in 2014 remained unchanged at 3.3%, while the yields on the Eurobonds issued in 2018, 2019 and 2021 declined by 0.1% points as shown in the table below:
|
Kenya Eurobond Performance |
||||||
|
|
2014 |
2018 |
2019 |
2021 |
||
|
Date |
10-year issue |
10-year issue |
30-year issue |
7-year issue |
12-year issue |
12-year issue |
|
31-Dec-20 |
3.9% |
5.2% |
7.0% |
4.9% |
5.9% |
- |
|
30-Jun-21 |
3.3% |
5.4% |
7.4% |
4.8% |
6.3% |
6.3% |
|
09-Jul-21 |
3.3% |
5.4% |
7.4% |
4.9% |
6.3% |
6.3% |
|
12-Jul-21 |
3.3% |
5.4% |
7.4% |
4.8% |
6.3% |
6.3% |
|
13-Jul-21 |
3.3% |
5.4% |
7.4% |
4.8% |
6.3% |
6.3% |
|
14-Jul-21 |
3.3% |
5.4% |
7.4% |
4.8% |
6.3% |
6.2% |
|
15-Jul-21 |
3.3% |
5.3% |
7.3% |
4.8% |
6.2% |
6.2% |
|
16-Jul-21 |
3.3% |
5.3% |
7.3% |
4.8% |
6.2% |
6.2% |
|
Weekly Change |
0.0% |
(0.1%) |
(0.1%) |
(0.1%) |
(0.1%) |
(0.1%) |
|
MTD Change |
0.0% |
(0.1%) |
(0.1%) |
0.0% |
0.0% |
(0.1%) |
|
YTD Change |
(0.6%) |
0.1% |
0.3% |
(0.1%) |
0.3% |
- |
Source: Reuters
Kenya Shilling:
During the week, the Kenyan shilling depreciated marginally by 0.2% against the US dollar closing at Kshs 108.2, from 108.0 recorded the previous week, attributable to increased dollar demand. On a YTD basis, the shilling has appreciated by 0.9% against the dollar, in comparison to the 7.7% depreciation recorded in 2020. Despite the recent appreciation of the shilling, we expect the shilling to remain under pressure in 2021 as a result of:
- Rising uncertainties in the global market due to the Coronavirus pandemic, which has seen investors continue to prefer holding their investments in dollars and other hard currencies and commodities,
- The widened current account position which increased by 0.3% points to 5.5% of GDP in the 12 months to May 2021 from 5.2% of GDP for a similar period in 2020 attributable to lower service receipts, which offset the increased receipts from exports and remittances, and,
- Demand from merchandise traders as they beef up their hard currency positions in anticipation for more trading partners reopening their economies globally.
The shilling is however expected to be supported by:
- The Forex reserves, currently at USD 9.6 bn (equivalent to 5.9 months of import cover), which is above the statutory requirement of maintaining at least 4.0-months of import cover, and the EAC region’s convergence criteria of 4.5-months of import cover, and,
- Improving diaspora remittances evidenced by a 6.0% y/y increase to USD 305.9 mn in June 2021, from USD 288.5 mn recorded over the same period in 2020, which has continued to cushion the shilling against further depreciation.
Weekly Highlights:
I. Fuel Prices
During the week, the Energy and Petroleum Regulatory Authority (EPRA) released their monthly statement on the maximum wholesale and retail prices for fuel prices in Kenya effective 15th July 2021 to 14th August 2021. Below are the key take-outs from the statement:
- The price of Super Petrol, Diesel and Kerosene remained unchanged at Kshs 127.1 per litre, Kshs 107.7 per litre, and Kshs 97.9 per litre, respectively, despite increased landed cost of imported crude. Notably, this is the fourth consecutive month that the Diesel and Kerosene prices have remained unchanged,
- Below is the summary of the performance of the imported petroleum during the month
- The increase in the average landed cost of imported Super Petrol by 4.8% to USD 520.0 per cubic meter in June 2021, from USD 496.1 per cubic meter in May 2021,
- The increase in the average landed costs for Diesel by 3.7% to USD 479.0 per cubic meter in June 2021, from USD 462.0 per cubic meter in May 2021,
- The average landed cost for kerosene, remained unchanged at USD 449.4 per cubic meter in June 2021,
- The decline in the Free on Board (FOB) price of Murban crude oil in June 2021 by 6.4% to USD 63.4 per barrel, from USD 67.7 per barrel in May 2021, and,
- The Kenyan shilling depreciated by 0.2% against the dollar to close at Kshs 107.8 in June 2021, from Kshs 107.6 in May 2021.
We expect pressure on the inflation basket going forward given the projected increase in global fuel prices which have increased by 45.6% on a year to date to USD 73.1 per barrel this week, from USD 50.2 in December 2020. These are the highest prices we have seen over the last two years. The rise in global prices is attributable to the rise in demand for oil in tandem with the reopening of global economies, with the rise in demand outpacing supply growth despite Organization of the Oil Exporting Countries (OPEC) agreeing to ease supply cuts.
Rates in the fixed income market have remained relatively stable due to sufficient levels of liquidity in the money markets, coupled with the discipline by the Central Bank to reject expensive bids. The government is 36.8% ahead of its prorated borrowing target of Kshs 38.0 bn having borrowed Kshs 52.0 bn in FY’2021/2022. We expect the government to fall short of its revenue collection target in FY’2021/2022 leading to a higher budget deficit as a percentage of the GDP, than the projected 7.5%. However, despite the projected high budget deficit and the lower credit rating from S&P Global to 'B' from 'B+', we believe that the monetary support from the IMF and World Bank will mean that the interest rate environment may stabilize since the government will not be desperate for cash.
Markets Performance
During the week, the equities market was on an upward trajectory, with NASI, NSE 20 and NSE 25 gaining by 2.0%, 1.1% and 1.0%, respectively, taking their YTD performance to gains of 17.5%, 5.3% and 14.4% for NASI, NSE 20 and NSE 25, respectively. The equities market performance was mainly driven by gains recorded by stocks such as Diamond Trust Bank (DTB-K), Bamburi and Safaricom of 12.3%, 4.7% and 3.3%, respectively. The gains were however weighted down by losses recorded by BAT and KCB Group which declined by 2.3% and 1.4%, respectively.
During the week, equities turnover declined by 32.5% to USD 16.9 mn, from USD 25.1 mn recorded the previous week, taking the YTD turnover to USD 694.4 mn. Foreign investors turned net buyers, with a net buying position of USD 1.0 mn, from a net selling position of USD 0.6 mn recorded the previous week, taking the YTD net selling position to USD 25.2 mn.
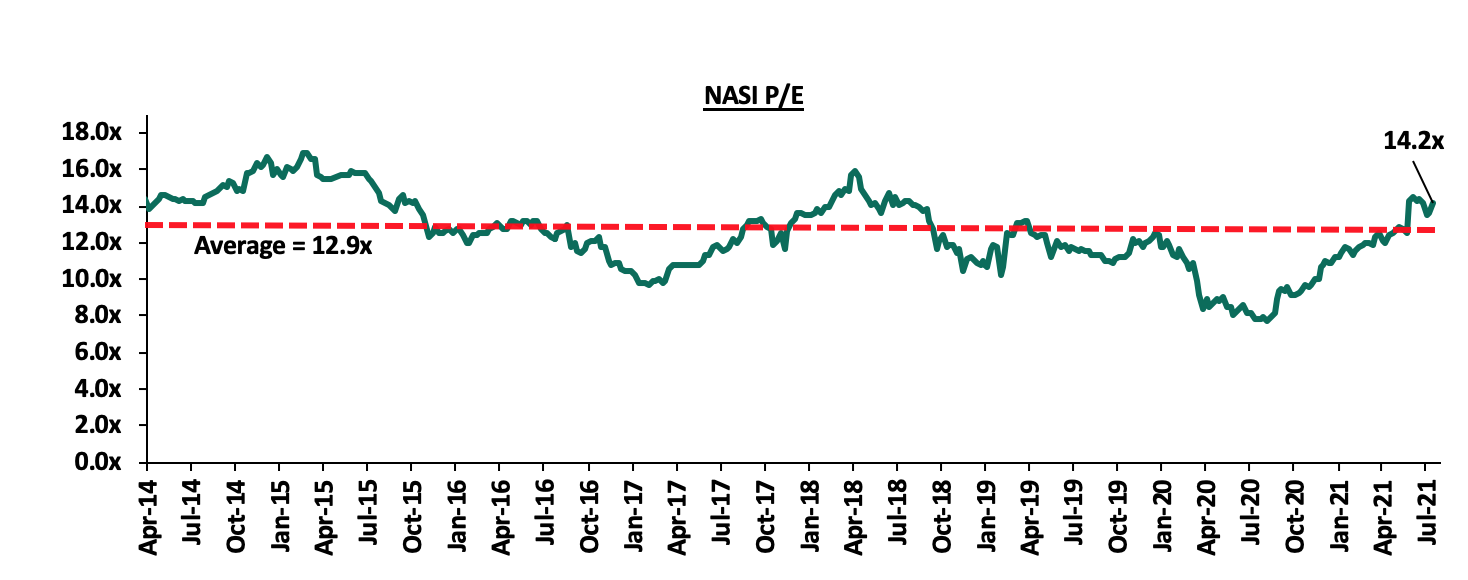
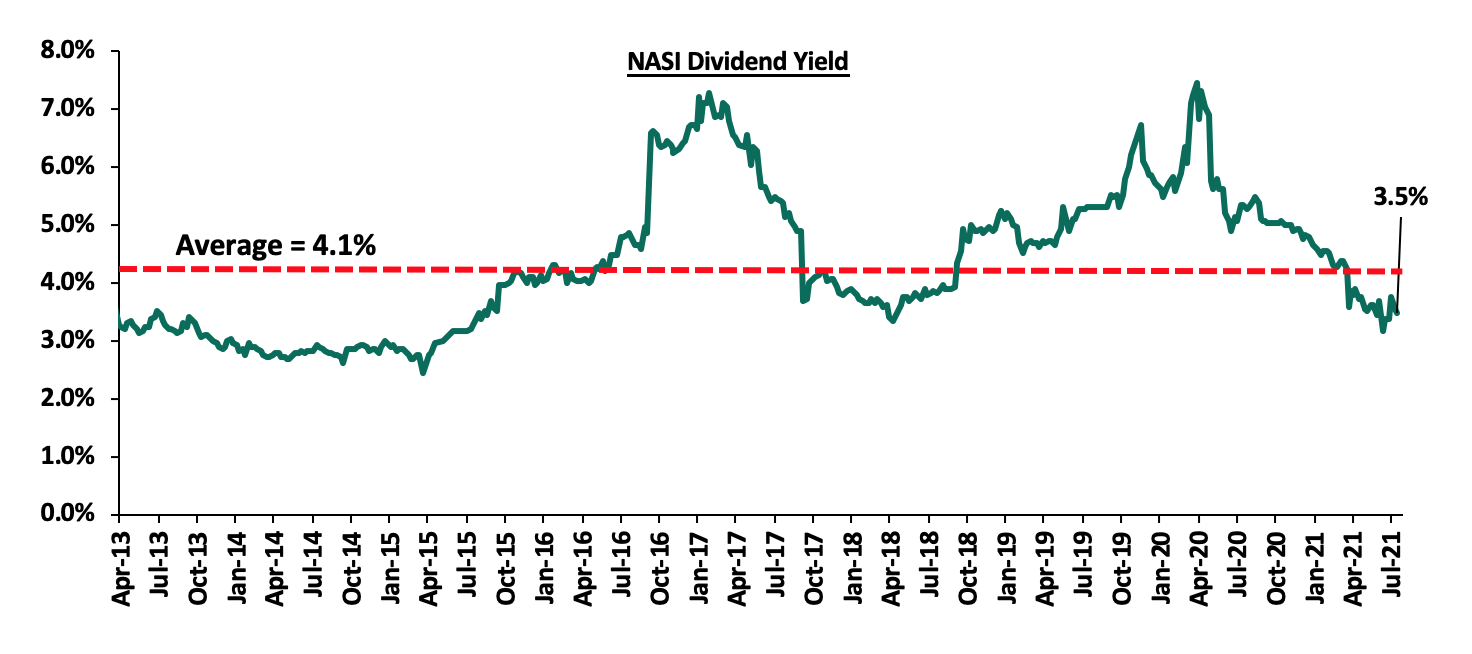
The market is currently trading at a price to earnings ratio (P/E) of 14.2x, 10.1% above the historical average of 12.9x, and a dividend yield of 3.5%, 0.5% points below the historical average of 4.0%. Key to note, NASI’s PEG ratio currently stands at 1.6x, an indication that the market is trading at a premium to its future earnings growth. Basically, a PEG ratio greater than 1.0x indicates the market may be overvalued while a PEG ratio less than 1.0x indicates that the market is undervalued. Excluding Safaricom, the market is trading at a P/E ratio of 12.7x and a PEG ratio of 1.4x. The current P/E valuation of 14.2x is 84.7% above the most recent trough valuation of 7.7x experienced in the first week of August 2020. The charts below indicate the historical P/E and dividend yields of the market.
Weekly Highlight:
During the week, the Ethiopian Communications Authority (ECA) announced the formal issuance of a Telecommunications Operator License to the Global Partnership for Ethiopia (GPE) consortium which had successfully bid USD 850.0 mn (Kshs 91.8 bn) for the telco license. The GPE consortium consists of Safaricom, Sumitomo Corporation, CDC Group Plc and Vodacom with shareholdings of 55.7%, 27.2%, 10.9% and 6.2%, respectively. GPE, which has been incorporated as Safaricom Telecommunications Ethiopia PLC, has been granted a nationwide full-service Telecommunications Service License valid for a period of 15 years, effective 9th July 2021, and is renewable for an additional term of 15 years subject to the fulfillment of all license obligations. The formal issuance of the license will make Safaricom the second telecommunications operator and the first private telecoms operator in Ethiopia. The telecommunications industry in Ethiopia is dominated by Ethio-Telecom, which is a State Owned Enterprise with 50.7 mn subscribers, translating to a mobile penetration rate of 43.3%. The entry of GPE marks a significant step in Ethiopia’s liberalization of the communications sector. Safaricom Telecommunications Ethiopia plans to begin operations in 2022, with the aim of attracting 21.0 mn new mobile subscribers in the first year of operations.
On the flip side, the armed conflict in Ethiopia poses a challenge for the venture due to the current political instability in the country. Financing of the venture has also been complicated as a result of the conflict, with the US International Development Finance Corporation (DFC), which had agreed to offer financing of up to USD 500.0 mn (Kshs 54.1 bn), threatening to cancel the financing on account of the escalating conflict in the region. Key to note, Ethiopia is currently under sanctions by the United States and the financing for GPE had been provided as an exception to the consortium. The cancellation of the loan would force Safaricom to seek alternative financing at a higher cost or dig into its cash reserves, which could affect its Net Profit margins, which stood at 26.6% as at H1’2021.
Universe of Coverage:
Below is a summary of our universe of coverage and the recommendations:
|
Company |
Price as at 09/07/2021 |
Price as at 16/07/2021 |
w/w change |
YTD Change |
Year Open 2021 |
Target Price* |
Dividend Yield |
Upside/ Downside** |
P/TBv Multiple |
Recommendation |
|
I&M Group*** |
21.6 |
21.5 |
(0.2%) |
(52.1%) |
44.9 |
29.8 |
10.5% |
49.1% |
0.3x |
Buy |
|
Kenya Reinsurance |
2.4 |
2.5 |
3.3% |
8.7% |
2.3 |
3.1 |
4.0% |
27.5% |
0.3x |
Buy |
|
NCBA*** |
26.0 |
26.0 |
(0.2%) |
(2.4%) |
26.6 |
29.5 |
5.8% |
19.5% |
0.6x |
Accumulate |
|
Stanbic Holdings |
80.0 |
82.8 |
3.4% |
(2.6%) |
85.0 |
90.5 |
4.6% |
14.0% |
0.8x |
Accumulate |
|
Sanlam |
10.2 |
11.0 |
8.4% |
(15.4%) |
13.0 |
12.4 |
0.0% |
12.7% |
1.0x |
Accumulate |
|
Standard Chartered*** |
129.5 |
129.8 |
0.2% |
(10.2%) |
144.5 |
134.5 |
8.1% |
11.8% |
0.9x |
Accumulate |
|
KCB Group*** |
45.5 |
44.9 |
(1.4%) |
16.8% |
38.4 |
48.6 |
2.2% |
10.6% |
1.1x |
Accumulate |
|
Co-op Bank*** |
13.5 |
13.5 |
0.0% |
7.6% |
12.6 |
13.8 |
7.4% |
9.6% |
0.9x |
Hold |
|
Liberty Holdings |
8.0 |
7.8 |
(2.5%) |
1.3% |
7.7 |
8.4 |
0.0% |
7.7% |
0.6x |
Hold |
|
ABSA Bank*** |
10.1 |
10.0 |
(0.5%) |
5.0% |
9.5 |
10.7 |
0.0% |
7.0% |
1.1x |
Hold |
|
Diamond Trust Bank*** |
59.0 |
66.3 |
12.3% |
(13.7%) |
76.8 |
70.0 |
0.0% |
5.7% |
0.3x |
Hold |
|
Equity Group*** |
49.0 |
48.6 |
(0.9%) |
33.9% |
36.3 |
51.2 |
0.0% |
5.5% |
1.4x |
Hold |
|
Britam |
7.5 |
7.5 |
0.3% |
7.4% |
7.0 |
6.7 |
0.0% |
(10.9%) |
1.4x |
Sell |
|
Jubilee Holdings |
390.0 |
385.0 |
(1.3%) |
39.6% |
275.8 |
330.9 |
2.3% |
(11.7%) |
0.8x |
Sell |
|
HF Group |
3.9 |
3.7 |
(5.1%) |
17.8% |
3.1 |
3.2 |
0.0% |
(13.5%) |
0.2x |
Sell |
|
CIC Group |
3.4 |
2.6 |
(22.1%) |
25.1% |
2.1 |
1.8 |
0.0% |
(31.8%) |
0.9x |
Sell |
|
Target Price as per Cytonn Analyst estimates **Upside/ (Downside) is adjusted for Dividend Yield ***For Disclosure, these are stocks in which Cytonn and/or its affiliates are invested in Key to note, I&M Holdings YTD share price change is mainly attributable to counter trading ex-bonus issue. |
||||||||||
We are “Neutral” on the Equities markets in the short term. With the market currently trading at a premium to its future growth (PEG Ratio at 1.6x), we believe that investors should reposition towards companies with a strong earnings growth and are trading at discounts to their intrinsic value. Additionally, we expect the recent discovery of new strains of COVID-19 coupled with the introduction of strict lockdown measures in major economies to continue dampening the economic outlook.
I. Industry reports
During the week, the Ministry of Tourism through the Tourism Research Institute released the International Tourism Performance Report January to June 2021, highlighting the performance in the number of tourism international arrivals between January and June 2021. The key highlights were;
- Kenya registered a 21.7% decline in the number of international arrivals to 305,635 persons between January and June 2021, when compared to a similar period in 2020, attributed to partial lockdowns and flight travel restrictions imposed in the country as containment measures for the pandemic when the first case of Covid-19 was announced in March 2020,
- The highest number of visitor arrivals were from the United States of America (USA) and Uganda, which registered total number of tourists at 49,178 and 31,418, respectively, attributed to the lifting of travel advisories and bans into the country,
- In terms of purpose of visit 105,057 came in for business purposes; 184,767 came in for leisure, and 15,811 were in transit. The improvement in the number of international arrivals during the first half of 2021 compared to the second half of 2020, is attributable to the gradual reopening of the country coupled with incentives to boost recovery of the hospitality and tourism sectors, and,
- There has been a significant recovery on visitor arrivals post the covid pandemic.
The graph below shows the number of international arrivals from January 2020 to June 2021;
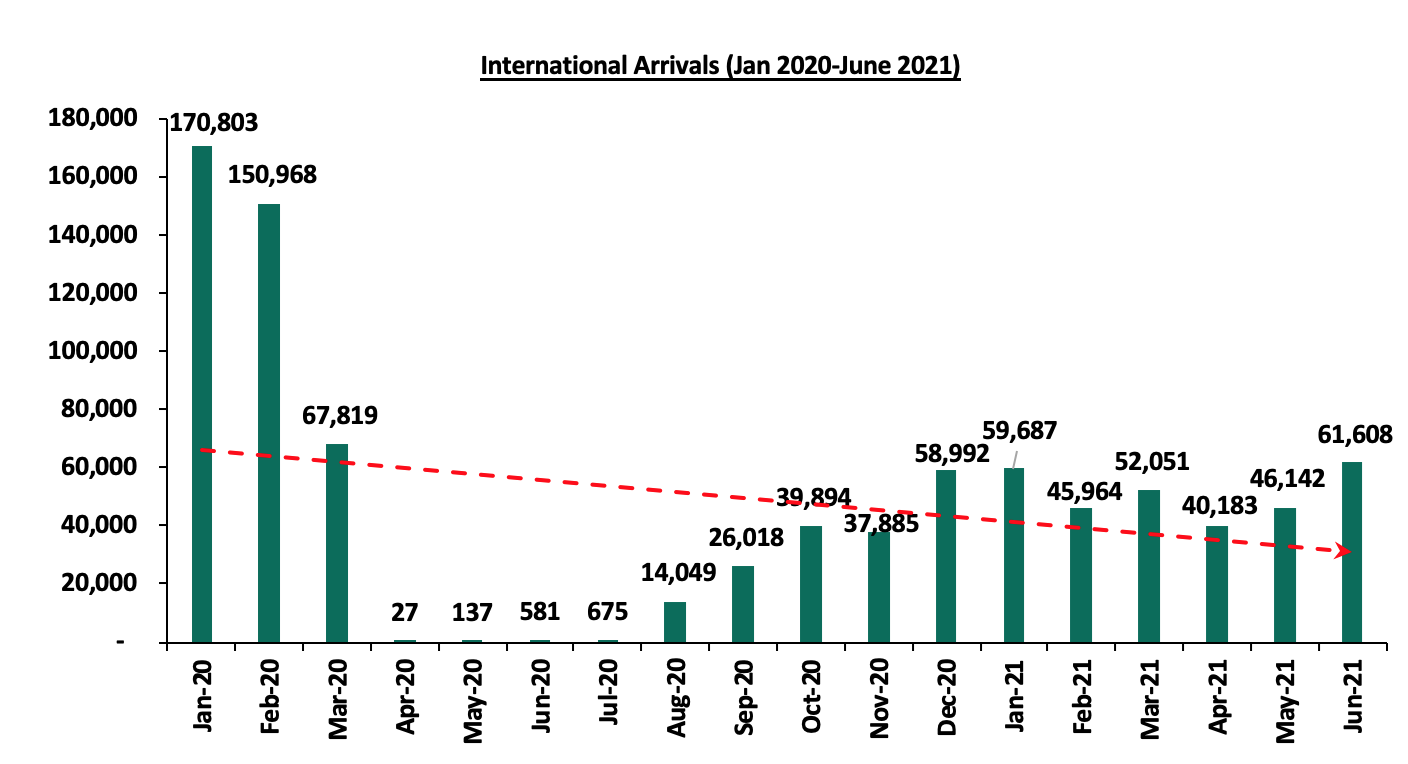
Source: Tourism Research Institute
Despite the decline realized in the aforementioned period, we expect the number of international arrivals to improve attributed to the ease in travel restrictions, with the US having eased their travel advisory to level two down from level four, and the government having lifted the travel ban between Kenya and the UK, in June 2021. The move is expected to positively influence performance of the hospitality sector which heavily relies on tourism sector.
The Architectural Association of Kenya (AAK) released the Status of the Built Environment Report January-June-2021, and the key take-outs were as follows;
- The construction industry is expected grow to 4.5% in 2021 as the sector recovers from the negative impact of the COVID-19 pandemic, with medium term growth expected to be driven by large-scale road and related infrastructure projects, for which construction is likely to begin in 2022 and which will inject renewed momentum in the Kenyan transport infrastructure sector.
The importance of real estate and construction sectors as measured by their contribution to GDP continues to raise as shown in the table below;
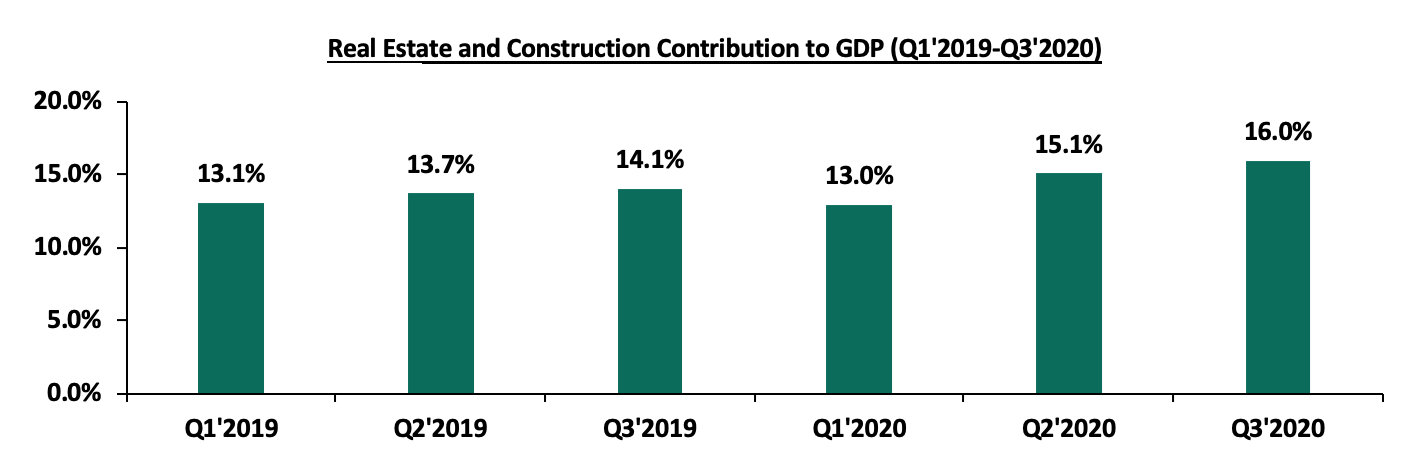
Source: Kenya National Bureau of Statistics
Other highlights include;
- The cost of 70.0% of the projects undertaken during the period ranged between Kshs 5.0 mn and Kshs. 50.0 mn. Projects whose cost ranged between Kshs 500 mn and Kshs 1.0 bn were the least undertaken, attributed to the reduced activity by the large developers due to slower demand due to lower spending power brought about by the tough economic condition,
- The Architectural association of Kenya (AAK), has developed a national green building certification tool dubbed Safari Green Building Index, designed to assess projects in the local built setting to establish their environmental performance. The tool will be launched in August 2021 by the association, with an aim of boosting investor confidence into green building developments hence improve the number of green buildings in Kenya, and,
- Cumulatively, Shelter Afrique has delivered an estimated 22,673 units, housing 113,365 people, while committing to ensuring delivery of 4,416 EDGE Compliant affordable housing units across Africa, in line with its 2021-2025 corporate strategy.
We expect more development activities in the built environment attributable to factors such as government and private sector aggressiveness to implement major infrastructure and housing projects amidst the pandemic, improved building approval processes, and the gradual opening of the economy.
II. Residential Sector
During the week, the Harambee Investment Cooperative Society (HICS), the investment vehicle of Harambee Sacco, announced that it is seeking a joint venture partnership with African Development Bank (AfDB), a regional multilateral development finance institution, to develop affordable housing units for 596 of its members. Some of the key projects the sacco has undertaken include, the 10.0 acres at Kantafu along Kangundo Road, 40.0 acres in Nakuru, and 145.5 acres in Eldoret. The total asset base of the Sacco stood at Kshs 616.0 mn as at December 2020, and the Society is seeking to grow its asset base to more than Kshs 1.0 bn by December 2021, through the real estate joint venture development initiative as they promote home ownership.
AfDB has been aggressively initiating strategies in support of the affordable housing initiative aimed at increasing home ownership through various ways such as; i) aiding private and public sector institutions in identification and implementation of affordable housing schemes, ii) finance provision for housing developments, and, iii) provision of technical assistance for capacity building. The institution also committed Kshs 10.0 bn in August 2020, to the planned Kenya Mortgage Refinance Commission (KMRC) green bond, to facilitate issuing of home loans by financial institutions at single digit value of approximately 7.0%, 3.9% lower than the average market lending rate of 10.9% as at 2020. Despite the efforts by the institution to support the housing initiative in Kenya, home ownership rates are still low at 21.3% as at 2020, compared to other countries in the world attributed to; i) difficulties in access to credit loans and mortgages coupled with their higher interest rates, ii) higher development costs, and, iii) inadequate infrastructure impeding property investment opportunities.
The graph below shows the percentage of home ownership in different countries compared to Kenya;
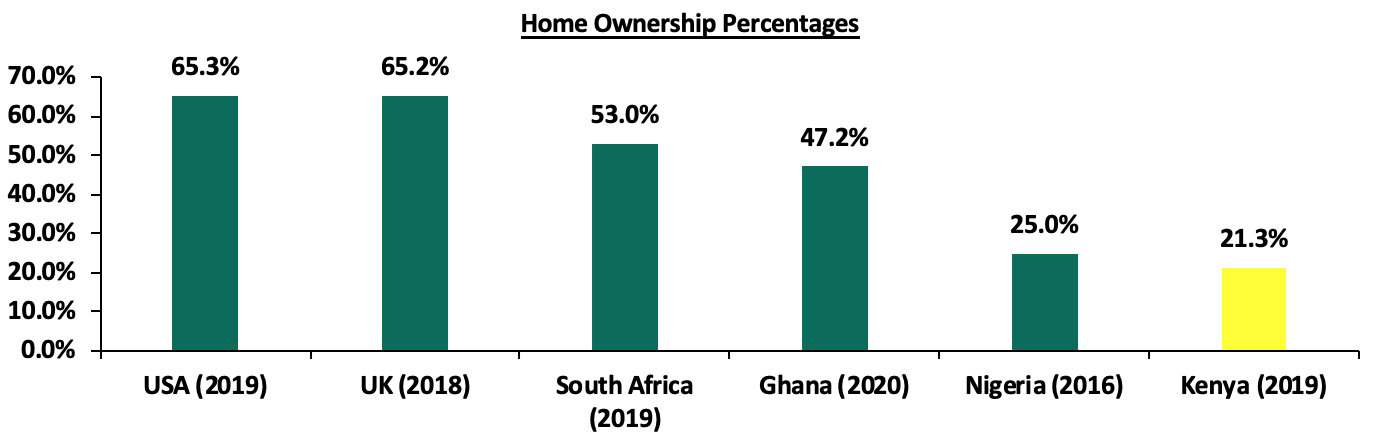
Source: Centre for Affordable Housing Finance in Africa
In our view, if the partnership is successful, it will be a step in the right direction towards providing affordable housing solutions at a time when the pandemic continues to affect disposable incomes thus limiting purchasing power of homebuyers. The move is expected to gain traction from other SACCOs too, which if implemented will contribute to increased home ownership in the country. The residential sector performance is expected to improve supported by focus on affordable housing with an aim of improving home ownership with the private sector aiming to provide solutions on the same while cashing in on the benefits.
III. Infrastructure Sector
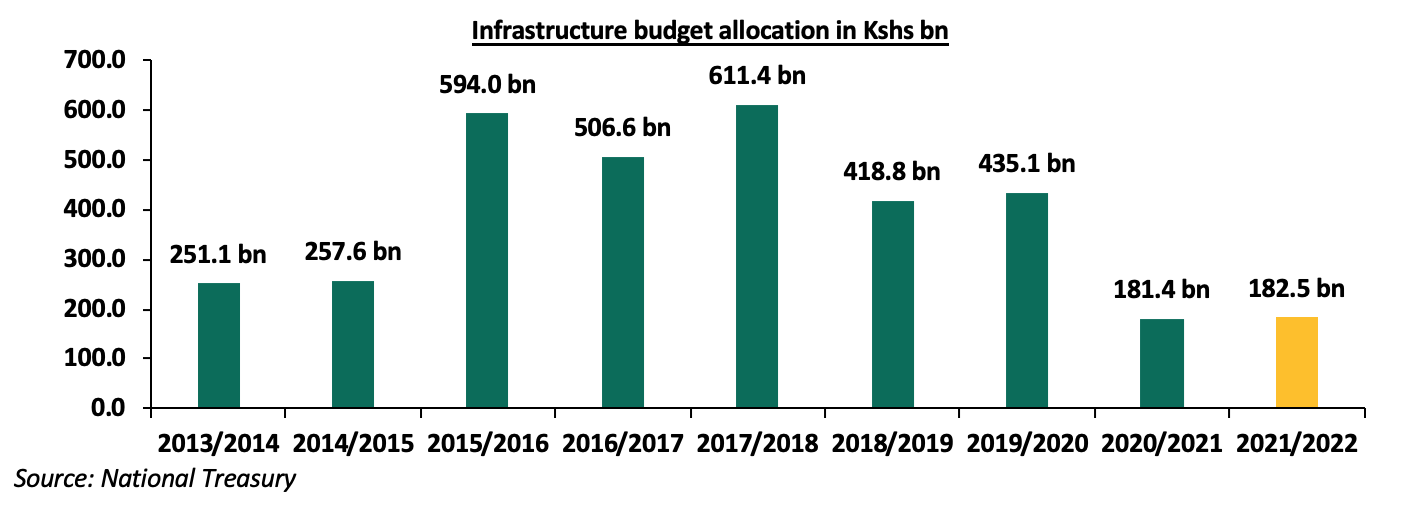
During the week, the Kenya Roads Board (KRB), the agency overseeing development of roads in Kenya, announced that the estimated value of roads in Kenya is currently stands at at Kshs 3.5 tn, in a valuation tender seeking consultants to conduct a two-year survey on the condition of Kenyan roads. KRB is aiming to provide insight into the condition of the roads and help in making the right maintenance and capital plans considering the valuation is even more than Kenya’s Kshs 3.0 tn budget. According to KRB data, Kenya registered 53.5% points increase in the number of road networks from 76,100 km registered in 2014 to 163,821 km realized in June 2019 attributed to continued increased budgetary allocation towards road construction and maintenance between that period. This points out to the huge spending on public infrastructure by the government which continues to aim at increasing accessibility and reliability of transport in the country thus open up areas for investment and improvement of economic status.
The graph below shows the budget allocation to the infrastructure sector over the last nine financial years;
Also, the Cabinet Secretary for Ministry of Transport, Infrastructure, Housing and Urban Development, Hon. James Macharia, announced that the 27.0 Km Nairobi Expressway project will be completed by February 2022. The Kshs 63.0 bn road project kicked off in June 2020 as a Public Private Partnership project between the national government through the Kenya National Highways Authority (KENHA) and the China Road and Bridge Construction Corporation (CRBC) on a Build-Operate-Transfer (BOT) model, and was expected to be completed by December 2022. However, the need to fast track the completion of the project arose amidst traffic concerns caused by its construction which is currently at 60.0%, hence leading to restructuring of its completion period to an earlier date.
Upon its completion, Nairobi Expressway will be Kenya’s first road to be tolled under a Public-Private Partnership and will comprise of 11 interchanges. The highway will; i) open up surrounding areas for investment opportunities, ii) boost property prices, and, iii) improve transport services and trade activities. With other major infrastructure projects such as the Standard Gauge Railway, Nairobi Western Bypass, and Nairobi Commuter Rail Project among others which are still ongoing, we expect improved activities to be registered in the infrastructure sector attributed to the Government’s aggressiveness to implement and conclude projects despite the pandemic effects, supported by the 0.6% increase in budgetary allocation to Kshs 182.5 bn for the FY’2021/2022, from Kshs 181.4 bn allocation for FY’2020/2021.
A key highlight in the real estate sector during the week is;
- The Nairobi Metropolitan Services (NMS) through its Deputy Director General, Hon. Kang’ethe Thuku announced that the upgrade of the e-construction permit system which includes the Quick Response (QR) Code System was complete and will be ready to operate beginning August 2021. The permit system which was launched by City Hall in March 2020 to improve approval performances, was compromised in June 2021 leading to illegal approvals hence the need to further upgrade the program. With its revamp, the system will therefore eliminate the need for physical submission and stamping of hard copy development plans hence initiate easier and faster building approval process, as well as curb corruption cases. With NMS aggressiveness to facilitate easier and faster development approval processes, we expect the value of building approvals to also register improvement in performance going forward, attributed by the government and private sector aggressiveness to also implement select real estate infrastructure and housing projects despite the pandemic.
The graph below shows value for construction approvals in Nairobi from January 2020 to February 2021;
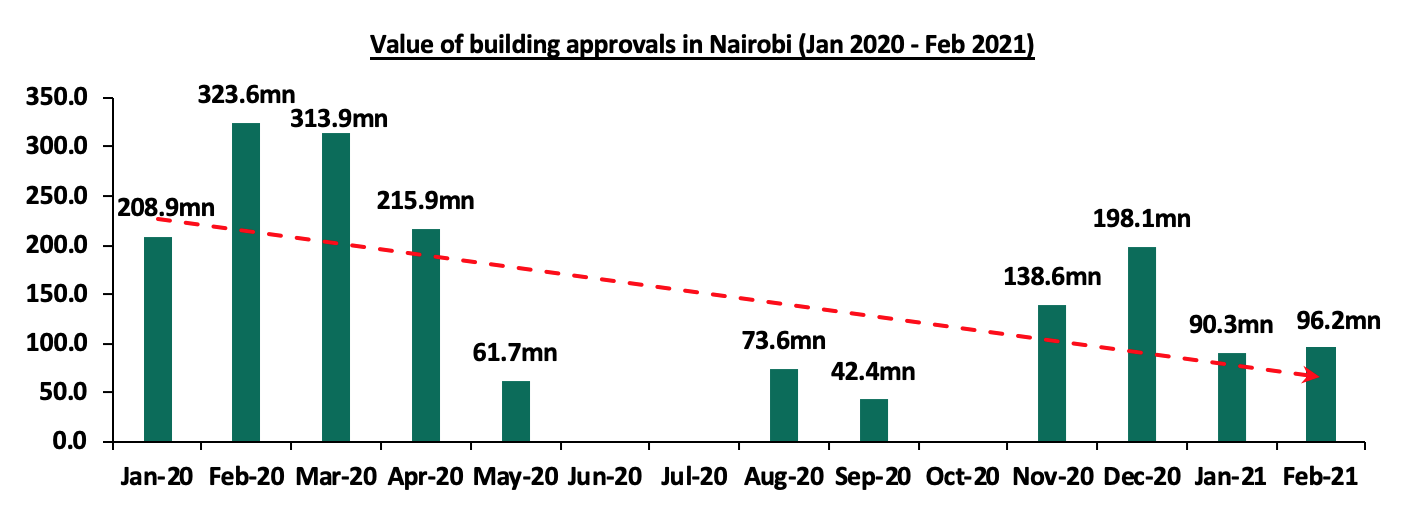
Source: Kenya National Bureau of Statistics
We expect an overall improvement in the real estate sector going forward supported by the expected growth of the construction industry, focus on the affordable housing initiative, and, increase in the number of international arrivals, infrastructure development activities, and building plan approvals.
In the beginning of 2020, we set out to address the speculation that the Kenyan market was experiencing a real estate bubble through a topical Is There a Real Estate Bubble in Kenya? We determined that there was no real estate bubble in Kenya since the market was still constrained by issues such as i) unavailability and unaffordability of credit , ii) tight credit underwriting standards from high number of non-performing loans, iii) low accessibility to mortgage financing, and, iv) slow provision of affordable housing. Thus, the sector was just experiencing the normal real estate cycles and the rapid price increments was as a result of low supply and high demand, and vice versa in select sectors. This week, we again seek to address the same concerns on whether the Kenyan market has experienced a real estate bubble through a topical as outlined below;
- Introduction to real estate bubble
- Is there real estate bubble in Kenya?
- Case Study of the 2007-2008 real estate bubble in the United States of America (USA)
- Recommendations to the government
- Conclusion:
SECTION I: Introduction to Real Estate Bubble
A real estate bubble is an increase in property prices in the market owed to increased demand against limited supply, and an eventual slump in the demand for the properties in what is called a ‘burst’. This demand is usually due to increased investors need to place huge funds in the real estate sector, majorly borrowed funds, based on speculation that the rising prices will keep on rising with hope of generating high returns.
As at Q3’2020 real estate and construction’s contribution to GDP stood at 16.0%, 0.9% points increase compared to 15.1% recorded in Q2’2020 according to Kenya National Bureau of Statistics. Prices of residential units have been rising with our Cytonn H1’2021 Markets Review showing that residential market average y/y price appreciation in H1’2021 came in at 0.6%, a 0.8 % points increase from the 0.2% average depreciation recorded FY’2020. Average prices per SQM increased to Kshs 117,873 in H1’2021 from Kshs 116,774 in FY’2020 despite real estate being was one of the hard hit sectors by COVID-19 pandemic and many would have expected price corrections. Investors are therefore contemplating whether these prices will keep rising in the future and if there is a possibility that we are, or could be headed into a real estate bubble in the country.
a). Main Features of a Real Estate Bubble
- Inflated Property Prices: A house bubble is characterized by inflated prices which are higher than mortgage valuations making it hard for investors to meet their contractual debt obligations with credit suppliers,
- Increased Uptake of Debt: One of the major characteristic of a real estate bubble is an increase in the uptake of loans and more debt supported by availability of cheaper credit, in order to buy more property for speculation, and ,
- Increase in Property Demand: Increase in property demand is brought about by speculation of rising prices and easy availability of funds from lenders. These prices rise to levels unaffordable by the general public as investors compete to put funds in the few real estate products available in the market.
b) Causes of Real Estate Bubble
- Wider Mortgage Offerings: Property bubbles are usually caused by availability of affordable mortgages by the lending institutions which are then placed in property investments with hopes of higher and higher returns,
- Access to cheaper Credit: Easier access to credit loans with low underwriting standards and the lenders relaxing caution in terms of collaterals and risk assessment measures, this coupled with low interest rates leads to rapid increase in loan uptake which attracts and facilitates increase in demand for property causing property bubble,
- Economic Prosperity: General rise in economic activities and increased prosperity in a country causes increased purchasing power of people, and the subsequent need to invest hence high demand and affordability for property causing a boom,
- Bullish Speculations for Real Estate Property Market: Real estate bubbles are caused by investor speculations that rising prices will continue to rise causing investors to borrow and invest in the properties market with the hope of higher returns leading to them taking debts and placing funds into real estate investments thereby increasing demand beyond supply and the subsequent extra ordinary rise in prices, and,
- Increase in Housing Demand: Property bubble also occurs when there is an overall genuine increase in demand for housing units against limited supply in a country, majorly from investor speculation that the rising prices will be sustained and the affordability from access to credit or economic upturn.
c) Effects of Real Estate Bubble on an Economy
- Decreased Homeownership Rates: Astonishing increased prices for properties owed to a property bubble results to decreased home ownership rates in the country due to lack of affordability, especially among the low and lower-middle income earners,
- Declined Property Development Activities: Property boom eventually results to oversupply of the properties in the market thus leading to an overall decline of developments activities in a country as investors seek to dispose available property,
- Reduced Property Investment Returns: The aftermath of a property boom in the market is the bubble burst which causes huge price corrections of existing properties in an upward scale resulting to an overall demand decline as well as decline of the investment returns, and,
- Poor Mortgage and Credit Sector Performance: Real estate bubble also causes an increased uptake of credit loans and mortgages to finance developments after which the bubble bursts, leading to high number of non-performing loans from the inability to finance debt obligations causing poor mortgage and credit performance.
SECTION II. Is There a Real Estate Bubble in Kenya?
The Kenyan real estate market is not experiencing a real estate bubble but the rise in prices is attributable to rise in demand from economic fundamentals characterized by;
- Increasing Population: Kenyan population has increased from 38.6 mn in 2009 to 47.6 mn in 2019 as evidenced by the Kenya National Bureau of Statistics Census Report 2019 with World Bank’s population and urbanization growth rates estimated at 2.6% and 4.4% respectively with an expanding middle class with extra disposable income hence increasing real demand for property unlike in a bubble where demand is fueled by speculation which is usually short term holding expecting to resell at higher prices,
- Growth in the Economy: According to the Kenya National Bureau of Statistics-Quarterly Gross Domestic Product Report economic performance in Q3’2020 remained depressed but relatively better compared to Q2’2020 with real GDP is estimated to have contracted by 1.1% in the quarter compared to 5.5% contraction in Q2’2020 which shows that the country is on a path to economic recovery.,
- Low Credit Supply: The Central Bank of Kenya Central Bank of Kenya-Quarterly Economic Review October-December 2020 indicated that the real estate sector recorded a 6.4% increase in the gross non-performing loans in Q4’2020 to Kshs 61.4bn from Kshs 57.7bn in Q3’2020. Lenders are expected to exercise a more conservative underwriting approach as a strategy to cushion themselves against the pandemic which is marked by high loan default rates.Mortgage uptakes has remained relatively low with the number of mortgage accounts at 27,993 as at 2019 compared to an adult population of 26.0 mn according to 2019 Kenya National Population and Housing Census,
- High Demand for Housing: This is evidenced by Housing Finance Africa-Kenyan Report, which highlighted that Kenya has a housing deficit of 2.0 mn units which is expected to grow by 200,000 units annually with the government expected to provide approximately 50,000 units per year with only 2.0% of these being for the low income against an annual demand of 250,000 units. According to the report, despite 83.0% of the total employment being in the informal section, this portion lacks access to mortgage due to insufficient credit risk information for meeting criteria set in the mortgage products, and,
- House Price Increase in Tandem with Increase in Income Levels: This is supported by the KNBS Economic Survey 2020 showing increase in nominal wages in both the public and private sector from Kshs 2.0 tn to Kshs 2.3 tn from 2018 to 2019 representing a 13.4% y/y increase which is higher than apartments’ price appreciation which was at 0.6% in H1’2021 as evidenced by our Cytonn H1’2021 Markets Review. This indicates that there is still room for property prices to grow in order to match population’s income.
SECTION III: Real Estate Bubble during the 2007-2008 United States of America (USA) Financial Crisis
Case study
The real estate bubble during the 2007 -2008 financial crisis stemmed from an expansion of mortgage credit in the United States of America. This came after the Federal Reserve continuously lowered the Federal Funds rate from 6.5% in May 2001 to 1.0% in June 2003. This was a move that was aimed at boosting the American economy which had earlier taken several hits including the bursting of the dot-com bubble involving excessive bullish speculation on the internet related companies in the late 1990s, a series of corporate accounting scandals and the September 11th 2001 terrorist attacks.
a) The Events Leading to the Pre-housing Crash in the United State of America (USA)
The reduction of the Federal Funds Rate led to an increase in mortgage uptake from both credit worthy and un-credit worthy individuals. This resulted in individuals with below average credit scores having access to mortgages, a situation that was not possible in the past unless such individuals were protected by government insurance. This increase in access to mortgages led to an upward spiral in home prices as mortgage borrowers took advantage of the low interest rates to buy homes, resulting in a real estate bubble. Meanwhile, banks sold these mortgage loans to banks in Wall Street which repackaged them into financial instruments such as Mortgage-Backed Securities (MBS) and Collateralized Debt Obligations (CDOs). This led to the emergence of a big secondary market for origination and distributing subprime mortgage loans.
By the year 2004, U.S. homeownership was at its peak at 69.2% according to the USA Census Bureau, the highest home ownership rate ever recorded in American history. As housing prices were rising rapidly and the number of subprime mortgages given out was rising even faster, the Federal Reserve raised the interest rate in an attempt to slow this down and avoid serious inflation. Eventually, interest rates started to rise with the Federal Reserve beginning to raise rates in June 2004, and two years later the Federal funds rate had reached 5.3%, where it remained until August 2007. Then during early 2006, the housing bubble burst as more people defaulted on their mortgage payments and home prices began falling rapidly.
This caused real hardship to many Americans especially the un-creditworthy individuals with mortgages, their homes became worth less than they paid for them due to the crash in prices in the housing sector. These individuals could not sell their houses to pay back their lenders as they wouldn’t be able to recover enough from the sale. As for those that had adjustable-rate mortgages, their costs were going up due to the rise in interest rates as the values of their homes were going down. As 2007 got underway, one subprime lender after another filed for bankruptcy with more than 25 subprime lenders going under between February and March of the same year. This was the consequence that subprime lenders had to face for lending to individuals who could not afford mortgages. These series of events led to a severe worldwide economic crisis that was considered by many economists to have been the most serious financial crisis since the Great Depression in the 1930s.
b) The Path to Recovery
The United States of America would then implement measures on the path to economic recovery including;
- The Troubled Asset Relief Program in October 2008, with much of the funds targeting troubled banks which were at a risk of collapse from the high non-performing loans and the low reserves to warrant operations,
- The Recovery and Reinvestment Act implemented in February 2009, aimed at stimulating the economy by providing funding to the energy and infrastructural projects in an aim to retain and hire new staff. This helped to jumpstart the employment sector that had been hard hit by an economic recession to enable contractual debt repayments especially for mortgages as well as compensate for a slowdown that was being experienced in the private sector that year , and,
- Payroll tax cuts which provided for temporal tax cuts to most households with a 2.0% reduction in payroll tax rates for workers in an aim to fiscally support the economy through increased income.
c) Lessons Kenya Can Derive from the Success and Failures of the United States of America (USA) Real Estate Bubble
- Proper Risk Assessment of Borrowers Before Giving Loans: During the USA financial crisis, borrowers with poor credit scores were allowed to take out mortgages that they could not afford; these are known as subprime mortgages. As the interest rates had been earlier significantly lowered by the Federal Reserve, lenders assumed that even un-credit worthy individuals would be able to afford home loans. When the interest rates were later increased in order to avoid serious inflation, subprime borrowers could no longer afford to service their loans leading to their houses being sold off or auctioned by the lenders in order to recover the borrowed amount. This led to an excessive supply of houses in the market that caused the bubble to burst. Lending institutions in Kenya should therefore conduct proper risk assessments to ascertain credit worthiness of clients before warranting loans to reduce the value of real estate non-performing loans which expose the banks to collapse,
- Proper Regulation and Monitoring of Financial Institutions: A major reason for the occurrence of the real estate bubble in the United States of America was the inadequate regulation of financial institutions in regards to transparency and conflict of interest in financial institutions. Credit rating agencies that graded subprime mortgages as ‘investment grade’ securities may have been incentivized to provide this erroneous rating due to a conflict of interest arising from them rating the issuers of the securities who paid them to conduct the rating. Regulatory authorities in Kenya such as the Central Bank of Kenya (CBK) should ensure that conflicts of interests are made known through transparent processes and addressed in order to protect investors and the economy from the consequences of such,
- Strict Penalties to Firms that Engage in Industry Malpractices and Moral Hazards: American banks gave out subprime mortgages which they sold to banks in Wall Street at a profit. Many of these mortgages were risky loans given to un-credit worthy individuals and therefore the banks did not want to keep them in their balance sheet and sold them off in order to transfer the risk to other parties. This is a case of moral hazard and industry malpractice and resulted to a lot unsecured loans. Kenya’s regulatory bodies should keep a keen eye on financial institutions to ensure ethical and lawful practices among parties and place penalties to the unlawful in order to discourage malpractices, and,
- Careful and Regular Monitoring of the Economic Policies: The US Federal Funds Rate was lowered from 6.5% in May 2001 to 1.0% in June 2003 in order to spur economic growth. This continuous lowering of the interest rate triggered the real estate bubble as borrowers were taking a high number of mortgage loans. The Federal Reserve kept on lowering the rate for 2 years with members of the Federal Open Market Committee underestimating the risk that a financial meltdown could occur in the economy. Kenya’s Monetary Policy Committee (MPC) should therefore take utmost care to regularly monitor the economic implications of altering the Central Bank Rate to allow a balance between credit risk and the need to spur economic growth through debt.
SECTION IV: Recommendations to the Government
From above it is clear that the real estate sector is not in a bubble but is experiencing normal sector cycles of in line with the economic cycles. The rise in prices is thus supported by fundamental factors such as rising demand and economic growth, creating a balance between demand and supply and not speculation. Mortgage access also remains low given the high adult population. However, to prevent a real estate bubble in the future we recommend below measures;
- Enforcing Collaterals: A real estate bubble is followed by a burst that causes a reduction in prices below investors buying price, making them unable to meet their debt obligations with the banks, exposing the banking sector to possible collapse. For these reasons, it is important to ensure that collateral is enforced in the banking system and that risk evaluation procedures for mortgage issuance are more thorough in order to guard the banking sector and other mortgage offering institutions from the effects of a real estate bubble burst,
- Economic Growth Support Policies: The government should look into supporting policies that enhance economic growth so that citizens are economically empowered with more disposable income such that they rely on savings to own homes other than loans from banks and other financial institutions,
- Public-Private Partnerships: In the case of rising housing demand in some areas, one which is unable to be meet by the existing supply, the government of Kenya may partner with the private sector through funding, subsidies, tax exempts, relaxation of zoning regulations so that construction is easier and faster to ensure that the available demand is met, and avoid unsustainable property prices brought about by excessive demand, and,
- Provision of Affordable Housing: The government should look to keep supporting affordable housing informal settlement upgrading programs through budgetary allocations and support policies to ensure that lower-middle and low middle income earners become home owners without having to go through the mortgage debt process, which when no so thorough in assessment, may leave the banking sector exposed to high non-performing loans and possible collapse.
SECTION V: Conclusion
From the research, we therefore conclude that there is no real estate bubble in Kenya as the market is constrained by low mortgage credit from relatively high interest rates, tightened underwriting standards and inaccessibility to mortgage financing especially for the informal employment sector, and thus there lacks a possibility of un-sustained demand that is likely to exceed current supply.
The sector is thus in the normal real estate cycles with the rapid rise and fall of prices attributable to interactions of forces of demand and supply in the market. For long term investors and as evidenced our Cytonn H1’2021 Markets Review opportunities lie in the different sectors as below;
|
The Key Areas of Opportunities by Theme in the Real Estate Sector |
|||
|
Sector |
Themes |
Locations |
Reasons |
|
Residential Sector |
High-End (Detached) |
Kitisuru and Rosslyn |
Annual returns at 6.5% and 5.5% respectively, against the high-end market average of 4.8% For speculative buyers, Lower Kabete recorded the highest annual uptake at 16.0% against a market average of 13.6%
|
|
Upper Mid-End (Detached) |
Redhill and Sigona, Ridgeways, Runda Mumwe and Loresho |
Highest total average returns at 6.5% for Redhill and Sigona and 6.3% for the rest against a market average of 5.8% The areas have relatively low supply of residential units |
|
|
Low-End (Detached) |
Ruiru and Syokimau/Mlolongo |
Highest total average returns at 6.6% and 6.5% against a market average of 5.5% coupled with availability and affordability of land |
|
|
Upper Mid-End (Apartments) |
Parklands and Kilimani |
Parklands recorded the highest total average annual returns at 7.6% against the segment’s market average of 5.7% while Kilimani recorded the highest annual uptake at 23.0% which is 7.7% points higher than the sector’s average |
|
|
Lower Mid-End Suburbs (Apartments) |
Waiyaki Way |
Highest total average returns at 8.1% against a market average of 6.2% and the highest price appreciation at 2.5% against the sector’s average of 0.9% |
|
|
Lower Mid-End Satellite Towns (Apartments) |
Ruaka |
Highest average total returns at 8.1% with the highest y/y price appreciation at 2.0%, 1.7% points higher than the market average of 0.3% |
|
|
Commercial Office |
Grade A Offices |
Gigiri and Karen |
Rental yields of 8.2% and 7.9%, respectively, against a market average of 6.9% and relatively good infrastructure, and low supply |
|
Retail Sector |
High End Malls |
Westlands and Karen |
Highest average rental yields of 9.7% and 9.5% respectively, compared to the overall market average of 7.6% attributable affluent residents who have a high consumer purchasing power and highest occupancy rates |
|
Mixed- Use Developments (2020) |
Combined Themes |
Westlands, Limuru Road and Karen |
Westlands was the best performing node recording an average MUD yield at 8.5% followed by Limuru Road and Karen at 7.3% |
|
Hospitality Sector (2020) |
Serviced Apartments |
Westlands and Parklands |
Westlands and Parklands was the best performing node recording an average rental yield of 6.1%, 2.1% points higher than the market average with studios being the best performing typology |
|
Land |
High Rise Areas |
Embakasi |
Embakasi was the best performing node at 6.5% mainly attributable to affordability of land prices averaging at Kshs 67.2mn mn compared to a high rise average of Kshs 132.7 mn |
|
Low Rise Areas (Unserviced) |
Kitisuru |
Annualized capital appreciation of 6.7% attributed to growing demand for land to develop and availability of good infrastructure allowing ease of access to the area. |
|
|
Satellite Towns (Unserviced) |
Juja |
An annualized capital appreciation of 5.5% attributed to affordability with the asking prices coming in at an average of Kshs 10.6 mn per acre compared to an average of Kshs 13.5 mn for satellite towns
|
|
|
Satellite Towns (Serviced) |
Ongata Rongai |
An annualized capital appreciation of 8.1% compared to the satellite towns average of 2.9% |
|
Source: Cytonn Research
Disclaimer: The views expressed in this publication are those of the writers where particulars are not warranted. This publication, which is in compliance with Section 2 of the Capital Markets Authority Act Cap 485A, is meant for general information only and is not a warranty, representation, advice or solicitation of any nature. Readers are advised in all circumstances to seek the advice of a registered investment advisor.

- Talk to us
- Kenya
- P.O Box 20695 - 00200, Nairobi, Kenya
- Cell +254709101200
- Tel +254709101200
- WhatsApp +254741676635
- United States
- +254709101200
- DOWNLOAD OUR APP
-


- Kenya
- 8th Floor, Pinetree Plaza, Kaburu Drive, Ngong Road, Nairobi, Kenya
- USA
- Suite 1150, 1775 Eye Street NW, USA, Washington DC 20006, USA
- Investments
- High Yield
- Private Equity
- Real Estate
- Real Estate
- RiverRun Estates
- Cytonn Towers
- The Ridge
- Taraji Heights
- The Alma