Regulated vs Unregulated Products, & Cytonn Weekly #25/2021
By Cytonn Research, Jun 27, 2021
Executive Summary
Fixed Income
During the week, T-bills remained oversubscribed, with the overall subscription rate coming in at 105.6%, a decline from the 152.9% recorded the previous week. The 91-day paper recorded the highest subscription rate, receiving bids worth Kshs 10.7 bn against the offered Kshs 4.0 bn, translating to a subscription rate of 267.7%, an increase from the 205.0% recorded the previous week. The oversubscription for the 91-day paper is partly attributable to investors’ preference for holding onto the shorter-dated paper since it now offers a better risk adjusted return. The subscription rate for the 364-day and the 182-day papers declined to 90.4% and 56% from 172.3% and 112.5% respectively recorded the previous week. The yields on all the three papers declined; with the 91-day, 182-day and 364-day paper declining by 14.0 bps, 21.9 bps and 37.6 bps, to 6.9%, 7.3% and 7.7%, respectively, with the decline in yields being mainly attributable to the government continuing to reject expensive bids as we approach the end of the current fiscal year.
During the week, the IMF Executive Board completed the first review of the Extended Fund Facility (EFF) and Extended Credit Facility (ECF) arrangement with Kenya, allowing for an immediate disbursement of USD 407.0 mn (Kshs 43.9 bn) for budgetary support, bringing the total disbursement under the program to USD 714.5 mn (Kshs 77.0 bn), translating to approximately 30.5% of the total approved USD 2.3 bn (Kshs 247.8 bn) three-year financing package under the ECF and EFF arrangement.
We are projecting the y/y inflation rate for June 2021 to remain within the range of 5.9% - 6.1%, compared to 5.9% recorded in May 2021;
Equities
During the week, the equities market recorded mixed performance, with NASI and NSE 20 declining by 0.4% and 0.1%, respectively, while NSE 25 increased marginally by 0.1%, taking their YTD performance to gains of 1.4%, 12.9% and 9.9% for NSE 20, NASI and NSE 25, respectively. The equities market performance was mainly driven by gains recorded by banking stocks such as Co-operative Bank, Equity Group and KCB Group of 6.1%, 4.1% and 3.1%, respectively. The gains were however weighed down by losses recorded by other large cap stocks such as BAT and EABL which declined by 4.1% and 4.0%, respectively;
Real Estate
During the week, Knight Frank, a real estate developer and a property management company, released the Africa Offices Dashboard Q1’2021, highlighting that the rental rates for office spaces in Nairobi registered a 13.8% decline from $14.0 (Kshs 1,509) SQM per month in Q1’2020 to $12.0 (Kshs 1,293) SQM per month in Q1’2021. In the retail sector, Fusion Capital, raised Kshs 800.0 mn from international investors in the United Kingdom (UK) and Finland as well as local land partners in support of completion of the 12,000 SQFT Greenwood City Mall project worth Kshs 1.2 bn in the Meru’s Central Business District (CBD);
Focus of the Week
Following ongoing discussions around regulated and unregulated offers, a member of parliament recently requested the Chairperson of the Department Committee on Finance and Planning to issue a statement on unregulated / private offers. Therefore, in this week’s topical, our Research Team seeks to build on a previous focus on the same topic covered in 2020 and educate the general public about these two types of markets/investment categories, which are complementary and important to well-functioning financial markets;
Investment Updates:
- Weekly Rates:
- Cytonn Money Market Fund closed the week at a yield of 10.55%. To invest, just dial *809#;
- Cytonn High Yield Fund closed the week at a yield of 15.13% p.a. To invest, email us at sales@cytonn.com and to withdraw the interest you just dial *809#;
- We continue to offer Wealth Management Training daily, from 9:00 am to 11:00 am, through our Cytonn Foundation. The training aims to grow financial literacy among the general public. To register for any of our Wealth Management Trainings, click here;
- If interested in our Private Wealth Management Training for your employees or investment group, please get in touch with us through wmt@cytonn.com;
- Cytonn Insurance Agency acts as an intermediary for those looking to secure their assets and loved ones’ future through insurance namely; Motor, Medical, Life, Property, WIBA, Credit and Fire and Burglary insurance covers. For assistance, get in touch with us through insuranceagency@cytonn.com;
- Cytonnaire Savings and Credit Co-operative Society Limited (SACCO) provides a savings and investments avenue to help you in your financial planning journey. To enjoy competitive investment returns, kindly get in touch with us through clientservices@cytonn.com;
Real Estate Updates:
- For an exclusive tour of Cytonn’s real estate developments, visit: Sharp Investor's Tour, and for more information, email us at sales@cytonn.com;
- Phase 3 of The Alma is now ready for occupancy. To rent please email properties@cytonn.com;
- We have 10 investment-ready projects, offering attractive development and buyer targeted returns. See further details here: Summary of Investment-ready Projects;
For recent news about the group, see our news section here.
Money Markets, T-Bills & T-Bonds Primary Auction:
During the week, T-bills remained oversubscribed, with the overall subscription rate coming in at 105.6%, a decline from the 152.9% recorded the previous week. The 91-day paper recorded the highest subscription rate, receiving bids worth Kshs 10.7 bn against the offered Kshs 4.0 bn, translating to a subscription rate of 267.7%, an increase from the 205.0% recorded the previous week. The oversubscription of the 91-day paper is partly attributable to the higher risk adjusted return offered by the paper given the decline in the rates of the other papers. The subscription rate for the 364-day paper declined to 90.4%, from 172.3% recorded the previous week, receiving bids worth Kshs 9.0 bn against the offered amounts of Kshs 10.0 bn, while the subscription rate for the 182-day paper declined to 56.0%, from 112.5% recorded the previous week, receiving bids worth Kshs 5.6 bn against the offered amounts of Kshs 10.0 bn. The yields on all the three papers declined; with the 91-day, 182-day and 364-day paper declining by 14.0 bps, 21.9 bps and 37.6 bps, to 6.9%, 7.3% and 7.7%, respectively. The government continued to reject expensive bids, accepting Kshs 16.6 bn out of the Kshs 25.3 bn worth of bids received, translating to an acceptance rate of 65.5%.
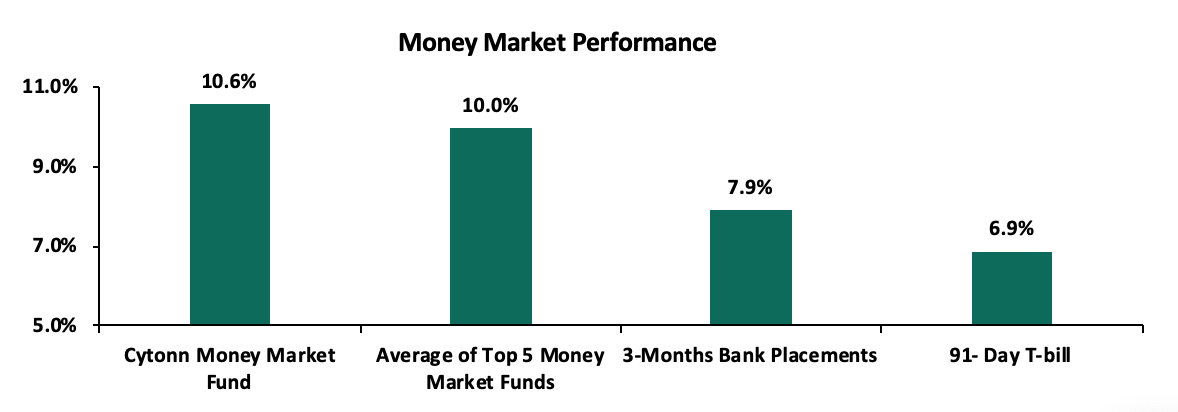
In the money markets, 3-month bank placements ended the week at 7.9% (based on what we have been offered by various banks), while the yield on the 91-day T-bill declined by 14.0 bps to 6.9%. The average yield of the Top 5 Money Market Funds increased to 10.0%, from the 9.8% recorded the previous week. The yield on the Cytonn Money Market Fund increased to 10.6%, from 10.3% recorded last week.
The table below shows the Money Market Fund Yields for Kenyan Fund Managers as published on 25th June 2021:
|
Money Market Fund Yield for Fund Managers as published on 25th June 2021 |
|||
|
Rank |
Fund Manager |
Daily Yield |
Effective Annual Rate |
|
1 |
Cytonn Money Market Fund |
10.03% |
10.55% |
|
2 |
Nabo Africa Money Market Fund |
9.52% |
9.95% |
|
3 |
Madison Money Market Fund |
9.46% |
9.92% |
|
4 |
Zimele Money Market Fund |
9.56% |
9.91% |
|
5 |
CIC Money Market Fund |
9.10% |
9.43% |
|
6 |
Sanlam Money Market Fund |
9.01% |
9.43% |
|
7 |
Alphafrica Kasha Money Market Fund |
8.94% |
9.31% |
|
8 |
GenCapHela Imara Money Market Fund |
8.70% |
9.09% |
|
9 |
Co-op Money Market Fund |
8.53% |
8.90% |
|
10 |
Dry Associates Money Market Fund |
8.36% |
8.69% |
|
11 |
Apollo Money Market Fund |
8.51% |
8.57% |
|
12 |
British-American Money Market Fund |
8.16% |
8.47% |
|
13 |
ICEA Lion Money Market Fund |
8.01% |
8.34% |
|
14 |
NCBA Money Market Fund |
8.00% |
8.30% |
|
15 |
Old Mutual Money Market Fund |
7.44% |
7.44% |
|
16 |
AA Kenya Shillings Fund |
6.16% |
6.34% |
Liquidity:
During the week, liquidity in the money market tightened, with the average interbank rate increasing to 4.7% from 4.3% recorded the previous week, partly attributable to tax remittances which offset government payments. The average interbank volumes increased by 71.0% to Kshs 12.7 bn, from Kshs 7.5 bn recorded the previous week.
Kenya Eurobonds:
During the week, the yields on Eurobonds recorded mixed performance, with the yields on the 10-year bond issued in 2018, 30-year bond issued in 2018, 7-year bond issued in 2019, 12-year bond issued in 2019 and 12-year bond issued in 2021 increasing to 5.3%, 7.4%, 4.7%, 6.3%, and 6.3% respectively, from 5.2%, 7.3%, 4.6%, 6.2% and 6.2% recorded the previous week. On the other hand, the yield on the 10-year bond issued in 2014 remained unchanged at 3.3%. Below is a summary of the performance:
|
Kenya Eurobond Performance |
||||||
|
|
2014 |
2018 |
2019 |
2021 |
||
|
Date |
10-year issue |
10-year issue |
30-year issue |
7-year issue |
12-year issue |
12-year issue |
|
31-Dec-2020 |
3.9% |
5.2% |
7.0% |
4.9% |
5.9% |
- |
|
31-May-21 |
3.1% |
5.3% |
7.3% |
4.7% |
6.2% |
- |
|
18-Jun-21 |
3.3% |
5.2% |
7.3% |
4.6% |
6.2% |
6.2% |
|
21-Jun-21 |
3.3% |
5.3% |
7.3% |
4.6% |
6.2% |
6.2% |
|
22-Jun-21 |
3.3% |
5.4% |
7.3% |
4.7% |
6.2% |
6.3% |
|
23-Jun-21 |
3.3% |
5.3% |
7.4% |
4.7% |
6.3% |
6.3% |
|
24-Jun-21 |
3.3% |
5.3% |
7.3% |
4.7% |
6.3% |
6.3% |
|
25-Jun-21 |
3.3% |
5.3% |
7.4% |
4.7% |
6.3% |
6.3% |
|
Weekly Change |
0.0% |
0.1% |
0.1% |
0.1% |
0.1% |
0.1% |
|
MTD Change |
0.2% |
0.0% |
0.1% |
0.0% |
0.1% |
- |
|
YTD Change |
(0.6%) |
0.1% |
0.4% |
(0.2%) |
0.4% |
- |
Source: Reuters
Kenya Shilling:
During the week, the Kenyan shilling remained relatively stable, closing the week at Kshs 107.75, from Kshs 107.80 recorded the previous week, mainly attributable to lacklustre dollar demand from importers. On a YTD basis, the shilling has appreciated by 1.3% against the dollar, in comparison to the 7.7% depreciation recorded in 2020. Despite the recent appreciation, we expect the shilling to remain under pressure in 2021 as a result of:
- Rising uncertainties in the global market due to the Coronavirus pandemic, which has seen investors continue to prefer holding their investments in dollars and other hard currencies and commodities, and,
- Demand from merchandise traders as they beef up their hard currency positions in anticipation for more trading partners reopening their economies globally.
The shilling is however expected to be supported by:
- The Forex reserves, currently at USD 8.1 bn (equivalent to 5.0-months of import cover), which is above the statutory requirement of maintaining at least 4.0-months of import cover, and the EAC region’s convergence criteria of 4.5-months of import cover. Key to note, there was an increase in the forex reserves attributable to proceeds of the Eurobond issue coupled with the USD 407.0 mn IMF disbursement,
- The stable current account position which is estimated to remain at a deficit of 5.2% of GDP in 2021,
- Improving diaspora remittances evidenced by a 22.3% y/y increase to USD 315.8 mn in May 2021, from USD 258.2 mn recorded over the same period in 2020, which has continued to cushion the shilling against further depreciation, and,
- The dollar inflows from the IMF and World Bank loans in addition to the Eurobond issue.
Weekly Highlight:
- IMF Loan Disbursement
During the week, the IMF Executive Board completed the first review of the Extended Fund Facility (EFF) and Extended Credit Facility (ECF) arrangement with Kenya, allowing for an immediate disbursement of USD 407.0 mn (Kshs 43.9 bn) for budgetary support. The disbursement brings the total disbursement under the program to USD 714.5 mn (Kshs 77.0 bn), translating to approximately 30.5% of the total USD 2.3 bn (Kshs 247.8 bn) three-year financing package under the ECF and EFF arrangement. The review was in relation to fiscal and structural reforms achieved set out under the 38-month programme by the IMF. During the period under review, Kenya achieved the set out targets on both the fiscal and structural reviews with the exception of a 0.3% tax revenue collection underperformance, attributable to the adverse effects of COVID-19 on the economy. The IMF budgetary support programme is aimed at enhancing governance, supporting the country’s COVID-19 response and addressing debt vulnerability. The additional disbursement by the IMF is an indicator of the institution’s confidence in the country.
The government of Kenya also issued a USD 1.0 bn 12-year Eurobond last week which was oversubscribed, with the subscription rate coming at 5.4x and the yield on the bond coming in at 6.3%, 1.7% points lower than the rate of 8.0% for a similar-tenure bond issued in 2019. The high subscription rate can be attributed to the high liquidity in the global markets and the fact that Kenyan macroeconomic fundamentals remain intact and hence providing investors with sufficient confidence.
Inflation projection
We are projecting the y/y inflation rate for June 2021 to remain within the range of 5.9% - 6.1%, compared to 5.9% recorded in May 2021. The key drivers include:
- Fuel prices have remained stable in the last two months as the prices for diesel and kerosene remained unchanged for the period mid-March to mid-July 2021. and,
- Food prices have remained relatively stable during the month given the favourable weather and an improvement in agricultural output.
Going forward, we expect the inflation rate to remain within the government set range of 2.5% - 7.5%.
Rates in the fixed income market have remained relatively stable due to the high liquidity in the money markets, coupled with the discipline by the government as they reject expensive bids. The government is 7.5% behind its prorated borrowing target of Kshs 550.7 bn having borrowed Kshs 509.4 bn in FY’2020/2021. In our view, due to the current subdued economic performance brought about by the effects of the COVID-19 pandemic, the government will record a shortfall in revenue collection having collected Kshs 1,313.1 bn in the first 11 months to May 2021, compared to Kshs 1,469.7 bn prorated target collection for FY’2020/2021, thus leading to a budget deficit of 10.6%, larger than the projected 7.5% of GDP. Despite the deficit and the lower credit rating from S&P Global to 'B' from 'B+', the monetary support from the IMF and World Bank will mean that the interest rate environment may stabilize since the government will not be desperate for cash.
Markets Performance
During the week, the equities market recorded mixed performance, with NASI and NSE 20 declining by 0.4% and 0.1%, respectively, while NSE 25 increased marginally by 0.1%, taking their YTD performance to gains of 1.4%, 12.9% and 9.9% for NSE 20, NASI and NSE 25, respectively. The equities market performance was mainly driven by gains recorded by banking stocks such as Co-operative Bank, Equity Group and KCB Group of 6.1%, 4.1% and 3.1%, respectively. The gains were however weighed down by losses recorded by other large cap stocks such as BAT and EABL which declined by 4.1% and 4.0%, respectively.
During the week, equities turnover increased by 42.5% to USD 31.3 mn, from USD 21.9 mn recorded the previous week, taking the YTD turnover to USD 628.7 mn. Foreign investors remained net sellers, with a net selling position of USD 0.7 mn, from a net selling position of USD 2.7 mn recorded the previous week, taking the YTD net selling position to USD 28.1 mn.
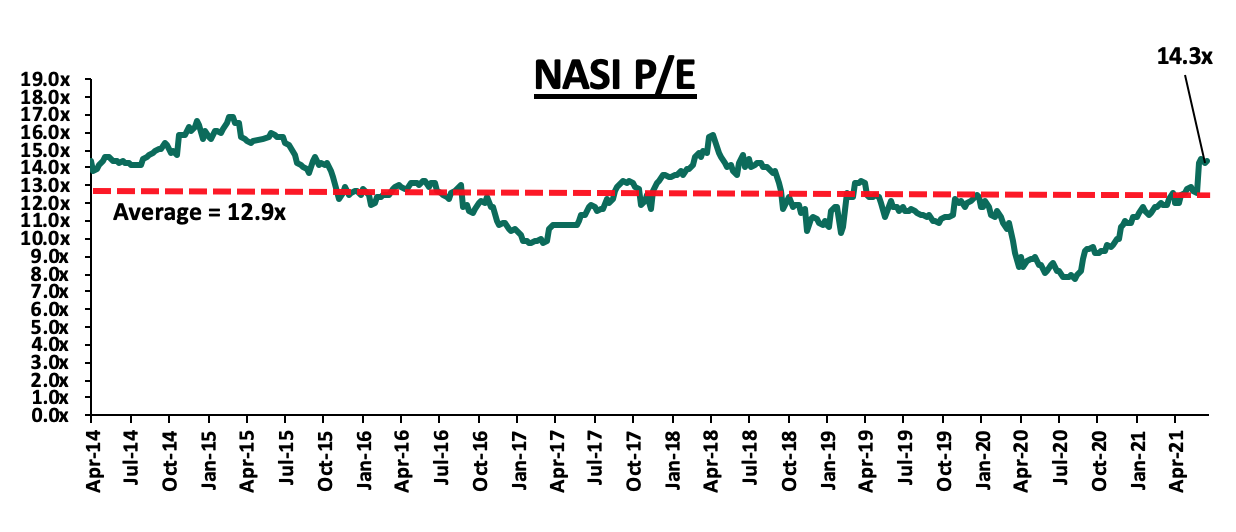
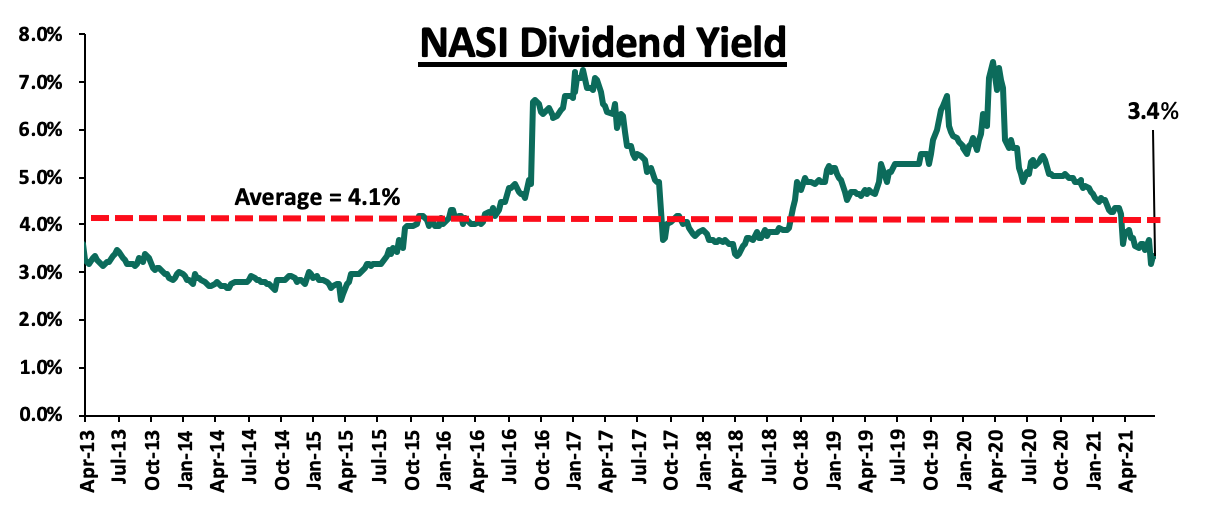
The market is currently trading at a price to earnings ratio (P/E) of 14.2x, 9.9% above the historical average of 12.9x, and a dividend yield of 3.4%, 0.7% points below the historical average of 4.1%. Key to note, NASI’s PEG ratio currently stands at 1.6x, an indication that the market is trading at a premium to its future earnings growth. Basically, a PEG ratio greater than 1.0x indicates the market may be overvalued while a PEG ratio less than 1.0x indicates that the market is undervalued. Excluding Safaricom, the market is trading at a P/E ratio of 10.3x and a PEG ratio of 1.2x. The current P/E valuation of 14.2x is 84.3% above the most recent trough valuation of 7.7x experienced in the first week of August 2020. The charts below indicate the historical P/E and dividend yields of the market.
Universe of Coverage:
Below is a summary of our universe of coverage and the recommendations:
|
Company |
Price as at 18/06/2021 |
Price as at 25/06/2021 |
w/w change |
YTD Change |
Year Open 2021 |
Target Price* |
Dividend Yield |
Upside/ Downside** |
P/TBv Multiple |
Recommendation |
|
I&M Holdings*** |
21.8 |
21.1 |
(3.2%) |
(53.0%) |
44.9 |
29.8 |
10.7% |
51.9% |
0.3x |
Buy |
|
Kenya Reinsurance |
2.4 |
2.4 |
(0.4%) |
4.3% |
2.3 |
3.1 |
4.1% |
32.8% |
0.3x |
Buy |
|
Sanlam |
9.7 |
10.0 |
2.7% |
(23.1%) |
13.0 |
12.4 |
0.0% |
24.0% |
0.9x |
Buy |
|
NCBA*** |
25.6 |
25.2 |
(1.8%) |
(5.5%) |
26.6 |
29.5 |
6.0% |
23.3% |
0.6x |
Buy |
|
Diamond Trust Bank*** |
59.0 |
60.0 |
1.7% |
(21.8%) |
76.8 |
70.0 |
0.0% |
16.7% |
0.3x |
Accumulate |
|
Stanbic Holdings |
80.0 |
81.3 |
1.6% |
(4.4%) |
85.0 |
90.5 |
4.7% |
16.1% |
0.8x |
Accumulate |
|
Co-op Bank*** |
12.3 |
13.0 |
6.1% |
3.6% |
12.6 |
13.8 |
7.7% |
13.8% |
0.9x |
Accumulate |
|
KCB Group*** |
42.6 |
43.9 |
3.1% |
14.2% |
38.4 |
48.6 |
2.3% |
13.1% |
1.0x |
Accumulate |
|
Standard Chartered*** |
130.0 |
130.0 |
0.0% |
(10.0%) |
144.5 |
134.5 |
8.1% |
11.5% |
0.9x |
Accumulate |
|
Equity Group*** |
44.8 |
46.6 |
4.1% |
28.6% |
36.3 |
51.2 |
0.0% |
9.9% |
1.4x |
Hold |
|
Jubilee Holdings |
309.5 |
310.0 |
0.2% |
12.4% |
275.8 |
330.9 |
2.9% |
9.6% |
0.6x |
Hold |
|
ABSA Bank*** |
10.1 |
9.9 |
(1.8%) |
4.2% |
9.5 |
10.7 |
0.0% |
7.9% |
1.1x |
Hold |
|
Liberty Holdings |
7.2 |
8.5 |
17.4% |
10.4% |
7.7 |
8.4 |
0.0% |
(1.2%) |
0.6x |
Sell |
|
Britam |
7.3 |
7.4 |
0.5% |
5.1% |
7.0 |
6.7 |
0.0% |
(9.0%) |
1.4x |
Sell |
|
HF Group |
3.6 |
3.6 |
0.0% |
15.6% |
3.1 |
3.2 |
0.0% |
(11.8%) |
0.2x |
Sell |
|
CIC Group |
2.1 |
2.1 |
(0.5%) |
0.0% |
2.1 |
1.8 |
0.0% |
(14.7%) |
0.7x |
Sell |
|
*Target Price as per Cytonn Analyst estimates **Upside/ (Downside) is adjusted for Dividend Yield ***For Disclosure, these are stocks in which Cytonn and/or its affiliates are invested in Key to note, I&M Holdings YTD share price change is mainly attributable to counter trading ex-bonus issue. |
||||||||||
We are “Neutral” on the Equities markets in the short term. With the market currently trading at a premium to its future growth (PEG Ratio at 1.6x), we believe that investors should reposition towards companies with a strong earnings growth and are trading at discounts to their intrinsic value. Additionally, we expect the recent discovery of new strains of COVID-19 coupled with the introduction of strict lockdown measures in major economies to continue dampening the economic outlook.
- Industry Reports
During the week, Knight Frank, a real estate developer and a property management company, released the Africa Offices Dashboard Q1’2021, a report that highlights the rental performance of prime commercial office markets across Africa. Some of the key take outs from the report include;
- Lagos registered the highest rental rates at $ 62.5 (Kshs 6,728) SQM per month in Africa, which is a 20.0% increase when compared to Q4’2020, attributed to a strong economic recovery coupled with improved occupier demand,
- The rental rates for prime office spaces in Nairobi registered a 13.8% decline from $14.0 (Kshs 1,509) SQM per month in Q1’2020 to $12.0 (Kshs 1,293) SQM per month in Q1’2021, attributed to i) reduced demand as people continue to embrace working from home as a strategy to adhere to social distancing rules, ii) office space oversupply currently at 7.3 mn SQFT as at 2020, and, iii) reduced rental rates as landlords continue offering discounts and concessions amid tough economic conditions, and,
- Nairobi’s prime asking rents and rental yields continue to remain averagely low when compared to other prime cities across Africa ranking at number 23 out of 28 select cities in Africa.
The table below shows summary of the commercial office rental performance of prime cities in Africa;
|
Summary of Commercial Office Performance of Prime Cities In Africa Q1’2021 |
|||||||
|
Rank |
City |
Asking Rents (USD/SQM) Q1’2021 |
Gross Rental Yields Q1’2021 |
Rank |
City |
Asking Rents (USD/SQM) Q1’2021 |
Gross Rental Yields Q1’2021 |
|
1 |
Lagos |
62.5 |
8.0% |
15 |
Port Louis |
18.5 |
8.0% |
|
2 |
Luanda |
55.0 |
10.0% |
16 |
Lusaka |
18.0 |
10.0% |
|
3 |
Kinshasa |
35.0 |
5.0% |
17 |
Addis Ababa |
16.0 |
6.0% |
|
4 |
Cairo |
33.0 |
9.0% |
18 |
Cape Town |
15.3 |
10.0% |
|
5 |
Abidjan |
32.5 |
10.0% |
19 |
Kampala |
15.3 |
9.0% |
|
6 |
Malabo |
30.0 |
10.0% |
20 |
Johannesburg |
15.2 |
12.0% |
|
7 |
Algiers |
28.2 |
10.0% |
21 |
Dar Es Salaam |
13.5 |
9.0% |
|
8 |
Accra |
28.0 |
9.0% |
22 |
Gaborone |
12.0 |
9.0% |
|
9 |
Maputo |
28.0 |
9.0% |
23 |
Nairobi |
12.0 |
8.0% |
|
10 |
Douala |
27.0 |
11.0% |
24 |
Lilongwe |
12.0 |
6.0% |
|
11 |
Dakar |
22.5 |
12.0% |
25 |
Antananarivo |
11.0 |
10.0% |
|
12 |
Bamako |
20.0 |
10.0% |
26 |
Tunis |
10.0 |
9.0% |
|
13 |
Libreville |
20.0 |
10.0% |
27 |
Blantyre |
9.3 |
7.0% |
|
14 |
Casablanca |
20.0 |
9.0% |
28 |
Harare |
7.0 |
8.0% |
Source: Knight Frank Research, N/B: 1.0 USD = Kshs 107.8
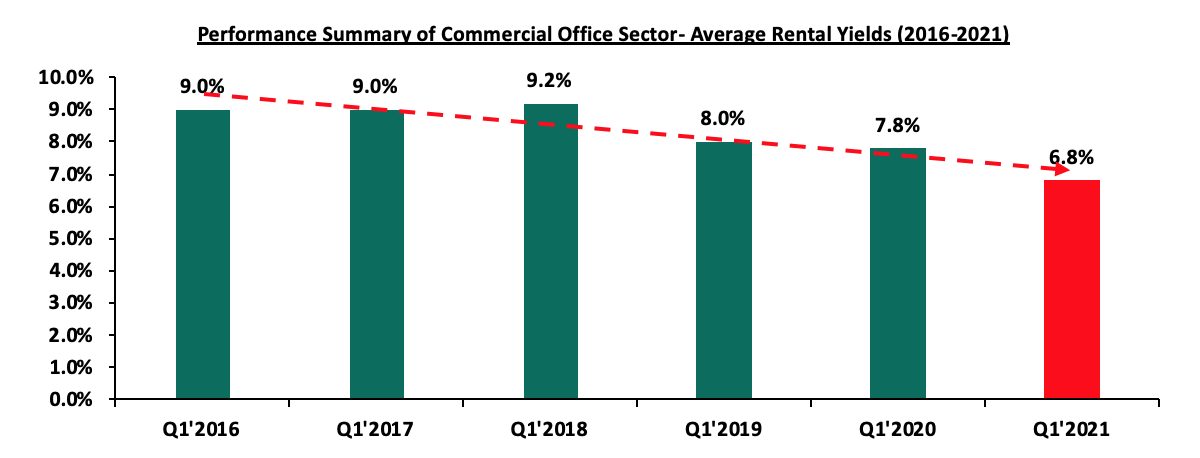
The findings of this report are in line with the Cytonn Q1’2021 Markets Review which highlighted that the Nairobi commercial office sector registered a 5.2% decline on the rental rates to Kshs 92 SQFT per month in Q1’2021 from Kshs 97 SQFT per month Q1’2020, with average rental yields and occupancy rates being at 6.8% and 76.3% in Q1’2021, a 0.2% and 1.4% drop when compared to 7.8% and 81.7% in Q1’2020 respectively. We however expect the commercial office sector’s performance to slightly improve due to the reopening of the economy, with investment opportunity lying in areas such as Gigiri and Karen which posted rental yields of 8.3% and 8.0% respectively against the market average of 6.8% in Q1’2021. Considering the long-term performance of the commercial office sector, we still retain a negative outlook due to the existing oversupply.
The table below highlights the performance of the Nairobi Metropolitan Area (NMA) Commercial Office sector over time;
Source: Cytonn Research 2021
- Retail Sector
During the week, Fusion Capital, raised Kshs 800.0 mn from international investors in the United Kingdom (UK) and Finland as well as local land partners in support of completion of the 12,000 SQFT Greenwood City Mall project worth Kshs 1.2 bn in the Meru’s Central Business District (CBD). The project which was initially structured as a Kshs 463.5 mn Development Real Estate Investment Trust (D-REIT) initiative broke ground in December 2015 and was expected to be completed by December 2017. However, the project has stalled due to limited finances and the undersubscription of the Fusion D-REIT which achieved a 38.0% subscription rate against the set 50.0% threshold. As a result, the shareholders opted for private equity funding as opposed to floating a D-REIT. Some of the factors that have been affecting the performance of REITS include; i) inadequate investor knowledge of the instrument, ii) lengthy approval process, iii) high Minimum Capital Requirements for a Trustee of Kshs 100.0 mn has limited the number of D-REIT trustees to only 3 trustees, iv) subdued performance of some real estate sectors due to the COVID-19 pandemic, and, v) high Minimum Investment Amounts Set at Kshs 5.0 mn, which is 100 times the average median income in Kenya at Kshs. 50,000. However, the solutions to these problems include: i) Creating awareness through diverse education on the benefits of D-Reits, ii) having clear timelines for approval processes and the failure repercussions, and, iii) reduction of the minimum required investment amount.
Besides being able to raise the required capital for the completion of the mall in Meru, the move by the firm to revive the construction of the mall is supported by; i) population growth with Meru having registered a 7.0% population increase to 1.5 mn in 2019 from 1.4 mn in 2009, ii) growing middle class with improved purchasing power, iii) improved infrastructure such as the Mati Road and Meru By Pass opening up areas for investment opportunities, and, iv) the strategic location of Meru in the line of recent developments such as the LAPPSET Corridor project which traverses through the county. In terms of performance, according to our Kenya Retail Report 2020, Mount Kenya region where Meru is categorized recorded the highest rental yields of 7.7% against the market average of 6.7%, and a 78.0% occupancy rate against the market average of 76.6%, hence an indication that the region’s higher returns and retail space demand presents a good investment opportunity for the firm.
The table below shows a summary of the performance of the retail sector in key urban cities in Kenya;
|
Summary Performance of Key Urban Cities in Kenya |
|||
|
Region |
Rent/SQFT 2020 |
Occupancy% 2020 |
Rental Yield |
|
Mount Kenya |
125.0 |
78.0% |
7.7% |
|
Nairobi |
168.5 |
74.5% |
7.5% |
|
Mombasa |
114.4 |
76.3% |
6.6% |
|
Kisumu |
97.2 |
74.0% |
6.3% |
|
Eldoret |
130.0 |
80.2% |
5.9% |
|
Nakuru |
55.7 |
76.6% |
5.9% |
|
Average |
115.1 |
76.6% |
6.7% |
Source: Cytonn Research 2020
In our view, if properly managed and executed, the private equity financing will help enhance investors’ confidence into the Kenyan real estate market especially the retail sector and hence boosting the sectors performance through fueling retail space uptake.
The performance of the real estate sector is expected to be supported by the expected improvement in the overall performance of the Kenyan retail sector in the long run as well as the gradual reopening of the economy, this is however expected to be weighed down by the overall decline in the performance of the commercial office sector due to the existing oversupply.
Following ongoing discussions in the financial markets around regulated and unregulated offers, a member of parliament recently requested the Chairperson of the Department Committee on Finance and Planning to issue a statement on unregulated / private offers. Therefore, in this week’s topical, our Research Team seeks to build on a previous focus on the same topic covered in 2020 and educate the general public about these two types of markets/investment categories, which are complementary and important to well-functioning financial markets. As such, we shall discuss the following:
- Introduction to Regulated and Unregulated markets,
- Regulated and Unregulated Investment Categories,
- Pros and Cons of Each Investment Category,
- Issues to Consider for Each Category,
- Myths About Each Category, and,
- Conclusion.
Section I: Introduction to Regulated and Unregulated Investment markets
Investment markets from a regulatory point of view can be divided into two large categories, regulated and unregulated markets.
Regulated markets, often referred to as public markets are controlled by a regulatory body whose key mandate is to protect the public interest. The products in the public markets tend to be standardized and easily accessible to the public. Common examples of regulated products include shares purchased at the securities exchange, Fixed Deposits offered by Banks, Collective Investment Schemes such as Money Market Funds, among other. The offering of the product needs to have been reviewed and approved by the respective regulator before the investment products can be sold to the public. If a product is a banking product, it is regulated by CBK, an insurance product by Insurance Regulatory Authority (IRA), shares/equities and Collective Investment Schemes/ Unit Trust Funds by Capital Markets Authority (CMA), and pension products by Retirement Benefits Authority (RBA).
Unregulated markets are governed by the prevailing contracts between the participating parties and therefore they are not regulated by a specific regulator; however, the process of offering is usually regulated so that it follows a set of defined rules and guidelines. The manner of offering is usually private; hence they are also loosely referred to as private products or private offers. Since they are an alternative to public markets products, they are also referred to as alternative market products. For one to issue a private offer in Kenya, they must adhere to Section 21 of the Capital Markets (Securities) (Public Offers, Listings and Disclosures) Regulation, 2002 which gives a set of 9 conditions that should be met prior to a private offer issuance. We have clarified with CMA that meeting any one of those conditions is sufficient to meet the private offers threshold. The 9 conditions are:
- The securities are offered to not more than one hundred persons,
- The securities are offered to the members of a club or association and the members can reasonably be regarded as having a common interest with each other,
- The securities are offered to a restricted circle of persons whom the offer or reasonably believes to be sufficiently knowledgeable to understand the risks involved in accepting the offer,
- The securities are offered in connection with a bona fide invitation to enter into an underwriting agreement with respect to them,
- The minimum subscription for securities per applicant is not less than Kenya Shillings one hundred thousand (Kshs. 100,000),
- The securities result from the conversion of convertible securities and a prospectus relating to the convertible securities was approved by the Authority and published in accordance with these Regulations
- The securities of a listed company are offered in connection with a take-over scheme approved by the Authority
- The securities are not freely transferable, and,
- The securities are of a private company and are offered by that company to members or employees of the company or a restricted circle of persons whom the offer or reasonably believes to be sufficiently knowledgeable to understand the risks involved in accepting the offer,
Examples of unregulated products in the Kenyan Market include: Real Estate, Private Equity, Structured products and Commercial papers.
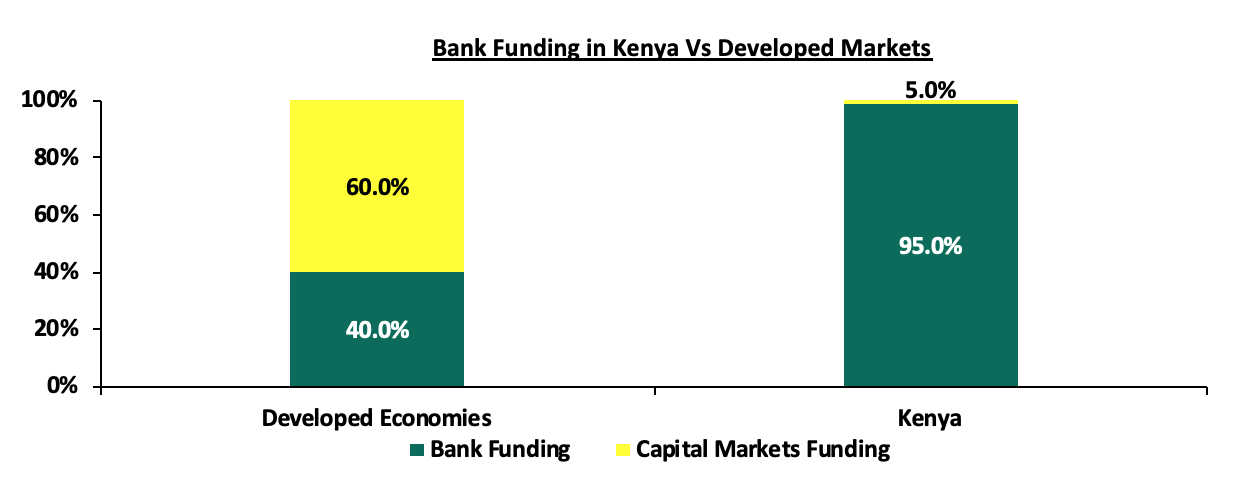
For economies to grow, there is need for companies to be in a position to access capital to finance their businesses, hence necessitating the presence of capital markets. According to World Bank data, in more developed markets, both regulated and unregulated capital markets contribute about 60% of all business funding and the remaining 40% of capital coming from banks. However, in Kenya businesses funding largely rely on bank funding and according to the Capital Markets Authority Soundness Report Q4’2020, the regulator, CMA, highlighted that funding from the capital markets in Kenya stood at 5.0%, with the banking sector taking up 95.0% of the funding for businesses. This shows that our capital markets remain subdued compared to other economies, and access to funding remains a concern. The upshot is that there is banking dominance in Kenya, which then makes capital hard to access, and when accessed it is expensively priced.
Section II: Regulated and Unregulated Investment Categories
As earlier mentioned, regulated products are standardized and are easily available to the market. The products are issued publicly and as per the Capital Markets Authority guidelines pertaining to each type of security. Their issuance and trading are overseen by independent regulatory bodies through a set of governing rules. Examples of regulated products include:
- Equities – Equities represent ownership interest in a company and is considered to be relatively liquid and highly volatile. The returns from equities are in two forms i) Capital appreciation -this is when you sale the security at a higher price than the original purchase price and ii) Dividends which is when listed companies offer cash compensation to equities investors. Investments in equities are largely for medium to long term investments as they come with some level of volatility,
- Fixed Income Securities – These are debt instruments that offer a return in the form of fixed periodic interest payments and principal redemption upon maturity or expiration of the securities’ tenor. Investors usually earn a fixed amount of income in the form of coupon payments on their bond portfolios at regular intervals. Usually the yields on the securities increase with the increase in the tenor of investments. Examples of fixed income securities available to investors include: Treasury Bills, Treasury Bonds and Bank Fixed deposits,
- Mutual Funds/Unit Trust Funds – These are a collective investment scheme that pools money together from many investors and are managed by professional fund managers who invests the pooled funds with a view of paying a return in accordance with specific shared investment objectives that have been established for the scheme. The funds in the mutual fund give returns in the form of dividends, interest income and/or capital gains depending on the asset class the funds are invested in. Examples of Unit Trust Funds in the market include: Money Market Fund, Equity Fund, Balanced Fund and Fixed Income Fund. For more information, please read our previous topical on Investing in Unit Trust Funds, and,
- Pension Funds – These refers to investment funds into which individuals contribute their investments with the aim of saving for retirement. The investments are guided by the provisions of the Retirement Benefits Act and the specific characterizes of the fund as set out in the Investment Policy statement. Pension funds can be categorized into two in terms of returns; guaranteed funds, which provide a guaranteed minimum rate of return, and segregated funds, which offer market-based returns. For more information, see our topical on Retirement Benefit Schemes in Kenya.
- Real Estate Investment Trusts (REITS) – These are pooled investments typically designed to enable the investors to profit from investing in large-scale real estate enterprises and offer investors a liquid interest in real estate. Types of REITS include: Income REITS whose example is the Fahari I-REIT which trades at the Nairobi Securities Exchange, Development (D-REIT) and Islamic REIT,
- Derivatives - A derivative is a financial instrument that derives its value from one or more underlying assets which can be based on different types of assets such as commodities, equities, bonds, interest rates, exchange rates, or real estates. They are legal contracts in which two parties agree to pay off each other depending on the value of an underlying asset at a certain point in time. Additionally, derivatives can either be traded over-the-counter (OTC) or on an exchange. The main types of derivatives contracts include: forward contracts, options contracts, futures, swaps and warrants which involve buying and selling of assets under a specified set of rules, and,
- Exchange Traded Funds (ETFs) – These are publicly traded investment products that monitor the performance of a diversified portfolio of stocks, bonds, and commodities. An ETF can also track a single commodity such as oil or a precious metal like gold. This funds give investors the chance to buy units that track whole indices as easily as buying shares listed on the Exchange. An example of an ETF is the Barclays New Gold ETF which was launched on 30th June 2017 and listed on the Johannesburg Stocks Exchange the fund enables investors to invest in an instrument that monitors the price of Gold Bullion. Price movement of the ETF are determined by the price movement of gold and each gold security corresponds to approximately 0.01 troy ounces of gold bullion.
The issuance of unregulated products involves private arrangements between the various participants which mostly does not happen in the public domain as these products are not to be advertised publicly. Therefore the main players involved in the issuance of private offers include:
- The Issuer - This is the entity that needs the funds and has entered the market for borrowing purposes,
- The Arranger - This is an intermediary who brings the involved parties. They act as the match maker between the issuer looking for capital and the investor with capital to commit, and,
- The investor – These are the Individuals whose aim is to make a given return and commit funds in to the investment instrument.
Some of the unregulated products available in the market include:
- Structured products - Structured Products as previously covered in our Cytonn Weekly #43/2017 and Cytonn Weekly #19/2015 are defined as highly customized / tailor made investment products that are packaged by investment professionals to enable the investor access returns or meet investment objectives that are not accessible in the traditional / public / conventional markets. Structured Products are considered as a subset of Alternative Investments. The process of structuring starts by traditional products such as equities, bonds and bank deposits, either alone or in combination with a non-traditional product, such as real estate, and creating cash flows and returns that are supported by the underlying products, but whose features are different from the underlying product because of the structuring that is done. Examples of structured products in the market include: Cytonn Real Estate Note at 18.0%, Two Rivers Development Fund at 17.0% and Maiyan Holdings Fund at 17.0%,
- Commercial Papers- These are promissory notes issued by companies as a form of raising short-term debt. These securities can be secured or unsecured and are priced at a premium to the Treasury Bills. Commercial Papers often have tenors of up to one year and mainly target institutional investors. Commercial papers are mostly used to fund the working capital requirements of companies which must not necessarily be in Real Estate. So as to improve the attractiveness to investors, some commercial papers are rated by Credit ratings agencies who evaluate the credit worthiness of the issuer company. Examples of commercial papers issued in 2021 include: Watu Credit at 15.0%, Premier Credit at 15.0%, Car & General at 12.0% - 13.0% and KK Security Note at 13.3%.
- Real Estate Notes– This involves the structuring of investments whose returns are backed by the returns from the underlying assets which is real estate. The capital raised is used for the purchase of land, construction costs and even maybe the purchase of buildings for the purposes of income generation. An example includes: Cytonn Real Estate Note at 18.0%, and,
- Private Equity - This involves buying shares that are not listed on a public exchange or buying shares of a public company with the intent to privatizing them. Private Equity investments may take the form of Venture Capital investing – which is the investment of capital into a small business or start-up which has the potential of growth in the long run, Growth capital investing in already established companies that are looking to scale their operations and private equity which involves financing established companies that require money to restructure and facilitate a change of ownership. An example includes: Fusion capital which raised Kshs 800.0 mn from international investors for the Meru Greenwood City project.
Summary Table of Privately Offered Products in the Kenyan Market
|
|
Name of Private Offer |
Type of Private Offer |
|
1. |
Car & General Short Term Note Program |
Commercial Paper |
|
2. |
ASL Credit Short Term Note Program |
Commercial Paper |
|
3. |
KK Security Short Term Note Program |
Commercial Paper |
|
4. |
Premier Credit Note Program |
Commercial Paper |
|
5. |
Watu Credit Note Program |
Commercial Paper |
|
6. |
My Credit Note Program |
Commercial Paper |
|
7. |
Maiyan Holdings |
Real Estate Note |
|
8. |
Heri Homes Capital LLP |
Real Estate Note |
|
9. |
Cytonn Projects Notes (CPN) |
Real Estate Note |
|
10. |
Two Rivers Development Fund |
Real Estate Note |
|
11. |
Meru Greenwood City*** |
Real Estate Equity |
|
12. |
Cytonn High Yield Solutions (CHYS) |
Structured Product |
|
13. |
Britam Wealth Management Fund LLP |
Structured Product |
|
*** Raised funds from international investors from UK and Finland |
||
Source: Cytonn Research
Section III: Pros and Cons of Each Investment Category
Any investment, regulated and unregulated products have their advantages and disadvantages. No product is better or worse than the other as they both serve unique purposes depending on an investor’s specific investment objective. The table below shows the pros and cons of investing in any of the two categories:
|
Regulated vs Unregulated Products – Pros & Cons |
||
|
Pros |
Cons |
|
|
Regulated Products |
|
|
|
Unregulated Products |
|
|
Source: Cytonn Research
Section IV: Factors to consider while investing
There are a number of areas for an investor to consider before making an investment decision, and this usually boils down to financial planning and unique preferences for an investor, after they have considered the pros and cons of each category:
- Risk Appetite: An investor has to evaluate the two types of categories and then make a call on the uncertainty that an investment may not earn its expected rate of return, and as well risks such as interest rate risk, currency risk, re-investment risk, and credit risk,
- Return: These are the earnings from investments, and they vary depending on the type of investment e.g. dividends, rent, interest and capital appreciation. Investors should ask themselves whether the return profile meets the risk-reward proposition,
- Liquidity: This is a definition of how quickly an asset can be converted into cash. Investors will usually find that unregulated products have a higher chance of being illiquid compared to regulated products,
- Taxation: It is critical for investors to understand their tax status for tax planning purposes. Regulated products such as bank deposits and Unit Trust Funds in Kenya attract a 15% withholding tax, which is final, whereas unregulated Structured Products attract a total 30% tax rate on any returns made,
- Governance: Governance around regulated products usually involves a Regulator, Trustee, and Custodian, who provide oversight over funds being invested. In unregulated products, governance is usually done by select investors who are investors in the funds themselves, alongside the Investment Manager and their Investment Committee, and,
- Sophistication: Regulation exists to provide oversight for less sophisticated investors. These include retail investors who may not fully understand the characteristics of products they are investing in. Unregulated products are for sophisticated investors who understand the characteristics of their investments and have taken time to understand the underlying asset class / economic activity that is delivering the return.
Section V: Myths about Each Category
Given our interaction with investors, we felt it best to bring out and debunk many myths that we have heard surrounding both categories of investments especially given that we are still an emerging market were private products are less prevalent:
Myths about Regulated Products:
- Always Safer: The myth has always been that regulated products are safer and investors will not lose money in regulated products. However, experience in Kenya has shown that investors in regulated products such as banking and capital markets have lost funds due to isolated cases of lapses in corporate governance. As such, investing in a regulated institution is no guarantee over the safety of your investment. The Kenya Deposit Insurance Fund, for example, only guarantees Kshs 500,000 worth of deposit for each account in a banking institution. Some of the regulated products that have recently run into trouble leading to billions of losses include:
|
Shareholders’ Loss for Regulated Entities Largely Due to Poor Corporate Governance |
||||
|
Firm |
Peak Share Price |
Current Share Price |
No. of Shares (bn) |
Loss in Value (Kshs bn) |
|
Kenya Airways** |
58.0 |
3.8 |
1.5 |
81.5 |
|
Mumias Sugar |
20.7 |
0.3 |
1.5 |
31.2 |
|
Athi River Mining (ARM) |
33.0*** |
5.6* |
1.0 |
27.4 |
|
Transcentury |
57.0 |
1.4 |
0.4 |
22.2 |
|
Uchumi* |
10.9 |
0.3 |
0.4 |
3.9 |
|
Imperial Bank |
|
|
|
36.0 |
|
Chase Bank |
|
|
|
4.8 |
|
Real People |
1.6 |
|||
|
CMC Motors |
1.2 |
|||
|
Amana Capital |
|
|
|
0.3 |
|
Total |
210.1 |
|||
|
*Last trading price before suspension **Peak share price since the 2012 rights issue *** Represents the median share price for the 10 years to the suspension |
||||
Source: Cytonn Research, NSE, Reuters
- Very Liquid: While regulated funds are likely to be a lot more liquid than unregulated, there are times when a regulated business or fund undergoes a strain, and as such, there shall be periods where funds are not easily accessible. This could be in the case of a Unit Trust Fund being closed for withdrawals, or a bank under receivership; a good example is what Amana Money Market Fund has recently experience,
- Don’t Invest in Alternatives: Regulated funds and products usually all have an allocation to alternative investments. The simplest example is that any deposit in a bank is then pushed forward by a bank and lent to an individual for a mortgage, or a developer to undertake a development project. Unit Trust Funds in Kenya as well, as per the regulations, are allowed to invest in alternative investments such as real estate and private equity, and,
- That the Regulator Fully Understands the Investments: Whether regulated or unregulated, investments always entail risks that even the best analysts, let alone a regulator, may not uncover. Investors should not think that just because it was signed off by a regulator, that they totally understood the investment; investors should still do their own due diligence.
Myths about Unregulated Products:
- Risky Investments: Unregulated products are not necessarily more risky, especially when they are sourced through a competent research and investment team, and one that has experience in managing illiquid and alternative assets. Take real estate for example, where the project has been sourced through detailed research and is delivered by a well-run and professional project manager, and there is visibility over pre-sales, such an investment would be attractive for those seeking diversification in their portfolios,
- They Are Too Complex: Unregulated investments are really not more complex than regulated products, in spite of the jargon that usually accompanies them. Accessing private or unregulated markets is down to experience and skill of the management and investment team, and their ability to package the unregulated asset class into investible security,
- They cannot be offered by Regulated Entities: Regulated entities can offer both regulated and unregulated products. For any regulated product, it is approved by the respective regulator, similarly, any unregulated product also needs to pass through the respective regulator.
- They are unlawful: Unregulated products are often viewed as unlawful and with a lot of suspicion, mainly because they do not require regulatory approval. However, it is important for investors to note that even without regulatory approval, the unregulated products are still issued within the confines of set guidelines by the regulators. We have recently filed a petition in the High Court for an interpretation on what constitutes a private offer,
- Have to only be distributed to a Few Individuals: There is a myth that unregulated private products must only be distributed to a few individuals. There is ample case laws to demonstrate that what matters is the manner of offering, and not the number of investors. Courts have concluded that an offer even to one person is deemed a public offer if it was offered in a public manner, and an offer even to a million people is a private offer if it was offered in a private manner. Case laws in developed markets shows us that unregulated products can be widely distributed:
- United States: The leading case in the United States with regard to ‘transactions by an issuer not involving any public offering’ is Securities Exchange Commission vs Ralston Purina Company 346 US 119 Supreme Court, where an offering was made to at least 7,000 members of staff. The eligibility criteria were simply an employee eligible for a promotion, an individual sympathetic to management, the courts concluded that it was not a public offer because there was an eligibility criteria, even though the regulator wanted it deemed a public offer.
- United Kingdom: In Nash vs Lynde, a case where a question was raised over the distribution of shares, the questions framed by the Court were, amongst others, whether a private company could be held to have offered and issued its shares to the public as 20-30 prospectus was issued. The Court in this matter held as follows ‘The public is a general word and no particular numbers are described. Anything from two to infinity may serve perhaps even one ….’. The Offer, in this case, was therefore not deemed a Public Offer, as those the offer was being made to were specific and shared a common goal. A key takeout is that numbers are not a determining factor as to whether an offer is made to the Public or a Section of the Public.
- Australia: The leading case for Australia is Corporate Affairs Commission (SA) VS Australian Central Credit Union (1985), where it was held that an Offer to 23,000 persons would not amount to a Public Offer. This was on the basis that the law expressly allowed for this exemption on the basis of persons with a common interest.
Based on the above, it is clear that our own securities regulations need to undergo judicial interpretation as to what is a private offer and a public offer. Where there is eligibility criteria, where there offer is being made to specific individuals, and where the law expressly allows for an exemption, the offer is deemed private. We have recently filed a petition in the High Court seeking judicial interpretation.
Section VI: Conclusion
While Regulated products are standardized and easy to comprehend, the unregulated products tend to be complex, opaque, and hard to value and understand, which has largely contributed to limiting their growth. Additionally, the growth of unregulated products in the Kenyan market continues to be curtailed by the lack of regulatory support as despite the product being unregulated, the process of offering is usually regulated so that it follows a set of rules and guidelines. We believe that in order to catalyze the growth of our capital markets, there needs to be a synergy between the regulated and the unregulated markets as this will lead to a more inclusive capital market. Consequently, we believe this will lead to the growth of the economy as businesses will have access to cheaper forms of funding in the capital markets. The recent parliamentary inquiry on private offers together with the recent petition should help shape the future of private offers in Kenya.
It is important to have continuous education for current and potential investors to understand the products and the return prospects, as well as, how they fit in to the investors’ portfolio. It is also important for investors to understand that not every financial instrument needs to be regulated as this will kill innovation. For investors, they need to first understand their investment objective, risk appetite, then understand the investment products available to them before they make an investment decision towards or away from unregulated products. We highly recommend that you speak to a Financial Advisor before you invest in any of the two categories of investments.
Disclaimer: The views expressed in this publication are those of the writers where particulars are not warranted. This publication, which is in compliance with Section 2 of the Capital Markets Authority Act Cap 485A, is meant for general information only and is not a warranty, representation, advice or solicitation of any nature. Readers are advised in all circumstances to seek the advice of a registered investment advisor.

- Talk to us
- Kenya
- P.O Box 20695 - 00200, Nairobi, Kenya
- Cell +254709101200
- Tel +254709101200
- WhatsApp +254741676635
- United States
- +254709101200
- DOWNLOAD OUR APP
-


- Kenya
- 8th Floor, Pinetree Plaza, Kaburu Drive, Ngong Road, Nairobi, Kenya
- USA
- Suite 1150, 1775 Eye Street NW, USA, Washington DC 20006, USA
- Investments
- High Yield
- Private Equity
- Real Estate
- Real Estate
- RiverRun Estates
- Cytonn Towers
- The Ridge
- Taraji Heights
- The Alma