Regulated versus Unregulated Markets, and Cytonn Monthly - February 2020
By Cytonn Investments Research Team, Mar 1, 2020
Executive Summary
Fixed Income
During the month of February, T-bill auctions recorded an oversubscription, with the overall subscription rate coming in at 211.8%, compared to 164.1% recorded in the month of January 2020, attributable to easing liquidity in the money market. The subscription rates for the 91-day paper recorded a decline to 70.3%, from the 86.2% recorded in January. The subscription rates for the 182-day and 364-day papers, however, were on a rise coming in at 88.2% and 391.9%, higher than the 50.0% and 230.5% recorded in January, respectively. We note that there is continued pent up demand for the 364-day paper, having recorded the highest subscription rate of the 3 papers, at 391.9%, which we attribute to the market having a bias to the shorter-dated government instruments to avoid duration risk. Given the scarcity of shorter-dated bonds in the primary market, with the government issuing medium-term and longer-dated papers in a bid to increase the debt maturity profile, this has seen most investors still keen on the primary fixed income market, finding the 364-day T-bill more attractive on a risk-adjusted return basis. The yields on the 91-day and 182-day papers both recorded increases of 0.1% points to close at 7.3% and 8.3%, respectively. The yield on the 364-day paper, however, recorded a decline of 20 bps, to close at 9.8% in February. Month-on-month inflation also increased by 0.6%, mainly attributable to a 2.6% increase in the food and non-alcoholic drinks’ index, due to an increase in prices of significant food items including tomatoes, onions, and spinach, which increased by 29.6%, 7.3%, and 3.2%, respectively;
Equities
During the month of February, the equities market was on a downward trend, with NASI, NSE 20 and NSE 25 decreasing by (8.3%), (10.1%) and (9.0%), respectively, attributable to the continued market sell-off as profit-taking investors move to safe havens. During the week, the market was on a downward trend, with NASI decreasing by (6.2%), while both NSE 20 and NSE 25 declined by (6.5%), taking their YTD performance to losses of (10.7%), (12.0%) and (10.7%), respectively. During the month, Standard Chartered Bank Kenya and insurer Sanlam introduced a new funeral cover, called Farewell Insurance Plan, and Barclays Bank of Kenya officially commenced trading on the Nairobi Securities Exchange (NSE) as ABSA Bank Kenya Plc;
Real Estate
During the month, Kenya Bankers Association published the Housing Price Index Q4’2019 Report, while Knight Frank released the Kenya’s Market Update for H2’2019. In the residential sector, the Principal Secretary for Housing and Urban Development, Mr. Charles Hinga announced that the Shauri Moyo and Starehe affordable housing projects in Nairobi’s Eastlands were set for commissioning, subject to the transfer of title deeds of the land from the National Treasury; Liason Homes announced that they were set to commence the construction of 32 bungalows in Nyeri town; while Eboss Investment Company, a local investment company announced plans to develop 120 housing units in a 20-acre gated community in Ruiru’s Membley area. Additionally, Helios Investments Partners, a UK-based private equity firm announced plans to make a new equity investment of Kshs. 10.0 bn in Acorn Holdings, the property developer behind branded hostels such as Qwetu. In the retail sector, Tendam group, a Spanish fashion retailer, opened its first Kenyan outlet at Westgate mall in Westlands; Quickmart opened its 27th outlet along Kamiti Road in Roysambu; Giordano, a Hong Kong fashion chain, opened its first outlet in Kenya at Garden City Mall; while Signature Mall rented space to Chandarana as their new anchor tenant following the exit of Choppies. In the hospitality sector, Kenya was ranked among top five African destinations for tourism by Safari Bookings, boosting travellers and investors’ confidence in Kenya as a travel destination. And finally, on infrastructure, Kenya Urban Roads Authority announced that the dualling of Ngong Road Phase 3 is set to be completed in July 2020;
Focus of the Week
We often get questions from investors about regulated versus unregulated markets. In this week’s topical, our Research Team seeks to educate the general public about these two types of markets/investment categories, which are complementary and important to well-functioning financial markets. As such, we shall discuss; (i) the regulated and unregulated investment categories, (ii) pros and cons of each investment category, (iii) issues to consider for each category, and (iv) myths about each category.
- Weekly Rates:
- Cytonn Money Market Fund closed the week at a yield of 11.0% p.a. To subscribe, just dial *809#;
- Cytonn High Yield Fund closed the week at a yield of 13.56% p.a. To subscribe, email us at sales@cytonn.com;
- Wacu Mbugua, Research Analyst, Cytonn Investments, attended an interview on K24 for a discussion on how the effects of saturation in the hospitality industry has caused over six old hotels put up for auction. Watch the story here;
- David Kingoo, Senior Risk and Compliance Associate, Cytonn Investments, was on Citizen TV to talk about the impact of pending loans to the present economy. Watch David here;
- Rodney Omukhulu, Assistant Investment Analyst, Cytonn Investments, was on CNBC to talk about how Kenya’s energy watchdog has cut electricity prices for large manufacturers in a bid to make the country more competitive for FDI’s when compared to other African countries. Watch Rodney here;
- Having completed and handed over Phase 1 of The Alma, and on track to hand over Phase 2, we have now turned our attention towards construction of The Ridge in Ridgeways. The Ridge is Cytonn’s 800-unit residential mixed-use development on the Northern Bypass. For more information please email us at sales@cytonn.com. We are now running a promotion in Phase 1 of The Ridge: Buy a unit in Phase 1, and get a 5% discount with a 15% deposit in March;
- Phase 1 of The Alma is now 100% sold with early buyers having achieved up to 55% capital appreciation. We are now running a promotion in Phase 2: Buy a unit in Phase 2 with a 15-year payment plan and 0% deposit. For inquiries, please email us on clientservices@cytonn.com. The site is open between 8 am - 5 pm, 7-days a week for site visits;
- For an exclusive tour of Cytonn’s real estate developments, visit: Sharp Investor's Tour and for more information, email us at sales@cytonn.com;
- We continue to hold weekly workshops and site visits on how to build wealth through real estate investments. The weekly workshops and site visits target both investors looking to invest in real estate directly and those interested in high yield investment products to familiarize themselves with how we support our high yields. Watch progress videos and pictures of The Alma, Amara Ridge, and The Ridge;
- We continue to see very strong interest in our weekly Private Wealth Management Training (largely covering financial planning and structured products). The training is at no cost and is open only to pre-screened participants. We also continue to see institutions and investment groups interested in the training for their teams. Cytonn Foundation, under its financial literacy pillar, runs the Wealth Management Training. If interested in our Private Wealth Management Training for your employees or investment group, please get in touch with us through wmt@cytonn.com. To view the Wealth Management Training topics, click here;
- For recent news about the company, see our news section here;
- We have 10 investment-ready projects, offering attractive development and buyer targeted returns. See further details here: Summary of Investment-Ready Projects.
Money Markets, T-Bills & T-Bonds Primary Auction:
During the month of February, T-bill auctions recorded an oversubscription, with the overall subscription rate coming in at 211.8%, compared to 164.1% recorded in the month of January 2020, attributable to favourable liquidity in the money market. The subscription rates for the 91-day paper recorded a decline to 70.3%, from the 86.2% recorded in January. The subscription rates for the 182-day and 364-day papers, however, were on a rise, coming in at 88.2% and 391.9%, higher than the 50.0% and 230.5% recorded in January, respectively. We note that there is continued pent up demand for the 364-day paper, having recorded the highest subscription rate of the 3 papers, which we attribute to the market having a bias to the shorter-dated papers to avoid duration risk. Given the scarcity of shorter-dated bonds in the primary market due to the government issuing medium-term and longer-dated papers in a bid to increase the debt maturity profile, this has seen most investors still keen on the primary fixed income market, finding the 364-day T-bill more attractive on a risk-adjusted return basis. The yields on the 91-day and 182-day papers both recorded increases of 0.1% points to close at 7.3% and 8.3%, respectively. The yield on the 364-day paper, however, recorded a decline of 20 bps, to close at 9.8% in February. The Central Bank remained disciplined in rejecting expensive bids given that it is currently 49.4% ahead of its domestic borrowing target, with the T-bills acceptance rate declining to 53.1% during the month, as compared to 84.2% recorded in January, with the government accepting a total of Kshs 107.9 bn of the Kshs 203.3 bn worth of bids received.
During the week, T-bills were oversubscribed, with the subscription rate coming in at 226.6%, up from 207.3% the previous week. The oversubscription is partly attributable to favourable liquidity in the money market evidenced by the average interbank rate declining to 4.1%, from 4.2% the previous week, on the back of government payments. The yield on the 91-day paper remained unchanged at 7.3%, while the yields on both the 182-day and 364-day papers declined by 0.1% points to close at 8.2% and 9.7%, respectively. The acceptance rate declined to 27.6%, from 69.8% recorded the previous week, with the government accepting only Kshs 15.0 bn of the Kshs 54.4 bn bids received attributable to reduced pressure given that the government is currently 49.4% ahead of its pro-rated domestic borrowing target.
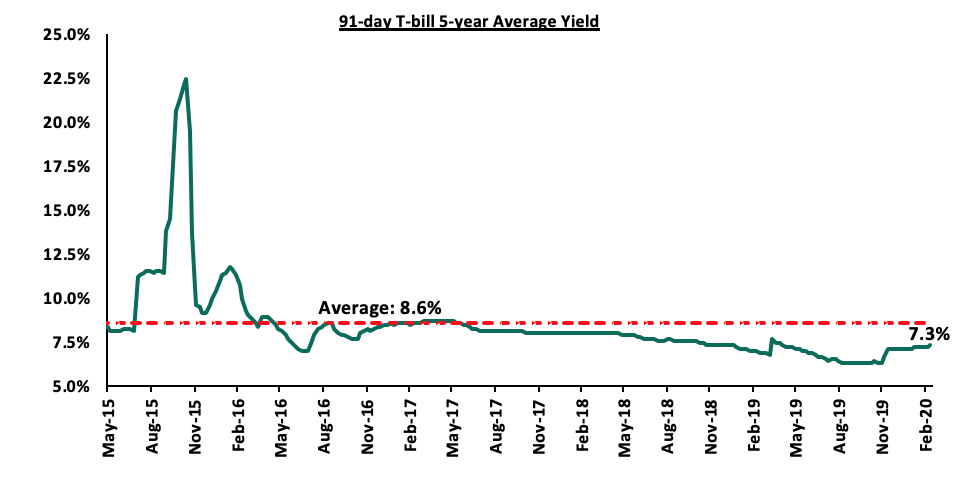
The 91-day T-bill is currently trading at a yield of 7.3%, which is below its 5-year average of 8.6%.
For the month of February, the Kenyan Government issued one new bond, the FXD1/2020/15 and reopened the FXD1/2018/25, with effective tenors of 15.0 and 23.3-years, respectively, and coupon rates of 12.8% and 13.4%, respectively, in a bid to raise Kshs 50.0 bn for budgetary purposes. The yield on the 15-year bond came in at 13.0%, while the yield on the 25-year bond came in at 13.6%. The overall subscription rate came in at 85.0%, with the government accepting Kshs 27.9bn of the Kshs 42.5 bn bids received. We note that this was lower than the quantum of Kshs 50.0 bn for the issue. The low performance was mainly attributable to the relatively long tenor periods of the two bonds with most investors trying to minimize duration risk.
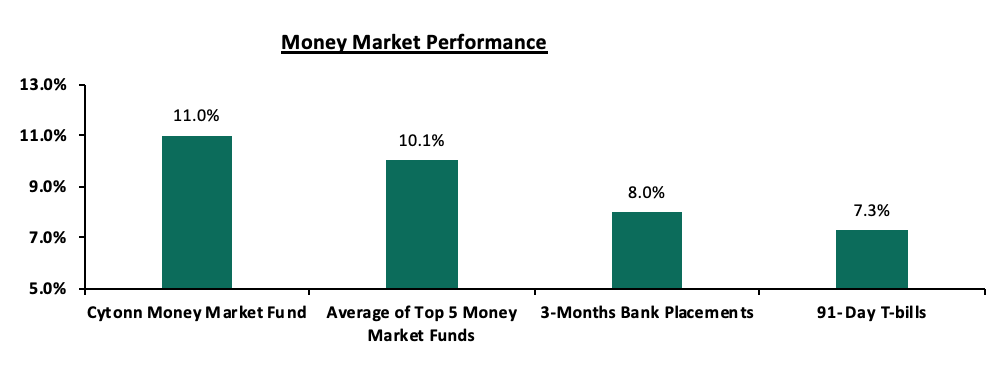
In the money markets, 3-month bank placements ended the week at 8.0% (based on what we have been offered by various banks), the 91-day T-bill came in at 7.3%, while the average of Top 5 Money Market Funds came in at 10.1%, which was similar to what was recorded in the previous week. The Cytonn Money Market Fund closed the week at 11.0%, unchanged from the previous week.
Secondary Bond Market:
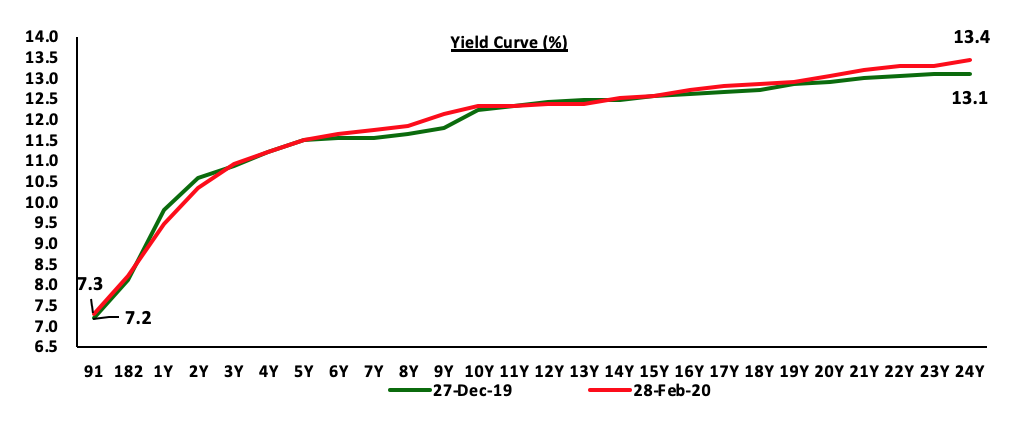
The yields on government securities in the secondary market remained relatively stable during the month of January, as the Central Bank of Kenya continued to reject expensive bids in the primary market. On a YTD basis, almost all papers have declined as yields readjust upwards with the exception of the 1, 2, and 5-year papers, causing prices declines as yields and prices have an inverse relationship.
Liquidity:
Liquidity in the money markets remained favourable during the month of February, with the average interbank rate remaining unchanged at 4.4%, supported by government open market activities with the CBK engaging in mopping up activities through repurchase agreements to ease up liquidity, which offset tax payments. During the week, the average interbank rate declined to 4.1%, from 4.2% recorded the previous week, pointing to improved liquidity in the money markets. The average interbank volumes rose by 79.0% to Kshs 15.7 bn, from Kshs 8.8 bn recorded the previous week.
Kenya Eurobonds:
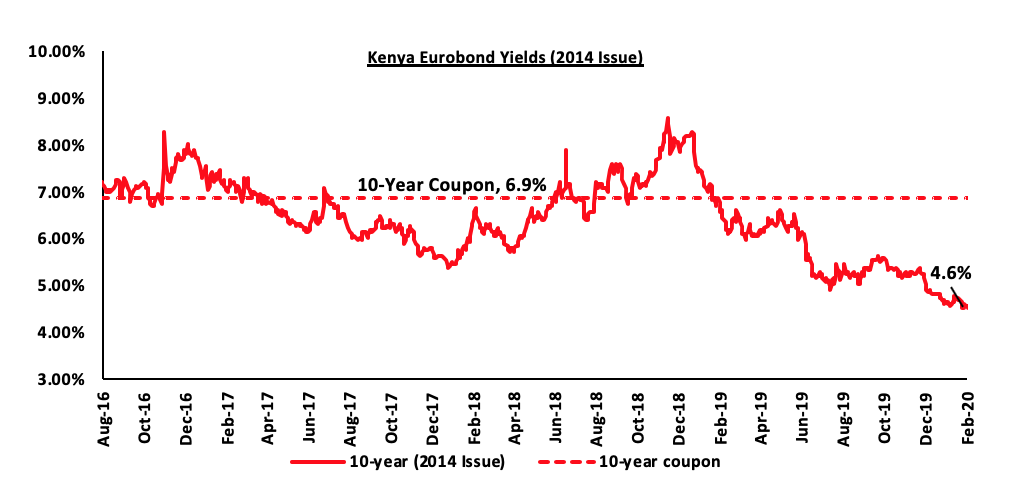
According to Reuters, the yield on the 10-year Eurobond issued in June 2014 decreased by 0.1% points to 4.6% in February, from 4.7% in January 2020. During the week, the yield on the 10-year Eurobond increased by 0.1% points to 4.6%, from 4.5% recorded the previous week.
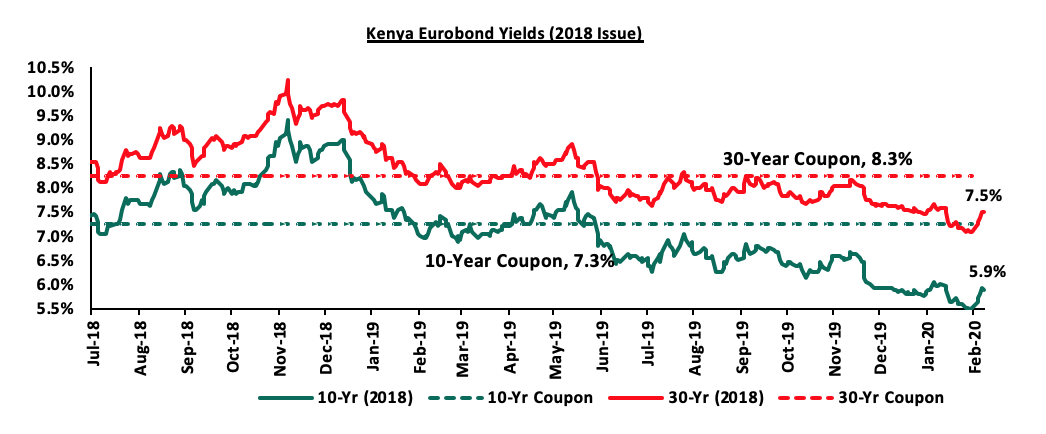
During the month, the yields on the 10-year and 30-year Eurobonds issued in February 2018 both increased by 0.1% points to close at 5.9% and 7.5% in February from 6.0% and 7.6%, respectively, in January 2020. During the week, the yields on the 10-year and 30-year Eurobonds increased by 0.4% points to close at 5.9% and 7.5%, respectively, from 5.5% and 7.1% recorded the previous week.
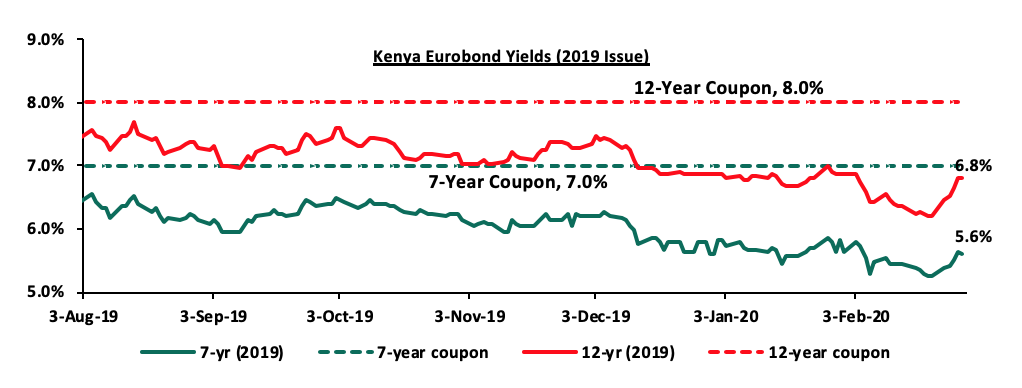
During the month, the yield on the 7-year Eurobond issued in 2019 remained unchanged at 5.6%, similar to what was recorded in January 2020. The yield on the 12-year Eurobond however declined by 0.1% points to 6.8%, from 6.9% in January 2020. During the week, the yield on the 7-year Eurobond declined by 0.3% points to 5.6%, from 5.3% the previous week, while the 12-year Eurobond declined by 0.6% points to 6.8%, from 6.2% recorded the previous week.
Kenya Shilling:
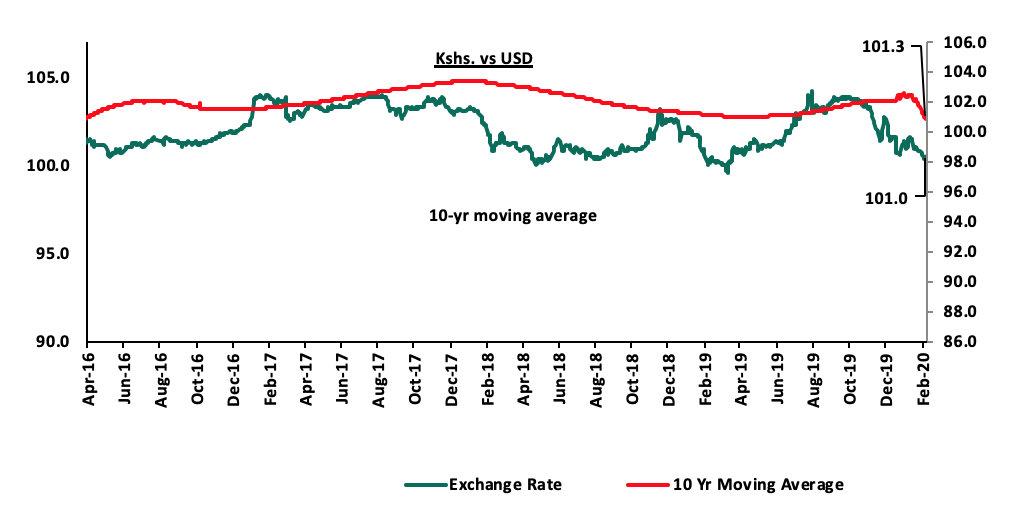
The Kenya Shilling depreciated by 0.4% against the US Dollar during the month of February to Kshs 101.0, from Kshs 100.6 at the end of January, attributable to US Dollar inflows from tourism and diaspora remittances. During the week, the Kenya Shilling appreciated against the US Dollar by 0.3% to close at Kshs 101.0, from Kshs 101.3 recorded in the previous week. The appreciation was mostly supported by inflows from offshore investors buying government debt, which mitigated the cyclical effects of heightened end month dollar demand from oil and merchandise importers meeting their end month obligations. On a YTD basis, the shilling has appreciated by 0.3% against the dollar, in comparison to the 0.5% appreciation in 2019. In our view, the shilling should remain relatively stable against the dollar in the short term with a bias to a 2.4% depreciation by the end of 2020, supported by:
- The narrowing of the current account deficit, with preliminary data indicating that Kenya’s current account deficit was equivalent to 4.6% of GDP in 2019, from 5.0% recorded in 2018. This was mainly driven by lower imports of SGR-related equipment, resilient diaspora remittances, which cumulatively stood at USD 2.8 bn in December 2019, a 3.7% increase from the USD 2.7 bn recorded in December 2018, and strong receipts from transport and tourism services with preliminary data indicating that the number of tourists landing in the country stood at 132,019 in month of December 2019, which was a 9.0% increase from the 121,070 recorded in November 2019,
- High levels of forex reserves, currently at USD 8.4 bn (equivalent to 5.1-months of import cover), above the statutory requirement of maintaining at least 4.0-months of import cover, and the EAC region’s convergence criteria of 4.5-months of import cover,
- Foreign capital inflows, with investors looking to participate in the domestic equities market, and,
- CBK’s supportive activities in the money market, such as repurchase agreements and selling of dollars.
We, however, expect pressure on the Kenya Shilling to arise from subdued diaspora remittances growth following the close of the 10.0% tax amnesty window in July, which has seen cumulative diaspora remittances increase by a 3.7% in the 12-months to December 2019 to USD 2.8 bn, from USD 2.7 bn in 2018.
Inflation:
|
Major Inflation Changes in the Month of February 2020 |
|||
|
Broad Commodity Group |
Price change m/m (February-20/ January -20) |
Price change y/y (February-20/February-19) |
Reason |
|
Food & Non-Alcoholic Beverages |
2.6% |
10.6% |
The m/m increase was due to an increase in prices of commodities such as tomatoes, onions, and spinach |
|
Transport Cost |
0.3% |
5.0% |
The m/m decline was mainly on account of increase in the prices of petrol and diesel |
|
Housing, Water, Electricity, Gas and other Fuels |
0.5% |
3.0% |
The m/m increase was mainly as a result of an increase in the cost of house rent |
|
Overall Inflation |
0.6% |
6.4% |
The m/m increase was due to a 2.6% increase in the food index which has a CPI weight of 36.0% |
The y/y inflation for the month of February increased to 6.4%, from 5.8% recorded in January 2020, which was not in line with our projections of 5.9% - 6.2%, with the marginal variance being attributable to an underestimate of the increase in inflation of the food and non-alcoholic beverages index. Month-on-month inflation came in at 0.6%, which was attributable to:
- A 2.6% increase in the food and non-alcoholic drinks’ index, due to an increase in prices of significant food items including tomatoes, onions, and spinach, which increased by 29.6%, 7.3%, and 3.2%, respectively,
- A 0.5% increase in the housing, water, electricity, gas and other fuels index, as a result of an increase in the cost of house rent by 0.2%, and,
- A 0.3% increase in the transport index on account of rising petrol and diesel prices by 2.5% and 2.1%, respectively.
Going forward, we expect the inflation rate to remain within the government set range of 2.5% - 7.5%. We however expect inflationary pressure to arise from increased fuel prices due to increased external uncertainties arising from the ongoing geopolitical events. Risks are also present on food inflation due to the locust invasion, which could have a negative impact on agricultural output.
Monthly Highlights:
- In a statement from The Capital Markets Authority (CMA), on February 13th 2020, Amana Capital received a no objection to a 28-day moratorium to enable the fund manager, Amana Capital Limited (ACL), work with its Trustee, NatBank Trustee & Investment Services Limited, to improve its liquidity position to meet redemption obligations to unit holders with investments in the Amana Shilling Fund, effectively stopping clients from withdrawing their funds. Key to note, the freeze has been in place for 2 years. This was following losses from investing in the Commercial Paper programme for Nakumatt, since holders of the commercial papers valued at Kshs 4.0 bn stand the lowest chance of recovering their investments post liquidation with the amounts obtained from the sale of Nakumatt’s assets expected to be distributed in order of preference with the administrator and preferential status creditors having the right to receive payment first. The reported loss on Amana Shilling Fund was at Kshs 275.0 mn equivalent to 20.0% of the Fund. Amana Capital has since then called for an EGM of Unit Holders on 28th February 2020, where the agenda of the meeting was as follows:
- Update on the status of funds invested in the different class of units,
- Seeking the consent of the Class B unit holders and passing the resolution for the extension of the moratorium period on Class B of the money market fund by a further six months up to and including 6 August 2020, and,
- Creation of Class C shares.
We are yet to get the details of the resolutions passed in the EGM.
In our view, we believe it is easier to assist a fund in distress while it is still open for business; once it closes its doors, the task becomes impossible. Amana has run into trouble because it invested in Nakumatt Commercial Paper where post Nakumatt liquidation, all CP investors will end up with nothing. For illustrative purposes, Nakumatt made up 20.0% of Amana’s portfolio, which would effectively mean that each unit holder needs to take a 20.0% haircut on the value of their investment. We believe the best resolution would have been to:
- Run a quick sale process of the Amana Money Market Fund to a fund manager that enjoys market confidence of money market investors,
- The new manager would write down the value of each investor’s unit to 80.0% their statement value, and then,
- Give Amana unit holders units in the new manager’s fund, equivalent to the value of the written down Amana units. This would preserve the most value for Amana unit holders, provide immediate liquidity to Amana unit holders, and prevent unnecessary market disruption. We believe freezing a fund destroys the maximum value for unit holders and brings unnecessary market jitters, and should be avoided.
- Moody’s Credit Agency released an update highlighting Kenya’s international creditworthiness. Kenya’s rating by the agency was maintained at B2 with a stable outlook, on the back of relative diversification of the economy and moderate economic strength. The agency, however, warned that Kenya’s debt burden coupled with poor revenue collection may negatively affect the country’s credit rating. The country’s high reliance on commercial external debt imposes a negative impact on the country’s rating as the country’s national debt currently exceeds Kshs 5.0 tn, with the debt to GDP ratio having increased to 62.0% of the GDP, compared to 58.0% in 2018. For more information, see our Cytonn Weekly #08/2020.
- Capital Economics, an independent macroeconomic research firm based in London, downgraded the GDP growth projection for Kenya in 2020 by 0.2% points to 5.9% from the previously projected 6.1% given the locust invasion crisis, which it highlighted could lead to a fall in agricultural production in the country. For more information, see our Cytonn Weekly #08/2020.
The table below shows GDP projections from 10 firms with the consensus GDP growth as per the 10 firms below expected to come in at 6.0%.
|
|
Kenya 2020 Annual GDP Growth Outlook |
|
|
No. |
Organization |
Q1’2020 |
|
1. |
Central Bank of Kenya |
6.2% |
|
2. |
Citigroup Global Markets |
6.2% |
|
3. |
International Monetary Fund |
6.1% |
|
4. |
African Development Bank |
6.0% |
|
5 |
World Bank |
6.0% |
|
6. |
National Treasury |
6.0% |
|
7. |
African Development Bank (AfDB) |
6.0% |
|
8. |
Capital Economics |
5.9% |
|
9. |
Cytonn Investments Management PLC |
5.7% |
|
10 |
United Nations Conference on Trade and Development (UNCTAD) |
5.5% |
|
|
Average |
6.0% |
- Stanbic Bank released the Stanbic Bank’s Monthly Purchasing Manager’s Index (PMI), highlighting that the Kenyan private sector business activity declined at the start of the year, amid the softest uplift in new orders since April 2019. The seasonally adjusted PMI index came in at 49.7, down from the 53.3 seen in December 2019, pointing towards a decline in business conditions since a reading of above 50 indicates improvements in the business environment, while a reading below 50 indicates a worsening outlook. Overall activity levels contracted with firms reporting that lack of money in households led to softer demand pressure. For more information, see our Cytonn Weekly #06/2020.
- African Development Bank (AfDB) released their African Economic Outlook 2020, highlighting the economic projections and prospects for each of the 54 countries and the continent as a whole. According to the report, Kenya’s economy grew by an estimated 5.9% in 2019, lower than the 6.0% seen in 2018, mainly attributable to unfavourable weather and reduced government investment. The economy is expected to expand by 6.0% in 2020 and 6.2% in 2021. For more information, see our Cytonn Weekly #06/2020.
Rates in the fixed income market have remained relatively stable as the government rejects expensive bids. The government is 49.4% ahead of its domestic borrowing target, having borrowed Kshs 310.6bn against a pro-rated target of Kshs 207.9 bn. We expect an improvement in private sector credit growth considering the repeal of the interest rate cap. This may result in increased competition for bank funds from both the private and public sectors, resulting in upward pressure on interest rates. Owing to this, our view is that investors should be biased towards short-term fixed-income securities to reduce duration risk.
Markets Performance
During the month of February, the equities market was on a downward trend, with NASI, NSE 20 and NSE 25 decreasing by (8.3%), (10.1%) and (9.0%), respectively, attributable to the continued market sell-off as profit-taking investors move to safe havens. During the week, the market was on a downward trend, with NASI decreasing by (6.2%), while both NSE 20 and NSE 25 declined by (6.5%), taking their YTD performance to losses of (10.7%), (12.0%) and (10.7%), respectively. The decline in NASI was largely due to losses recorded in large-cap counters such as DTB Kenya, Bamburi, KCB and Co-operative Bank, which recorded losses of (10.7%), (10.4%), (10.1%), and (8.8%), respectively.
Equities turnover decreased by 0.4% during the month to USD 121.5 mn, from USD 122.0 mn in January 2020. During the month, foreign investors turned net sellers with a net selling position of USD 26.3 mn, compared to January’s net buying position of USD 5.2 mn. During the week, equities turnover increased by 19.3% to USD 29.0 mn, from USD 24.3 mn the previous week, bringing the year to date (YTD) turnover to USD 243.5 mn. Foreign investors remained net sellers during the week, with a net selling position of USD 3.1 mn, from last week’s net selling position of USD 14.7 mn.
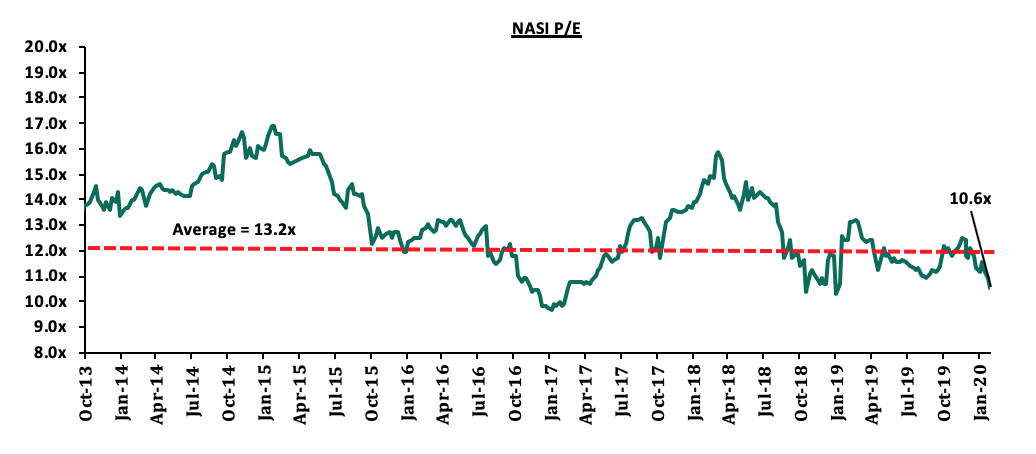
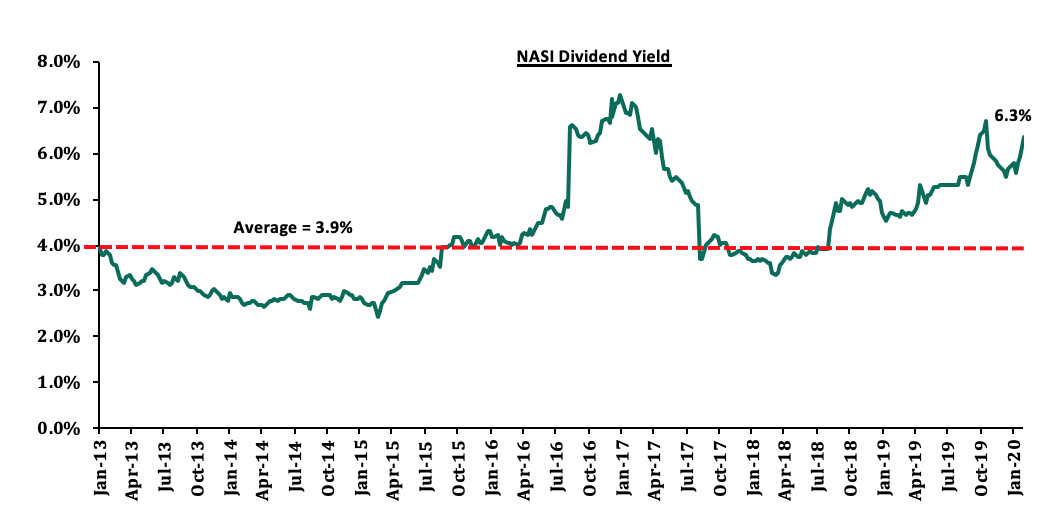
The market is currently trading at a price to earnings ratio (P/E) of 10.6x, 20.2% below the historical average of 13.2x, and a dividend yield of 6.3%, 2.4% points above the historical average of 3.9%. With the market trading at valuations below the historical average, we believe there is value in the market. The current P/E valuation of 10.6x is 9.0% above the most recent trough valuation of 9.7x experienced in the first week of February 2017, and 27.3% above the previous trough valuation of 8.3x experienced in December 2011. The charts below indicate the historical P/E and dividend yields of the market.
Monthly Highlights
- Safaricom opened talks with a consortium of undisclosed investors who would be involved in the bid for one of the two Ethiopian telecom licenses due to the high entry costs expected to scale above Kshs 100.0 bn. In November 2019, the company entered into a joint bid with Vodacom (which owns a 35.0% stake in Safaricom); however, more telecommunication firms such as Vodafone (which also owns a 5.0% stake) are expected to join the partnership ahead of Safaricom’s bid set to be lodged in April this year. For more information, please see Cytonn Weekly #08/2020
- Standard Chartered Bank Kenya and insurer Sanlam introduced a new funeral cover, Farewell Insurance Plan, which will give policyholders an option of cashing in part of the premiums paid. Policyholders can be reimbursed up to six months’ worth of premiums after making payments for four-years. As noted in our H1’2019 Listed Insurance Report, the insurance sector has benefited from convenience and efficiency through the adoption of alternative channels for both distribution and premium collection such as Bancassurance and improved agency networks in efforts to deepen insurance penetration levels, which is still low at 2.4% of GDP as of 2019, compared to the 2018 continental average of 3.5%. For more information, please see Cytonn Weekly #06/2020
- Barclays Bank of Kenya officially commenced trading on the Nairobi Securities Exchange (NSE) as ABSA Bank Kenya Plc, after the bourse temporarily suspended the trading of the lender’s shares to allow the settlement of outstanding obligations as well as change of its trading ticker code, as the lender finalized its brand transition. The rebranding ended a process that began in 2018, following Barclays Plc’s reduction of its stake in Barclays Africa Group from 62.0% to 15.0%. As at Q3’2019, Barclays disclosed that it had spent Kshs 910.0 mn in rebranding expenses in the nine months to September 2019. For more information, please see Cytonn Weekly #07/2020
Universe of Coverage
|
Banks |
Price at 21/02/2019 |
Price at 28/02/2020 |
w/w change |
m/m change |
YTD Change |
Year Open |
Target Price* |
Dividend Yield |
Upside/ Downside** |
P/TBv Multiple |
Recommendation |
|
Diamond Trust Bank |
112.0 |
100.0 |
(10.7%) |
(10.7%) |
(8.3%) |
109.0 |
189.0 |
2.6% |
91.6% |
0.5x |
Buy |
|
Kenya Reinsurance |
3.0 |
2.8 |
(6.0%) |
(6.0%) |
(7.6%) |
3.0 |
4.8 |
16.1% |
87.5% |
0.3x |
Buy |
|
I&M Holdings*** |
54.5 |
50.0 |
(8.3%) |
(9.1%) |
(7.4%) |
54.0 |
75.2 |
7.8% |
58.2% |
0.8x |
Buy |
|
KCB Group*** |
50.0 |
45.0 |
(10.1%) |
(14.1%) |
(16.8%) |
54.0 |
64.2 |
7.8% |
50.6% |
1.2x |
Buy |
|
Co-op Bank*** |
14.9 |
13.6 |
(8.8%) |
(11.4%) |
(17.1%) |
16.4 |
18.1 |
7.4% |
41.0% |
1.2x |
Buy |
|
Jubilee Holdings |
352.5 |
338.0 |
(4.1%) |
(6.1%) |
(3.7%) |
351.0 |
453.4 |
2.7% |
36.8% |
1.1x |
Buy |
|
Equity Group*** |
49.5 |
45.3 |
(8.6%) |
(9.5%) |
(15.4%) |
53.5 |
56.7 |
4.4% |
29.7% |
1.7x |
Buy |
|
Sanlam |
16.7 |
17.0 |
2.1% |
(3.4%) |
(1.2%) |
17.2 |
21.7 |
0.0% |
27.6% |
0.7x |
Buy |
|
NCBA |
35.8 |
33.1 |
(7.5%) |
(8.3%) |
(10.2%) |
36.9 |
37.0 |
4.5% |
16.3% |
0.8x |
Accumulate |
|
Liberty Holdings |
9.5 |
9.1 |
(4.2%) |
(11.5%) |
(11.9%) |
10.4 |
10.1 |
5.5% |
15.8% |
0.8x |
Accumulate |
|
Standard Chartered |
201.8 |
200.5 |
(0.6%) |
1.3% |
(1.0%) |
202.5 |
211.6 |
9.5% |
15.0% |
1.5x |
Accumulate |
|
ABSA Bank*** |
13.0 |
13.0 |
0.0% |
(1.1%) |
(3.0%) |
13.4 |
13.0 |
8.5% |
8.9% |
1.7x |
Hold |
|
CIC Group |
2.7 |
2.6 |
(1.9%) |
(9.3%) |
(1.9%) |
2.7 |
2.6 |
4.9% |
5.3% |
0.9x |
Hold |
|
Stanbic Holdings |
106.0 |
112.0 |
5.7% |
(1.8%) |
2.5% |
109.3 |
103.1 |
4.3% |
(3.7%) |
1.2x |
Sell |
|
HF Group |
5.3 |
4.6 |
(14.2%) |
(18.8%) |
(29.6%) |
6.5 |
4.2 |
0.0% |
(7.7%) |
0.2x |
Sell |
|
Britam |
8.1 |
7.3 |
(9.2%) |
(16.6%) |
(18.4%) |
9.0 |
6.8 |
0.0% |
(8.0%) |
0.7x |
Sell |
|
*Target Price as per Cytonn Analyst estimates **Upside/ (Downside) is adjusted for Dividend Yield ***Banks in which Cytonn and/or its affiliates are invested in |
|||||||||||
We are “Positive” on equities for investors as the sustained price declines has seen the market P/E decline to below its historical average. We expect increased market activity, and possibly increased inflows from foreign investors, as they take advantage of the attractive valuations, to support the positive performance.
- Industry Reports
During the month, several real estate related reports were released:
|
Industry |
Report |
Take-outs |
|
|
1. |
Residential |
Housing Price Index Q4’2019 Report, by Kenya Bankers Association (KBA) |
|
|
2. |
Residential |
Kenya’s Market Update for H2’2019 by Knight Frank |
|
- Residential report
- Eboss Investment Company, a local investment company in Kiambu, announced plans to develop 120 villas within a 20-acre gated community in Ruiru’s Membley area. The proposed development will comprise of 3, 4 and 5-bedroom units (unit sizes are yet to be disclosed) selling at Kshs 18.5 mn, Kshs 21.0 mn and Kshs 24.0 mn, respectively. The project indicates continued investor focus on satellite towns such as Ruiru where development class land is available in bulk and at affordable prices. According to Cytonn’s Cytonn Annual Real Estate Market Review Note 2019, detached residential units in Ruiru recorded an average price appreciation of 1.6% and an average rental yield of 4.3%, compared to the detached market average rental yield and price appreciation of 4.2% and 1.5%, respectively. Some of the factors supporting Ruiru market as an investment area include; (i) ease of accessibility through the Thika Superhighway, Kamiti Road and Eastern Bypass, (ii) improving infrastructure with the area mapped for expansion of the sewerage system, and (iii) the growing working population as Ruiru doubles up as an industrial hub evidenced by the various industrial parks in the peripheries of the town. Supported by the availability of development class land in bulk and at affordable prices, we expect satellite towns such as Ruiru and Machakos to continue witnessing increased investor activities.
- During the month, Helios Investments Partners, a private equity firm announced that it will be making a new equity investment of up to Kshs 10.0 bn in Acorn Holdings, the local property developer. Approximately Kshs 2.6 bn of the investment will be used to fund the development of student hostels, a sector the developer has been focusing on with Qwetu hostels. In Kenya, Acorn is the first developer to offer branded private student housing accommodation on a large scale and so far, it has developments in Jogoo Road, Ruaraka, Parklands and Wilson View areas, targeting the growing population of students in higher learning institutions in Kenya. According to Cytonn Research, modern student hostels have potentially high yields of between 7.2% - 9.6% compared to the conventional real estate sectors i.e., commercial office, retail, and residential, whose average yields were 7.0% as at 2019. Currently, real estate market players have been facing a great challenge in raising development funds especially with the current restrictive capital markets structure and therefore, the move by Helios Investments, will be a great financial boost for the developer who has also previously listed a Kshs 4.3 billion green bond on the Nairobi Securities Exchange (NSE) and the London Stock Exchange (LSE), intended to finance the developer’s sustainable and climate-resilient student accommodation in Kenya.
- During the month, The National Treasury Cabinet Secretary, Mr. Ukur Yatani, announced that the Kenya Mortgage Refinance Company (KMRC) will from April 2020, begin lending money to local financial institutions at an annual interest rate of 5.0%, enabling them to write home loans at 7.0%, 6.0% points lower than the market rate of approximately 13.0%, according to the Central Bank of Kenya. However, in our view there is need for clarity on how the 5.0% will be achieved and sustained given that government’s 20-year borrowing rate, which is the most relevant tenor for a 20- year mortgage stands at approximately 12.9% p.a locally, and thus the resultant difference. KMRC is an initiative of the National Treasury and the World Bank, whose main objective is to grow Kenya’s mortgage market by providing long-term funding to primary mortgage lenders. According to the Cabinet Secretary, the maximum loan limit will be Kshs 4.0 mn with a 20-year repayment period, which translates to monthly mortgage repayments of Kshs 31,012, 45.3% lower than the Kshs 56,656 at market rate This is expected to result in increased mortgage uptake, which has been crippled by the relatively high interest rates, short term loans with average mortgage tenor of 10.6 years, according to the Bank Supervision Annual Report 2018 and huge initial deposits required at approximately 10.0% of the property value. Therefore, with the low interest rates and increased tenor, KMRC aims to escalate the number of mortgage accounts to an estimated 60,000 by 2022, from the current 26,504 as at 2018 according to the Central Bank of Kenya. This will also boost the mortgage penetration in Kenya, which has remained significantly low at approximately 3.1% of the GDP compared to other developed countries such as South Africa and the United States of America with 30.0% and 70.0%, respectively.
- We expect the above to boost homeownership, which has remained low with only approximately 26.0% of urban dwellers owning the houses they live in according to World Bank, by improving the primary and secondary mortgage markets, in the wake of soaring property prices and low-income levels. Nevertheless, in our view, the KMRC is likely to face challenges such; (i) difficulty in raising funds through issuing of bonds due to competition from other government instruments such as treasury bills and government, (ii) lack of access to long term funding to match KMRC’s proposed 20-year tenor, and (iii) a high cost of debt as the investors of the mortgage-backed bonds are likely to demand a relatively high rental yield of approximately 13.5%, assuming a 1.0%-point margin above the minimum of the risk-free rate for a 15-year bond, which currently stands at 12.5%, yet KMRC’s target is lending at a 5.0% interest rate. For more details, see our KMRC Topical.
On the affordable housing front, the government initiative continues to take shape with several activities recorded during the month;
- The Principal Secretary for Housing and Urban Development, Mr. Charles Hinga announced that the Shauri Moyo and Starehe affordable housing projects in Nairobi’s Eastlands were set for commissioning subject to the transfer of title deeds of the land from the National Treasury. The above is an indication of the National Government’s continued focus on the provision of affordable housing mainly for the low and middle-income earners, with the program seeking to construct 500,000 units by 2022, in counties such as Nairobi, Nakuru, and Kiambu. For more information see Cytonn Weekly #06/2020,
- The Ministry of Housing announced that the construction of Jevanjee Estate was set to start (dates undisclosed), marking the third of the seven flagship projects under the Nairobi Urban Renewal Project. The project will have a total of 1,800 units at an estimated cost of Kshs 9.1 bn, with the contract having been awarded to Jabavu Limited, a Ugandan-based real estate developer, in 2016. For more information see Cytonn Weekly #07/2020, and,
- Local microfinance institution, Harambee Sacco, announced plans to facilitate the construction of 1,000 affordable housing units following the extension of a Kshs 3.0 bn loan facility from the Kenya Mortgage Refinancing Company (KMRC), marking the secondary mortgage company’s first portfolio. For more analysis on this see Cytonn Weekly #07/2020.
In addition, Liason Homes, a local real estate developer, announced that they are set to begin construction of 32 bungalows in a gated community on Kenyatta Road in Nyeri Town, with phase one expected to be completed in 2021. The project dubbed ‘Orchard Park’ will consist of 3-bedroom units of 135 SQM priced at Kshs 4.9 mn and projected rent of Kshs 45,000. For more analysis see Cytonn Weekly #07/2020.
We expect increased activities associated with provision of affordable housing to continue shaping the residential sector fuelled by a growing population of low-middle income earners, in addition to relatively high demand for housing units supported by the availability of housing finance through the KMRC. We also expect to witness development activities in satellite areas such as Nyeri, Machakos, Ruiru and Nakuru driven by availability of development land, improved infrastructure and affordable property prices.
- Retail Sector
Signature Mall, a 259,300 SQFT neighbourhood shopping facility located in Athi River, rented space to Chandarana Food Plus, a local supermarket chain, as their anchor tenant following the exit of Choppies. The entry of Chandarana is expected to boost the mall’s customer traffic amidst low occupancy rates of 76.1% in 2019, a decline from 84.5% in 2018 in community malls as a result of an existing oversupply of space in the local retail market, current tough economic times and increased vacancy rates due to exits by troubled retailers such as Choppies and Nakumatt. According to Cytonn Kenya Real Estate Retail Sector Report 2019, the continued focus on satellite towns by the retailers is attributed to;
- Relatively low rents of approximately Kshs 131.4 per SQFT, 28.3% lower than the market average of Kshs 168.6 per SQFT,
- Low formal retail space penetration of approximately 35.0% in Kenya especially in satellite areas, compared to 60.0% in developed countries such as South Africa according to a Nielsen Report,
- Affordable property prices as land prices remain relatively lower at an average of Kshs 24.9 mn per acre in comparison to land prices in Nairobi suburbs such as Kilimani, Kileleshwa, Westlands and Parklands which have average price of Kshs 137.5 mn per acre,
- Increased purchasing power of Kenya’s growing middle class resulting in continued demand for retail products, and,
- Changes in tastes and preferences by the growing middle class thus fuelling the growth of retail chains.
We expect that the sector will continue to witness increased entry of local and international retailers into malls in satellite towns resulting in increased uptake of retail space in malls, with the occupancy rates projected to come in at 73.7% from 75.9% in 2019, according to Cytonn Market Outlook 2020.
The retail sector also recorded the entry and expansion of other local and international retailers as follows;
- Tendam Group, a Spanish fashion retailer, opened its first Kenyan outlet at the Westgate shopping mall in Westlands. The retail store will consist of ‘Women’s Secret’ and ‘Springfield’ brands that will specialize in men's and women's fashion. The entry of the retailer into the market is an indication that Westlands’ retail sector continues to attract international investors, with others such as Hugo Boss and Mango having gained a foothold in the market in 2019. For more analysis see Cytonn Weekly #06/2020,
- Quickmart, a local retailer, opened its latest outlet along Kamiti Road in Roysambu, off the Nairobi-Thika Superhighway, marking its 27th location nationwide following recent openings in Ongata Rongai and along Waiyaki Way. These developments indicate the local and international retailers’ confidence in Kenya’s retail consumer market. For more information see Cytonn Weekly #06/2020, and,
- Giordano, a Hong Kong fashion chain, opened its first Kenyan outlet at Garden City Mall as it aims at targeting Kenya’s market with its casual wear and accessories. The chain has over 2,400 stores worldwide in 40 countries including Zambia and South Africa that were opened in 2015 and 2018, respectively. For more information see Cytonn Weekly #08/2020.
The above developments are an indication of investors’ confidence in Kenya’s retail market supported by; (i) increased purchasing power of Kenya’s growing middle class, (ii) changes in tastes and preferences by the growing middle class, and, (iii) the improving infrastructure, and we expect this to continue fuelling the entry of both local and international retailers into the market.
- Hospitality sector
During the month, Kenya was ranked among the top five African destinations for tourism by Safari Bookings, an online site that compares Africa’s safaris, coming in after Botswana, Tanzania, Zambia, and Zimbabwe. The ranking was supported by the country’s’; (i) excellent wildlife viewing, including the annual wildebeest migration, (ii) a wide variety of habitats and scenery, and (iii) the beautiful beaches with a variety of resorts. Such positive accolades continue to boost investors’ confidence in Kenya as a travel destination thus boosting the tourism sector’s performance, which has been recording increase of tourist arrivals and tourism earnings over the past couple of years. For more analysis see Cytonn Weekly #08/2020.
We expected the hospitality sector to remain vibrant supported by: (i) positive accolades boosting travellers’ confidence, (ii) improving infrastructure to and around tourism hotspots, (iii) improved security and flight operations e.g. direct flights to New York, and (iv) continued marketing efforts by the Kenya Tourism Board.
- Infrastructure
During the month, Kenya Urban Roads Authority announced that the Dualling of Ngong Road Phase 3 is set to be completed in July 2020. The Ngong Road stretch for Phase 3 valued at Kshs 2.0 bn is currently being constructed by China Qinjian. On completion, the expansion of the road is likely to ease accessibility of areas such as Lang’ata, Kilimani and Karen, increasing the connectivity and reducing traffic congestion, boosting property values in these areas. Infrastructural development plays a key role in the development of the economy as a whole through enhancing connectivity and the creation of a better operating environment for individuals and businesses alike. The impact infrastructure on the real estate sector include; (i) increased real estate development projects as infrastructural development opens up previously inaccessible areas and improves connectivity thus making areas more attractive for investment, (ii) increased demand for property, which then results in an increase in property prices, and (iii) reduced development costs- according a Centre for Affordable Housing Finance in Africa report, infrastructural costs in Kenya account for approximately 25.6% of construction costs.
We expect the infrastructural development to remain a top priority for the government with the aim of boosting the economy. On the other hand, investors are therefore likely to align their developments with infrastructural projects given the expected benefits including higher demand, price appreciation and savings on construction costs.
- Listed Real Estate
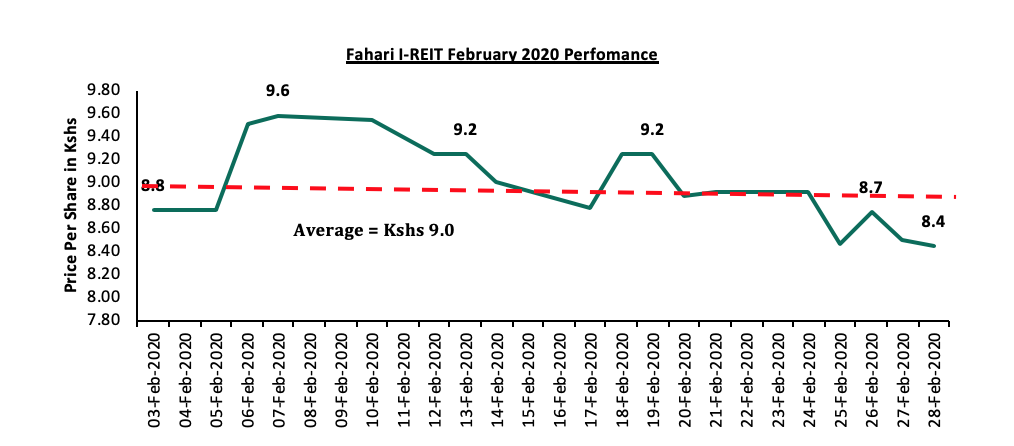
On the bourse, Stanlib Fahari I-REIT price per share declined by 6.6% to close at Kshs 8.4 at the end of February, from Kshs 9.0 at the end of January 2020. On average, the REIT traded at Kshs 9.0 per share, a 4.3% decline from an average of Kshs 9.4 per share in January 2020. The instrument has continued to trade in low prices and volumes, constrained by negative market sentiments around REITs performance, inadequate investor knowledge and lack of institutional support for REITs.
We expect the real estate sector to continue recording several activities fuelled by; (i) the continued focus on the affordable housing initiative, (ii) student housing projects (iii) continued entry and expansion of both local and international retailers, (iv) improved tourism activities with the recognition of Kenya as a top tourism destination, and (V) continued infrastructural development in Kenya.
We often get questions from investors about regulated versus unregulated markets. In this week’s topical, our Research Team seeks to educate the general public about these two types of markets/investment categories, which are complementary and important to well-functioning financial markets. As such, we shall discuss the following:
- Regulated and Unregulated Investment Categories,
- Pros and Cons of Each Investment Category,
- Issues to Consider for Each Category,
- Myths About Each Category,
- Conclusion.
Section I: Regulated and Unregulated Investment Categories
Investment markets from a regulatory point of view can be divided into two large categories, regulated and unregulated markets.
Regulated markets are overseen by a regulator to protect the public interest in those markets, hence they are also loosely referred to as public markets. Products in this market tend to be standardized and easily accessible to the public. For example, if you want a fixed deposit you can walk to any banking hall and get one, if you want to buy shares of say, Safaricom, you can call any broker, and if you want to buy government bonds, you can call any broker or walk to a Central Bank of Kenya (CBK) banking hall. Regardless of which broker you call, you will get the same standardized share of Safaricom. The offering of the product needs to have been reviewed and approved by the respective regulator before the investment products can be sold to the public. If a product is a banking product, it’s regulated by CBK, an insurance product by Insurance Regulatory Authority (IRA), shares/equities and Unit Trust Funds / Mutual Funds by Capital Markets Authority (CMA), and pension products by Retirement Benefits Authority (RBA).
Unregulated products are not regulated by a specific regulator; however, the manner of offering is usually regulated so that it is qualified to be outside the scope of regulation. The manner of offering is usually private; hence they are also loosely referred to as private products or private offers; and because they are an alternative to public markets products, they are also referred to as alternative markets. Below is a table showing the different types of investment products available in the two categories:
|
Investment Products Available to Investors |
|
|
Regulated Products |
Unregulated Products |
|
|
Source: Cytonn Investments
Section II: Pros and Cons of Each Investment Category
Like with any investment, each investment category has its advantage and disadvantages. No product is better or worse than the other, they both serve unique purposes depending on an investor’s specific investment objective and risk appetite. The below shows the pros and cons of investing in any of the two categories:
|
Regulated vs Unregulated Products – Pros & Cons |
||
|
|
Pros |
Cons |
|
Regulated Products |
|
|
|
Unregulated Products |
|
|
Source: Cytonn Investments
Section III: Issues to Consider for Each Category
There are a number of areas for an investor to consider before making an investment decision, and this usually boils down to financial planning and unique preferences for an investor, after they have considered the pros and cons of each category:
- Risk Appetite: An investor has to evaluate the two types of categories and then make a call on the uncertainty that an investment may not earn its expected rate of return, and as well risks such as interest rate risk, currency risk, re-investment risk, and credit risk,
- Return: These are the earnings from investments, and they vary depending on the type of investment e.g. dividends, rent, interest and capital appreciation. Investors should ask themselves whether the return profile meets the risk-reward proposition,
- Liquidity: This is a definition of how quickly an asset can be converted into cash. Investors will usually find that unregulated products have a higher chance of being illiquid compared to regulated products,
- Taxation: It is critical for investors to understand their tax status for tax planning purposes. Regulated products such as bank deposits and Unit Trust Funds in Kenya attract a 15% withholding tax, which is final, whereas unregulated Structured Products attract a total 30% tax rate on any returns made,
- Governance: Governance around regulated products usually involves a Regulator, Trustee, and Custodian, who provide oversight over funds being invested. In unregulated products, governance is usually done by select investors who are investors in the funds themselves, alongside the Investment Manager and their Investment Committee, and,
- Sophistication: Regulation exists to provide oversight for less sophisticated investors. These include retail investors who may not fully understand the characteristics of products they are investing in. Unregulated products are for sophisticated investors who understand the characteristics of their investments and have taken time to understand the underlying asset class / economic activity that is delivering the return.
Section IV: Myths About Each Category
Given our interaction with investors, we felt it best to bring out and debunk many myths that we have heard surrounding both categories of investments especially given that we are still an emerging market were private products are less prevalent:
Myths about Regulated Products:
- Always Safer: The myth has always been that regulated products are safe and investors will not lose money in regulated products. However, experience in Kenya has shown that investors in regulated products such as banking and capital markets have lost funds due to isolated cases of lapses in corporate governance. As such, investing in a regulated institution is no guarantee over the safety of your investment. The Kenya Deposit Insurance Fund, for example, only guarantees Kshs 100,000 worth of deposit for each account in a banking institution. Some of the regulated products that have recently run into trouble leading to billions of losses include:
(All values in Kshs unless stated)
|
Shareholders’ Loss for Regulated Entities Largely Due to Poor Corporate Governance |
||||
|
Firm |
Peak Share Price |
Current Share Price |
No. of Shares (bns) |
Loss in Value (Kshs bns) |
|
Kenya Airways** |
58 |
2.2 |
1.5 |
83.5 |
|
Imperial Bank |
|
|
|
36 |
|
Mumias |
20.7 |
0.3 |
1.5 |
31.2 |
|
Transcentury |
57 |
2.3 |
0.4 |
20.5 |
|
Chase Bank |
|
|
|
4.8 |
|
Uchumi* |
10.9 |
0.3 |
0.4 |
3.9 |
|
CMC |
|
|
|
1.2 |
|
Total |
|
|
|
181.2 |
|
*Last trading price before suspension |
||||
|
**Peak share price since the 2012 rights issue Source: Cytonn Investments |
||||
- Very Liquid: While regulated funds are likely to be a lot more liquid than unregulated, there are times when a regulated business or fund undergoes a strain, there shall be periods where funds are not accessible. This could be in the case of a Unit Trust Fund being closed for withdrawals, or a bank under receivership; a good example is what Amana Money Market Fund has recently experienced
- Don’t Invest in Alternatives: Regulated funds and products usually all have an allocation to alternative investments. The simplest example is that any deposit in a bank is then pushed forward by a bank and lent to an individual for a mortgage, or a developer to undertake a development project. Unit Trust Funds in Kenya as well, as per the regulations, are allowed to invest in alternative investments such as real estate and private equity,
- That the Regulator Fully Understands the Investments: Whether regulated or unregulated, investments always entail risks that even the best analysts, let alone a regulator, may not uncover. Investors should not think that just because it was signed off by a regulator, that they totally understood the investment; investors should still do their own due diligence.
Myths about Unregulated Products:
- Risky Investments: Unregulated products are not that risky, especially when they are sourced by a competent research and investment team, and one that has experience in managing illiquid and alternative assets. Take real estate for example, where the project has been sourced through detailed research and is delivered by a well-run and professional project manager, and there is visibility over pre-sales. Such an investment would be an attractive investment for those seeking diversification in their portfolios,
- They Are Too Complex: Unregulated investments are really no more complex than regulated products, in spite of the jargon that usually accompanies them. Accessing private or unregulated markets is down to experience and skill of the management and investment team, and their ability to package the unregulated asset class into investible security,
- They Cannot be Offered by Regulated Entities: Regulated entities can offer both regulated and unregulated products. For any regulated product, it is approved by the respective regulator, and as well any unregulated product needs to pass through the respective regulator.
- Have to Only be Distributed to a Few Individuals: There is a myth that for an unregulated private product, it must only be distributed to a few individuals. There is ample case law to demonstrate that what matters is the manner of offering, NOT the number of investors. Courts have concluded that an offer even to one person is deemed a public offer if it was offered in a public manner, and an offer even to a million people is a private offer if it was offered in a private manner. Case law in developed markets shows us that unregulated products can be widely distributed:
- United States: The leading case in the United States with regard to ‘transactions by an issuer not involving any public offering’ is Securities Exchange Commission vs Ralston Purina Company 346 US 119 Supreme Court, where an offering was made to at least 7,000 members of staff. The eligibility criteria were simply an employee eligible for a promotion, an individual sympathetic to management, the courts concluded that it was not a public offer even though the regulator wanted it deemed a public offer.
- United Kingdom: In Nash vs Lynde, a case where a question was raised over the distribution of shares, the questions framed by the Court were, amongst others, whether a private company could be held to have offered and issued its shares to the public as 20-30 prospectus was issued. The Court in this matter held as follows ‘The public is a general word and no particular numbers are described. Anything from two to infinity may serve perhaps even one ….’. The Offer, in this case, was therefore not deemed a Public Offer, as those the offer was being made to were specific and shared a common goal. A key takeout is that numbers are not a determining factor as to whether an offer is made to the Public or a Section of the Public.
- Australia: The leading case for Australia is Corporate Affairs Commission (SA) VS Australian Central Credit Union (1985), where it was held that an Offer to 23,000 persons would not amount to a Public Offer. This was on the basis that the law expressly allowed for this exemption on the basis of persons with a common interest.
Based on the above, it is clear that our own securities regulations need to undergo judicial interpretation as to what is a private offer and a public offer.
Section V: Conclusion
For investors, they need to first understand their investment objective, risk appetite, then understand the investment products available to them before they make an investment decision towards or away from unregulated products. We highly recommend that you speak to a Financial Advisor before you invest in any of the two categories of investments.
For market participants and the regulatory framework, we need to evolve from the mentality that all financial products must be regulated, and clearly demarcate what is a private offer and what is a public offer, and allow the two to co-exist for the benefit of advancing our capital markets.
Disclaimer: The views expressed in this publication are those of the writers where particulars are not warranted. This publication is meant for general information only and is not a warranty, representation, advice or solicitation of any nature. Readers are advised in all circumstances to seek the advice of a registered investment advisor.

- Talk to us
- Kenya
- P.O Box 20695 - 00200, Nairobi, Kenya
- Cell +254709101200
- Tel +254709101200
- WhatsApp +254741676635
- United States
- +254709101200
- DOWNLOAD OUR APP
-


- Kenya
- 8th Floor, Pinetree Plaza, Kaburu Drive, Ngong Road, Nairobi, Kenya
- USA
- Suite 1150, 1775 Eye Street NW, USA, Washington DC 20006, USA
- Investments
- High Yield
- Private Equity
- Real Estate
- Real Estate
- RiverRun Estates
- Cytonn Towers
- The Ridge
- Taraji Heights
- The Alma