Regulatory Changes in the Kenyan Pensions Industry, & Cytonn Weekly #47/2021
By Cytonn Research, Nov 28, 2021
Executive Summary
Kenya’s 2022 Election Campaign Promises Tracker
Fixed Income
During the week, T-bills recorded an undersubscription, with the overall subscription rate coming in at 64.5%, down from the 108.6% recorded the previous week, partly attributable to tightened liquidity in the money market. The 91-day paper recorded the highest subscription rate, receiving bids worth Kshs 3.9 bn against the offered Kshs 4.0 bn, translating to a subscription rate of 98.4%, a decline from the 209.9% recorded the previous week. The subscription rate for the 364-day and 182-day papers declined to 90.3% and 25.2%, from 92.0% and 84.8%, respectively, recorded the previous week. The yields on the 91-day, 182-day and 364-day papers increased by 6.7 bps, 8.8 bps and 10.4 bps, to 7.2%, 7.8% and 8.9%, respectively. The government continued to reject expensive bids accepting Kshs 13.0 bn of the Kshs 15.5 bn worth of bids received, translating to an acceptance rate of 83.9%. In the Primary Bond Market, the government reopened two bonds, FXD4/2019/10 and FXD1/2018/20, with effective tenors of 8.0 years, and 16.4 years, respectively, in a bid to raise Kshs 40.0 bn for budgetary support and the period of sale for the issue runs from 22nd November 2021 to 7th December 2021.
The Monetary Policy Committee (MPC) is set to meet on Monday, 29th November 2021 to review the outcome of its previous policy decisions and to decide on the direction of the Central Bank Rate (CBR) and any other policy measure like the Cash Reserve Ratio (CRR). We expect the MPC to maintain the Central Bank Rate (CBR) at 7.00%.
We are projecting the y/y inflation rate for November 2021 to fall within the range of 6.0% - 6.4%, compared to 6.5% recorded in October 2021 mainly driven by the recent stabilization of fuel prices which are a major contributor to Kenya’s headline inflation;
Equities
During the week, the equities market was on a downward trajectory, with NASI, NSE 20 and NSE 25 all declining by 2.2%, 0.4% and 1.7%, respectively, taking their YTD performances to gains of 8.4%, 0.7% and 7.6% for NASI, NSE 20 and NSE 25 respectively. The equities market performance was driven by losses recorded by large cap stocks such as KCB, Safaricom and EABL of 4.5%, 3.2% and 1.9%, respectively. The decline was however mitigated by gains recorded by ABSA and BAT, which gained by 4.3% and 1.8% respectively;
During the week, the National Bank of Kenya (NBK) was de-listed from the Nairobi Securities Exchange (NSE) following the successful takeover of 100.0% of all the ordinary shares of National Bank of Kenya (NBK) through a share swap of 1 ordinary share of KCB for every 10 NBK shares, after the Capital Markets Authority approved the acquisition in September 2019. Additionally, during the week, ABSA Kenya, NCBA, Diamond Trust Bank (DTB-K), Stanbic Bank and HF Group released their Q3’2021 financial results, recording increases in their core earnings per share of 328.3%, 159.0%, 20.1%, 43.2% and 22.0%, respectively;
Real Estate
During the week, Kenya Mortgage Refinance Company (KMRC), a treasury backed mortgage lender, announced that it is holding talks with the Kenya Bankers Association (KBA) and other relevant stake holders in the financial sector, to develop a secondary mortgage market in the country. In the retail sector, Papa John’s International Inc. announced a partnership deal with Kitchen Express to open 60 new fast food outlets in Kenya and Uganda from 2022. In the Mixed-Use Developments, Tatu City, a Mixed-Use developer, announced a partnership deal with Stecol Corporation, a Chinese construction and engineering firm, to develop supporting infrastructure in the final phase of Kijani Ridge located in Ruiru, Kiambu County. In the infrastructure sector, Kenya National Highways Authority (KeNHA) announced that they had contracted Victoria Engineering Company to tarmac the 35.8 Km Kopasi River-Lomut-Sigor- Marich link road, in West Pokot County, at a cost of Kshs 4.4 bn. In the listed REIT, Fahari I-REIT declined by 2.3% to close at Kshs 6.7 per share, compared to Kshs 6.8 per share recorded the previous week;
Focus of the Week
In August 2021, the National Treasury published two legal notices affecting the Individual Retirement Benefits Scheme and Umbrella Retirement Benefits Scheme. The legal notices have amended the access rule to allow members, before retirement age, to access a maximum of 50.0% of the total accrued pension benefits, down from the previous regulation where members could access 100.0% of their own contributions plus 50.0% of the employer's portion. The additional clause stipulates that a trust corporation shall not appoint an administrator, fund manager, custodian or approved issuer who is related to the trust corporation by way of ownership, directorship or employment;
Investment Updates:
- Weekly Rates:
- Cytonn Money Market Fund closed the week at a yield of 10.57%. To invest, just dial *809#;
- Cytonn High Yield Fund closed the week at a yield of 14.02% p.a. To invest, email us at sales@cytonn.com and to withdraw the interest you just dial *809#;
- We continue to offer Wealth Management Training Monday through Saturday, from 9:00 am to 11:00 am, through our Cytonn Foundation. The training aims to grow financial literacy among the general public. To register for any of our Wealth Management Trainings, click here;
- If interested in our Private Wealth Management Training for your employees or investment group, please get in touch with us through wmt@cytonn.com;
- Any CHYS and CPN investors still looking to convert are welcome to consider one of the five projects currently available for conversion, click here for the latest conversion term sheet;
- Cytonn Insurance Agency acts as an intermediary for those looking to secure their assets and loved ones’ future through insurance namely; Motor, Medical, Life, Property, WIBA, Credit and Fire and Burglary insurance covers. For assistance, get in touch with us through insuranceagency@cytonn.com;
- Cytonnaire Savings and Credit Co-operative Society Limited (SACCO) provides a savings and investments avenue to help you in your financial planning journey. To enjoy competitive investment returns, kindly get in touch with us through clientservices@cytonn.com;
Real Estate Updates:
- For an exclusive tour of Cytonn’s real estate developments, visit: Sharp Investor's Tour, and for more information, email us at sales@cytonn.com;
- Phase 3 of The Alma is now ready for occupation. To rent please email properties@cytonn.com;
- We have 8 investment-ready projects, offering attractive development and buyer targeted returns; See further details here: Summary of Investment-ready Projects;
- For recent news about the group, see our news section here;
Hospitality Updates:
- We currently have promotions for Staycations. Visit cysuites.com/offers for details or email us at sales@cysuites.com;
- Share a meal with a friend during the Sunday Brunch at The Hive Restaurant at Cysuites Hotel and Apartment. Every Sunday from 11.00 AM to 4.00 PM at a price of Kshs 2,500 for Adults and Kshs 1,500 for children under 12 years;
Election Watch:
Kenya’s next Presidential Elections are set to be held in August 2022 and with less than a year left, we have seen the political temperatures in the country continue to rise. As such, we shall be analyzing the economic campaign promises made by the politicians and the impact these promises will have on the economy. To read more on the same, click here;
Money Markets, T-Bills Primary Auction:
During the week, T-bills recorded an undersubscription, with the overall subscription rate coming in at 64.5%, down from the 108.6% recorded the previous week, partly attributable to tightened liquidity in the money market. The 91-day paper recorded the highest subscription rate, receiving bids worth Kshs 3.9 bn against the offered Kshs 4.0 bn, translating to a subscription rate of 98.4%, a decline from the 209.9% recorded the previous week. The subscription rate for the 364-day and 182-day papers declined to 90.3% and 25.2%, from 92.0% and 84.8%, respectively, recorded the previous week. The yields on the 91-day, 182-day and 364-day papers increased by 6.7 bps, 8.8 bps and 10.4 bps, to 7.2%, 7.8% and 8.9%, respectively. The government continued to reject expensive bids accepting Kshs 13.0 bn of the Kshs 15.5 bn worth of bids received, translating to an acceptance rate of 83.9%.
In the Primary Bond Market, the government reopened two bonds, FXD4/2019/10 and FXD1/2018/20, with effective tenors of 8.0 years, and 16.4 years, respectively, in a bid to raise Kshs 40.0 bn for budgetary support. The period of sale for the issue runs from 22nd November to 7th December 2021. The coupon rates are 12.3% and 13.2% for FXD4/2019/10 and FXD1/2018/20, respectively. We expect investors to prefer the longer dated paper, FXD1/2018/20, as they search for higher yields. The bonds are currently trading in the secondary market at yields of 12.3% and 13.0%, for FXD4/2019/10 and FXD1/2018/20, respectively, and as such, our recommended bidding range for the two bonds is: 12.1%-12.5% for FXD4/2019/10 and 12.8%-13.2% for FXD1/2018/20 within which bonds of a similar tenor are trading at.
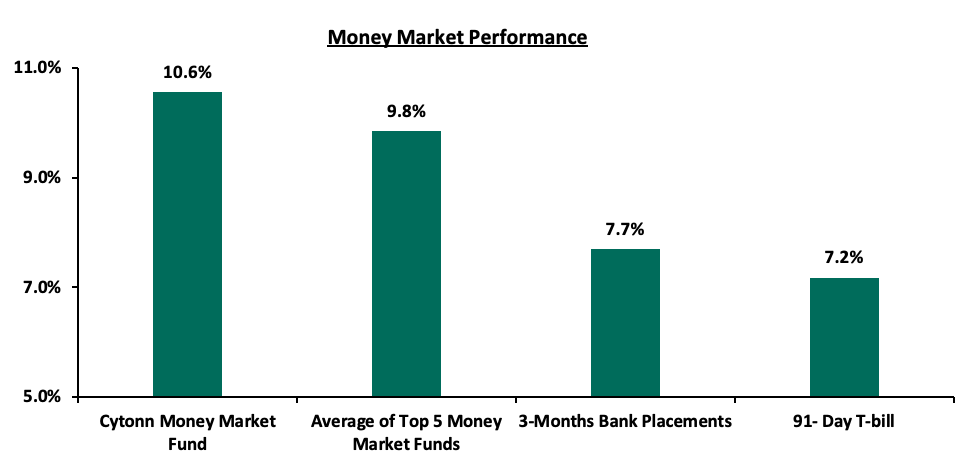
In the money markets, 3-month bank placements ended the week at 7.7% (based on what we have been offered by various banks), while the yield on the 91-day T-bill increased by 6.7 bps to 7.2%. The average yield of the Top 5 Money Market Funds increased by 0.1% points to 9.8%, from 9.7% recorded last week, while the yield on the Cytonn Money Market Fund remained relatively unchanged at 10.6%.
The table below shows the Money Market Fund Yields for Kenyan Fund Managers as published on 26th November:
|
|
Money Market Fund Yield for Fund Managers as published on 26th November 2021 |
|
|
Rank |
Fund Manager |
Effective Annual Rate |
|
1 |
Cytonn Money Market Fund |
10.57% |
|
2 |
Zimele Money Market Fund |
9.91% |
|
3 |
Nabo Africa Money Market Fund |
9.70% |
|
4 |
Madison Money Market Fund |
9.54% |
|
5 |
Sanlam Money Market Fund |
9.52% |
|
6 |
CIC Money Market Fund |
9.19% |
|
7 |
Apollo Money Market Fund |
8.95% |
|
8 |
GenCapHela Imara Money Market Fund |
8.95% |
|
9 |
Co-op Money Market Fund |
8.74% |
|
10 |
Dry Associates Money Market Fund |
8.65% |
|
11 |
British-American Money Market Fund |
8.55% |
|
12 |
Orient Kasha Money Market Fund |
8.39% |
|
13 |
ICEA Lion Money Market Fund |
8.37% |
|
14 |
NCBA Money Market Fund |
8.36% |
|
15 |
Old Mutual Money Market Fund |
7.33% |
|
16 |
AA Kenya Shillings Fund |
6.81% |
Source: Business Daily
Liquidity:
During the week, liquidity in the money market tightened, with the average interbank rate increasing by 4.2 bps to 5.24% from 5.20% recorded the previous week, partly attributable to tax remittances which partly offset government payments. The average interbank volumes traded declined by 11.5% to Kshs 9.7 bn, from Kshs 11.0 bn recorded the previous week.
Kenya Eurobonds:
During the week, yields on all Eurobonds increased, with yields on the 10-year issue issued in 2014, 10-year bond issued in 2018, and 12-year bond issued in 2021 all increasing by 0.3% points to 4.1%, 5.9% and 6.7%, respectively, while yields on the 30-year bond issued in 2018, 7-year bond issued in 2019 and 12-year bond issued in 2019 all increased by 0.2% to 8.1%, 5.6% and 6.8%, respectively. Below is a summary of the performance:
|
Kenya Eurobond Performance |
||||||
|
|
2014 |
2018 |
2019 |
2021 |
||
|
Date |
10-year issue |
10-year issue |
30-year issue |
7-year issue |
12-year issue |
12-year issue |
|
31-Dec-20 |
3.9% |
5.2% |
7.0% |
4.9% |
5.9% |
- |
|
29-Oct-21 |
3.7% |
5.7% |
7.9% |
5.5% |
6.7% |
6.5% |
|
19-Nov-21 |
3.8% |
5.6% |
7.9% |
5.5% |
6.6% |
6.4% |
|
22-Nov-21 |
4.0% |
5.7% |
7.9% |
5.6% |
6.7% |
6.5% |
|
23-Nov-21 |
4.1% |
5.9% |
8.1% |
5.7% |
6.8% |
6.7% |
|
24-Nov-21 |
4.1% |
6.0% |
8.1% |
5.8% |
6.9% |
6.7% |
|
25-Nov-21 |
4.1% |
5.9% |
8.1% |
5.6% |
6.8% |
6.7% |
|
Weekly Change |
0.3% |
0.3% |
0.2% |
0.2% |
0.2% |
0.3% |
|
MTD Change |
0.3% |
0.0% |
0.1% |
0.1% |
0.0% |
0.0% |
|
YTD Change |
0.2% |
0.7% |
1.1% |
0.7% |
0.9% |
- |
Kenya Shilling:
During the week, the Kenyan shilling depreciated marginally by 0.2% against the US dollar to close the week at Kshs 112.4, from Kshs 112.2 recorded the previous week, mainly attributable to increased dollar demand from commodity and energy sector importers outweighing the supply of dollars from exporters. Key to note, these is the lowest the Kenyan shilling has ever depreciated against the dollar. On a YTD basis, the shilling has depreciated by 2.9% against the dollar, in comparison to the 7.7% depreciation recorded in 2020. We expect the shilling to remain under pressure for the remainder of 2021 as a result of:
- Rising uncertainties in the global market due to the Coronavirus pandemic, which has seen investors continue to prefer holding their investments in dollars and other hard currencies and commodities,
- Increased demand from merchandise traders as they beef up their hard currency positions in anticipation for more trading partners reopening their economies globally, and,
- Rising global crude oil prices on the back of supply constraints at a time when demand is picking up with the easing of COVID-19 restrictions and as economies reopen.
The shilling is however expected to be supported by:
- The Forex reserves, currently at USD 8.8 bn (equivalent to 5.4-months of import cover), which is above the statutory requirement of maintaining at least 4.0-months of import cover, and the EAC region’s convergence criteria of 4.5-months of import cover. In addition, the reserves were boosted by the USD 1.0 bn proceeds from the Eurobond issued in July, 2021 coupled with the USD 407.0 mn IMF disbursement and the USD 130.0 mn World Bank loan financing received in June, 2021, and,
- Improving diaspora remittances evidenced by a 28.2% y/y increase to USD 337.4 mn in October 2021, from USD 263.1 mn recorded over the same period in 2020, which has continued to cushion the shilling against further depreciation.
Weekly Highlights:
- November MPC Meeting
The Monetary Policy Committee (MPC) is set to meet on Monday, 29th November 2021 to review the outcome and effectiveness of its previous policy decisions and recent economic developments, and to decide on the direction of the Central Bank Rate (CBR) and any other policy measure like the Cash Reserve Ratio (CRR). In their previous meeting held on 28th September 2021, the committee maintained the CBR at 7.00%, in line with our expectations, citing that the accommodative policy stance adopted in March 2020 and all other sittings ever since, remained appropriate and were having the desired effects on the economy. We expect the MPC to maintain the Central Bank Rate (CBR) at 7.00% with their decision mainly being supported by;
- We foresee the MPC taking a wait and see approach as it monitors the recovery of the economy. Kenya’s economy recorded a 10.1% growth in Q2’2021, up from the 0.7% growth in Q1’2021 and the 4.7% contraction recorded in Q2’2020. We believe that despite this recovery, the slow vaccine inoculation and the emergence of the new variants will continue to weigh down the recovery of the economy. As such, we believe that the MPC will keep monitoring the macro-economic indicators before pursuing any additional policy measures,
- Inflation is expected to remain stable and within the government’s target range of 2.5% -7.5% on account of the stable fuel prices. October inflation declined to 6.5%, from 6.9% recorded in September, supported by the decline in fuel prices following the re-instatement of the Fuel Subsidy program. However, we believe that the stabilization under the fuel subsidy program by the National Treasury is unsustainable should the average landed costs of fuel keep rising. We anticipate inflation pressures to remain elevated in the short term driven by the rising global fuel prices due to supply bottlenecks, and,
- The need to support the shilling from further depreciations having depreciated by 1.6% to Kshs 112.2 as of 19th November 2021, from Kshs 110.4 recorded in September 2021. We believe that the forex reserve of USD 8.9 bn (equivalent to 5.4 months of import cover) as of 19th November 2021 will continue to support the shilling from foreign exchange shocks in the short term. As such, this will reduce pressure on the Central Bank to pursue any additional policy measures.
For a more detailed analysis, please see our MPC note here.
- November Inflation projections
We are projecting the y/y inflation rate for November 2021 to fall within the range of 6.0% - 6.4%. The key drivers include:
- Fuel prices for the period 15th November 2021 to 14th December 2021 remained unchanged at Kshs 129.7 per litre for Super Petrol, Kshs 110.6 per litre for Diesel and Kshs 103.5 per litre for Kerosene. With fuel being a major contributor to Kenya's headline inflation, maintaining constant fuel prices is expected to have a muted impact on the inflation basket,
- Food prices have remained relatively stable during the month attributable to improvement in agricultural output due to the ongoing rains in some parts of the country, and,
- Downward readjustment of the foreign exchange fluctuation tariff for electricity usage, which significantly declined by 40.3% to Kshs 73.0 cents per Kilowatt hour (KWh) in November, from Kshs 1.0 per Kilowatt hour (KWh) in October 2021. However, the fuel cost charge on electricity bills increased by 6.0% to Kshs 4.2 per Kilowatt hour (KWh) in November, from Kshs 4.0 per Kilowatt hour (KWh) in October. The readjustments will decrease the cost of electricity consumption for households.
Going forward, we expect the inflation rate to remain within the government’s set range of 2.5% - 7.5%. However, concerns remain high on the widening trade deficit as global fuel prices continue to rise due to supply bottlenecks. We expect the CBK and the Government to employ conducive monetary and fiscal policies in-order to comply with the conditions set by the IMF in the Extended Credit facility agreement in February 2021. In the agreement, IMF indicated that Kenya’s inflation should remain well anchored and between the government target range so that Kenya can continue accessing the loan facility already approved. Given that the IMF announced it had reached a Staff Level Agreement on the Second Reviews of the Extended Fund Facility, the government has to ensure that inflation does not surge above the current levels in order to access the USD 264.0 mn loan facility.
Rates in the fixed income market have remained relatively stable due to the sufficient levels of liquidity in the money markets. The government is 21.8% ahead of its prorated borrowing target of Kshs 278.6 bn having borrowed Kshs 339.4 bn of the Kshs 658.5 bn borrowing target for the FY’2021/2022. We expect a gradual economic recovery going into FY’2021/2022 as evidenced by KRAs collection of Kshs 598.5 bn in revenues during the first four months of the current fiscal year, which is equivalent to 101.1% of the prorated revenue collection target. However, despite the projected high budget deficit of 7.5% and the lower credit rating from S&P Global to 'B' from 'B+', we believe that the support from the IMF and World Bank will mean that the interest rate environment will remain stable since the government is not desperate for cash.
Markets Performance
During the week, the equities market was on a downward trajectory, with NASI, NSE 20 and NSE 25 all declining by 2.2%, 0.4% and 1.7%, respectively, taking their YTD performances to gains of 8.4%, 0.7% and 7.6% for NASI, NSE 20 and NSE 25 respectively. The equities market performance was driven by losses recorded by large cap stocks such as KCB, Safaricom and EABL of 4.5%, 3.2% and 1.9%, respectively. The decline was however mitigated by gains recorded by ABSA and BAT, which gained by 4.3% and 1.8%, respectively.
During the week, equities turnover increased by 138.1% to USD 53.1 mn, from USD 22.3 mn recorded the previous week, taking the YTD turnover to USD 1.1 bn. The sharp increase in turnover could be attributed to investors selling off their Safaricom shares due to uncertainty from the ongoing conflict in their Ethiopian market. Safaricom was the most actively traded stock during the week, accounting for 71.1% of the total turnover in the market. Foreign investors remained net sellers, with a net selling position of USD 23.4 mn, from a net selling position of USD 2.9 mn recorded the previous week, taking the YTD net selling position to USD 62.3 mn.
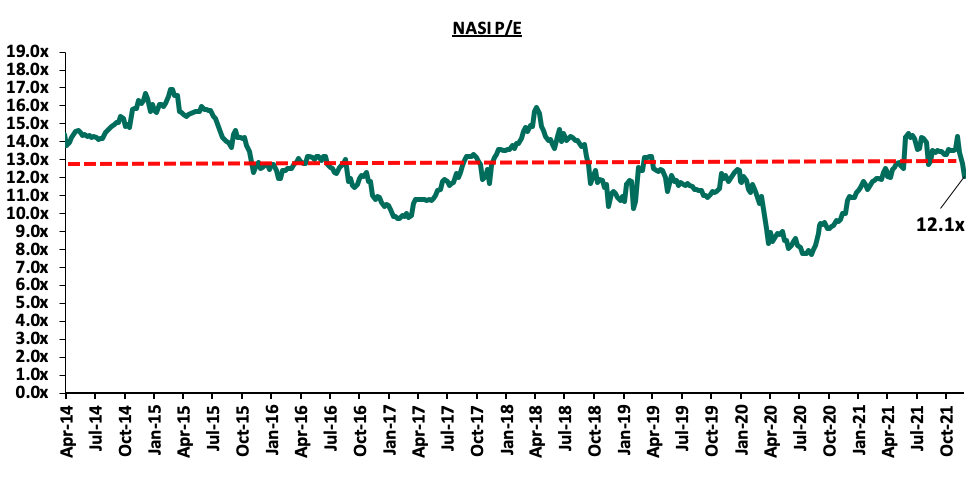
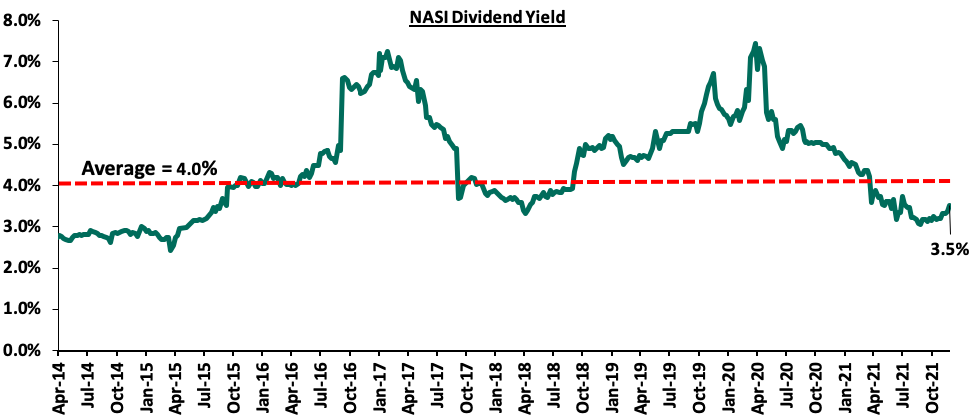
The market is currently trading at a price to earnings ratio (P/E) of 12.1x, 6.8% below the historical average of 12.9x, and a dividend yield of 3.5%, 0.5% points below the historical average of 4.0%. Notably, this week’s P/E is the lowest it has been since April 2021. Key to note, NASI’s PEG ratio currently stands at 1.4x, an indication that the market is trading at a premium to its future earnings growth. Basically, a PEG ratio greater than 1.0x indicates the market may be overvalued while a PEG ratio less than 1.0x indicates that the market is undervalued. Excluding Safaricom which is currently 60.1% of the market, the market is trading at a P/E ratio of 11.6x and a PEG ratio of 1.3x. The current P/E valuation of 12.1x is 56.6% above the most recent trough valuation of 7.7x experienced in the first week of August 2020. The charts below indicate the historical P/E and dividend yields of the market.
Weekly Highlight:
- De-listing of National Bank of Kenya from Nairobi Securities Exchange
During the week, the National Bank of Kenya (NBK) was de-listed from the Nairobi Securities Exchange (NSE) effective 25th November 2021 following the successful takeover of 100.0% of all the ordinary shares of National Bank of Kenya (NBK) through a share swap of 1 ordinary share of KCB for every 10 NBK shares, after the Capital Markets Authority (CMA) approved the acquisition in September 2019. The de-listing was approved by both the CMA and the shareholders of NBK. NBK becomes the 13th firm since 2003 to be de-listed in the NSE with Kenol/Kobil being the most recent exit in August 2019. The table below shows the delisted companies and the year they were delisted:
|
No. |
Company Name |
Year of De-listing |
|
1. |
East African Packaging Industries |
2001 |
|
2. |
Africa Online Holding Ltd |
2003 |
|
3. |
Unilever Tea Kenya |
2008 |
|
4. |
Access Kenya |
2013 |
|
5. |
City Trust Ltd |
2013 |
|
6. |
Rea Vipingo Plantations Limited |
2015 |
|
7. |
CMC Holdings |
2015 |
|
8. |
Atlas Development and Support Services |
2017 |
|
9. |
Marshall East Africa Limited |
2017 |
|
10. |
Hutchings Biemer |
2018 |
|
11. |
A. Baumann & Co. Limited |
2018 |
|
12. |
Kenol/Kobil |
2019 |
|
13. |
National Bank of Kenya |
2021 |
Source: CMA Quarterly Statistical Bulletin
The chart below shows the number of listed companies in the Nairobi Securities Exchange (NSE) for the period 2010 - 2021:
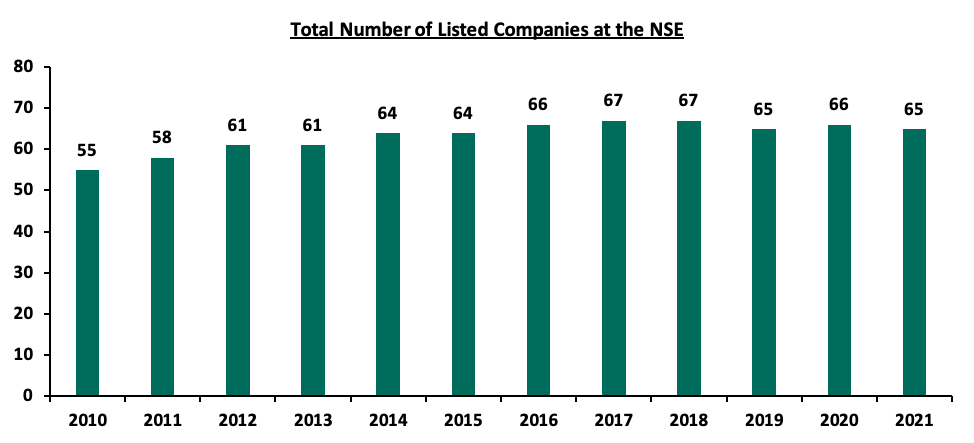
Source: CMA Quarterly Statistical Bulletin
Since the acquisition, the bank’s performance has significantly improved, with profits after tax and exceptional items increasing by 1,125.6% to Kshs 1,077.0 mn in Q3’2021, from Kshs 87.9 mn recorded in Q3’2020. Asset quality of the bank also greatly improved with the NPL ratio declining by 7.8% points to 34.1% in Q3’2021, from 41.9% recorded in Q3’2020, following the bank’s improved management of the loan book. Key to note, the banks NPL ratio is significantly higher than the banking sector’s ratio of 13.9% in August 2021. However, despite the improvement in profitability and asset quality, it has taken longer than anticipated to stabilize the bank. Contrary to our expectations, the Kshs 5.0 bn capital injection made by KCB into NBK in January 2020 did not improve the bank’s liquidity and a further Kshs 3.0 bn had to be injected in March 2021 to support the bank. As at Q3’2021, the liquidity ratio of NBK stood at 49.6%, 29.6% points above the minimum statutory requirement. For more details on the acquisition of NBK by KCB Group, see our Cytonn Weekly #36/2019.
- Earnings Releases
During the week, ABSA Bank, NCBA Group, Diamond Trust Bank Kenya, Stanbic Bank and HF Group released their Q3’2021 financial results. Below is a summary of their performance;
- ABSA Bank
ABSA Bank Q3’2021 Key Highlights
Balance Sheet
Balance Sheet Items
Q3’2020 (Kshs bn)
Q3’2021 (Kshs bn)
y/y change
Net Loans and Advances
209.2
229.1
9.5%
Government Securities
134.0
126.6
(5.6%)
Total Assets
387.9
411.4
6.1%
Customer Deposits
246.6
268.8
9.0%
Deposits per Branch
2.9
3.2
(7.7%)
Total Liabilities
343.2
356.8
3.9%
Shareholders’ Funds
44.6
54.6
22.4%
Income Statement
Income Statement Items
Q3’2020 (Kshs bn)
Q3’2021 (Kshs bn)
y/y change
Net Interest Income
17.1
18.6
8.6%
Net non-Interest Income
8.3
8.7
5.2%
Total Operating income
25.4
27.3
7.5%
Loan Loss provision
(7.6)
(3.4)
(55.2%)
Total Operating expenses
(20.1)
(15.4)
(23.0%)
Profit before tax
5.3
11.9
122.4%
Profit after tax
1.9
8.2
328.3%
Core EPS
0.4
1.5
328.3%
Key Ratios
Income Statement Ratios
Q3’2020
Q3’2021
% point change
Yield from Interest-Earning Assets
9.5%
8.9%
(0.6%)
Cost of funding
3.2%
2.6%
(0.6%)
Net Interest Margin
7.1%
7.0%
(0.1%)
Non-Performing Loans (NPL) Ratio
7.6%
8.1%
0.5%
NPL Coverage
64.9%
74.5%
9.6%
Cost to Income With LLP
79.0%
56.6%
(22.4%)
Loan to Deposit Ratio
84.9%
85.2%
0.3%
Cost to Income Without LLP
49.1%
44.1%
(5.0%)
Return on average equity
8.6%
21.1%
12.5%
Return on average assets
1.0%
2.6%
1.6%
Equity to Assets
11.5%
13.3%
1.8%
Capital Adequacy Ratios
Ratios
Q3’2020
Q3’2021
% point change
Core Capital/Total Liabilities
16.6%
17.9%
1.3%
Minimum Statutory ratio
8.0%
8.0%
0.0%
Excess
8.6%
9.9%
1.3%
Core Capital/Total Risk Weighted Assets
13.7%
14.7%
1.0%
Minimum Statutory ratio
10.5%
10.5%
0.0%
Excess
3.2%
4.2%
1.0%
Total Capital/Total Risk Weighted Assets
16.5%
17.3%
0.8%
Minimum Statutory ratio
14.5%
14.5%
0.0%
Excess
2.0%
2.8%
0.8%
Key take-outs from the earnings release include;
- Core earnings per share rose by 328.3% to Kshs 1.5, from Kshs 0.4 in Q3’2020, faster than our projections of a 265.3% increase to Kshs 1.3. The performance was driven by a 7.5% growth in total operating income to Kshs 27.3 bn, from Kshs 25.4 bn in Q3’2020, and a 23.0% decline in total operating expenses to Kshs 15.4 bn, from Kshs 20.1 bn in Q3’2020,
- Interest income grew by 1.3% to Kshs 23.5 bn, from Kshs 23.2 bn in Q3’2020, mainly driven by a 3.9% increase in interest income from loans and advances to Kshs 17.0 bn, from Kshs 16.4 bn in Q3’2020, coupled with a 139.5% increase in interest income from deposits and placements with banking institutions to Kshs 0.4 bn from Kshs 0.2 bn in Q3’2020,
- The Yield on Interest-Earning Assets (YIEA) declined to 8.9%, from 9.5% recorded in Q3’2020, attributable to the faster 7.3% growth in Average Interest Earning Assets, which outpaced the 1.3% growth in trailing interest income,
- Interest expenses declined by 19.1% to Kshs 4.9 bn, from Kshs 6.1 bn in Q3’2020, following a 70.6% decline in Interest expense on deposits and placements to Kshs 0.3 bn, from Kshs 1.2 bn in Q3’2020, coupled with a 6.4% decline in interest expense on customer deposits to Kshs 4.5 bn, from Kshs 4.8 bn in Q3’2020. Cost of funds declined by 0.6% points to 2.6%, from 3.2% recorded in Q3’2020, following a 12.7% decline in the trailing interest expense coupled with a 7.0% growth in average interest bearing liabilities,
- Net Interest Margin (NIM) declined to 7.0%, from 7.1% in Q3’2020 due to the faster 7.3% growth in average interest-earning assets, which outpaced the 6.0% increase in trailing Net Interest Income,
- Total operating expenses decreased by 23.0% to Kshs 15.4 bn, from Kshs 20.1 bn in Q3’2020, largely driven by an 8.6% decline in Staff Costs to Kshs 6.8 bn, from Kshs 7.5 bn recorded in Q3’2020. Additionally, Loan Loss Provisions (LLP) declined by 55.2% to Kshs 3.4 bn, from Kshs 7.6 bn in Q3’2020. The reduced provision level was due to declining credit risk on the back of the improving operating environment,
- The balance sheet recorded an expansion as total assets grew by 6.1% to Kshs 411.4 bn, from Kshs 387.9 bn in Q3’2020. The growth was supported by a 9.5% loan book expansion to Kshs 229.1 bn, from Kshs 209.2 bn in Q3’2020, coupled with a 6.3% increase in placements from banking institutions to Kshs 6.1 bn, from Kshs 5.8 bn in Q3’2020. Investments in government and other securities declined by a 5.6% declined to Kshs 126.6 bn, from Kshs 134.0 bn recorded in Q3’2020,
- Total liabilities rose by 3.9% to Kshs 356.8 bn, from Kshs 343.2 bn in Q3’2020, driven by a 9.0% increase in customer deposits to Kshs 268.8 bn, from Kshs 246.6 bn in Q3’2020. On the other hand, placements held declined by 38.0% to Kshs 6.9 bn in Q3’2021, from Kshs 11.1 bn in Q3’2020,
- Deposits per branch increased by 7.7% to Kshs 3.2 bn, from Kshs 2.9 bn in Q3’2020 and the number of branches increased to 85, from 84 in Q3’2020,
- Gross non-performing loans increased by 17.1% to Kshs 19.6 bn, from Kshs 16.8 bn in Q3’2020. The bank’s Asset Quality deteriorated, with the NPL ratio rising to 8.1% in Q3’2021, from 7.6% in Q3’2020, attributable to the faster 17.1% growth in Gross Non-Performing Loans (NPLs), which outpaced the 10.7% growth in gross loans,
- Loan Loss Provisions (LLP) decreased 55.2% y/y to Kshs 3.4 bn in Q3’2021, from Kshs 7.6 bn in Q3’2020. The NPL coverage improved to 74.5% in Q3’2021, from 64.9% in Q3’2020, as general Loan Loss Provisions increased by 45.1% to Kshs 12.2 bn, from Kshs 8.4 bn in Q3’2020, and,
- Absa Bank Kenya remains sufficiently capitalized with a core capital to risk-weighted assets ratio of 14.7%, 4.2% points above the statutory requirement. In addition, the total capital to risk-weighted assets ratio came in at 17.3%, exceeding the statutory requirement by 2.8% points. Adjusting for IFRS 9, the core capital to risk-weighted assets stood at 14.8%, while total capital to risk-weighted assets came in at 17.4%.
For a comprehensive analysis, please see our ABSA Bank Q3’2021 Earnings Note
- NCBA Group
|
NCBA Q3’2021 Key Highlights |
|||
|
Balance Sheet |
|||
|
Balance Sheet items |
Q3’2020 (Kshs bn) |
Q3’2021 (Kshs bn) |
y/y change |
|
Government Securities |
151.4 |
189.6 |
25.2% |
|
Net Loans and Advances |
249.7 |
238.2 |
(4.6%) |
|
Total Assets |
519.2 |
562.6 |
8.4% |
|
Customer Deposits |
402.6 |
447.6 |
11.2% |
|
Deposits Per Branch |
5.9 |
4.6 |
(22.9%) |
|
Total Liabilities |
448.5 |
487.7 |
8.7% |
|
Shareholders’ Funds |
70.4 |
74.8 |
6.3% |
|
Income Statement |
|||
|
Income Statement Items |
Q3’2020 (Kshs bn) |
Q3’2021 (Kshs bn) |
y/y change |
|
Net Interest Income |
17.0 |
20.2 |
19.1% |
|
Net non-Interest Income |
16.11 |
16.08 |
(0.2%) |
|
Total Operating income |
33.1 |
36.3 |
9.7% |
|
Loan Loss provision |
13.4 |
9.2 |
(31.3%) |
|
Total Operating expenses |
28.6 |
24.7 |
(13.8%) |
|
Profit before tax |
3.8 |
11.1 |
192.0% |
|
Profit after tax |
2.5 |
6.5 |
159.0% |
|
Core EPS |
1.5 |
4.0 |
159.0% |
|
Key Ratios |
|||
|
Ratios |
Q3’2020 |
Q3’2021 |
% point change |
|
Yield from interest-earning assets |
6.1% |
10.2% |
4.1% |
|
Cost of funding |
3.1% |
4.1% |
1.0% |
|
Net Interest Margin |
3.2% |
6.2% |
3.0% |
|
Non-Performing Loans (NPL) Ratio |
14.1% |
17.0% |
2.9% |
|
NPL Coverage |
58.3% |
70.2% |
11.9% |
|
Cost to Income with LLP |
86.5% |
68.0% |
(18.5%) |
|
Loan to Deposit Ratio |
62.0% |
53.2% |
(8.8%) |
|
Return on Average Assets |
0.5% |
1.6% |
1.1% |
|
Return on Average Equity |
3.9% |
11.8% |
7.9% |
|
Equity to Assets |
13.6% |
13.3% |
(0.3%) |
|
Capital Adequacy Ratios |
|||
|
Ratios |
Q3’2020 |
Q3’2021 |
% point change |
|
Core Capital/Total Liabilities |
16.9% |
16.8% |
(0.1%) |
|
Minimum Statutory ratio |
8.0% |
8.0% |
0.0% |
|
Excess |
8.9% |
8.8% |
(0.1%) |
|
Core Capital/Total Risk Weighted Assets |
18.1% |
19.0% |
0.9% |
|
Minimum Statutory ratio |
10.5% |
10.5% |
0.0% |
|
Excess |
7.6% |
8.5% |
0.9% |
|
Total Capital/Total Risk Weighted Assets |
18.6% |
19.1% |
0.5% |
|
Minimum Statutory ratio |
14.5% |
14.5% |
0.0% |
|
Excess |
4.1% |
4.6% |
0.5% |
Key take-outs from the earnings release include;
- Core earnings per share rose by 159.0% to Kshs 4.0, from Kshs 1.5 recorded in Q3’2020 driven by a 9.7% growth in total operating income to Kshs 36.3 bn, from Kshs 33.1 bn recorded in Q3’2020, coupled with the 13.8% decline in total operating expenses to Kshs 24.7 bn, from Kshs 28.6 bn recorded in Q3’2020,
- Interest income rose by 9.3% to Kshs 34.2 bn, from Kshs 31.2 bn in Q3’2020, driven by a 15.4% growth in interest income from government securities to Kshs 14.7 bn, from Kshs 12.8 bn in Q3’2020, coupled with a 6.5% rise in interest income from loans and advances to Kshs 19.1 bn, from Kshs 17.9 bn in Q3’2020. The growth in interest income was however weighed down by a 42.1% decline in interest income from deposits and placements with banking institutions to Kshs 0.3 bn, from Kshs 0.6 bn in Q3’2020,
- The Yield on Interest-Earning Assets (YIEA) increased by 4.0% points to 10.2% in Q3’2021, from 6.2% in Q3’2020, attributable to the faster 74.1% growth in trailing interest income which outpaced the 5.1% growth in average interest-earning assets. Trailing Interest Income refers to the performance of the interest income for the past 12 consecutive months,
- Interest expense declined by 2.4% to Kshs 14.0 bn, from Kshs 14.4 bn in Q3’2020, mainly attributable to a 49.9% decline in interest expense on placements from banking institutions to Kshs 0.2 bn, from Kshs 0.3 bn in Q3’2020. The decline was weighed down by a 5.8% growth in interest expense on customer deposits to Kshs 13.6 bn, from Kshs 12.9 bn in Q3’2020. Cost of funds increased by 1.0% points to 4.1%, from 3.1% in Q3’2020 owing to the 45.8% increase in trailing interest expense that outpaced the 6.3% growth in average interest bearing liabilities, an indication that the Bank was unable to mobilize cheaper deposits. Trailing interest expense refers to the performance of the interest expense for the past 12 consecutive months,
- Net Interest Margin (NIM) increased by 3.0% points to 6.2%, from 3.2% recorded in Q3’2020, due to the faster 74.1% growth in trailing Net Interest Income, compared to the 5.1% growth seen in the average interest-earning assets,
- Total operating expenses declined by 13.8% to Kshs 24.7 bn, from Kshs 28.6 bn in Q3’2020, largely driven by the 31.3% decrease in loan loss provision to Kshs 9.2 bn, from Kshs 13.4 bn in Q3’2020. The decline in total operating expenses was however weighed down by a 10.8% increase in staff costs to Kshs 5.9 bn, from Kshs 5.3 bn recorded in Q3’2020,
- The balance sheet recorded an expansion with total assets growing by 8.4% to Kshs 562.6 bn, from Kshs 519.2 bn in Q3’2020. This growth was largely driven by a 25.2% increase in Government securities to Kshs 189.6 bn, from Kshs 151.4 bn coupled with a 12.1% increase in bank placements to Kshs 42.1 bn, from Kshs 37.6 bn in Q3’2020. On the other hand, the loan book contracted by 4.6% to Kshs 238.2 bn, from Kshs 249.7 bn in Q3’2020, partly attributable to the bank’s cautious lending to businesses amid the COVID-19 operating environment,
- Total liabilities rose by 8.7% to Kshs 487.7 bn, from Kshs 448.5 bn in Q3’2020, driven by an 11.2% growth in customer deposits to Kshs 447.6 bn, from Kshs 402.6 bn in Q3’2020 coupled with a 7.7% increase in placements liabilities to Kshs 12.6 bn recorded in Q3’2021, from Kshs 11.7 bn in Q3’2020,
- Deposits per branch declined by 1.0% to Kshs 4.5 bn, from Kshs 4.6 bn in Q3’2021, with the number of branches increasing by 9 to 98 branches from 89 branches in Q3’2020. The group intends to open 4 more branches in Kenya in Q4’2021,
- Gross Non-Performing Loans (NPLs) increased by 19.7% to Kshs 46.0 bn in Q3’2021, from Kshs 38.4 bn recorded in Q3’2020. Consequently, the NPL ratio rose to 17.0%, from 14.1% recorded in Q3’2020. The Asset Quality deterioration is attributable to the faster 19.7% growth in Gross Non-Performing Loans (NPLs) which outpaced the 0.6% decrease in gross loans,
- General Loan Loss Provisions increased by 52.3% to Kshs 24.2 bn, from Kshs 15.9 bn in Q3’2020. The NPL coverage thus increased to 70.2%, from 58.3% in Q3’2020. The increase in the NPL Coverage suggests sufficient provisioning by the bank, and,
- NCBA Group is currently sufficiently capitalized with a core capital to risk-weighted assets ratio of 19.0%, 8.5% points above the statutory requirement. In addition, the total capital to risk-weighted assets ratio was 19.1%, exceeding the statutory requirement by 4.6% points. Adjusting for IFRS 9, the core capital to risk-weighted assets stood at 19.8% while total capital to risk-weighted assets came in at 19.9%.
For a comprehensive analysis, please see our NCBA Group Q3’2021 Earnings Note.
- Diamond Trust Bank Kenya (DTB-K)
|
DTB-K Q3’2021 Key Highlights |
|||
|
Balance Sheet |
|||
|
Balance Sheet items |
Q3’2020 (Kshs bn) |
Q3’2021 (Kshs bn) |
y/y change |
|
Government Securities |
134.1 |
130.5 |
(2.7%) |
|
Net Loans and Advances |
205.6 |
205.6 |
(0.0%) |
|
Total Assets |
394.0 |
434.4 |
10.3% |
|
Customer Deposits |
288.2 |
323.7 |
12.3% |
|
Deposits Per Branch |
2.1 |
2.5 |
19.3% |
|
Total Liabilities |
324.9 |
359.9 |
10.8% |
|
Shareholders’ Funds |
62.8 |
67.5 |
7.5% |
|
Income Statement |
|||
|
Income Statement Items |
Q3’2020 (Kshs bn) |
Q3’2021 (Kshs bn) |
y/y change |
|
Net Interest Income |
13.9 |
14.7 |
5.9% |
|
Net non-Interest Income |
5.03 |
4.79 |
(4.9%) |
|
Total Operating income |
18.9 |
19.5 |
3.0% |
|
Loan Loss provision |
2.9 |
3.1 |
6.0% |
|
Total Operating expenses |
12.4 |
12.1 |
(2.0%) |
|
Profit before tax |
6.60 |
7.43 |
12.6% |
|
Profit after tax |
4.3 |
5.2 |
20.1% |
|
Core EPS |
15.5 |
18.6 |
20.1% |
|
Key Ratios |
|||
|
Ratios |
Q3’2020 |
Q3’2021 |
% point change |
|
Yield from interest-earning assets |
9.3% |
9.2% |
(0.1%) |
|
Cost of funding |
4.2% |
4.1% |
(0.1%) |
|
Net Interest Margin |
5.5% |
5.4% |
(0.1%) |
|
Non-Performing Loans (NPL) Ratio |
8.7% |
11.9% |
3.2% |
|
NPL Coverage |
62.5% |
40.0% |
22.5% |
|
Cost to Income with LLP |
65.2% |
62.0% |
(3.2%) |
|
Loan to Deposit Ratio |
71.4% |
63.5% |
(7.9%) |
|
Return on Average Assets |
1.4% |
1.1% |
(0.4%) |
|
Return on Average Equity |
9.2% |
6.8% |
(2.5%) |
|
Equity to Assets |
17.5% |
17.1% |
(0.4%) |
|
Capital Adequacy Ratios |
|||
|
Ratios |
Q3’2020 |
Q3’2021 |
% point change |
|
Core Capital/Total Liabilities |
23.3% |
22.2% |
(1.1%) |
|
Minimum Statutory ratio |
8.0% |
8.0% |
0.0% |
|
Excess |
15.3% |
14.2% |
(1.1%) |
|
Core Capital/Total Risk Weighted Assets |
19.2% |
20.7% |
1.5% |
|
Minimum Statutory ratio |
10.5% |
10.5% |
0.0% |
|
Excess |
8.7% |
10.2% |
1.5% |
|
Total Capital/Total Risk Weighted Assets |
20.8% |
22.1% |
1.3% |
|
Minimum Statutory ratio |
14.5% |
14.5% |
0.0% |
|
Excess |
6.3% |
7.6% |
1.3% |
Key take-outs from the earnings release include;
- Core earnings per share increased by 20.1% to Kshs 18.6, from Kshs 15.5 in Q3’2020, higher than our expectations of a 6.2% increase to Kshs 16.4. The growth was driven by the 5.9% increase in total operating income, coupled with the 2.0% decline in total operating expenses to Kshs 12.1 bn, from Kshs 12.4 bn in Q3’2020,
- Interest income increased by 6.0% to Kshs 25.1 bn, from Kshs 23.7 bn in Q3’2020 driven by a 19.1% increase in interest income from government securities to Kshs 11.0 bn, from Kshs 9.2 bn in Q3’2020 coupled with a 60.3% increase in Interest income from deposit placements to Kshs 188.0 mn, from Kshs 117.3 mn in Q3’2020. The increase was however weighed down by a 2.8% decline in interest income from loans and advances to Kshs 13.9 bn, from Kshs 14.3 bn in Q3’2020,
- The Yield on Interest-Earning Assets (YIEA), declined marginally to 9.3% from 9.2% in Q3’2020, attributable to a 1.5% increase in trailing interest income, which was outpaced by the 2.6% increase in average interest-earning assets to Kshs 351.6 bn, from Kshs 342.6 bn in Q3’2020. Trailing Interest Income refers to the performance of the interest income for the past 12 consecutive months,
- Interest expense rose by 6.2% to Kshs 10.4 bn, from Kshs 9.8 bn in Q3’2020, following a 10.0% increase in interest expense on customer deposits to Kshs 9.2 bn, from Kshs 8.4 bn in Q3’2020. The increase was however mitigated by a 37.3% decline in interest expense on placement liabilities to Kshs 305.7 mn, from Kshs 487.2 mn in Q3’2020. Cost of funds, on the other hand, declined by 0.1% points to 4.1% from 4.2% in Q3’2020, owing to the 3.3% increase in trailing interest expenses, which was outpaced by a 6.6% growth in average interest-bearing liabilities, an indication that the bank was able to mobilize cheaper deposits,
- Net Interest Margin (NIM) declined to 5.4%, from 5.5% in Q3’2020 attributable to the 1.5% increase in trailing interest income which was outpaced by the 2.6% increase in average interest-earning assets,
- Total operating expenses declined by 2.0% to Kshs 12.1 bn, from Kshs 12.4 bn in Q3’2020, driven by the 8.5% decrease in other operating expenses to Kshs 5.4 bn from Kshs 5.9 bn. The decline was weighed down by a 6.0% increase in Loan Loss Provisions (LLP) to Kshs 3.1 bn, from Kshs 2.9 bn in Q3’2020,
- The balance sheet recorded an expansion as Total Assets increased by 10.3% to Kshs 434.4 bn, from Kshs 394.0 bn recorded in Q3’2020. This growth was largely driven by a 34.0% growth in placements to Kshs 15.7 bn, from Kshs 11.7 bn in Q3’2020. Investments in Government securities declined by 2.7% to Kshs 134.1 bn from Kshs 130.5 bn while net loans and advances declined marginally by 0.03% to Kshs 205.55 bn from Kshs 205.60 bn in Q3’2020,
- Total liabilities rose by 10.8% to Kshs 359.9 bn, from Kshs 324.9 bn in Q3’2020, driven by a 12.3% increase in deposits to Kshs 323.7 bn, from Kshs 288.2 bn in Q3’2020, coupled with a 0.3% increase in borrowings to Kshs 20.3 bn from Kshs 20.2 bn in Q3’2020,
- Deposits per branch rose by 19.3% to Kshs 2.5 bn, from Kshs 2.1 bn in Q3’2020 with the number of branches declining to 130 in Q3’2021 from 138 in Q3’2020. The decline in the number of branches is attributable to the bank closing some of its branches in an attempt to consolidate its physical footprint as some of them were in close proximity to each other,
- Gross Non-Performing Loans (NPLs) rose by 36.0% to Kshs 25.7 bn in Q3’2021, from Kshs 18.9 bn recorded in Q3’2020. Consequently, the NPL ratio rose to 11.9%, from 8.7% recorded in Q3’2020, driven by the 36.0% growth in gross NPLs coupled with the 0.8% decline in gross loans,
- General Loan Loss Provisions increased by 44.0% to Kshs 9.4 bn from Kshs 6.5 bn in Q3’2020. On the other hand, the NPL coverage (having added interest in suspense) decreased to 40.0% in Q3’2021, from 62.5% in Q3’2020, and,
- Diamond Trust Bank is currently sufficiently capitalized with a core capital to risk-weighted assets ratio of 20.7%, 10.2% points above the statutory requirement. In addition, the total capital to risk-weighted assets ratio was 22.1%, exceeding the 14.5% statutory requirement by 7.6% points. Adjusting for IFRS 9, the core capital to risk-weighted assets stood at 20.9%, while total capital to risk-weighted assets came in at 22.2%.
For a comprehensive analysis, please see our DTB-K Q3’2021 Earnings Note.
- Stanbic Bank
|
Stanbic Bank Q3’2021 Key Highlights |
|||
|
Balance Sheet |
|||
|
Balance Sheet items |
Q3’2020 (Kshs bn) |
Q3’2021 (Kshs bn) |
y/y change |
|
Government Securities |
55.3 |
45.7 |
(17.4%) |
|
Net Loans and Advances |
158.9 |
176.6 |
11.2% |
|
Total Assets |
317.8 |
295.0 |
(7.2%) |
|
Customer Deposits |
226.0 |
212.9 |
(5.8%) |
|
Deposits Per Branch |
9.0 |
8.5 |
(5.8%) |
|
Total Liabilities |
277.5 |
250.3 |
(9.8%) |
|
Shareholders’ Funds |
40.3 |
44.7 |
11.0% |
|
Income Statement |
|||
|
Income Statement Items |
Q3’2020 (Kshs bn) |
Q3’2021 (Kshs bn) |
y/y change |
|
Net Interest Income |
8.9 |
10.0 |
12.2% |
|
Net non-Interest Income |
7.2 |
7.5 |
4.2% |
|
Total Operating income |
16.1 |
17.5 |
8.6% |
|
Loan Loss provision |
(2.9) |
(1.5) |
(48.4%) |
|
Total Operating expenses |
(10.7) |
(10.5) |
(2.1%) |
|
Profit before tax |
5.4 |
7.0 |
29.7% |
|
Profit after tax |
3.6 |
5.1 |
43.2% |
|
Core EPS |
9.0 |
12.9 |
43.2% |
|
Key Ratios |
|||
|
Ratios |
Q3’2020 |
Q3’2021 |
% point change |
|
Yield from interest-earning assets |
7.1% |
6.6% |
(0.5%) |
|
Cost of funding |
2.4% |
2.0% |
(0.4%) |
|
Net Interest Margin |
6.2% |
6.2% |
0.0% |
|
Non-Performing Loans (NPL) Ratio |
12.3% |
11.5% |
(0.8%) |
|
NPL Coverage |
61.8% |
54.9% |
(6.9%) |
|
Cost to Income with LLP |
66.3% |
59.8% |
(6.5%) |
|
Loan to Deposit Ratio |
70.3% |
83.0% |
12.7% |
|
Return on Average Assets |
1.1% |
2.2% |
1.0% |
|
Return on Average Equity |
8.0% |
14.0% |
6.0% |
|
Equity to Assets |
12.7% |
15.2% |
2.5% |
|
Capital Adequacy Ratios |
|||
|
Ratios |
Q3’2020 |
Q3’2021 |
% point change |
|
Core Capital/Total Liabilities |
17.1% |
19.5% |
2.4% |
|
Minimum Statutory ratio |
8.0% |
8.0% |
0.0% |
|
Excess |
9.1% |
11.5% |
2.4% |
|
Core Capital/Total Risk Weighted Assets |
15.5% |
15.5% |
0.0% |
|
Minimum Statutory ratio |
10.5% |
10.5% |
0.0% |
|
Excess |
5.0% |
5.0% |
0.0% |
|
Total Capital/Total Risk Weighted Assets |
17.7% |
17.5% |
(0.2%) |
|
Minimum Statutory ratio |
14.5% |
14.5% |
0.0% |
|
Excess |
3.2% |
3.0% |
(0.2%) |
Key take-outs from the earnings release include;
- Profit after tax increased by 43.2% to Kshs 5.1 bn in Q3’2021, from Kshs 3.6 bn in Q3’2020. The performance was driven by a 8.6% increase in total operating income to Kshs 17.5 bn in Q3’2021, from Kshs 16.1 bn in Q3’2020,a 2.1% decrease in total operating expenses to Kshs 10.5 bn, from Kshs 10.7 bn in Q3’2020 largely driven by the 48.4% decrease in the loan loss provision to Kshs 1.5 bn from Kshs 2.9 bn,
- Interest income grew by 1.6% to Kshs 14.8 bn in Q3’2021, from Kshs 14.6 bn in Q3’2020. This was largely due to an 11.4% increase on interest income from government securities to Kshs 3.6 bn, from Kshs 3.2 bn in Q3’2020, coupled with a 1.5% growth in interest income from loans and advances to Kshs 10.9 bn, from Kshs 10.7 bn in Q3’2020. The growth in interest income was however mitigated by a 45.6% decline in interest income from deposits with banking institutions to Kshs 0.3 bn in Q3’2021, from Kshs 0.6 bn in Q3’2020,
- The Yield on Interest-Earning Assets (YIEA) declined to 6.6%, from 7.1% in Q3’2020, following the 9.1% growth in the average interest earning assets, which outpaced the 1.6% increase in interest income,
- Interest expense declined by 15.2% to Kshs 4.8 bn, from Kshs 5.6 bn in Q3’2020, following a 21.1% decline in interest expenses on Deposits and placements from banking institutions to Kshs 0.3 bn, from Kshs 0.4 bn in Q3’2020, coupled with a 10.5% decline in the interest expense on customer deposits to Kshs 4.1 bn, from Kshs 4.6 bn in Q3’2020. Cost of funds, on the other hand, declined to 2.0%, from 2.4% in Q3’2020, owing to the 15.2% decline in interest expense, coupled with the 0.6% growth in average interest bearing liabilities,
- Net Interest Margin (NIM) remained unchanged at 6.2%,
- Total operating expenses declined by 2.1% to Kshs 10.5 bn in Q3’2021, from Kshs 10.7 bn in Q3’2020, mainly attributable to a 48.4% decline in Loans Loss Provisions (LLPs) to Kshs 1.5 bn in Q3’2021, from Kshs 2.9 bn recorded in Q3’2020. Staff costs increased by 12.5% to Kshs 4.5 bn in Q3’2021, from Kshs 4.0 bn in Q3’2020,
- The balance sheet recorded a contraction as total assets declined by 7.2% to Kshs 295.0 bn, from Kshs 317.8 bn in Q3’2020. The decline was largely driven by an 17.4% decline in investment securities to Kshs 45.7 bn from Kshs 55.3 bn in Q3’2020 but there was an 11.2% growth in net loans to Kshs 176.6 bn, from Kshs 158.9 bn in Q3’2020,
- Total liabilities declined by 9.8% to Kshs 250.3 bn, from Kshs 277.5 bn in Q3’2020, largely driven by a 40.9% decline in Placements to Kshs 3.4 bn from Kshs 5.8 bn in Q3’2020 coupled with a 5.8% decrease in customer deposits to Kshs 212.9 bn in Q3’2021, from Kshs 226.0 bn in Q3’2020. The decline was however mitigated by a 29.9% increase in borrowings to Kshs 10.9 bn from Kshs 8.4 bn in Q3’2020,
- Deposits per branch decreased by 5.8% to Kshs 8.5 bn, from Kshs 9.0 bn in Q3’2020, and the number of branches remained unchanged at 25,
- Gross Non-Performing Loans (NPLs) increased by 2.5% to Kshs 21.7 bn in Q3’2021, from Kshs 21.1 bn in Q3’2020 taking the NPL ratio to 11.5% in Q3’2020, from 12.3% in Q3’2020. The improvement in the group’s asset quality is attributable to the faster 9.7% increase in Gross Loans, as compared to the 2.5% increase in Gross Non-Performing Loans (NPLs),
- General Loan Loss Provisions declined by 2.7% to Kshs 8.2 bn, from Kshs 8.0 bn in Q3’2020. Consequently, the NPL coverage ratio declined to 54.9% in Q3’2021, from 61.8% in Q3’2020, an indication of reduced provisional levels by the bank, and,
- Stanbic Bank is currently sufficiently capitalized with a core capital to risk weighted assets ratio of 15.5%, 5.0% points above the statutory requirement of 10.5%. In addition, the total capital to risk weighted assets ratio was 17.5%, exceeding the statutory requirement of 14.5% by 3.0% points. Adjusting for IFRS 9, core capital to risk weighted assets ratio was at 15.6% while total capital to risk weighted assets was 17.6%.
For a comprehensive analysis, please see our Stanbic Bank’s Q3’2021 Earnings Note.
- HF Group
|
HF Group Q3’2021 Key Highlights |
|||
|
Balance Sheet |
|||
|
Balance Sheet items |
Q3’2020 (Kshs bn) |
Q3’2021 (Kshs bn) |
y/y change |
|
Government Securities |
6.0 |
5.4 |
(9.5%) |
|
Net Loans and Advances |
37.6 |
34.6 |
(7.9%) |
|
Total Assets |
55.1 |
52.2 |
(5.3%) |
|
Customer Deposits |
38.0 |
37.5 |
(1.3%) |
|
Deposits Per Branch |
1.73 |
1.71 |
(1.3%) |
|
Total Liabilities |
45.6 |
44.2 |
(3.0%) |
|
Shareholders’ Funds |
9.6 |
8.0 |
(16.3%) |
|
Income Statement |
|||
|
Income Statement Items |
Q3’2020 (Kshs bn) |
Q3’2021 (Kshs bn) |
y/y change |
|
Net Interest Income |
1.6 |
1.4 |
(14.8%) |
|
Net non-Interest Income |
0.4 |
0.5 |
12.2% |
|
Total Operating income |
2.0 |
1.8 |
(9.4%) |
|
Loan Loss provision |
(0.4) |
(0.2) |
(61.5%) |
|
Total Operating expenses |
(2.7) |
(2.4) |
(12.5%) |
|
Profit before tax |
(0.7) |
(0.5) |
(27.6%) |
|
Profit after tax |
(0.7) |
(0.6) |
(22.0%) |
|
Core EPS |
(1.9) |
(1.5) |
(22.0%) |
|
Key Ratios |
|||
|
Ratios |
Q3’2020 |
Q3’2021 |
% point change |
|
Yield from interest-earning assets |
10.3% |
8.6% |
(1.7%) |
|
Cost of funding |
6.2% |
4.6% |
(1.4%) |
|
Net Interest Margin |
4.2% |
3.9% |
(0.3%) |
|
Non-Performing Loans (NPL) Ratio |
25.4% |
23.0% |
(2.4%) |
|
NPL Coverage |
58.2% |
60.0% |
1.8% |
|
Cost to Income with LLP |
(133.2%) |
(128.6%) |
4.6% |
|
Loan to Deposit Ratio |
98.8% |
92.2% |
(6.6%) |
|
Return on Average Assets |
(1.3%) |
(2.9%) |
(1.6%) |
|
Return on Average Equity |
(7.6%) |
(19.0%) |
(11.4%) |
|
Equity to Assets |
17.3% |
15.3% |
(2.0%) |
|
Capital Adequacy Ratios |
|||
|
Ratios |
Q3’2020 |
Q3’2021 |
% point change |
|
Core Capital/Total Liabilities |
11.3% |
9.7% |
(1.6%) |
|
Minimum Statutory ratio |
8.0% |
8.0% |
0.0% |
|
Excess |
3.3% |
1.7% |
(1.6%) |
|
Core Capital/Total Risk Weighted Assets |
9.49% |
9.46% |
(0.03%) |
|
Minimum Statutory ratio |
10.5% |
10.5% |
0.0% |
|
Excess |
(1.01%) |
(1.04%) |
(0.03%) |
|
Total Capital/Total Risk Weighted Assets |
10.7% |
13.3% |
2.6% |
|
Minimum Statutory ratio |
14.5% |
14.5% |
0.0% |
|
Excess |
(3.8%) |
(1.2%) |
2.6% |
Key take-outs from the earnings release include;
- HF Group recorded a loss per share of Kshs 1.5 in Q3’2021, lower than the loss per share of Kshs 1.9 recorded in Q3’2020. The performance of the group can be attributed to a slower 9.4% decline in total operating income to Kshs 1.8 bn, from Kshs 2.0 bn in Q3’2020, as compared to the 12.5% decline in total operating expenses to Kshs 2.4 bn, from Kshs 2.7 bn seen in Q3’2020,
- Interest income declined by 18.4% to Kshs 3.0 bn, from Kshs 3.6 bn in Q3’2020 driven by a 23.1% decline in interest income from loans and advances to Kshs 2.5 bn, from Kshs 3.2 bn in Q3’2020. The decline was however mitigated by a 22.5% increase in interest income on government securities to Kshs 0.5 bn, from Kshs 0.4 bn in Q3’2020,
- The Yield on Interest-Earning Assets (YIEA), declined to 8.6%, from 11.3% in Q3’2020, due to a faster 13.1% decrease in trailing interest income compared to the 7.4% decline in the average interest-earning assets (IEA),
- Interest expense declined by 21.2% to Kshs 1.6 bn, from Kshs 2.0 bn in Q3’2020, driven by a 28.3% decline in other interest expenses to Kshs 0.3 bn, and a 18.6% decline in interest expense from customer deposits to Kshs 1.1 bn, from Kshs 1.4 bn in Q3’2020. Interest expense on Deposits and placements from other banks also declined by 25.4% to Kshs 0.1 bn, from Kshs 0.3 bn recorded in Q3’2020. Cost of funds declined to 4.6% in Q3’2021, from 6.2% as recorded in Q3’2020,
- Net Interest Margin (NIM) declined to 3.9% from the 4.2% recorded in Q3’2020, due to a 14.8% decrease in trailing Net Interest Income (NII), compared to a 7.4% decline in the average interest-earning assets,
- Total operating expenses declined by 12.5% to Kshs 2.4 bn in Q3’2021, from Kshs 2.7 bn in Q3’2020, mainly attributable to a 61.5% decline in Loans Loss Provisions (LLPs) to Kshs 0.2 bn in Q3’2021, from Kshs 0.4 bn recorded in Q3’2020, coupled with a 5.7% decline in other operating expenses to Kshs 1.3 bn in Q3’2021, from Kshs 1.4 bn recorded in Q3’2020,
- The balance sheet recorded a contraction as Total Assets decreased by 5.3% to Kshs 52.2 bn in Q3’2021, from Kshs 55.1 bn recorded in Q3’2020. This is attributable to a 7.9% decline in the loan book to Kshs 34.6 bn, from Kshs 37.6 bn recorded in Q3’2020, coupled with a 9.5% decline in Government securities to Kshs 5.4 bn in Q3’2021, from Kshs 6.0 bn in Q3’2020. This contraction in the loan book and Government securities were however mitigated by a 84.8% increase in placements to Kshs 1.7 bn in Q3’2021, from Kshs 0.9 bn in Q3’2020,
- Total liabilities decreased by 3.0% to Kshs 44.2 bn in Q3’2020, from Kshs 45.6 bn in Q3’2020, driven by a 12.1% decline in borrowings to Kshs 4.7 bn, from Kshs 5.3 bn in Q3’2020, and a 1.3% decline in customer deposits to Kshs 37.5 bn in Q3’2021, from Kshs 38.0 bn in Q3’2020,
- Deposits per branch decreased by 1.3% to Kshs 1.71 bn, from Kshs 1.73 bn in Q3’2020, with the number of branches remaining unchanged at 22,
- Gross Non-Performing Loans (NPLs) declined by 20.0% to Kshs 9.0 bn, from Kshs 11.2 bn recorded in Q3’2020. Consequently, the NPL ratio improved to 22.0% from the 25.4% recorded in Q3’2020, following the faster 20.0% decline in NPLs that outpaced the 7.5% decline in gross loans which came in at Kshs 40.8 bn in Q3’2020, from Kshs 44.1 bn recorded in Q3’2020,
- General Loan Loss Provisions increased by 6.2% to Kshs 3.4 bn in Q3’2021, from Kshs 3.2 bn in Q3’2020. The NPL coverage thus improved to 68.9% in Q3’2021, from 58.2% in Q3’2020 owing to the 6.2% increase in general loan loss provisions coupled with the 20.0% decline in gross NPLs. The increase in the NPL Coverage suggests improved provisioning, and,
- HF Group remains undercapitalized with a core capital to risk-weighted assets ratio of 9.5%, 1.0% points below the statutory requirement of 10.5%. In addition, the total capital to risk-weighted assets ratio came in at 13.3%, below the statutory requirement by 1.2% points. Adjusting for IFRS 9, the core capital to risk-weighted assets stood at 9.6%, while total capital to risk-weighted assets came in at 13.4%.
For a comprehensive analysis, please see our HF Group Q3’2021 Earnings Note.
Asset Quality
The table below is a summary of the asset quality for the companies that have released
|
Bank |
Q3'2020 NPL Ratio** |
Q3'2021 NPL Ratio* |
% point change in NPL Ratio |
Q3'2020 NPL Coverage** |
Q3'2021 NPL Coverage* |
% point change in NPL Coverage |
|
HF Group |
25.4% |
23.0% |
(2.4%) |
58.2% |
60.0% |
1.8% |
|
NCBA Group |
14.1% |
17.0% |
2.9% |
58.3% |
70.2% |
11.9% |
|
Standard Chartered Bank Kenya |
14.8% |
15.3% |
0.5% |
78.2% |
82.8% |
4.6% |
|
Equity Group |
10.8% |
9.5% |
(1.3%) |
52.0% |
60.6% |
8.6% |
|
Co-operative Bank of Kenya |
13.2% |
14.6% |
1.4% |
50.1% |
65.5% |
15.4% |
|
KCB |
15.3% |
13.7% |
(1.6%) |
58.5% |
63.4% |
4.9% |
|
Diamond Trust Bank |
8.7% |
11.9% |
3.2% |
62.5% |
40.0% |
(22.5%) |
|
Stanbic Bank |
12.3% |
11.5% |
(0.8%) |
61.8% |
54.9% |
(6.9%) |
|
Equity Group |
10.8% |
9.5% |
(1.3%) |
52.0% |
60.6% |
8.6% |
|
ABSA Bank Kenya |
7.6% |
8.1% |
0.5% |
64.9% |
75.5% |
10.6% |
|
Mkt Weighted Average |
12.4% |
12.3% |
(0.1%) |
59.2% |
65.2% |
6.0% |
|
*Market cap weighted as at 26/11/2021 **Market cap weighted as at 01/12/2020 |
||||||
Key take-outs from the table include;
- Asset quality for the listed banks that have released their Q3’2021 results improved during the period, with the weighted average NPL ratio declining marginally by 0.1% points to a market cap weighted average of 12.3%, from an average of 12.4% for the listed banking sector in Q3’2020. The improvement in asset quality is attributable to declining credit risk on the back of increased business activities in 2021 driven by the gradual economic recovery,
- NPL Coverage for the listed banks increased to a market cap weighted average of 65.2% in Q3’2021, from 59.2% recorded in Q3’2020, as the banks increased their provisioning levels to proactively manage risks given the COVID-19 operating environment, and,
- Diamond Trust Bank recorded a decline in their NPL coverage despite the NPL ratio rising, which would suggest modest provisioning.
Summary Performance
The table below highlights the performance of the banks that have released so far, showing the performance using several metrics, and the key take-outs of the performance;
|
Bank |
Core EPS Growth |
Interest Income Growth |
Interest Expense Growth |
Net Interest Income Growth |
Net Interest Margin |
Non-Funded Income Growth |
NFI to Total Operating Income |
Growth in Total Fees & Commissions |
Deposit Growth |
Growth in Government Securities |
Loan to Deposit Ratio |
Loan Growth |
Return on Average Equity |
|
ABSA |
328.3% |
1.3% |
(19.1%) |
8.6% |
7.0% |
5.2% |
32.0% |
11.9% |
9.0% |
(5.6%) |
85.2% |
9.50% |
21.1% |
|
NCBA |
159.0% |
9.8% |
(1.3%) |
19.1% |
6.2% |
(0.2%) |
44.3% |
(4.3%) |
11.2% |
(14.1%) |
53.2% |
(4.6%) |
11.8% |
|
KCB |
131.4% |
16.2% |
10.8% |
17.9% |
8.4% |
10.3% |
29.4% |
1.2% |
11.2% |
6.9% |
75.9% |
12.9% |
22.7% |
|
Equity |
78.6% |
28.7% |
45.0% |
23.3% |
7.0% |
28.8% |
39.7% |
34.2% |
26.6% |
25.8% |
63.9% |
23.2% |
22.2% |
|
Stanbic |
43.2% |
0.5% |
(7.3%) |
12.2% |
6.2% |
4.2% |
42.6% |
(8.5%) |
(5.8%) |
(17.4%) |
83.0% |
11.2% |
14.0% |
|
SCBK |
33.7% |
(2.5%) |
(23.3%) |
2.8% |
6.7% |
19.1% |
33.9% |
17.9% |
6.4% |
(6.8%) |
51.0% |
0.1% |
14.5% |
|
HF Group |
22.0% |
(18.4%) |
(21.2%) |
(14.8%) |
3.9% |
12.2% |
24.7% |
27.5% |
(1.3%) |
(9.5%) |
92.2% |
(7.9%) |
(19.0%) |
|
DTBK |
20.1% |
6.0% |
6.2% |
5.9% |
5.4% |
(4.9%) |
24.5% |
0.3% |
12.3% |
(2.7%) |
63.5% |
0.0% |
6.8% |
|
Co-op |
18.0% |
21.6% |
22.4% |
21.3% |
8.5% |
15.6% |
35.4% |
9.4% |
12.0% |
35.9% |
72.9% |
7.8% |
14.2% |
|
Q3'21 Mkt Weighted Average* |
105.5% |
16.2% |
15.5% |
17.3% |
7.3% |
15.7% |
35.6% |
14.3% |
14.6% |
11.2% |
69.4% |
12.7% |
19.0% |
|
Q3'20 Mkt Weighted Average** |
(32.4%) |
10.8% |
8.2% |
11.7% |
7.0% |
2.1% |
35.9% |
(7.9%) |
23.1% |
47.4% |
65.6% |
15.0% |
13.0% |
|
*Market cap weighted as at 26/11/2021 **Market cap weighted as at 01/12/2020 |
|||||||||||||
Key takeaways from the table above include:
- The listed banks that have released recorded a 105.5% weighted average growth in core Earnings per Share (EPS), compared to a weighted average decline of 32.4% in Q3’2020 for the listed banking sector. The performance is however largely skewed by the strong performance from ABSA Bank, NCBA Group and KCB,
- The Banks have recorded a weighted average deposit growth of 14.6%, slower than the 23.1% growth recorded in Q3’2020,
- Interest expense grew at a faster pace, by 15.5%, compared to the 8.2% growth in Q3’2020, while cost of funds declined, coming in at a weighted average of 2.6% in Q3’2021, from 2.9% in Q3’2020, owing to the faster growth in average interest-bearing liabilities, an indication that the listed banks were able to mobilize cheaper deposits,
- Average loan growth came in at 12.7%, 2.3% points lower than the 15.0% growth recorded in Q3’2020. The loan growth was however higher than the 11.2% growth in government securities, an indication of the banks resumption in lending to businesses following the improving operating environment,
- Interest income grew by 16.2%, compared to a growth of 10.8% recorded in Q3’2020. Notably, the weighted average Yield on Interest Earning Assets (YIEA) increased to 9.8%, from the 9.5% recorded in Q3’2020 for the listed banking sector, an indication of the increased allocation to higher-yielding assets by the sector during the period. Consequently, the Net Interest Margin (NIM) now stands at 7.3%, 0.3% points higher than the 7.0% recorded in Q3’2020 for the whole listed banking sector, and,
- Non-Funded Income grew by 15.7%, compared to the 2.1% growth recorded in Q3’2020. This can be attributable to the faster growth in the fees and commission which grew by 14.3% compared to a decline of 7.9% in Q3’2020, following the expiry of the waiver on fees on mobile transactions.
Universe of Coverage
|
Company |
Price as at 19/11/2021 |
Price as at 26/11/2021 |
w/w change |
YTD Change |
Year Open 2021 |
Target Price* |
Dividend Yield |
Upside/ Downside** |
P/TBv Multiple |
Recommendation |
|
I&M Group*** |
21.5 |
20.9 |
(2.6%) |
(53.4%) |
44.9 |
32.0 |
10.8% |
63.9% |
0.6x |
Buy |
|
Kenya Reinsurance |
2.3 |
2.4 |
4.0% |
2.2% |
2.3 |
3.3 |
8.5% |
49.0% |
0.2x |
Buy |
|
NCBA*** |
23.8 |
23.5 |
(1.1%) |
(11.7%) |
26.6 |
31.0 |
6.4% |
38.3% |
0.5x |
Buy |
|
ABSA Bank*** |
10.5 |
11.0 |
4.3% |
15.0% |
9.5 |
13.8 |
0.0% |
26.0% |
1.1x |
Buy |
|
KCB Group*** |
45.9 |
43.9 |
(4.5%) |
14.2% |
38.4 |
53.4 |
2.3% |
24.1% |
0.9x |
Buy |
|
Standard Chartered*** |
128.8 |
127.5 |
(1.0%) |
(11.8%) |
144.5 |
145.4 |
8.2% |
22.3% |
1.0x |
Buy |
|
Co-op Bank*** |
12.3 |
12.4 |
0.4% |
(1.6%) |
12.6 |
14.1 |
8.1% |
22.3% |
0.9x |
Buy |
|
Diamond Trust Bank*** |
57.0 |
57.0 |
0.0% |
(25.7%) |
76.8 |
67.3 |
0.0% |
18.1% |
0.2x |
Accumulate |
|
Liberty Holdings |
7.5 |
6.8 |
(8.8%) |
(11.7%) |
7.7 |
7.8 |
0.0% |
14.4% |
0.6x |
Accumulate |
|
Britam |
7.2 |
7.4 |
2.5% |
6.0% |
7.0 |
8.3 |
0.0% |
12.4% |
1.2x |
Accumulate |
|
Jubilee Holdings |
328.0 |
340.0 |
3.7% |
23.3% |
275.8 |
371.5 |
2.6% |
11.9% |
0.6x |
Accumulate |
|
Equity Group*** |
52.0 |
51.5 |
(1.0%) |
42.1% |
36.3 |
57.5 |
0.0% |
11.7% |
1.3x |
Accumulate |
|
Stanbic Holdings |
91.8 |
91.0 |
(0.8%) |
7.1% |
85.0 |
96.6 |
4.2% |
10.3% |
0.8x |
Accumulate |
|
Sanlam |
11.5 |
11.0 |
(4.3%) |
(15.4%) |
13.0 |
12.1 |
0.0% |
10.1% |
1.2x |
Accumulate |
|
CIC Group |
2.3 |
2.3 |
0.0% |
9.0% |
2.1 |
2.0 |
0.0% |
(11.1%) |
0.8x |
Sell |
|
HF Group |
4.9 |
4.3 |
(11.8%) |
37.6% |
3.1 |
3.1 |
0.0% |
(28.2%) |
0.2x |
Sell |
|
Target Price as per Cytonn Analyst estimates **Upside/ (Downside) is adjusted for Dividend Yield ***For Disclosure, these are stocks in which Cytonn and/or its affiliates are invested in Key to note, I&M Holdings YTD share price change is mainly attributable to the counter trading ex-bonus issue |
||||||||||
We are “Neutral” on the Equities markets in the short term. With the market currently trading at a premium to its future growth (PEG Ratio at 1.4x), we believe that investors should reposition towards companies with a strong earnings growth and are trading at discounts to their intrinsic value. We expect the discovery of new COVID-19 variants coupled with slow vaccine rollout in developing economies to continue weighing down the economic outlook. On the upside, we believe that the recent relaxation of lockdown measures in the country will lead to improved investor sentiments in the economy.
- Residential Sector
During the week, Kenya Mortgage Refinance Company (KMRC), a treasury backed mortgage lender, announced that it is holding talks with the Kenya Bankers Association (KBA) and other relevant stake holders in the financial sector, to develop a secondary mortgage market in the country. The firm expects to work in conjunction with Primary Mortgage Lenders (PMLs) such as banks, Savings and Credit Co-Operative Societies (SACCOs) and microfinance institutions to develop mortgage-backed securities, where lenders will pull home loans with similar characteristics (such as interest rates, risk and repayment terms) and sell to third party investors such as Pensions funds and Insurers as asset backed securities. The investors will buy the packaged securities, lend to homebuyers and get returns through monthly repayments on interests and principal sums. KMRC hopes to overcome the current challenge of lack of uniformity in mortgage lending terms such as interest rates and repayment periods across the various PMLs in order to achieve this. The uniformity of terms is not only important in the packaging of loans but also in enhancing the sector’s bargaining power to third party buyers for a holistic mortgage market development.
The key advantages of a secondary mortgage market include;
- Improved liquidity and loan capacity since after the sale of the asset backed securities to third party investors, PMLs have access to funds that can be used to generate more loans for other clients,
- Increased lending scope of PMLs by including third party investors such as Pension funds, Insurers and Mutual Funds, who will be clients of grouped mortgage loans of similar characteristics. The investors will then be able to target and accommodate a vast diversified number of mortgage clients,
- Fall in interest rates as market competition increase from the increased number of players thereby accommodating more low income mortgage clients, and,
- Solving the balance sheet mismatch for PMLs who have to use short term deposits to service long term mortgage loans. The secondary mortgage market will solve this problem of lack of long-term funds by transferring servicing rights to third parties.
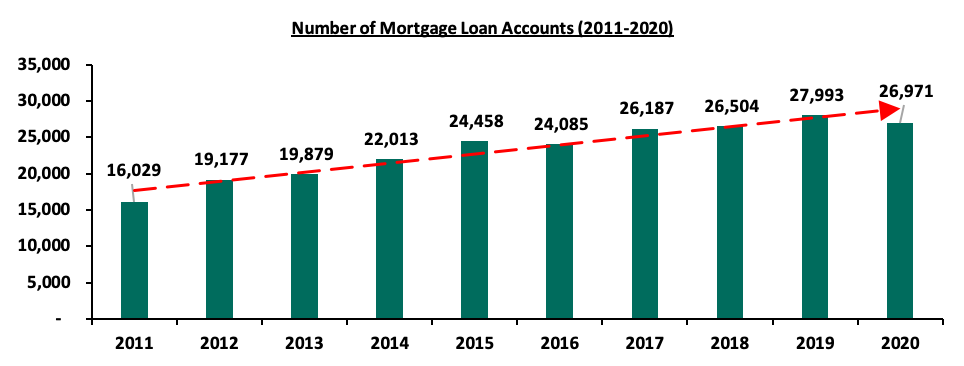
The move by KMRC is expected to improve the residential mortgage market which has not been performing well. According to the Central Bank of Kenya- Bank Supervision Annual Report 2020, the residential mortgage market recorded a 3.7% decline in the number of mortgage loans accounts, to 26,971 in December 2020 from 27,993 in December 2019. The overall value of mortgage loans outstanding therefore registered a 2.1% decline to Kshs 232.7 bn in December 2020, from Kshs 237.7 bn in December 2019. The performance decline of the mortgage market was mainly attributed to fewer mortgage loans advanced by banks to the Real Estate sector with the mortgage defaults in Q1’2021 increasing by 14.8%.
The graph below shows the number of mortgage loan accounts in Kenya over the last 10 years;
Source: Central Bank of Kenya (CBK)
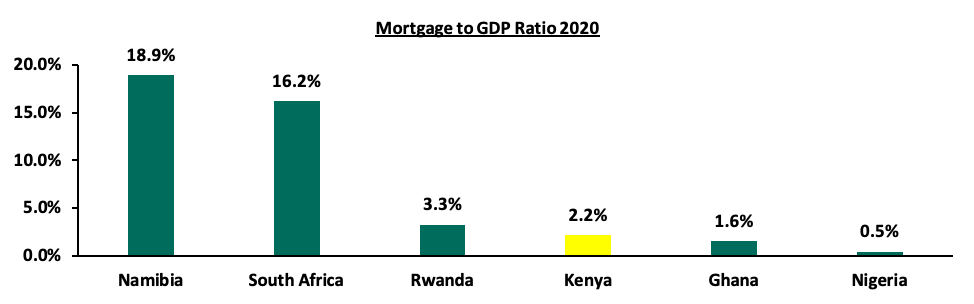
Kenya’s mortgage to GDP ratio continues to lag behind at 2.2% as of 2020, compared to countries such as Namibia and South Africa at 18.9% and 16.2%, respectively, due to high mortgage interest rates, high initial deposits and lack of information on criteria threshold for mortgage products. The graph below highlights the Mortgage to GDP ratio in select African countries in 2020;
Source: Center for Affordable Housing Africa
The home ownership in Kenya therefore remains low at 21.3% in urban areas as at 2020, compared to other African countries such as South Africa and Ghana at 53.0% and 47.2%, respectively. The low home ownership rate is attributed to; i) the increasing number of Non-Performing Loans (NPLS) in the Real Estate sector, by 14.8 % to Kshs 70.5 bn in Q1’2021, from Kshs 61.4 bn recorded in Q4’2020 leading to tighter underwriting standards, ii) high property costs, iii) high initial deposits required to access mortgages, iv) sluggishness in the affordable housing initiative, and, v) an under-developed capital markets that makes it hard for businesses and individuals to raise funds aimed at mortgage finance.
The graph below shows the home ownership percentages of different countries compared to Kenya;
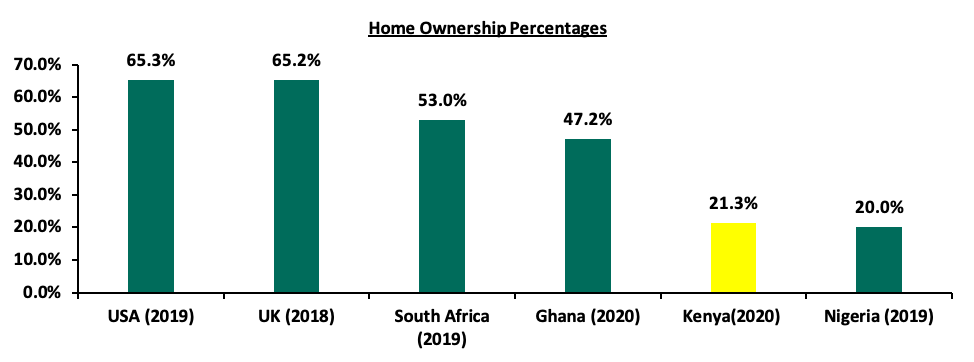
Source: Centre for Affordable Housing Africa, Federal Reserve Bank
The intended increase in mortgage lending by means of a secondary market is expected to support the performance of the residential sector, coupled by regulatory efforts such as those by Competition Authority of Kenya (CAK) to streamline the sector by ensuring transparency and efficiency in mortgage lending.
- Retail Sector
During the week, Papa John’s International Inc. announced a partnership deal with Kitchen Express to open 60 new fast-food outlets in Kenya and Uganda from 2022. Papa John’s boasts of over 5,500 outlets, behind Domino’s and Pizza Hut chains with over 18,057 and 17,809 outlets worldwide as at August 2021, respectively. Papa John’s outlets will be opened in select Hass Petroleum properties, given that Kitchen Express is a subsidiary of AAH Limited, the majority shareholder of Hass Petroleum Group. Locally, Papa Jones will be competing with rivals such as Pizza Inn with 38 outlets. The entry of the fast-food retail chain into the Kenyan and Ugandan market is attributable to; i) the brand’s need to increase its geographical footprint, ii) the strategic market approach by Hass to attract tenants for rental income and subsequent fuel revenues from clients, iii) the vibrant youthful population in the country who are expected to form a large part of the firms targeted clientele particularly through e-commerce, and, iv) Nairobi’s rise as a hub for international corporations supported by the developing infrastructure.
The Kenyan retail sector performance is expected to be supported by the opening of new franchises such as Papa John’s and the rise of e-commerce through online payments and deliveries complementing sales in physical outlets. However, rise of e-commerce has also led to reducing need for physical retail space, and hence, the retail market continues to experience an oversupply of 1.7 mn SQFT in the Kenyan retail sector and 3.0 mn SQFT in the NMA retail sector.
- Mixed-Use Developments (MUDs)
During the week, Tatu City, a Mixed-Use developer, announced a partnership deal with Stecol Corporation, a Chinese construction and engineering firm, to develop supporting infrastructure in the final phase of Kijani Ridge located in Ruiru, Kiambu County. The project’s cost is estimated at Kshs 1.0 bn and is expected to be completed by the end of 2022. The deal will see the firm build 12.0 Km of roads and footpaths, a 5.0 Km underground storm water conduit, 2.7 Km of sewer line, water supply pipeline, streetlights, fibre optic cables and connect power lines. Kijani Ridge is a premier community set on 350 acres of land in the larger 5,000 acre Tatu City and comprises of 439 quarter and half acre serviced plots divided among phases. The project is now in Phase III which has been announced to be 60.0% sold. Currently, Kijani Ridge has 75 homes under construction by individual owners, while 100 others are under the statutory approval processes. Over 50 firms have already taken space at Tatu City including; Mountain Top Publishers, Kenya Wine Agencies, Chandaria Industries, Crawford International School, Nova Pioneer School, among others. We expect Tatu City’s development of amenities to keep attracting investors coupled with the Special Economic Zone Status that comes with reduced corporate taxes and zero Value Added Tax (VAT).
Mixed-Use Developments continue to gain traction with our Nairobi Metropolitan Area (NMA) Mixed-Use Development Report 2021 indicating that developments recorded an average rental yield of 7.2% in 2021, 0.7% points higher than the respective single-use themes, which recorded average rental yield of 6.5% in the similar period. The relatively better performance was mainly attributed to; i) an improved business environment, ii) strategic and prime locations of the developments with the capability to attract prospective clients, and, iii) preference by target clients due to their live, work and play convenience leading to improved demand.
The table below shows the performance of single-use and mixed-use development themes between 2020 and 2021;
|
Thematic Performance of MUDs in Key Nodes 2020-2021 |
||||||
|
|
MUD Themes Average |
Market Performance Average |
||||
|
Rental Yield 2021 |
Rental Yield 2020 |
∆ in y/y MUD Rental yield |
Rental Yield 2021 |
Rental Yield 2020 |
∆ in y/y Market Average Rental Yield |
|
|
Retail |
8.4% |
7.1% |
1.3% |
7.8% |
7.7% |
0.1% |
|
Offices |
7.1% |
6.9% |
0.2% |
6.6% |
6.8% |
(0.2%) |
|
Residential |
6.0% |
6.3% |
(0.3%) |
5.2% |
5.8% |
(0.6%) |
|
Average |
7.2% |
6.9% |
0.3% |
6.5% |
6.8% |
(0.3%) |
|
* Market performance is calculated from nodes where sampled MUDs exist |
||||||
Source: Cytonn Research 2021
We expect MUDs to continue performing well due to the integration benefits they offer such as easier access to retail services and amenities, as well as residential and working spaces all in one location.
- Infrastructure Sector
During the week, Kenya National Highways Authority (KeNHA) announced that they had contracted Victoria Engineering Company, to tarmac the 35.8 Km Kopasi River- Lomut – Sigor- Marich link road, in West Pokot County, at a cost of Kshs 4.4 bn. The road is expected to be done by October 2024 and will connect to the Kitale – Lodwar- South Sudan Highway at Marich Pass. Additionally, there will be a parking bay for long distance trucks at Sigor and Lomut, street lights all through the line of the road, access roads at Sigor and an interchange at Marich Pass. The road forms part of the 124.5 Km road running through the counties of West Pokot, Elgeyo Marakwet and Baringo, to be constructed at a cost of Kshs 14.4 bn, from January 2022. Upon completion, the link road is expected to;
- Link Nakuru and Lodwar Towns, and reduce travel distance through current routes by an estimated 70.0 Km
- Open up the Kerio Valley for investments including Real Estate investments by improving connectivity for developers and buyers,
- Enhance market accessibility especially for agricultural and industrial products thereby boosting economic activities, and,
- Generate county revenues in areas like Sigor and Lomut where construction of a parking bay for long distance trucks has been planned.
The government continues to finance FY’2021/2022 infrastructure budget at Kshs 182.5 bn through internal and external borrowing from countries such as China and Korea, in order to see infrastructure projects to completion. This year’s budget represents a 0.6% increase from Kshs 181.4 bn allocation for FY’2020/2021 indicating government’s commitment to infrastructural development. We therefore expect infrastructure major projects in the pipeline particularly in the NMA such as the Nairobi Express Way which has been announced to be 75.0% complete, Western Bypass (linking the towns of Kikuyu and Ruaka) and the conversion of Eastern Bypass into a dual carriage way to be done to completion. This will open up more areas for Real Estate investments through enhanced accessibility.
The graph below shows the budget allocation to the infrastructure sector over the last nine financial years:
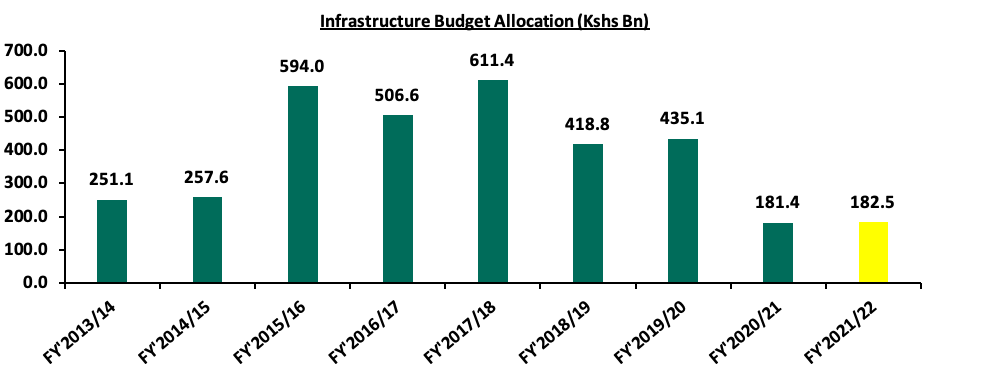
Source: National Treasury
We expect the government’s continued focus on initiation and completion of infrastructure developments to support the realization of the Vision 2030 Agenda on developing quality, safe and adequate roads to make Kenya an intra-regional hub for trade in East Africa, and support Real Estate investments through accessibility.
- REIT Performance
During the week, Fahari I-REIT price declined by 2.3% to close at Kshs 6.7 per share, compared to Kshs 6.8 per share recorded the previous week. On a YTD basis, the listed REIT has gained by 18.4% from Kshs 5.6 recorded at the beginning of the year. The REIT’s closing price also represented a loss in the Inception to Date (ITD) performance declining by 66.6% from the inception price of Kshs 20.0 per share. Additionally, according to NSE’s Unquoted Securities Platform (USP) report, the Acorn REITs performance remained unchanged, with the DREIT closing at Kshs 20.2 while the I-REIT closed at Kshs 20.6 per unit, as was recorded the previous week. This performance represented a 0.9% and 3.1%, gain for the DREIT and I-REIT, respectively, from the Kshs 20.0 Inception price. The volumes traded for the D-REIT and I-REIT remained unchanged at 5.4 mn and 12.3 mn, respectively, with a turnover of Kshs 108.9 mn and Kshs 254.1 mn, respectively.
The Kenyan REIT market continues to record subdued performance, forming a mere 0.04% of the total market cap compared to the REIT Market in South Africa at 1.6% of the total market capitalization. This is due to constraining by factors such as i) lack of general knowledge about the REIT market and products, ii) high minimum investment amounts set at Kshs 5.0 mn for the D-REIT which 100x the medium income at Kshs 50,000, iii) lengthy regulatory processes discouraging promoters, and, iv) few REIT Trustees currently at 3, due to the high minimum requirements at Kshs 100.0 mn.
The graph below shows Fahari I-REIT’s performance from 27th November 2015 to 26th November 2021:
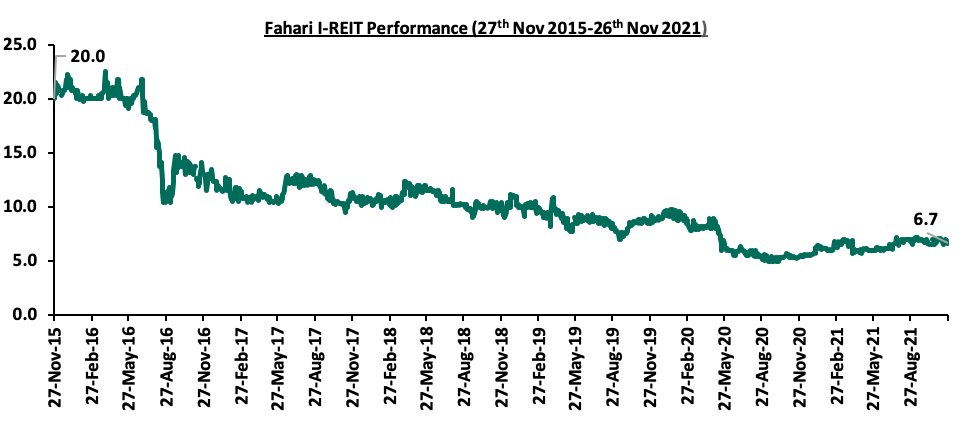
The Real Estate sector performance is expected to be supported by i) plans to develop a secondary mortgage market in the country thereby increasing the mortgage loan lending capacity, ii) Kenya’s preference as a retail market destination by international retailers, iii) partnerships to enhance Mixed-Use Developments performance, and, iv) government’s focus on infrastructure developments in the country in an aim to enhance accessibility, thereby supporting Real Estate investments.
In August 2021, the National Treasury published two legal notices affecting the Individual Retirement Benefits Scheme and Umbrella Retirement Benefits Scheme. The legal notices have amended the access rule to allow members, before retirement age, to access a maximum of 50.0% of the total accrued pension benefits, down from the previous regulation where members could access 100.0% of their own contributions plus 50.0% of the employer's portion. The additional clause stipulates that a trust corporation shall not appoint an administrator, fund manager, custodian or approved issuer who is related to the trust corporation by way of ownership, directorship or employment. This and many other regulatory amendments and guidelines point towards the Retirement Benefits Authority (RBA) proactive change of regulations aimed at boosting the pensions industry's development.
This week, we will demystify these guidelines and assess the impacts the changes will have in the industry. As such, we will cover the topic in four different sections:
- State of the Pensions Industry in Kenya,
- Factors Affecting the Growth of the Pensions Industry,
- Regulatory Changes in the Industry,
- Recommendations, and,
- Conclusion;
Section 1: State of the Pensions Industry in Kenya
The Pensions industry refers to the economic sector comprising of Retirement Benefits Schemes as well as the assets these schemes control. According to the 2019 FinAccess Household Survey Report, the Pensions Industry has seen significant growth with the number of registered members growing by a 10-year CAGR of 15.7% to 3.0 mn members in 2019, from 0.7 mn registered members in 2009. During the same period, the Assets under Management (AUM) grew by a 10-year CAGR of 13.4% to Kshs 1.4 tn as of December 2020, from Kshs 0.4 tn in December 2010 attributable to the initiatives done by the regulator and other stakeholders to educate the public on the need to join retirement benefits schemes coupled with an enabling regulatory environment. Financial technology has also played a significant role in making it easier for Kenyans to join and contribute to pension schemes, as well as enhancing communication between the schemes and their members. However, growth in the pensions industry was disrupted by the adverse effects of the COVID-19 pandemic which negatively impacted the financial markets and the economy at large, as disposable income was reduced due to loss of jobs and salary cuts as firms sought to reduce their expenses.
The graph below shows the growth in Kenyan pension schemes’ AUM over the last 10 years:
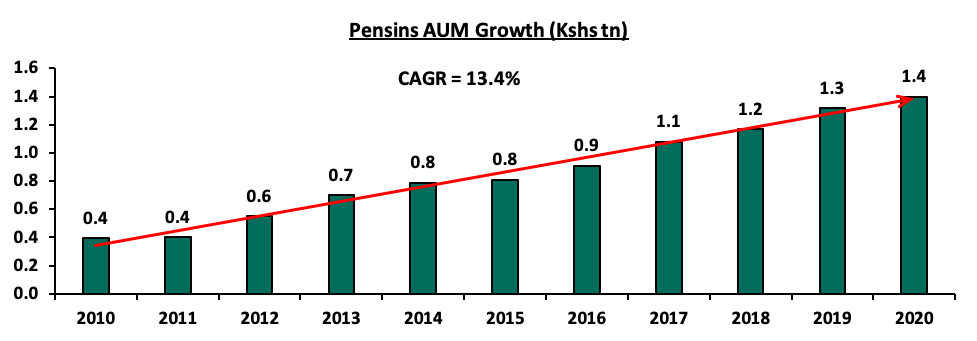
Source: RBA Industry Reports
As at the end of 2020, the pension industry ranked second as the most preferred mode of saving with assets worth Kshs 1.4 tn after bank deposits at Kshs 4.0 tn. Below is a graph showing the sizes of different saving channels and capital market products in Kenya as at December 2020:
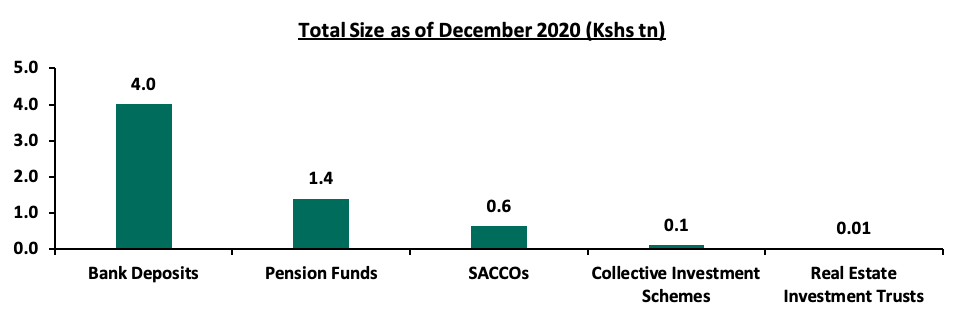
Despite the historical growth, there is still room for improvement given that the Kenyan Pension Schemes’ AUM was equivalent to 13.3% of the country’s GDP in 2020. Compared to other countries, the difference remains significant with the AUM for some of the developed countries exceeding the size of their domestic economy. According to the OECD Pension Funds in Figures June 2021 Report, pension assets in five developed countries exceeded the size of their domestic economy in 2020, Netherlands being top of the list with the AUM equivalent to 210.3% of the country’s GDP. For the African countries, Namibia tops the list with the pensions AUM as a percentage of GDP standing at 101.8% followed by South Africa at 92.1% as of December 2020. The graph below shows the AUM as a percentage of GDP for select Africa countries:
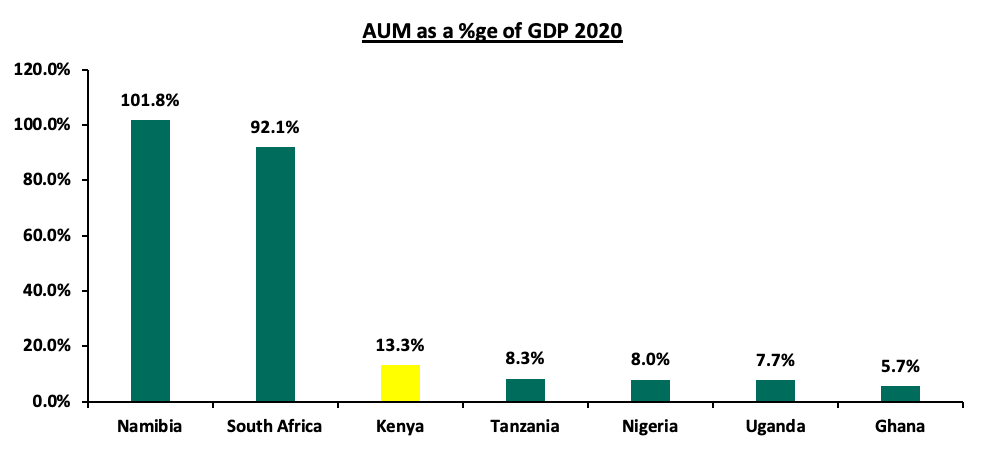
Source: OECD Pensions in Focus Report
The retirement schemes can invest their funds in various asset classes but historically, they have allocated an average of 57.8% of their members’ funds towards Government securities and Quoted Equities over the period 2012 to H1’2021. The high allocation to government securities, an average of 37.5% over the last decade and highest among the asset classes invested in, can be attributed to the fact that pension schemes prioritize on safety of their members’ funds and prefer a high allocation to relatively lower risk investments. It is due to this continued preference that some of the regulatory changes introduced recently are set to encourage investments in alternative assets such as introduction of commercial papers and public private partnership debt instruments as new asset classes. The table below shows the overall historical investment portfolio of pension schemes:
|
Kenyan Pension Funds Asset Allocation |
||||||||||||
|
Asset Class |
2012 |
2013 |
2014 |
2015 |
2016 |
2017 |
2018 |
2019 |
2020 |
H1'2021 |
Average |
Allowable Limit |
|
Government Securities |
35.0% |
33.8% |
31.0% |
29.8% |
38.3% |
36.5% |
39.4% |
42.0% |
44.7% |
44.1% |
37.5% |
90.0% |
|
Quoted Equities |
24.0% |
25.5% |
26.0% |
23.0% |
17.4% |
19.5% |
17.3% |
17.6% |
15.6% |
16.9% |
20.3% |
70.0% |
|
Immovable Property |
19.0% |
17.2% |
17.0% |
18.5% |
19.5% |
21.0% |
19.7% |
18.5% |
18.0% |
16.7% |
18.5% |
30.0% |
|
Guaranteed Funds |
9.0% |
10.3% |
11.0% |
12.2% |
14.2% |
13.2% |
14.4% |
15.5% |
16.5% |
16.7% |
13.3% |
100.0% |
|
Listed Corporate Bonds |
5.0% |
4.4% |
6.0% |
5.9% |
5.1% |
3.9% |
3.5% |
1.4% |
0.4% |
0.2% |
3.6% |
20.0% |
|
Fixed Deposits |
5.0% |
4.9% |
5.0% |
6.8% |
2.7% |
3.0% |
3.1% |
3.0% |
2.8% |
2.5% |
3.9% |
30.0% |
|
Offshore |
2.0% |
2.2% |
2.0% |
0.9% |
0.8% |
1.2% |
1.1% |
0.5% |
0.8% |
1.1% |
1.3% |
15.0% |
|
Cash |
2.0% |
1.3% |
1.0% |
1.4% |
1.4% |
1.2% |
1.1% |
1.2% |
0.9% |
1.2% |
1.3% |
5.0% |
|
Unquoted Equities |
1.0% |
0.6% |
1.0% |
0.4% |
0.4% |
0.4% |
0.3% |
0.3% |
0.2% |
0.2% |
0.5% |
5.0% |
|
Private Equity |
0.0% |
0.0% |
0.0% |
0.0% |
0.0% |
0.0% |
0.1% |
0.1% |
0.1% |
0.2% |
0.0% |
10.0% |
|
REITs |
0.0% |
0.0% |
0.0% |
0.0% |
0.1% |
0.1% |
0.1% |
0.0% |
0.0% |
0.0% |
0.0% |
30.0% |
|
Commercial Paper, non-listed bonds by private companies* |
0.0% |
0.0% |
0.0% |
0.0% |
0.0% |
0.0% |
0.0% |
0.0% |
0.0% |
0.0% |
0.0% |
10.0%s |
|
Others e.g. Unlisted Commercial Papers |
0.0% |
0.0% |
0.0% |
0.0% |
0.0% |
0.0% |
0.0% |
0.0% |
0.0% |
0.1% |
0.0% |
10.0% |
|
|
100.0% |
100.0% |
100.0% |
100.0% |
100.0% |
100.0% |
100.0% |
100.0% |
100.0% |
100.0% |
100.0% |
|
|
Commercial paper, non-listed bonds and other debt instruments issued by private companies was introduced as a new separate asset class category in 2016 through the legal notice No. 107. |
||||||||||||
Source: RBA Industry Reports
Section 2: Factors Affecting Growth of the Pensions Industry
As previously stated, the Kenyan pensions industry has grown significantly in the last ten years with the main factors that have contributed to the growth being:
- Demographic factors – Demographic factors include the statistical factors that influence population growth in one way or another. Over time, the Kenyan young population has witnessed rapid growth, leading to an almost continuous growth of people joining the workforce and saving for retirement. Further, the United Nations’ projects that the corresponding population of youth in Kenya aged 15-24 years and ready to join the workforce will increase to 18.0 mn from 9.5 mn over the period 2015 to 2065. This will likely increase pension scheme membership significantly,
- Technology Advancements and Increased Financial inclusion – Increase in technology advancements, mobile penetration rate and internet connectivity in Kenya have provided an important platform for the delivery of a wide range of financial services. Currently, almost all Individual Pension Plans (IPPs) allow contributions through M-PESA pay bill numbers, a simple and convenient way to make payments. As more people become financially educated particularly in the informal sector, the technological advancements make it easy for people to join schemes and contribute funds as well as track the status of their portfolios,
- Legislation – The numerous reforms in the pensions industry over the past two decades have proved beneficial to the pensions industry. These reforms includes i) tax reliefs on contributions to a maximum of Kshs 20,000 per month or 30.0% of one’s salary, whichever is less, and ii) house ownership structures whereby the members can assign up to 60.0% of the accumulated retirement savings towards securing a mortgage facility or use up to 40.0% of their pension savings directly to purchase a residential house. The enactment of these reforms has served as a great incentive as Kenyans continue to take advantage of the current regulatory environment,
- Social Change - As globalization takes the centre stage, the goal remains boosting economies around the world by creating efficient markets and more job opportunities. Consequently, individuals are becoming less dependent as they have more disposable income and as people understand better the importance of saving for retirement. Additionally, globalization has resulted to an interconnected financial world, which has reduced geographical inequality and ensured that wealth is distributed more evenly. As such, there is increased disposable income and authorities are able to benchmark with each other hence creating efficient systems, and,
- Trustees Certification programs which help improve the management of the Pension Schemes and better equips the Trustees in carrying out their roles.
Challenges in the industry:
Despite the significant developments, the pension coverage in Kenya is still low at 20.0%, with only 3.0 mn people in Pension Schemes out of the 27.1 mn people in the labor force. Some of the challenges that have slowed down the growth in the pensions industry, include:
- Market Volatility – Due to the uncertainty surrounding investment returns, several Kenyans are hesitant to contribute to pension schemes for their retirement for fear of losing their hard-earned money. Pension schemes with high allocation to the Equity markets stand to lose as well due to the market volatility and risk of their members’ funds declining in value,
- Slowdown in economic growth and unemployment - According to data by the Kenya National Bureau of Statistics (KNBS) Quarterly Labor Force Survey Q1 2021, 16.9% (3.0 mn) of the 17.7 million Kenyan youth not in school lacked some form of employment as of March 2021. This was aggravated by the pandemic in 2020, which resulted in millions of job losses as many businesses were forced to downsize leading to reduced disposable income. Additionally, pension reforms are primarily focused on the formal sector in recent decades hence leaving out the informal sector which forms the larger portion of the economy,
- Access of Pension savings before retirement – Employees have previously chosen to withdraw their pension savings immediately after leaving their job. While withdrawing one's pension savings may appear to be a rational option, especially after losing a job or experiencing financial difficulty, it is more self-defeating and short-sighted because we borrow money from our own future. This has a negative impact on the adequacy of pensions upon retirement and result in a lower quality of life after retirement. Withdrawing from pension schemes also slows the growth of the Pension Industry because it takes money out of the schemes, and,
- Low Prioritization of Retirement Planning - Most Kenyans focus more on other immediate financial challenges and end up postponing retirement planning. This leads to low-income replacement ratio as people start saving later in their working years when they have more responsibilities than they had while younger. As a result of saving a small amount of money for a shorter period of time, the retiree ends up with insufficient retirement benefits and is forced to continue working or depending on relatives.
Section 3: Regulatory Changes in the Industry
Over the past few years, the government together with the Retirement Benefits Authority has developed and amended pension schemes’ regulations aimed at strengthening the legal and regulatory framework in the pensions industry. The goal has been to achieve comprehensive pension coverage across the formal and informal sectors and better protect the interests of beneficiaries and rights of pension contributors. These changes are often introduced through;
- Changes to the Finance Act usually as part of the annual budget process,
- Direct Changes to the Retirement Benefits Act or Regulations, often initiated by the Ministry of National Treasury, and,
- Changes to the Income Tax Act.
In Kenya, the Retirement Benefits Authority (“RBA”) is the governing body established under the terms of the Retirement Benefits Act 1997 tasked with regulating and supervising the establishment, management and promotion of Retirement Benefits Schemes. The Authority’s mandate also includes (i) protecting the interest of members and sponsors of Retirement Benefits Schemes, (ii) promoting the development of the retirement benefits sector, (iii) implementing all government policies relating to the sector, and, (iv) Advising the Cabinet Secretary in charge of the National Treasury on the national policy to be followed with regard to the retirement benefits industry. The RBA’s mandate covers all private and government parastatal pension schemes. The civil service pension scheme and the Teachers Services Commission pension scheme is governed by the pensions department under the Ministry of National Treasury.
RBA’s mandate is included in the Retirement Benefits Act and Regulations, a set of legal documents that provide for the existence of the various types of pension schemes in the country and guidelines on how they should be run. However, there are other Acts that affect the pensions industry including the Income Tax Act which contains how different taxes such as Withholding tax are to be charged on pension benefits.
Some of the major changes that have taken place over the last five years include:
- Qualification criteria for Corporate Trustees – In June 2021, the President of Kenya assented to the Finance Act, 2021 which amongst other changes, introduced provisions for the registration and regulation of corporate trustees in the retirement benefits industry through amendments to the Retirement Benefits Act, 1997. Some of the eligibility requirements for a pension corporate trusteeship applicant include having a minimum capital requirement of Kshs 10.0 mn and the applicant should have the professional and technical capacity and adequate operational systems to perform its functions. Detailed requirements are expected to be provided by RBA in its regulations. It is important to note that in Kenya, umbrella pension funds and occupational pension schemes may make use of individual trustees to govern umbrella schemes while Individual Pension Schemes (IPPs) cannot. The move to clearly outline qualification criteria for corporate trustees is highly welcome as it eliminates the element of subjectivity in the trustees’ application process,
- Corporate Trustee Compliance: In 2020, the Retirement Benefits Authority Act, 1997 was amended introducing penalties where a trustee fails to submit a copy of the actuarial report to the Chief Executive Officer of the Retirement Benefits Authority. A penalty of Kshs 100,000 will immediately be imposed in case of delay and a further penalty of Kshs 1,000 shall be charged for each day or part thereof during which the report remains un-submitted. The amendment came in after the authority added two regulatory clauses regarding trustees in 2018 necessitating the approval of trustees remuneration approved by members during the annual general meeting as an object and function of the authority. Further, the guidelines issued a restriction to prevent persons who do not comply with the guidelines or practice notes issued by the Authority from serving as a trustee of any scheme. In our view, the amendment aims to increase trustee compliance by establishing a penalty if statutory requirements are not met. Consequently, this will play a significant role in improving the management of the valuation process, set assumptions, and strategic recovery plans for each period, as trustees will be informed of the current and projected status of their schemes, reducing unforeseen situations such as untimely benefit payment. Overall, these policies prove beneficial since they protect the interests of members of retirement benefit systems. Trustees, on the other hand, may face extra penalties, such as being prohibited from serving, if the RBA finds them to be non-compliant,
- Housing Ownership Structure: In September 2020, the retirement benefits schemes regulations were amended to allow members utilize up to 40.0% or a maximum of Kshs 7.0 mn of their accrued benefits to purchase a residential house. However, scheme members already receiving pension earnings, members already on early retirement, and those that have attained the retirement age will not benefit from this new provision. Previously the proportion was not pre-determined and was bound by terms as may be prescribed in regulations made by the Minister in charge of finances.We are of the view that this amendment will play a big role in supporting members of retirement benefit schemes to own homes after retirement through their pension savings, therefore incentivizing workers to save in retirements benefits schemes. Additionally, the law furthers the Government’s strategic goals in the Big Four Agenda. On the down side, allowing people to purchase houses using the retirement savings will beat the logic of a retirement scheme which is to save for retirement years and in turn reduce the income replacement ratio. It is important to note that previously, pension scheme members were allowed to assign up to 60.0% of their retirement benefits to secure a mortgage facility – a law that was introduced in 2009 and still remains in place,
- Introduction of New Asset Classes – Also in 2020, the RBA introduced two asset classes as investment options for pension schemes; Exchange Traded Funds (ETFs) and Public Private Partnership Debt instruments (PPPs) after introducing Commercial Papers and non-listed bonds in 2016.Previously, pension schemes exposure to infrastructure was through listed companies, Real Estate Portfolios or Private Equity Funds. The introduction allowed a 10.0% allocation of assets under management in PPPs to invest in Debt instruments for the financing of infrastructure or affordable housing projects. In our view, the move by RBA to introduce new asset classes is commendable as pension schemes can take advantage of the long-term stable returns while also aiding in the improvement of Kenyan living standards. Furthermore, the reduction of the maximum percentage that can be invested in unlisted debt instruments to 10.0% from 30.0% will ensure that pension schemes are protected from extensive market risks,
- Transfer of Funds from Guaranteed Schemes: In 2019, the transfer period of schemes that invest in Guaranteed Schemes and wish to withdraw their funds and transfer them to another Scheme (Guaranteed or Segregated), was reduced from three-years to one-year or less as may be specified in the prior agreement. We believe that this change benefits Trustees of schemes who are dissatisfied with their present Approved Issuer/Insurance Company because the assets will begin earning the more favorable returns of the new Approved Issuer/Insurance Company or Fund Manager sooner rather than waiting three years. This would require Approved Issuers/Insurance Companies that offer Guaranteed Schemes to be more cautious in their investment selections and make arrangements for the shorter period allowed for liquidation of a portion of their Guaranteed Fund,
- Post-Retirement Medical Fund: In November 2019, regulations regarding post-retirement medical fund was amended to allow Umbrella Scheme members to make additional voluntary contributions to a post-retirement medical fund. This provision was initially available to members of Occupational Schemes and Individual Schemes. The amendments also include a provision that allows members to transfer up to 10.0% of their retirement savings into the medical fund in order to achieve the desired level of medical funds. This amendment will play a major role towards the achievement of universal health coverage and allow members to fund their medical needs after retirement seeing that most insurance companies do not cover old age diseases. However, the uptake of the fund by people saving for retirement is still very low given that it is voluntary with most people viewing it as an extra expense,
- Income Drawdown as an Alternative Option to annuity at Retirement: Also in 2019, the Retirement Benefits Regulations saw the introduction of the provision requiring schemes to include income drawdown as an option for members to access their retirement benefits at retirement, in addition to an annuity or a lump sum. The income drawdown fund allows a member the chance to leave inheritance to his/her beneficiaries in the event of death. Currently, there are 13 income drawdown funds registered under the RBA compared to only 5 in 2019 hence a positive outlook,
- Treatment of Unclaimed Benefits – In 2019, and with regards to the winding up procedures of a pension scheme, the Retirement Benefits Act clause 45A was amended to provide that if the scheme liquidator shall be unable to trace he member to whom savings in the scheme belong within 2 years, then the savings would become unclaimed assets and become payable to the Unclaimed Assets Authority (UFAA) whose primary mandate is to receive unclaimed financial assets and re-unite the assets with their rightful owners,
- Recovery of Unremitted Contributions - In 2018, the Retirement Benefits Act was amended with additional provisions for the recovery of unremitted contributions by employers. The provisions include paying the contributions and interest accrued to the scheme in full within the period specified in the notice and a penalty of 5.0% of unremitted contributions or Kshs 20,000 whichever is higher, payable to the Authority within seven days of receipt of the notice. The RBA was also given powers to wind up the scheme and facilitate members to join individual schemes where their contributions shall be remitted. We expect the amendment to enhance timely remittance of employer contributions for their employees to avoid penalties and hence avoid extra costs, and,
- Amendments on Scheme’s Transparency: In 2016, the RBA introduced guidelines that necessitated pension schemes to submit to the Authority audited financial statements, a list of the directors and top management, any changes in clientele and any further information as required by RBA by 30th September of every year. Further, the guidelines required pension schemes to communicate any changes in shareholding, directorship or top management to RBA within thirty days of the change. We believe that the move by RBA will ensure checks and balances on the management of pension schemes by the fund managers, custodians and administrators are achieved. Pension schemes will also enhance transparency and efficiency as they will need to have in place audited finances by 30 September of every year.
Legal Notices Published in August 2021
In August 2021, two Legal Notices, No. 163 and No. 165, were issued affecting the Individual Retirement Benefits Scheme and Umbrella Retirement Benefits Scheme regulations. The two key changes were as discussed below:
- Access to Retirement Benefits before Retirement: The RBA recently published a legal notice which has amended the access rule to allow members of Umbrella and Occupational schemes, before retirement age who wish to transfer their accrued retirement benefits to an individual retirement benefits scheme, to access a maximum of 50.0% of the total accrued pension benefits and the investment income that has accrued in respect of those contributions. This is down from the previous regulation where members could access 100.0% of their own contributions plus 50.0% of the employer's portion. We believe that this amendment will go a long way to increase pension adequacy and improve the income replacement ratio for retirees, thereby reducing old age poverty and over-dependence. For the pensions industry, the amendment will lead to a faster growth of assets, and better returns as trustees, through their Fund Managers, will have more room to make long-term investments, and,
- Independence of Trustees/ Service Providers: In the recently published legal notices, the Retirement Benefits Authority has included an additional clause indicating that a trust corporation shall not appoint an administrator, fund manager, custodian or approved issuer who is related to the trust corporation by way of ownership, directorship or employment. Prior to this, the trustees of the scheme was only required to notify the Authority of the details and qualifications of the person administering the scheme. In our view, the amendment will ensure that no conflict of interest will prevail and that trustees work for the benefit of the schemes’ beneficiaries including members without being swayed by the interests of the business.
Section 4: Recommendations
Despite the significant developments in the pensions industry, pension coverage in Kenya is still low with most uncovered population being in the informal and agricultural sector. The low coverage can be attributed to a faster growing informal sector compared to the formal sector, individual schemes still in infancy stage and the fact that it is optional for employers to sponsor a scheme. The industry thus has a greater potential for growth in that the main purpose of pension schemes is extending coverage to majority of the population, protecting members against old age poverty and provision of partial income replacement. Given the continued growth and development in the pensions sector, we expect the trend to continue as the Retirement Benefits Authority continue enacting and amending the necessary laws. Below, we recommend some of the regulatory changes that can further support the growth of the pensions industry:
- Extending the limit on withdrawals to voluntary benefits in the individual schemes: The amendment made by the Retirement Benefits Authority on access to benefits before retirement age only applies to umbrella and occupational pension schemes. As such, members of individual pension schemes are able to withdraw their benefits in the event where the member becomes a member of another scheme or has a need related to personal aptitude for which the trustees have given approval and obtained prior written consent of the Authority. We believe that extending the amendment to the individual schemes will go a long way in ensuring that individuals have enough money at retirement and the pensions industry continues growing as scheme managers have more funds and enough time to make long term investments,
- Issue guidelines on procurement of pension services where new players will be considered: By allowing more players into the industry, the Authority will increase competition among fund managers as this will lead to better returns for pension scheme members and consequently growth of the pensions industry. However, new fund managers find it difficult to get business through private and public tenders due to their lack of experience as a company despite having team members with sufficient experience. As such, the proposed guidelines would require or weight the experience of the key personnel running the fund management business to be viewed the same as the overall company business, thereby increasing the chances of the new fund managers to get business. This would also help with fund managers specializing in specific asset classes that they are good at, and,
- Increased member education: The Retirement Benefits Authority can adopt Initiatives such as media campaigns and strategic collaborations with county governments, professional associations, religious institutions, saccos, as well as welfare associations that are closer to the mass to educate citizens on the importance of saving for retirement. It is also recommended that bureaucracy and other barriers be removed to encourage participation by informal sector workers
- Extend the requirement to include independent trusteeship in the board of schemes similar to the provisions of the companies act: The additional clause on trustee independence applies only to trust corporations. We believe that extending the regulation to individual trustees/ board of trustees will aid in better protection of the scheme members’ funds as the trustees’ actions will entirely be for the benefit of the scheme's beneficiaries, including members, without being influenced by the business's interests.
Section 5: Conclusion
The reforms implemented over the last few years have had a significant impact on governance, benefit security, and investment management concerns particularly in the occupational and umbrella retirement benefit schemes. As such, the amendments provide a firm basis on which to consider a deeper and broader Pension Industry. We therefore believe that through increased member education, schemes can leverage on these new regulations and amendments to the benefit of their members and draw more people into their schemes. Similar actions by the regulator and the continued interaction with the different service providers in the pensions industry will be key to increase the pension coverage in Kenya. Additionally, we expect the RBA to continue enacting and amending the present regulations to accommodate the changes that may come by.
Disclaimer: The views expressed in this publication are those of the writers where particulars are not warranted. This publication, which is in compliance with Section 2 of the Capital Markets Authority Act Cap 485A, is meant for general information only and is not a warranty, representation, advice or solicitation of any nature. Readers are advised in all circumstances to seek the advice of a registered investment advisor.

- Talk to us
- Kenya
- P.O Box 20695 - 00200, Nairobi, Kenya
- Cell +254709101200
- Tel +254709101200
- WhatsApp +254741676635
- United States
- +254709101200
- DOWNLOAD OUR APP
-


- Kenya
- 8th Floor, Pinetree Plaza, Kaburu Drive, Ngong Road, Nairobi, Kenya
- USA
- Suite 1150, 1775 Eye Street NW, USA, Washington DC 20006, USA
- Investments
- High Yield
- Private Equity
- Real Estate
- Real Estate
- RiverRun Estates
- Cytonn Towers
- The Ridge
- Taraji Heights
- The Alma