Residential Sector H1’2021 Markets Review Note
By Cytonn Research, Jul 8, 2021
Ruiru, Syokimau, Redhill and Kitisuru top markets for detached units; and for apartments, the top markets were Waiyaki Way, Parklands and Ruaka.
During H1’2021, the residential sector recorded increased activities supported by; i) governments continued focus on affordable housing through a Kshs 8.2 bn budgetary allocation to the same, ii) accessibility of relatively affordable mortgage finance through Kenya Mortgage Refinance Company (KMRC), and select financial institutions, iii) continued activities in the student housing sector, and, iv) increased transaction volumes among buyers evidenced by general improvement in rents and prices.
In terms of performance, the sector recorded improved performance with average total returns registering a 0.8% points half-yearly increase to 5.5%, from 4.7% recorded in FY’2020. The average y/y price appreciation in the residential market came in at 0.6%, with prices in all segments registering appreciation apart from apartments in satellite towns which recorded a price correction of 0.8%, since more people opted to rent than to buy. The average rental yield registered a 0.2% points q/q increase to 4.8% in H1’2021 from 4.7% recorded in Q1’2021 attributable to economic improvement which saw asking rents record an uptick.
The graph below shows the performance summary of average rental yields in the last five years;
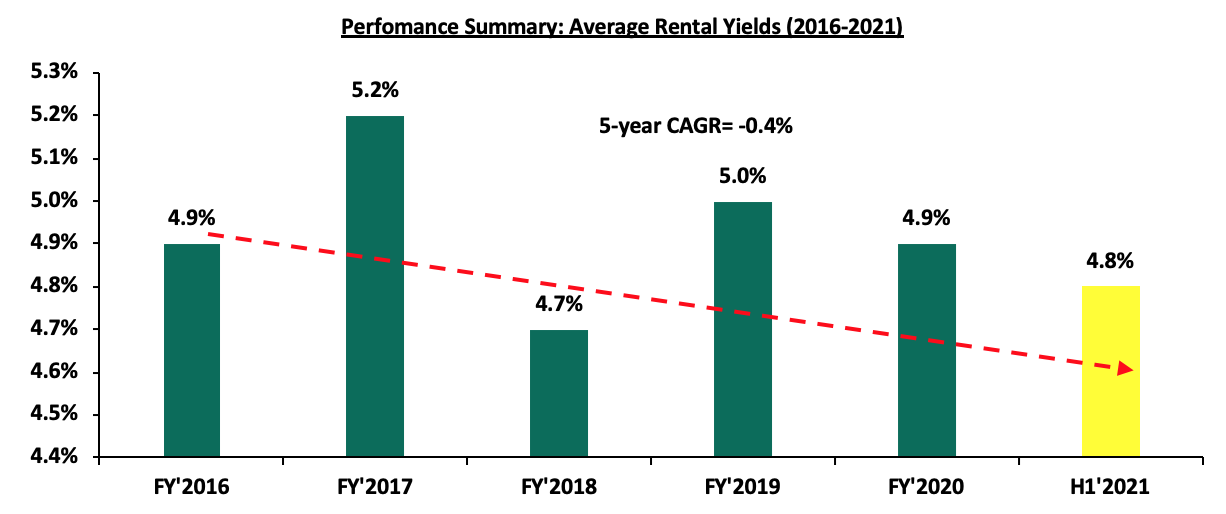
Source: Cytonn Research
- Detached Units Performance
Detached units recorded an improvement in performance in H1’2021 compared to Q1’2021 with average total returns registering a 0.6% points q/q increase to 5.4% in H1’2021 from 4.8% recorded in Q1’2021, and a 1.2% points half-yearly increase from 4.2% recorded in FY’2020. Rental yields for detached units came in at an average of 4.2%, average y/y price appreciation at 1.1%, representing a 0.1% and 0.4% points q/q increase from 4.1% and 0.7% recorded in Q1’2021.The general improved performance of house prices and rents is attributable increased transactional volumes among buyers after holding on to cash following tough uncertain economic times at the onset of the pandemic.
|
Segment |
Average of Rental Yield H1'2021 |
Average of Price Appreciation H1'2021 |
Average Total Returns H1'2021 |
Average of Rental Yield Q1'2021 |
Average of Price Appreciation Q1'2021 |
Average of Total Returns Q1'2021 |
q/q change in Rental Yield ( % Points) |
q/q change in Price Appreciation (% Points) |
q/q change in Total Returns (% Points) |
|
Detached Units |
|||||||||
|
High End |
3.7% |
1.1% |
4.8% |
3.6% |
1.0% |
4.6% |
0.1% |
0.1% |
0.2% |
|
Upper Mid-End |
4.6% |
1.2% |
5.8% |
4.5% |
0.5% |
5.0% |
0.1% |
0.7% |
0.8% |
|
Lower Mid-End |
4.3% |
1.1% |
5.5% |
4.1% |
0.7% |
4.8% |
0.2% |
0.4% |
0.7% |
|
Average |
4.2% |
1.1% |
5.4% |
4.1% |
0.7% |
4.8% |
0.1% |
0.4% |
0.6% |
Source: Cytonn Research 2021
The upper mid-end segment was the best performing segment with an average total return of 5.8% compared to the high-end and lower mid- end segments whose average total returns came in at 4.8% and 5.4%, respectively. Performance of the upper mid-end segment is attributed to the high rental yield of 4.6% and 1.2% y/y price appreciation. Overall, the best performing node was Ruiru with an average total return of 6.6% while Syokimau, Redhill and Kitisuru followed in closely with total returns all averaging at 6.5%. The performance of Ruiru is attributed to the relatively high rental yield of 5.0% compared to the detached market average of 4.2%. Runda recorded the lowest average total returns at 2.1% attributed to a 1.6% price correction.
(All Values in Kshs unless stated otherwise)
|
Detached Units Performance H1’2021 |
||||||||
|
Area |
Average of Price per SQM H1'2021 |
Average of Rent per SQM H1'2021 |
Average of Occupancy H1'2021 |
Average of Uptake H1'2021 |
Average of Annual Uptake H1'2021 |
Average of Rental Yield H1'2021 |
Average of Price Appreciation H1'2021 |
Average Total Returns H1'2021 |
|
High-End |
||||||||
|
Kitisuru |
203,113 |
615 |
92.5% |
90.3% |
15.0% |
3.8% |
2.7% |
6.5% |
|
Rosslyn |
179,040 |
744 |
85.9% |
95.2% |
12.1% |
4.4% |
1.1% |
5.5% |
|
Lower Kabete |
154,600 |
434 |
81.3% |
84.5% |
16.0% |
2.8% |
2.5% |
5.2% |
|
Karen |
190,730 |
730 |
82.8% |
89.3% |
14.4% |
3.8% |
0.8% |
4.5% |
|
Runda |
237,567 |
756 |
90.5% |
94.2% |
10.4% |
3.7% |
(1.6%) |
2.1% |
|
Average |
193,010 |
656 |
86.6% |
90.7% |
13.6% |
3.7% |
1.1% |
4.8% |
|
Upper Mid-End |
||||||||
|
Redhill & Sigona |
97,843 |
446 |
90.9% |
90.9% |
15.4% |
5.2% |
1.3% |
6.5% |
|
Ridgeways |
152,100 |
775 |
84.5% |
86.2% |
13.4% |
5.2% |
1.2% |
6.3% |
|
Runda Mumwe |
152,949 |
635 |
85.2% |
80.1% |
14.1% |
4.3% |
2.0% |
6.3% |
|
Loresho |
148,543 |
673 |
87.8% |
82.0% |
10.7% |
4.8% |
1.5% |
6.3% |
|
South B/C |
127,298 |
537 |
94.4% |
88.7% |
14.0% |
4.8% |
1.2% |
6.0% |
|
Langata |
163,120 |
555 |
85.9% |
92.9% |
10.0% |
3.9% |
0.8% |
4.8% |
|
Lavington |
158,686 |
647 |
86.1% |
82.5% |
12.9% |
4.4% |
0.3% |
4.7% |
|
Average |
142,934 |
610 |
87.8% |
86.2% |
12.9% |
4.6% |
1.2% |
5.8% |
|
Lower Mid-End |
||||||||
|
Ruiru |
79,138 |
332 |
83.9% |
83.5% |
24.9% |
5.0% |
1.6% |
6.6% |
|
Syokimau/Mlolongo |
75,406 |
367 |
75.7% |
85.1% |
16.8% |
4.4% |
2.1% |
6.5% |
|
Juja |
64,500 |
328 |
79.6% |
88.4% |
14.9% |
4.6% |
1.0% |
5.6% |
|
Rongai |
86,541 |
233 |
83.1% |
75.9% |
13.4% |
2.9% |
2.2% |
5.1% |
|
Kitengela |
68,730 |
301 |
92.0% |
88.6% |
15.5% |
4.7% |
0.4% |
5.1% |
|
Ngong |
58,982 |
283 |
84.5% |
86.5% |
12.7% |
5.0% |
(0.2%) |
4.9% |
|
Athi River |
83,321 |
313 |
83.4% |
94.1% |
15.7% |
3.8% |
0.7% |
4.4% |
|
Average |
73,803 |
308 |
83.2% |
86.0% |
16.3% |
4.3% |
1.1% |
5.5% |
Source: Cytonn Research 2021
- Apartments Performance
Performance of apartments recorded improvement with total returns registering a 0.4% points half-yearly increase, coming in at 5.6% in H1’2021 from 5.2% in FY’2020 and a 0.3% points q/q increase from the 5.3% recorded in Q1’2021, with the average price appreciation and rental yield coming in at 0.1% and 5.4%, respectively. Compared to Q1’2021, apartments recorded a 0.2% points q/q increase in rental yields coming in at 5.4% in H1’2021 while price appreciation remained flat at 0.1% in the same period.
|
Segment |
Average of Rental Yield H1'2021 |
Average of Y/Y Price Appreciation H1'2021 |
Total Returns H1'2021 |
Average of Rental Yield Q1'2021 |
Average of Y/Y Price Appreciation Q1'2021 |
Average of Total Returns Q1'2021 |
q/q change in Rental Yields (% Points) |
q/q change in Price Appreciation (% Points) |
q/q change in Total Returns (% Points) |
|
Upper Mid-End |
5.3% |
0.3% |
5.7% |
5.2% |
0.1% |
5.3% |
0.1% |
0.2% |
0.4% |
|
Lower Mid-End |
5.3% |
0.9% |
6.2% |
5.0% |
0.2% |
5.2% |
0.3% |
0.7% |
1.0% |
|
Satellite Towns |
5.6% |
(0.8%) |
4.8% |
5.4% |
0.1% |
5.5% |
0.2% |
(0.9%) |
(0.7%) |
|
Average |
5.4% |
0.1% |
5.6% |
5.2% |
0.1% |
5.3% |
0.2% |
0.0% |
0.2% |
Source: Cytonn Research 2021
Apartments in the lower mid-end suburbs registered the highest average total return at 6.2% compared to upper mid-end and lower mid-end satellite towns with average total returns coming in at 5.7% and 4.8%, respectively. The lower mid-end suburbs performance is attributable to a high demand for rental units hence a relatively high rental yield of 5.3%, and a 0.9% y/y price appreciation compared to apartments market average of 0.1% as investors sought to capitalize on the residential space demand in these areas by the growing middle class. Waiyaki Way was the best performing node, registering the highest returns at 8.1% attributable to continued demand evidenced by the relatively high average rental yield which came in at 5.6% and y/y price appreciation at 2.5%. Parklands and Ruaka followed in second and third positions respectively, with average total returns of 7.6% and 7.5%, respectively. The least performing node was Rongai with an average total return of 2.4% attributed to a price correction of 3.9% following reduced demand from buyers forcing sellers to revise their prices downwards.
(All values in Kshs unless stated otherwise)
|
Apartments Performance H1’2021 |
||||||||
|
Area |
Average of Price Per SQM H1'2021 |
Average of Rent per SQM H1'2021 |
Average of Occupancy H1'2021 |
Average of Uptake H1'2021 |
Average of Annual Uptake H1'2021 |
Average of Rental Yield H1'2021 |
Average of Y/Y Price Appreciation H1'2021 |
Total Returns H1'2021 |
|
Upper Mid-End |
||||||||
|
Parklands |
117,472 |
689 |
84.8% |
83.2% |
14.7% |
5.6% |
2.0% |
7.6% |
|
Westlands |
144,289 |
757 |
80.6% |
77.3% |
17.7% |
4.9% |
2.0% |
6.9% |
|
Kilimani |
103,745 |
577 |
87.6% |
90.0% |
23.0% |
5.9% |
(0.2%) |
5.7% |
|
Upperhill |
139,414 |
883 |
80.3% |
79.0% |
10.1% |
5.3% |
0.4% |
5.7% |
|
Kileleshwa |
121,559 |
646 |
86.4% |
83.9% |
16.3% |
5.4% |
(0.6%) |
4.7% |
|
Loresho |
120,877 |
552 |
89.4% |
85.3% |
10.0% |
4.9% |
(1.6%) |
3.3% |
|
Average |
124,559 |
684 |
84.9% |
83.1% |
15.3% |
5.3% |
0.3% |
5.7% |
|
Lower Mid-End: Suburbs |
||||||||
|
Waiyaki Way |
87,563 |
520 |
78.8% |
77.9% |
21.7% |
5.6% |
2.5% |
8.1% |
|
Dagoretti |
87,565 |
514 |
86.7% |
89.7% |
17.4% |
6.3% |
1.1% |
7.4% |
|
South C |
113,751 |
598 |
86.3% |
64.1% |
14.1% |
5.9% |
1.2% |
7.1% |
|
Kahawa West |
74,871 |
350 |
78.2% |
87.0% |
10.6% |
5.0% |
1.7% |
6.7% |
|
Donholm & Komarock |
80,520 |
399 |
85.2% |
87.8% |
13.3% |
5.3% |
1.1% |
6.4% |
|
South B |
104,973 |
445 |
74.3% |
84.9% |
17.5% |
4.0% |
2.3% |
6.3% |
|
Race Course/Lenana |
102,973 |
622 |
79.3% |
82.3% |
22.0% |
5.8% |
(0.3%) |
5.5% |
|
Imara Daima |
83,040 |
406 |
83.9% |
83.1% |
13.0% |
5.2% |
(0.1%) |
5.0% |
|
Langata |
125,241 |
545 |
88.2% |
82.2% |
14.2% |
4.7% |
(1.3%) |
3.4% |
|
Average |
95,611 |
489 |
82.3% |
82.1% |
16.0% |
5.3% |
0.9% |
6.2% |
|
Lower Mid-End: Satellite Towns |
||||||||
|
Ruaka |
105,633 |
514 |
63.7% |
76.0% |
19.0% |
5.5% |
2.0% |
7.5% |
|
Kikuyu |
80,766 |
529 |
79.6% |
79.4% |
17.6% |
6.4% |
0.3% |
6.7% |
|
Thindigua |
108,551 |
537 |
79.3% |
79.4% |
12.8% |
4.9% |
1.2% |
6.0% |
|
Syokimau |
67,967 |
345 |
79.0% |
77.6% |
12.0% |
5.2% |
(2.2%) |
6.0% |
|
Ngong |
58,015 |
306 |
81.4% |
72.3% |
11.8% |
5.3% |
0.7% |
5.9% |
|
Kitengela |
59,488 |
284 |
90.0% |
82.8% |
10.0% |
5.1% |
(2.8%) |
5.5% |
|
Athi River |
59,145 |
290 |
97.2% |
96.9% |
12.6% |
5.7% |
(1.2%) |
4.5% |
|
Ruiru |
86,904 |
528 |
86.4% |
85.8% |
23.8% |
6.1% |
(1.8%) |
4.3% |
|
Rongai |
68,982 |
363 |
87.3% |
94.2% |
28.6% |
6.3% |
(3.9%) |
2.4% |
|
Average |
77,272 |
411 |
82.7% |
82.7% |
16.5% |
5.6% |
(0.9%) |
4.7% |
Source: Cytonn Research 2021
Our outlook for the residential sector remains NEUTRAL as we expect the sector to record increased activities following focus on affordable housing, efforts by the government to avail relatively cheaper mortgage facilities to encourage home ownership, and anticipated increase in the number of building approvals complemented by the Kshs 30.0 mn Nairobi County e-Development Permit System upgrade expected to be done by June 2022, aiming to offer faster and efficient construction approvals in Nairobi. However, the sector’s performance continues to be weighed down by factors such as i) low mortgage uptake, ii) sluggishness in the delivery of government affordable houses, and, iii) reduced disposable income amongst Kenyans in the midst of tough economic times. Investment opportunity lies for detached units’ lies in Ruiru followed closely by Syokimau, Redhill and Kitisuru and for apartments, the top markets were Waiyaki Way, Parklands and Ruaka which posted highest returns.
For more information, see our Cytonn H1’2021 Markets Review.

- Talk to us
- Kenya
- P.O Box 20695 - 00200, Nairobi, Kenya
- Cell +254709101200
- Tel +254709101200
- WhatsApp +254741676635
- United States
- +254709101200
- DOWNLOAD OUR APP
-


- Kenya
- 8th Floor, Pinetree Plaza, Kaburu Drive, Ngong Road, Nairobi, Kenya
- USA
- Suite 1150, 1775 Eye Street NW, USA, Washington DC 20006, USA
- Investments
- High Yield
- Private Equity
- Real Estate
- Real Estate
- RiverRun Estates
- Cytonn Towers
- The Ridge
- Taraji Heights
- The Alma