Restructuring & Insolvency in Kenya, & Cytonn Weekly #32/2023
By Research Team, Aug 13, 2023
Executive Summary
Fixed Income
During the week, T-bills were oversubscribed for the first time in three weeks, with the overall subscription rate coming in at 199.7%, up from an undersubscription rate of 47.1% recorded the previous week. Investors’ preference for the shorter 91-day paper persisted, with the paper receiving bids worth Kshs 41.8 bn against the offered Kshs 4.0 bn, translating to an oversubscription rate of 1,044.6% higher than the 167.4% recorded the previous week. The subscription rate for the 364-day and 182-day papers increased to 9.0% and 52.5% respectively from 2.6% and 43.5% recorded the previous week. The government accepted a total of Kshs 47.8 bn worth of bids out of Kshs 47.9 bn of bids received, translating to an acceptance rate of 99.7%. The yields on the government papers continued to rise, with the yields on the 364-day, 182-day, and 91-day papers increasing by 23.3 bps, 88.0 bps, and 42.5 bps to 13.3%, 13.4%, and 13.1%, respectively.
Additionally, during the week the Monetary Policy Committee (MPC) met on 9 August, 2023 to review the outcome of its previous policy decisions and recent economic developments, and to decide on the direction of the Central Bank Rate (CBR). The MPC retained the CBR rate at 10.50%, which was in line with our expectations of the MPC to maintain the CBR rate at the current rate;
Equities
During the week, the equities market was on a downward trajectory, with NASI, NSE 20, and NSE 25 declining by 2.0%, 0.01%, and 1.8%, respectively, taking the YTD performance to losses of 18.3%, 4.9%, and 13.7% for NASI, NSE 20, and NSE 25, respectively. The equities market performance was mainly driven by losses recorded by large-cap stocks such as NCBA, Safaricom and EABL of 5.9%, 4.5% and 3.5%, respectively. The losses were, however, mitigated by gains recorded by stocks such as Bamburi of 3.8%;
Also, during the week, Stanbic holdings released their H1’2023 financial results highlighting that core earnings per share grew by 47.0% to Kshs 17.8 from Kshs 12.1 in H1’2022, driven by the 37.8% growth in total operating income to Kshs 20.9 bn from Kshs 15.2 bn in H1’2022;
Real Estate
During the week, president Ruto oversaw the groundbreaking of 110 affordable housing units situated on a 1.5-acre piece of land in Gichugu Constituency, Kirinyaga County. Additionally, president Ruto presided over the groundbreaking ceremony for the construction of ‘Kings Orchid’ affordable housing project located in Thika town, Kiambu County;
In regulated Real Estate funds, under the Real Estate Investment Trusts (REITs) segment, Fahari I-REIT closed the week trading at an average price of Kshs 6.3 per share in the Nairobi Securities Exchange, representing a 2.5% decline from the Kshs 6.5 recorded the previous week. On the Unquoted Securities Platform as at 4 August 2023, Acorn D-REIT and I-REIT closed the week trading at Kshs 23.9 and Kshs 21.6 per unit, a 19.5% and 8.0% gain for the D-REIT and I-REIT, respectively, from the Kshs 20.0 inception price. In addition, Cytonn High Yield Fund (CHYF) closed the week with an annualized yield of 13.6%, remaining relatively unchanged from what was recorded the previous week;
Focus of the Week
Insolvency refers to a financial situation where an individual or business is unable to meet their financial obligations or settle their debts as they become due. In most cases, the state of insolvency occurs due to an increase in business expenses, poor cash management, law suits, poor budgeting, fraud, business expansion, or a reduction in sales. In Kenya, insolvency proceedings are primarily governed by the Insolvency Act of 2015. The act provides for how insolvent companies can be assisted to service creditors obligations and protect the interests of all stakeholders. The options available for such an insolvent company include Administration, Receivership, voluntary arrangements, and liquidation;
Investment Updates:
- Weekly Rates:
- Cytonn Money Market Fund closed the week at a yield of 12.39% p.a To invest, dial *809# or download the Cytonn App from Google Playstore here or from the Appstore here;
- Cytonn High Yield Fund closed the week at a yield of 13.56% p.a. To invest, email us at sales@cytonn.com and to withdraw the interest, dial *809# or download the Cytonn App from Google Playstore here or from the Appstore here;
- We continue to offer Wealth Management Training every Wednesday, from 9:00 am to 11:00 am. The training aims to grow financial literacy among the general public. To register for any of our Wealth Management Trainings, click here;
- If interested in our Private Wealth Management Training for your employees or investment group, please get in touch with us through wmt@cytonn.com;
- Cytonn Insurance Agency acts as an intermediary for those looking to secure their assets and loved ones’ future through insurance namely; Motor, Medical, Life, Property, WIBA, Credit and Fire and Burglary insurance covers. For assistance, get in touch with us through insuranceagency@cytonn.com;
- Cytonn Asset Managers Limited (CAML) continues to offer pension products to meet the needs of both individual clients who want to save for their retirement during their working years and Institutional clients that want to contribute on behalf of their employees to help them build their retirement pot. To more about our pension schemes, kindly get in touch with us through pensions@cytonn.com;
Real Estate Updates:
- For more information on Cytonn’s real estate developments, email us at sales@cytonn.com;
- Phase 3 of The Alma is now ready for occupation and the show house is open daily. To join the waiting list to rent, please email properties@cytonn.com;
- For Third Party Real Estate Consultancy Services, email us at rdo@cytonn.com;
- For recent news about the group, see our news section here;
Hospitality Updates:
- We currently have promotions for Staycations. Visit cysuites.com/offers for details or email us at sales@cysuites.com;
Money Markets, T-Bills Primary Auction:
During the week, T-bills were oversubscribed for the first time in three weeks, with the overall subscription rate coming in at 199.7%, up from an undersubscription rate of 47.1% recorded the previous week. Investors’ preference for the shorter 91-day paper persisted, with the paper receiving bids worth Kshs 41.8 bn against the offered Kshs 4.0 bn, translating to an oversubscription rate of 1,044.6% higher than the 167.4% recorded the previous week. The subscription rate for the 364-day and 182-day papers increased to 9.0% and 52.5% respectively from 2.6% and 43.5% recorded the previous week. The government accepted a total of Kshs 47.8 bn worth of bids out of Kshs 47.9 bn of bids received, translating to an acceptance rate of 99.7%. The yields on the government papers continued to rise, with the yields on the 364-day, 182-day, and 91-day papers increasing by 23.3 bps, 88.0 bps, and 42.5 bps to 13.3%, 13.4%, and 13.1%, respectively.
So far in the current FY’2023/24, government securities totalling Kshs 228.0 bn have been advertised, and bids amounting Kshs 280.1 bn have been received, comprising Kshs 183.9 bn in treasury bills and Kshs 96.2 bn in bonds, respectively. The government has accepted bids worth Kshs 257.7 bn, of which 175.7 bn and 82.0 bn were treasury bills and bonds, respectively. Total redemptions so far in FY’2023/24 equal to Kshs 225.3 bn, with treasury bills accounting for all redemptions. As a result, the government has a domestic borrowing surplus of Kshs 32.4 billion in FY’2023/24.
The chart below compares the overall average T- bills subscription rates obtained in 2017, 2022 and 2023 Year to Date (YTD):
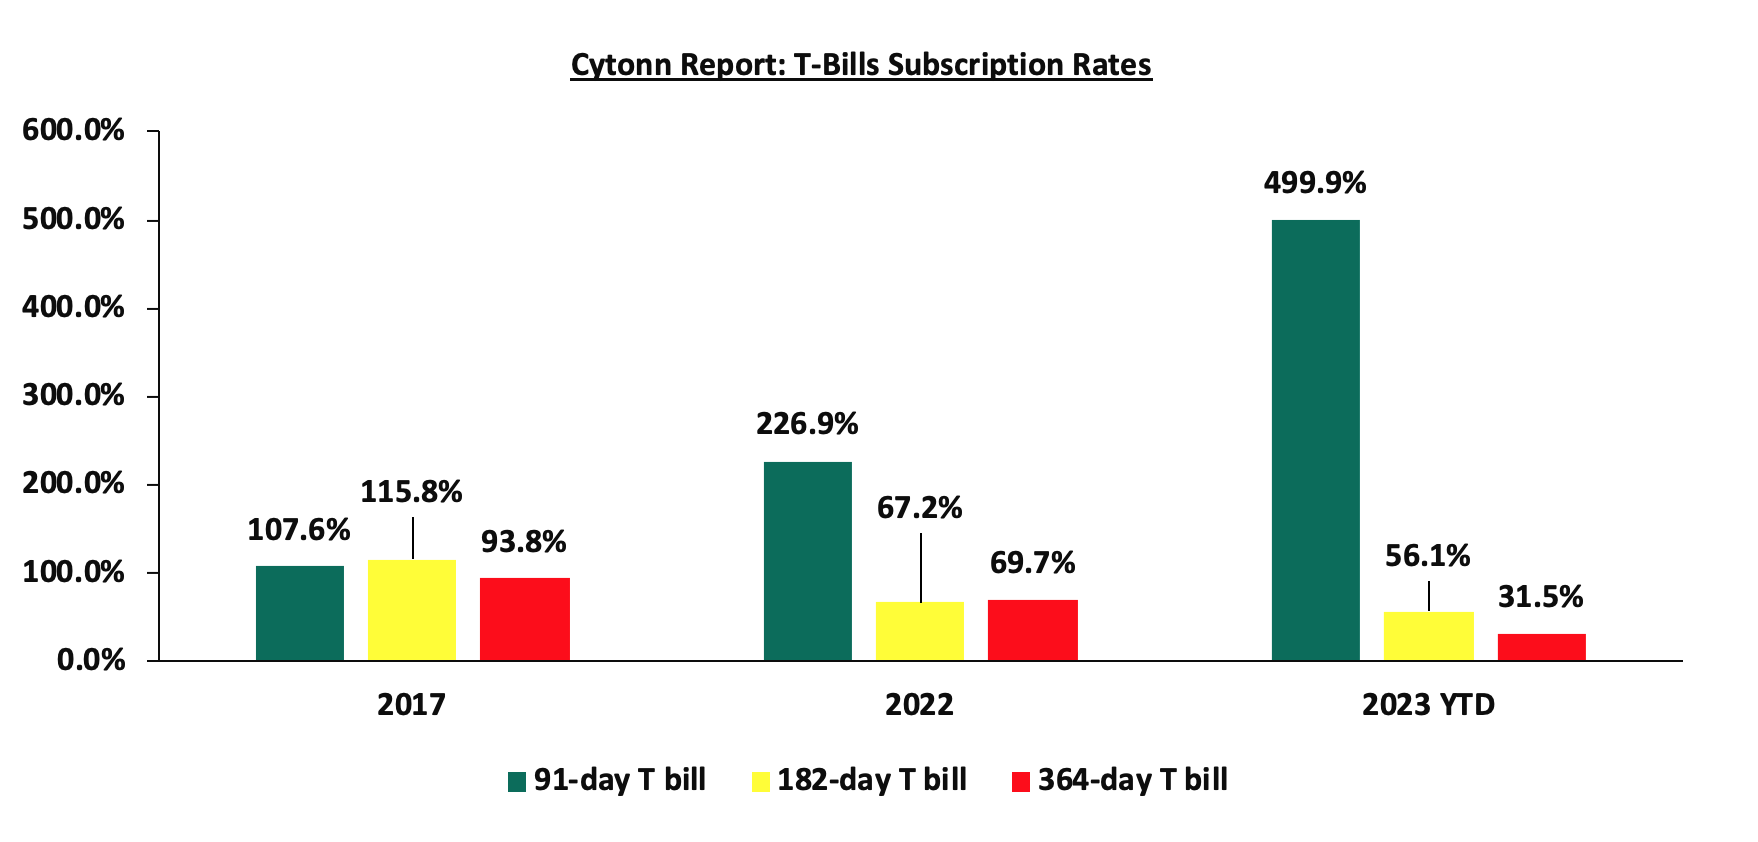
Source: Central Bank of Kenya (CBK)
Money Market Performance:
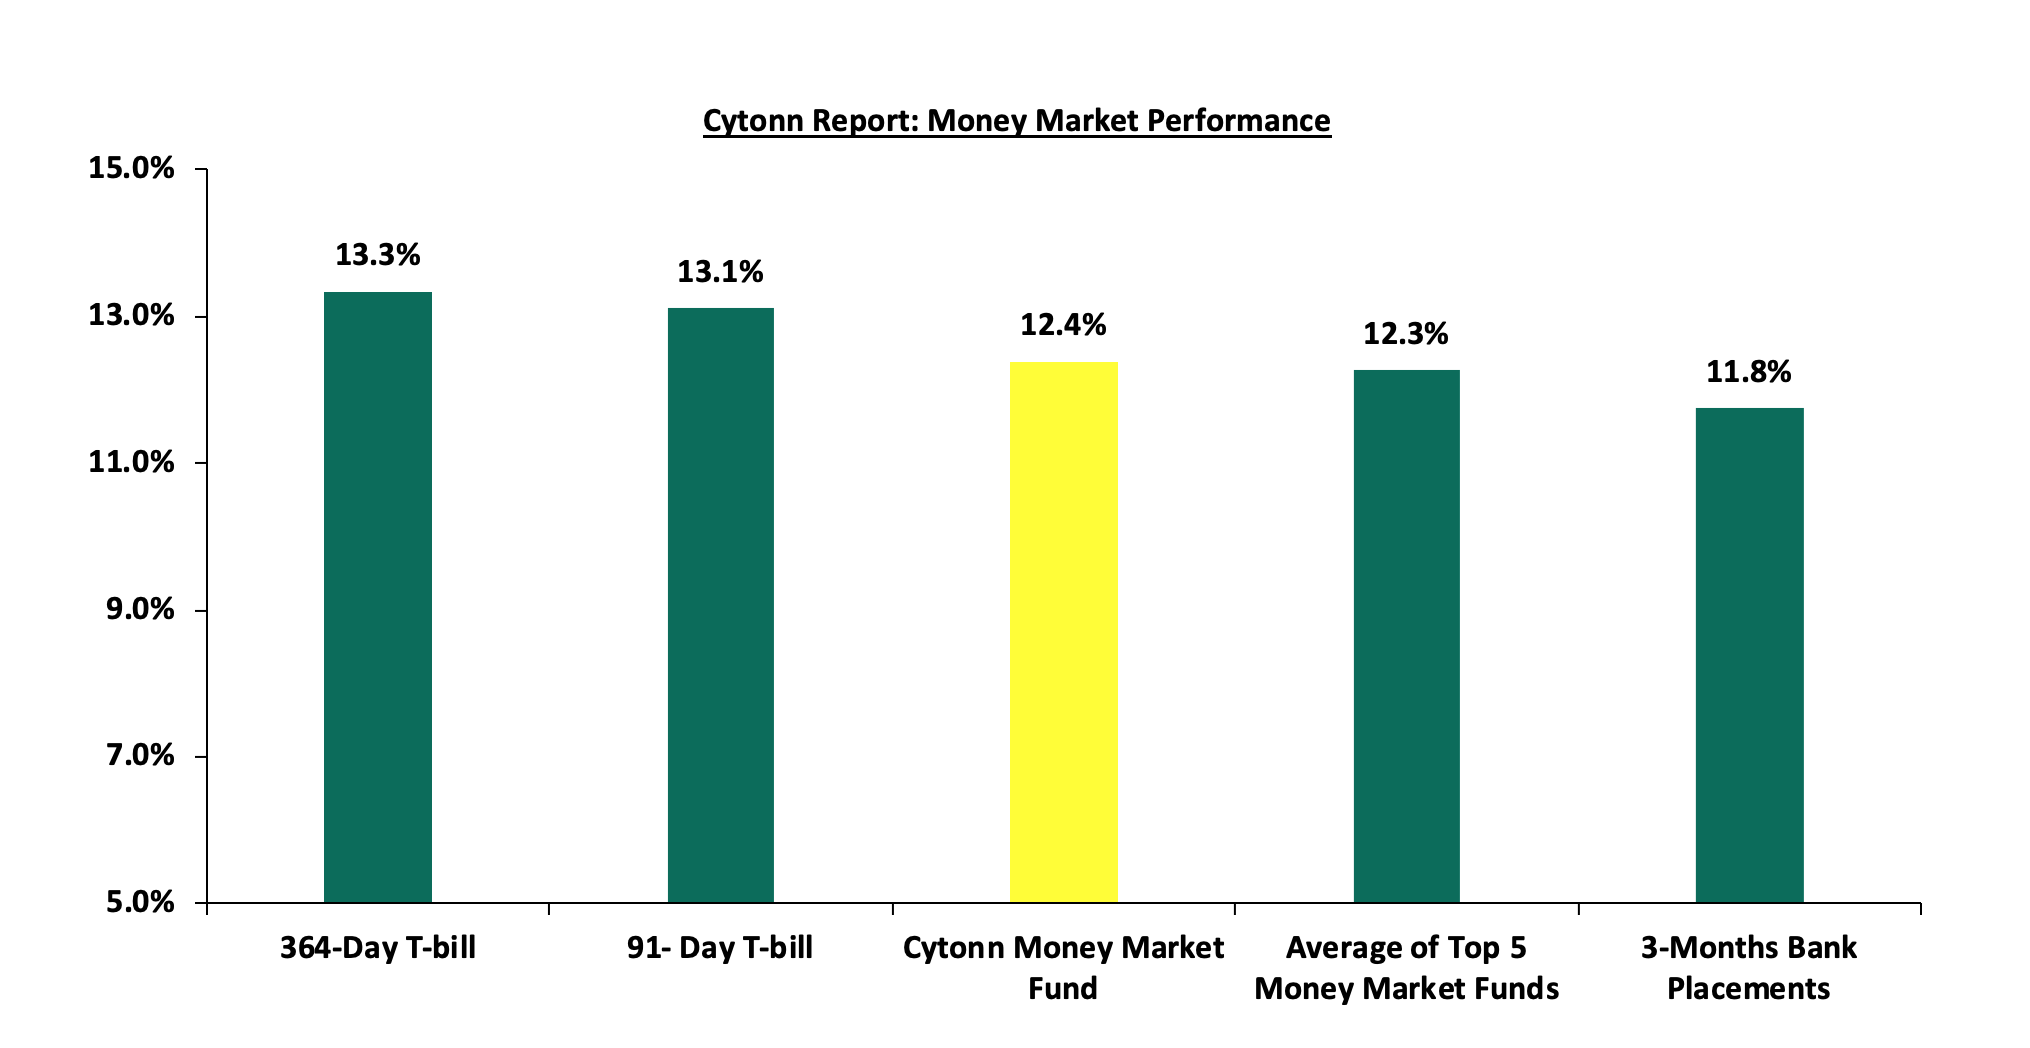
In the money markets, 3-month bank placements ended the week at 11.8% (based on what we have been offered by various banks), while the yields on the 364-day and 91-day T-bills increased by 23.3 bps and 42.5 bps to 13.3% and 13.1%, respectively. The yield of Cytonn Money Market Fund increased by 2.0 bps, remaining relatively unchanged at 12.4%, while the average yields on the Top 5 Money Market Funds increased by 19.4 bps to 12.3% from 12.1% recorded the previous week.
The table below shows the Money Market Fund Yields for Kenyan Fund Managers as published on 11th August 2023:
|
Money Market Fund Yield for Fund Managers as published on 11th August 2023 |
||
|
Rank |
Fund Manager |
Effective Annual |
|
1 |
Etica Money Market Fund |
12.4% |
|
2 |
Cytonn Money Market Fund (dial *809# or download Cytonn App) |
12.4% |
|
3 |
Lofty-Corban Money Market Fund |
12.4% |
|
4 |
GenAfrica Money Market Fund |
12.2% |
|
5 |
ICEA Lion Money Market Fund |
11.9% |
|
6 |
Madison Money Market Fund |
11.8% |
|
7 |
Enwealth Money Market Fund |
11.8% |
|
8 |
Jubilee Money Market Fund |
11.8% |
|
9 |
Kuza Money Market fund |
11.4% |
|
10 |
Sanlam Money Market Fund |
11.3% |
|
11 |
Old Mutual Money Market Fund |
11.2% |
|
12 |
AA Kenya Shillings Fund |
11.0% |
|
13 |
Co-op Money Market Fund |
10.9% |
|
14 |
Apollo Money Market Fund |
10.8% |
|
15 |
Nabo Africa Money Market Fund |
10.6% |
|
16 |
KCB Money Market Fund |
10.6% |
|
17 |
Dry Associates Money Market Fund |
10.6% |
|
18 |
NCBA Money Market Fund |
10.6% |
|
19 |
GenCap Hela Imara Money Market Fund |
10.3% |
|
20 |
CIC Money Market Fund |
10.2% |
|
21 |
Absa Shilling Money Market Fund |
10.2% |
|
22 |
Orient Kasha Money Market Fund |
9.8% |
|
23 |
British-American Money Market Fund |
9.6% |
|
24 |
Mali Money Market Fund |
9.3% |
|
25 |
Equity Money Market Fund |
8.5% |
Liquidity
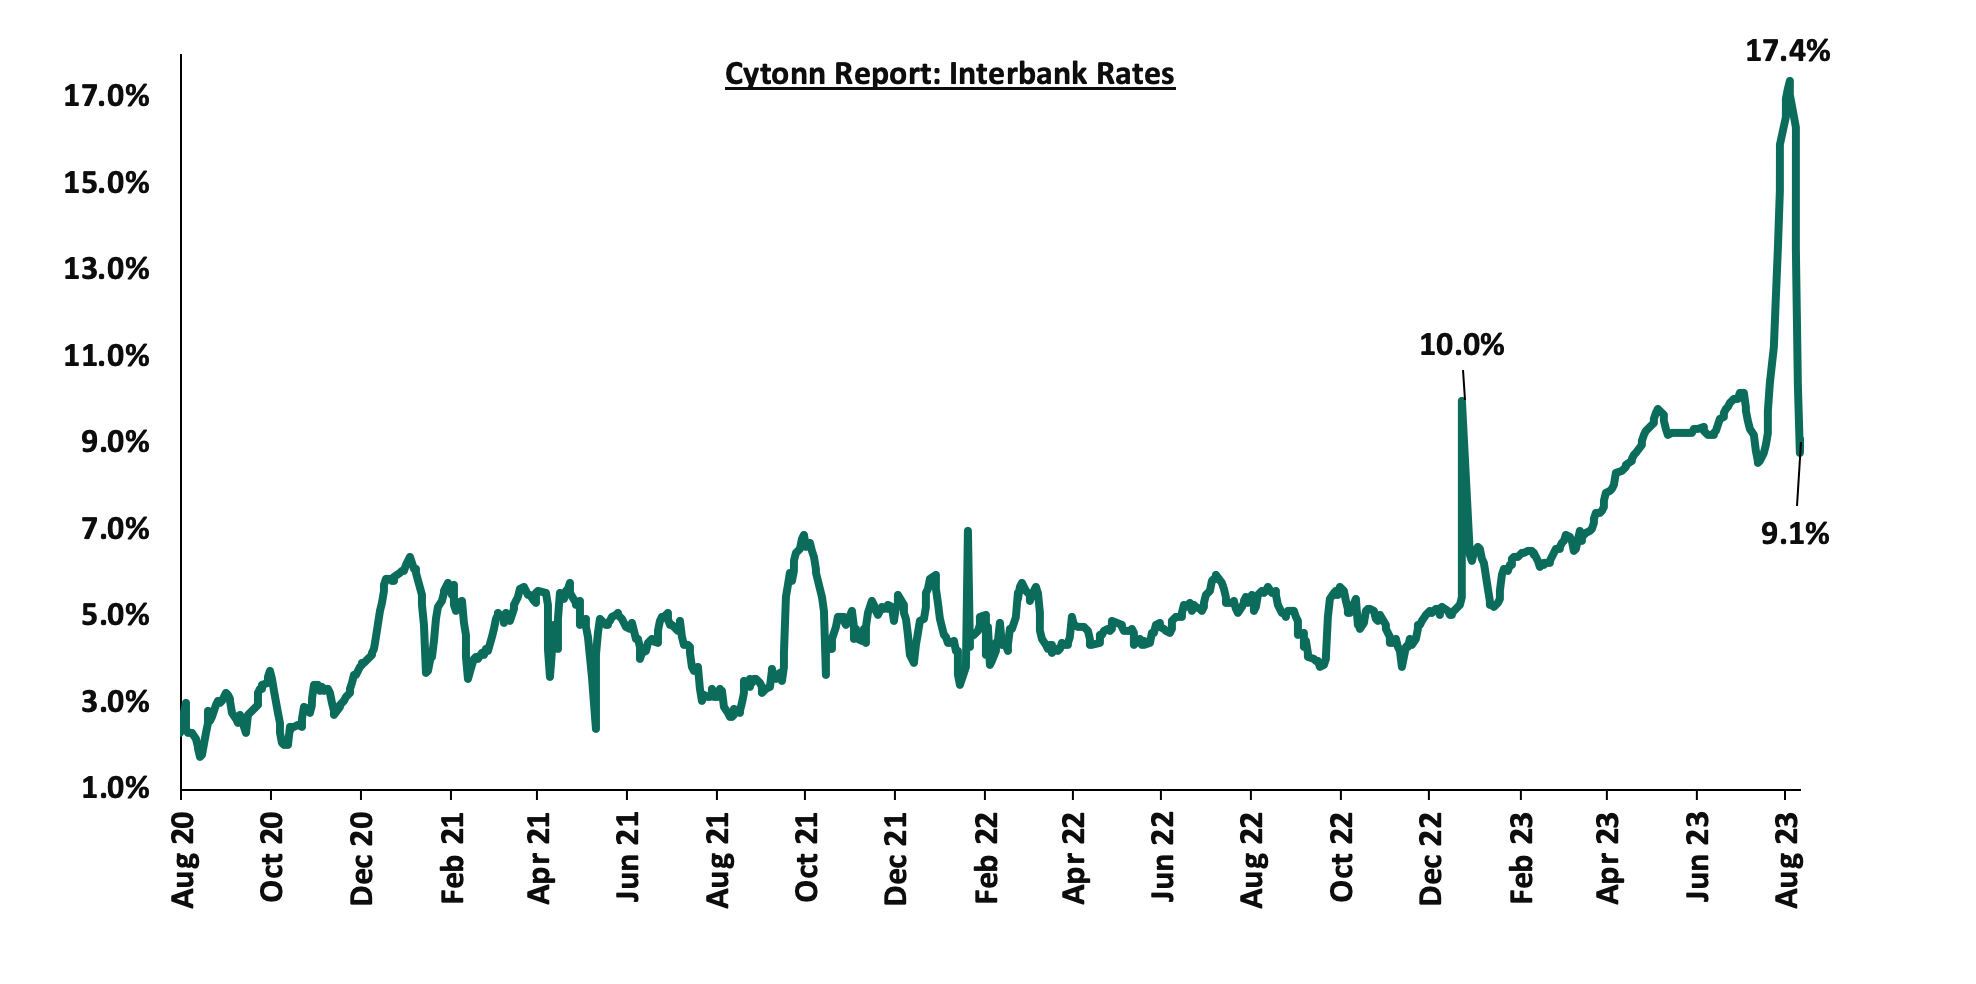
During the week, liquidity in the money markets increased, with the average interbank rate decreasing to 11.6% from 17.0% recorded the previous week, partly attributable to increased government payments that offset tax remittances. Additionally, the decrease in the interbank rate is also attributable to the intervention of the Central Bank of Kenya to introduce an interbank interest rate corridor around the Central Bank Rate (CBR), set at CBR +/- 2.5%. As such, the monetary operations will be aimed at ensuring the interbank rate closely tracks the CBR. The average interbank volumes traded decreased by 21.5% to Kshs 21.0 bn from Kshs 26.7 bn recorded the previous week. The chart below shows the interbank rates in the market over the years:
Kenya Eurobonds:
During the week, the yields on Eurobonds were on a downward trajectory, with the yield on the 7-year Eurobond issued in 2019 recording the largest decline, having decreased by 0.5% points to 11.3%, from 11.8%, recorded the previous week. The table below shows the summary of the performance of the Kenyan Eurobonds as of 10th Aug 2023;
|
Cytonn Report: Kenya Eurobonds Performance |
||||||
|
|
2014 |
2018 |
2019 |
2021 |
||
|
Date |
10-year issue |
10-year issue |
30-year issue |
7-year issue |
12-year issue |
12-year issue |
|
Amount Issued (USD) |
2.0 bn |
1.0 bn |
1.0 bn |
0.9 bn |
1.2 bn |
1.0 bn |
|
Years to Maturity |
0.9 |
4.6 |
24.6 |
3.8 |
8.8 |
10.9 |
|
Yields at Issue |
6.6% |
7.3% |
8.3% |
7.0% |
7.9% |
6.2% |
|
2-Jan-23 |
12.9% |
10.5% |
10.9% |
10.9% |
10.8% |
9.9% |
|
1-Aug-23 |
12.5% |
10.8% |
10.8% |
11.3% |
10.8% |
10.3% |
|
3-Aug-23 |
13.5% |
11.3% |
11.1% |
11.8% |
11.2% |
10.7% |
|
4-Aug-23 |
13.5% |
11.2% |
11.0% |
11.6% |
11.1% |
10.6% |
|
7-Aug-23 |
13.2% |
11.2% |
11.0% |
11.5% |
11.0% |
10.6% |
|
8-Aug-23 |
13.3% |
11.2% |
11.0% |
11.5% |
11.1% |
10.6% |
|
9-Aug-23 |
13.3% |
11.2% |
11.0% |
11.4% |
11.0% |
10.6% |
|
10-Aug-23 |
13.2% |
11.0% |
10.9% |
11.3% |
11.0% |
10.5% |
|
Weekly Change |
(0.3%) |
(0.3%) |
(0.2%) |
(0.5%) |
(0.2%) |
(0.2%) |
|
MTD Change |
0.7% |
0.2% |
0.1% |
(0.0%) |
0.2% |
0.2% |
|
YTD Change |
0.3% |
0.5% |
0.0% |
0.4% |
0.2% |
0.6% |
Source: Source: Central Bank of Kenya (CBK) and National Treasury
Kenya Shilling:
During the week, the Kenya Shilling depreciated by 0.4% against the US dollar to close the week at Kshs 143.6 from Kshs 142.9 recorded the previous week. On a year to date basis, the shilling has depreciated by 16.3% against the dollar, adding to the 9.0% depreciation recorded in 2022. We expect the shilling to remain under pressure in 2023 as a result of:
- An ever-present current account deficit, which came at 2.3% of GDP in Q1’2023 from 4.2% recorded in a similar period last year, and,
- The need for government debt servicing, continues to put pressure on forex reserves given that 66.8% of Kenya’s external debt is US Dollar denominated as of April 2023, and,
The shilling is however expected to be supported by:
- Diaspora remittances standing at a cumulative USD 2,033.8 mn in 2023 as of June 2023, albeit 0.5% lower than the USD 2,044.6 mn recorded over the same period in 2022, and,
- The tourism inflow receipts which came in at Kshs 268.1 bn in 2022, a significant 82.9% increase from Kshs 146.5 bn inflow receipts recorded in 2021.
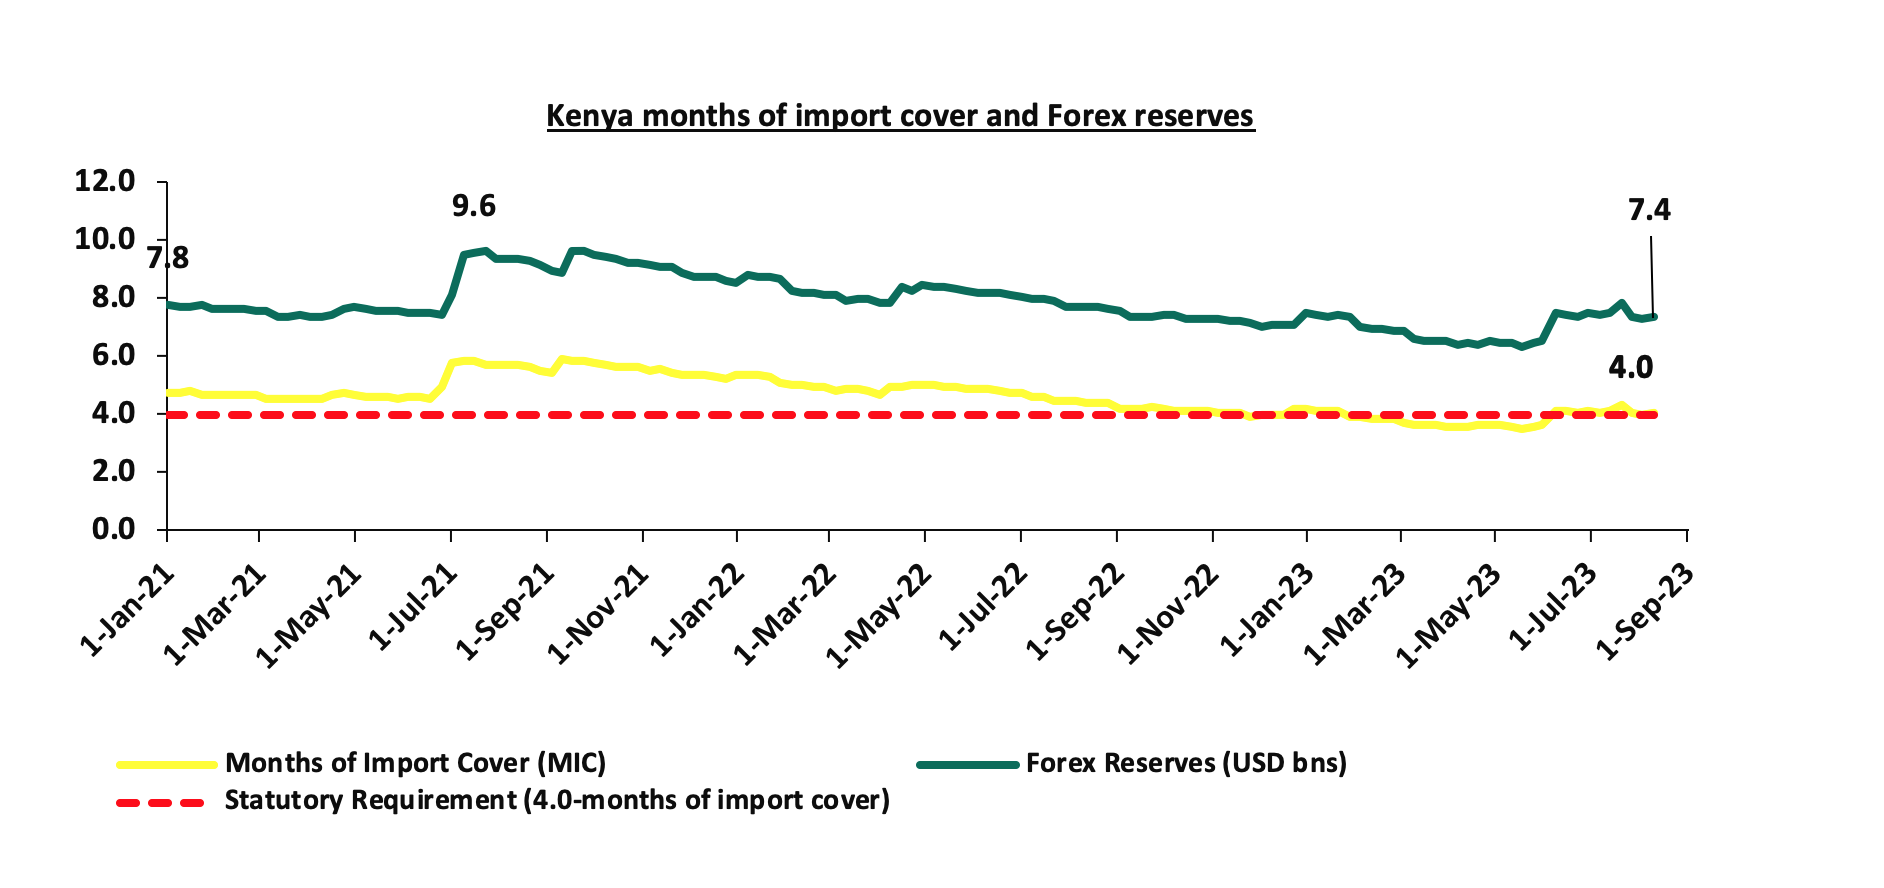
- Adequate forex reserves currently at USD 7.4 bn (equivalent to 4.0-months of import cover), which is within the statutory requirement of maintaining at least 4.0-months of import cover.
The chart below summarizes the evolution of Kenya months of import cover over the years:
Weekly Highlights
- Monetary Policy Committee Highlight.
The monetary policy committee met on August 9, 2023 to review the outcome of its previous policy decisions amidst a backdrop of continued global uncertainties, high inflationary pressures, a weak global growth outlook as well as measures taken by other economies around the world in response to these developments. The MPC retained the CBR rate at 10.50%, which was in line with our expectations of the MPC to maintain the CBR rate at the current rate. Below are some of the key highlights from the meeting:
- The overall inflation eased to 7.3% in July 2023 from 7.9% in June, marking the first time in 14 months that the inflation has fallen within the CBK target range of 2.5%-7.5%. The overall easing in inflation was driven by lower food and non-food non-fuel inflation. The food inflation eased to 8.6% in July 2023 from 10.3% in June 2023, attributable to lower prices of vegetables as a result of the long rains, and improved supply of select non-vegetable food items. On the other hand, fuel inflation remained elevated at 14.5% in July from 12.9% in June, largely attributable to increased electricity prices and implementation of the 16.0% VAT on petroleum products. Fuel inflation was however moderated by lower prices of cooking gas following the removal of VAT on liquefied petroleum gas (LPG). The MPC expect the overall inflation to ease further in the short-term, due to the lower food prices and improving supply of key food items particularly maize,
- The recently released GDP data for the first quarter of 2023 showed continued strong performance of the Kenyan economy, with real GDP growing by 5.3%. This was attributable to a strong rebound in the agriculture sector due to favourable weather conditions and resilient performance of the services sector. Leading indicators of economic activity pointed to continued strong performance in the second quarter of 2023. Despite the global uncertainties, the economy is expected to continue to strengthen in 2023, supported by resilient services sector, the rebound in agriculture, and implementation of measures to boost economic activity in priority sectors by the Government,
- Goods exports have remained resilient, growing by 2.1% in the 12 months to June 2023 compared to 11.2% in a similar period in 2022. Receipts from tea and manufactured exports increased by 7.0% and 23.0%, respectively, attributable to increased demand from traditional markets. Additionally, Imports declined by 6.1% in the 12 months to June 2023 compared to 20.2% in a similar period in 2022. The slowed growth of imports is partly attributable to drop of imports of infrastructure related equipment, mainly on the back of completed projects as well as manufactured goods. Oil prices have continued to ease since the fourth quarter of 2022. Receipts from services exports increased reflecting improvement in international travel and transport. Remittances totalled USD 4,017.0 mn in the 12 months to June 2023, 0.1% higher than USD 4,012.0 mn recorded in the same period in 2022. The current account deficit is estimated at 4.2% of the GDP in the 12 months to June 2023 and is projected to improve to 4.8% of GDP in 2023 from the 5.1% of GDP in 2022,
- The CBK foreign exchange reserves, which currently stand at USD 7,338.0 mn representing a 4.0 months of import cover, continues to provide adequate cover and a buffer against any short-term shocks in the foreign exchange market,
- The banking sector remains stable and resilient, with strong liquidity and capital adequacy ratios. The ratio of gross non-performing loans (NPLs) to gross loans stood at 14.5% in June 2023 compared to 14.9% in May 2023. Decreases in NPLs were noted in the transport and communication, agriculture, manufacturing, and personal and household sectors. However, banks have continued to make adequate provisions for the NPLs,
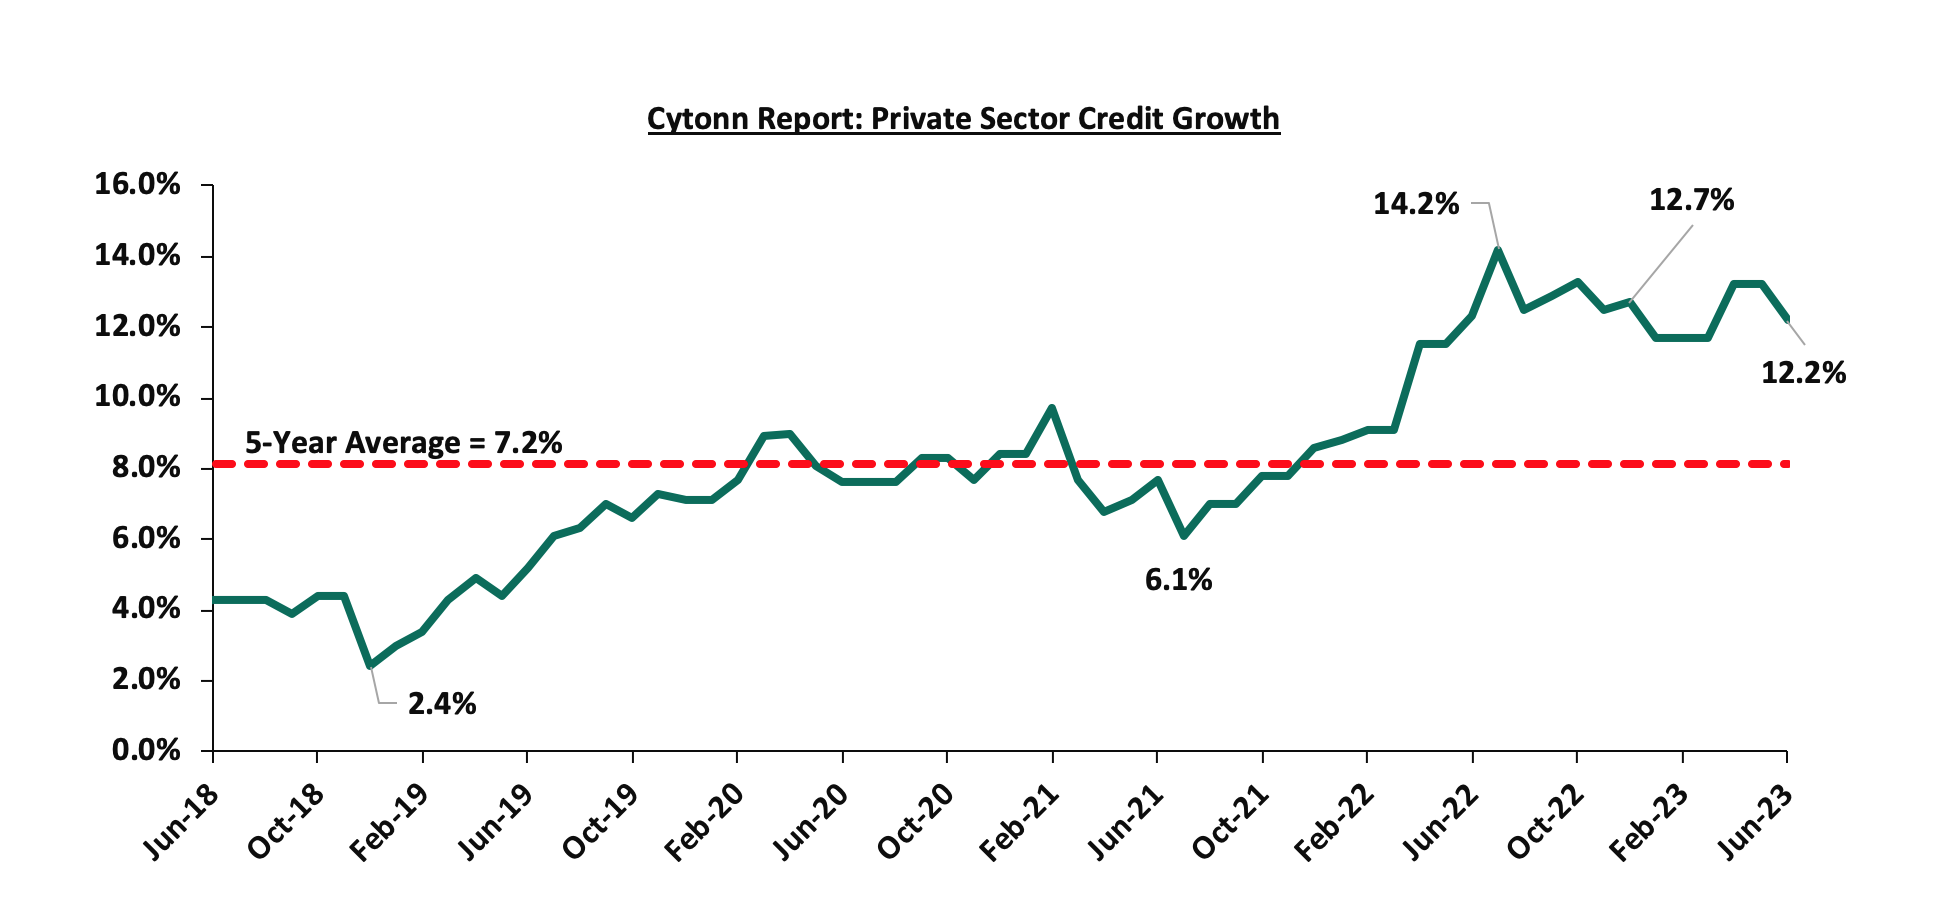
- Growth in private sector credit declined to 12.2% in June 2023 from 13.2% in May 2023. Strong credit growth was observed in sectors such as; transport and communication, manufacturing, trade, and consumer durables of 19.9%, 18.0%, 12.5% and 11.8% respectively. Additionally, the number of loan applications and approvals remained strong, reflecting resilience in economic activities. The chart below shows the movement of the private sector credit growth of the last five years:
- The Committee noted the outcome of the FY’2022/23 Government Budget operations, which resulted in a lower budget deficit of 5.3% of GDP in FY’2022/23 from 6.2% of GDP in FY’2021/22. Additionally, the MPC noted the ongoing implementation of the FY’2023/24 Government Budget, which continues to reinforce fiscal consolidation. The MPC welcomed the efforts by the National Treasury to source new external financing for the budget, noting that, as a result of the identified new external financing, the projected net domestic borrowing by the Government had been reduced to Kshs 316.0 bn from Kshs 586.5 bn, which is consistent with the government’s economic programme. The MPC observed that the revised borrowing requirements should exert downward pressure on domestic interest rates, while the additional external financing will bolster the foreign reserves of the CBK.
- The MPC also considered and approved a new monetary policy implementation framework designed to enhance monetary policy transmission. This new framework is based on inflation targeting and introduces an interest rate corridor around the Central Bank Rate (CBR) set at ± 250.0 bps. Henceforth, the monetary policy operations will be aimed at ensuring the interbank rate, as an operating target, closely tracks the CBR. In addition, to improve access to the Discount Window, the Committee agreed to reduce the applicable interest rate to 400.0 bps above the CBR from the current 600.0 bps above CBR.
The committee noted that, the impact of its move to tighten the monetary policy in June 2023 to anchor inflationary expectations was still transmitting in the economy and therefore it concluded that the current stance on monetary policy was appropriate and decided to retain the central Bank Rate at 10.50%. Additionally, the committee noted that inflation was already within the target range and was expected to decline further as food inflation is expected to come down. The Committee will closely monitor the impact of the policy measures, as well as developments in the global and domestic economy, and stands ready to take further action as necessary. The Committee will meet again in October 2023.
Rates in the Fixed Income market have been on an upward trend given the continued high demand for cash by the government and the occasional liquidity tightness in the money market. The government is 54.3% behind its prorated net domestic borrowing target of Kshs 70.9 bn, having a net borrowing position of Kshs 32.4 bn of the domestic net borrowing target of Kshs 586.5 bn for the FY’2023/2024. Therefore, we expect a continued upward readjustment of the yield curve in the short and medium term, with the government looking to bridge the fiscal deficit through the domestic market. Owing to this, our view is that investors should be biased towards short-term fixed-income securities to reduce duration risk.
Market Performance:
During the week, the equities market was on a downward trajectory, with NASI, NSE 20, and NSE 25 declining by 2.0%, 0.01%, and 1.8%, respectively, taking the YTD performance to losses of 18.3%, 4.9%, and 13.7% for NASI, NSE 20, and NSE 25, respectively. The equities market performance was mainly driven by losses recorded by large-cap stocks such as NCBA, Safaricom and EABL of 5.9%, 4.5% and 3.5%, respectively. The losses were, however, mitigated by gains recorded by stocks such as Bamburi of 3.8%.
During the week, equities turnover increased by 195.8% to USD 8.7 mn from USD 2.9 mn recorded the previous week, taking the YTD total turnover to USD 518.2 mn. Foreign investors remained net buyers for the second consecutive week with a net buying position of USD 4.8 mn, from a net buying position of USD 0.1 mn recorded the previous week, taking the YTD net selling position to USD 272.4 mn.
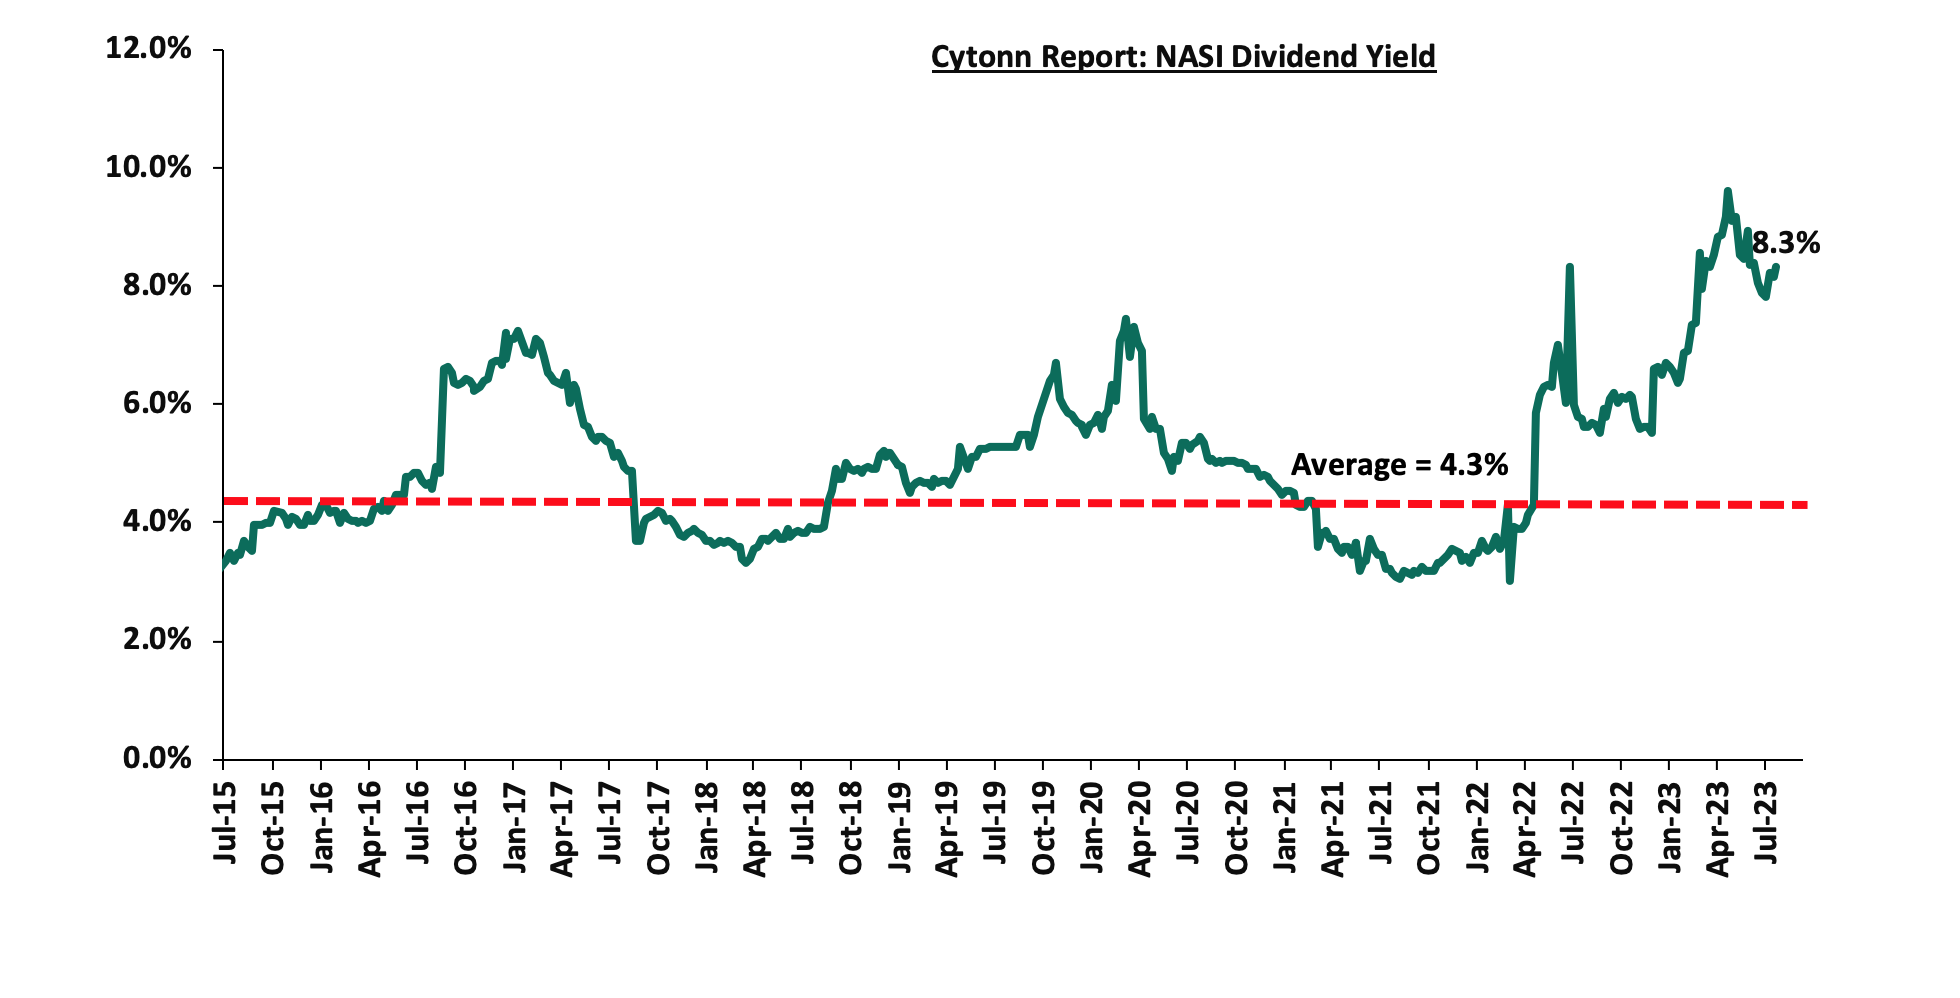
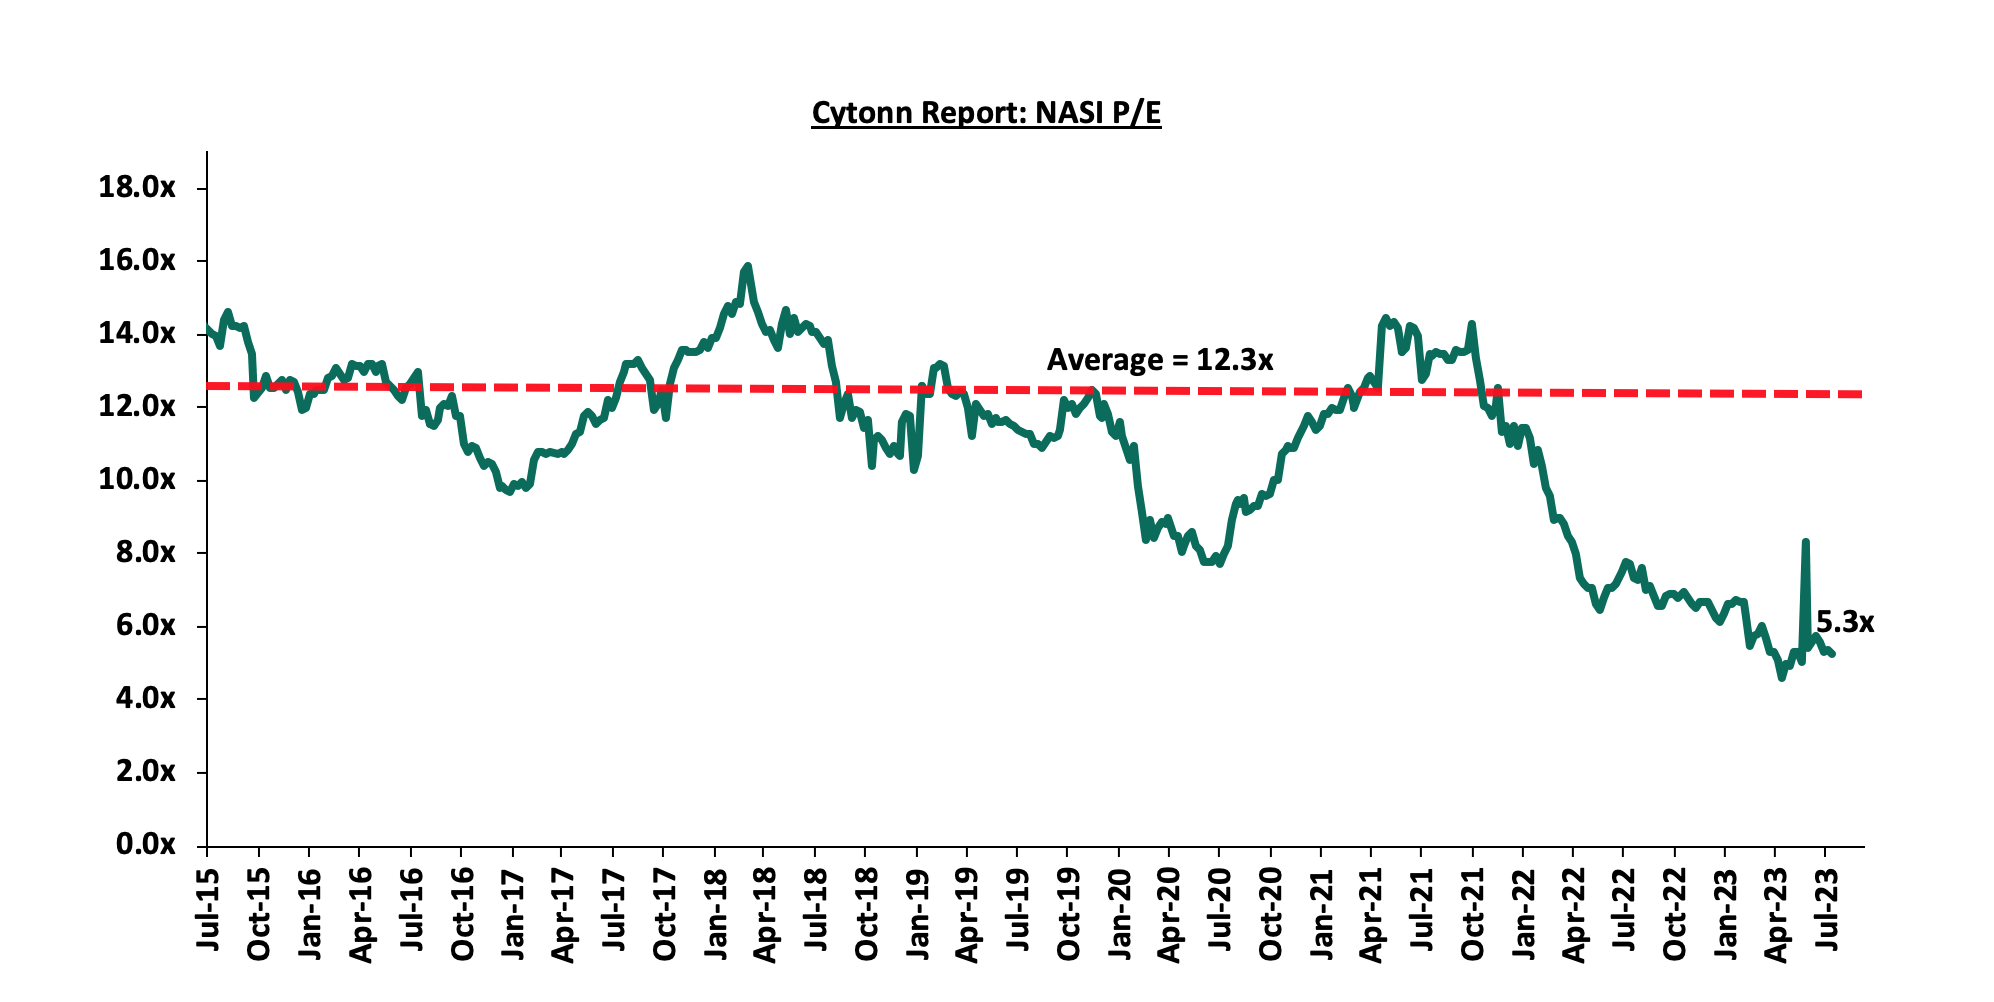
The market is currently trading at a price to earnings ratio (P/E) of 5.3x, 57.2% below the historical average of 12.3x. The dividend yield stands at 8.3%, 4.0% points above the historical average of 4.3%. Key to note, NASI’s PEG ratio currently stands at 0.7x, an indication that the market is undervalued relative to its future growth. A PEG ratio greater than 1.0x indicates the market is overvalued while a PEG ratio less than 1.0x indicates that the market is undervalued. The charts below indicate the historical P/E and dividend yields of the market;
Weekly Highlight
- Earnings Release
Stanbic Holdings H1’2023 Financial Performance
During the week, Stanbic Holdings released their H1’2023 financial results. Below is a summary of the performance:
|
Amounts in (Kshs bn) |
|
|
|
|
Balance Sheet |
H1’2022 |
H1’2023 |
y/y change |
|
Net Loans and Advances |
244.0 |
281.4 |
15.3% |
|
Government Securities |
49.0 |
54.0 |
10.1% |
|
Total Assets |
341.6 |
384.3 |
12.5% |
|
Customer Deposits |
258.2 |
285.4 |
10.5% |
|
Deposits Per Branch |
9.9 |
9.5 |
(4.2%) |
|
Total Liabilities |
283.4 |
320.3 |
13.0% |
|
Shareholders’ Funds |
58.2 |
64.0 |
9.9% |
|
Key Ratios |
H1’2022 |
H1’2023 |
% point change |
|
Loan to Deposit ratio |
94.5% |
98.6% |
4.1% |
|
Return on average equity |
15.2% |
18.5% |
3.3% |
|
Return on average assets |
2.7% |
3.1% |
0.4% |
|
Amounts in (Kshs bn) |
|
|
|
|
Income Statement |
H1’2022 |
H1’2023 |
y/y change |
|
Net interest Income |
8.3 |
12.1 |
44.4% |
|
Net non-interest income |
6.9 |
8.9 |
29.7% |
|
Total Operating income |
15.2 |
20.9 |
37.8% |
|
Loan loss provision |
(1.3) |
(2.5) |
98.0% |
|
Total Operating expenses |
(7.3) |
(11.2) |
52.9% |
|
Profit before tax |
6.6 |
9.7 |
47.3% |
|
Profit after tax |
4.8 |
7.1 |
47.0% |
|
Core EPS |
12.1 |
17.8 |
47.0% |
|
Income Statement Ratios |
H1’2022 |
H1’2023 |
% point change |
|
Yield from interest-earning assets |
3.8% |
5.1% |
1.3% |
|
Cost of funding |
2.3% |
3.1% |
0.8% |
|
Net Interest Margin |
5.4% |
7.1% |
1.7% |
|
Net Interest Income as % of operating income |
54.9% |
57.5% |
2.6% |
|
Non-Funded Income as a % of operating income |
45.1% |
42.5% |
(2.6%) |
|
Cost to Income Ratio |
48.2% |
53.5% |
5.3% |
|
CIR without LLP |
40.0% |
41.6% |
1.7% |
|
Cost to Assets |
1.8% |
2.3% |
0.5% |
|
Capital Adequacy Ratios |
H1’2022 |
H1’2023 |
% points change |
|
Core Capital/Total Liabilities |
18.1% |
17.5% |
(0.6%) |
|
Minimum Statutory ratio |
8.0% |
8.0% |
|
|
Excess |
10.1% |
9.5% |
(0.6%) |
|
Core Capital/Total Risk Weighted Assets |
14.0% |
13.9% |
(0.1%) |
|
Minimum Statutory ratio |
10.5% |
10.5% |
|
|
Excess |
3.5% |
3.4% |
(0.1%) |
|
Total Capital/Total Risk Weighted Assets |
16.2% |
17.4% |
1.2% |
|
Minimum Statutory ratio |
14.5% |
14.5% |
|
|
Excess |
1.7% |
2.9% |
1.2% |
|
Liquidity Ratio |
35.9% |
35.8% |
(0.1%) |
|
Minimum Statutory ratio |
20.0% |
20.0% |
|
|
Excess |
15.9% |
15.8% |
(0.1%) |
Key Take Outs
- Strong earnings growth – Core earnings per share grew by 47.0% to Kshs 17.8, from Kshs 12.1 in H1’2022, driven by the 37.8% growth in total operating income to Kshs 20.9 bn, from Kshs 15.2 bn in H1’2022. However, the performance was weighed down by a 52.9% growth in total operating expenses to Kshs 11.2 bn from Kshs 7.3 bn in H1’2022. The 37.8% growth in total operating income was mainly driven by a 44.4% growth in Net Interest Income to Kshs 12.1 bn from Kshs 8.3 bn in H1’2022, coupled with a 29.7% growth in Non-Interest Income (NII) to Kshs 8.9 bn, from Kshs 6.9 bn in H1’2022,
- Improved asset quality – The bank’s Asset Quality improved, with Gross NPL ratio decreasing to 8.1% in H1’2023 from 9.4% in H1’2022, attributable to 1.2% decrease in Gross non-performing loans to Kshs 23.8 bn, from Kshs 24.1 bn in H1’2022, compared to the 14.6% increase in gross loans to Kshs 295.1 bn, from Kshs 257.5 bn recorded in H1’2022
- Dividends: The directors of Stanbic Holdings declared an interim dividend of Kshs 1.15 per share, with the book closure date set for September 4, 2023.
For a more detailed analysis, please see the Stanbic Bank H1’2023 Earnings Note
Asset Quality
The table below is a summary of the listed banks that have released their H1’2023 results:
|
|
H1’2023 NPL Ratio* |
H1’2022 NPL Ratio** |
% point change in NPL Ratio |
H1’2023 NPL Coverage* |
H1’2022 NPL Coverage** |
% point change in NPL Coverage |
|
Stanbic Bank |
8.1% |
9.4% |
(1.3%) |
57.4% |
56.0% |
1.4% |
|
Mkt Weighted Average |
8.1% |
13.0% |
(4.9%) |
57.4% |
62.3% |
(4.9%) |
|
*Market cap weighted as at 11/08/2023 |
||||||
|
**Market cap weighted as at 09/09/2022 |
||||||
Key take-outs from the table include;
- Asset quality for the listed banks that have released improved during the H1’2023, with market weighted average NPL declining by 4.9% points to 8.1% from a 13.0% in H1’2022, and,
- Market weighted average NPL Coverage for the listed banks decreased by 4.9% points to 57.4% in H1’2023 from 62.3% recorded in H1’2022. The decline was despite the fact that Stanbic Holding’s NPL coverage ratio increasing by 1.4% points to 57.4% from 56.0% in H1’2022.
Summary Performance
The table below shows performance of listed banks using several metrics:
|
Bank |
Core EPS Growth |
Interest Income Growth |
Interest Expense Growth |
Net Interest Income Growth |
Net Interest Margin |
Non-Funded Income Growth |
NFI to Total Operating Income |
Growth in Total Fees & Commissions |
Deposit Growth |
Growth in Government Securities |
Loan to Deposit Ratio |
Loan Growth |
Return on Average Equity |
|
Stanbic Holdings |
47% |
46.3% |
51.50% |
44.4% |
7.1% |
29.7% |
42.5% |
22.50% |
10.5% |
10.10% |
98.6% |
15.3% |
18.5% |
|
H1’23 Mkt Weighted Average* |
47.0% |
46.3% |
51.5% |
44.4% |
7.1% |
29.7% |
42.5% |
22.5% |
10.5% |
10.1% |
98.6% |
15.3% |
18.5% |
|
H1’22 Mkt Weighted Average** |
34.0% |
18.0% |
18.6% |
17.7% |
7.3% |
24.4% |
37.1% |
17.9% |
11.3% |
11.6% |
72.7% |
17.7% |
21.9% |
|
*Market cap weighted as at 11/08/2023 |
|||||||||||||
|
**Market cap weighted as at 09/09/2022 |
|||||||||||||
Key take-outs from the table include:
- The listed banks recorded an 47.0% growth in core Earnings per Share (EPS) in H1’2023, compared to the weighted average growth of 34.0% in H1’2022, an indication of sustained performance despite the tough operating environment experienced in H1’2023,
- Non-Funded Income grew by 29.7% compared to market weighted average growth of 24.4% in H1’2022, an indication of increased revenue diversification efforts by the banks, and,
- The Banks recorded a deposit growth of 10.5%, higher than the market weighted average deposit growth of 11.3% in H1’2022,
Universe of coverage:
|
Company |
Price as at 04/08/2023 |
Price as at 11/08/2023 |
w/w change |
YTD Change |
Target Price* |
Dividend Yield |
Upside/ Downside** |
P/TBv Multiple |
Recommendation |
|
KCB Group*** |
29.4 |
28.9 |
(1.7%) |
(24.6%) |
41.3 |
6.9% |
49.7% |
0.5x |
Buy |
|
Liberty Holdings |
4.0 |
4.0 |
(0.2%) |
(20.8%) |
5.9 |
0.0% |
48.4% |
0.3x |
Buy |
|
Jubilee Holdings |
186.3 |
189.3 |
1.6% |
(4.8%) |
260.7 |
6.3% |
44.1% |
0.3x |
Buy |
|
Kenya Reinsurance |
1.9 |
1.9 |
(1.0%) |
1.1% |
2.5 |
10.6% |
43.4% |
0.2x |
Buy |
|
Co-op Bank*** |
12.1 |
12.0 |
(0.8%) |
(1.2%) |
15.0 |
12.6% |
37.7% |
0.6x |
Buy |
|
NCBA*** |
41.7 |
39.3 |
(5.9%) |
0.8% |
48.9 |
10.8% |
35.3% |
0.8x |
Buy |
|
Equity Group*** |
41.0 |
41.0 |
0.0% |
(9.0%) |
51.2 |
9.8% |
34.6% |
0.9x |
Buy |
|
ABSA Bank*** |
12.4 |
12.5 |
0.4% |
2.0% |
14.7 |
10.8% |
28.7% |
1.0x |
Buy |
|
Diamond Trust Bank*** |
48.4 |
47.0 |
(2.8%) |
(5.7%) |
54.6 |
10.6% |
26.8% |
0.2x |
Buy |
|
CIC Group |
2.2 |
2.1 |
(5.0%) |
9.9% |
2.5 |
6.2% |
25.2% |
0.7x |
Buy |
|
Standard Chartered*** |
165.5 |
164.8 |
(0.5%) |
13.6% |
183.9 |
13.4% |
25.0% |
1.1x |
Buy |
|
Sanlam |
7.6 |
8.3 |
9.5% |
(13.4%) |
10.3 |
0.0% |
24.0% |
2.3x |
Buy |
|
Stanbic Holdings |
120.3 |
120.0 |
(0.2%) |
17.6% |
127.9 |
10.5% |
17.1% |
0.9x |
Accumulate |
|
HF Group |
5.0 |
5.0 |
(0.2%) |
57.8% |
5.8 |
0.0% |
16.9% |
0.2x |
Accumulate |
|
Britam |
4.4 |
5.1 |
18.2% |
(1.2%) |
6.0 |
0.0% |
16.1% |
0.7x |
Accumulate |
|
I&M Group*** |
19.0 |
19.0 |
0.0% |
11.4% |
19.5 |
11.8% |
14.3% |
0.4x |
Accumulate |
We are “Neutral” on the Equities markets in the short term due to the current tough operating environment and huge foreign investor outflows, and, “Bullish” in the long term due to current cheap valuations and expected global and local economic recovery.
With the market currently being undervalued to its future growth (PEG Ratio at 0.7x), we believe that investors should reposition towards value stocks with strong earnings growth and that are trading at discounts to their intrinsic value. We expect the current high foreign investors sell-offs to continue weighing down the equities outlook in the short term.
- Residential Sector
- Ruto oversees the launch of the Gichugu affordable housing project
During the week, president Ruto oversaw the groundbreaking of 110 affordable housing units situated on a 1.5-acre piece of land in Gichugu Constituency, Kirinyaga County. The residential units are part of the first phase of the Gichugu Affordable Housing project which will be a comprehensive development comprising of; i) studio, two and three bedroom units, ii) amenities such as a social hall, iii) a commercial area, and, iv) a pitch/play area. The table below highlights the key project particulars;
|
Cytonn Report: Gichugu Affordable Housing Project |
|||
|
Typology |
Total Units |
Plinth Area (SQM) |
Plinth Area (SQM) |
|
Studio |
30 |
20 |
20 |
|
Two Bedroom |
40 |
40 |
40 |
|
Three bedroom |
40 |
60 |
60 |
|
Grand Total Number of Units |
110 |
||
|
|
Average |
40 |
40 |
Source: State House Kenya
The project is part of the government’s announcement to construct 200 units per constituency in the 2023/24 financial year, which is in line with the goal of bridging the existing annual housing deficit of 200,000 units, with only 50,000 units being supplied per year. The table below shows some of the various affordable housing projects by the government in the pipeline;
|
Cytonn Report: Notable Ongoing Affordable Housing Projects by the Government |
||||
|
Name |
Developer |
Location |
Launch Date |
Number of Units |
|
Ziwani Starehe Affordable Housing Project |
National Government and GulfCap Africa Limited |
Ziwani |
March 2023 |
6,704 |
|
Pangani Affordable Housing Program |
National Government and Tecnofin Kenya Limited |
Pangani |
June 2020 |
1,562 |
|
River Estate Affordable Housing Program |
National Government and Erdemann Property Limited |
Ngara |
March 2019 |
2,720 |
|
Park Road Affordable Housing Program |
National Housing Corporation |
Ngara |
February 2019 |
1,370 |
|
Mukuru Affordable Housing Program |
National Housing Corporation |
Mukuru kwa Njenga, Enterprise Road |
December 2021 |
15,000 |
|
Mavoko Affordable Housing Project |
National Government and Epco Builders |
Syokimau, Machakos County |
December 2022 |
5,360 |
|
NHC Stoni Athi View (Economy Block-Rental) |
National Housing Corporation |
Athi River, Machakos County |
December 2021 |
50 |
|
NHC Stoni Athi View |
National Housing Corporation |
Athi River, Machakos County |
December 2021 |
120 |
|
Mariguini Informal Settlement |
National Government |
Starehe, Nairobi County |
March 2021 |
2,600 |
|
Kibera Soweto East Zone B |
National Government |
Kibera, Nairobi County |
October 2022 |
3,000 |
|
Starehe Affordable Housing Project |
National Government and Tecnofin Kenya Limited |
Starehe, Nairobi County |
March 2023 |
3,000 |
|
Shauri Moyo A Affordable Housing Units |
National Government and Epco Builders |
Shauri Moyo, Nairobi County |
February 2020 |
2,731 |
|
Clay City Project |
Housing Finance Development and Investment and Clay Works |
Kasarani, Thika Road |
October 2018 |
1,800 |
|
Bachelors Jevanjee Estate |
County Government of Nairobi and Jabavu Village |
Ngara |
February 2020 |
720 |
|
Kings Boma Estate |
National Government and Kings Developers Limited |
Ruiru, Kiambu County |
January 2020 |
1,050 |
|
Gichugu Affordable Housing project |
Kirinyaga County Government and National Housing Corporation |
Gichugu, Kirinyaga County |
August 2023 |
110 |
|
Total |
|
|
|
47,797 |
Source: Cytonn Research, Boma Yangu
- Ruto presides over the launch of the Kings Orchid affordable housing project
During the week, president Ruto presided over the groundbreaking ceremony for the construction of ‘Kings Orchid’ affordable housing project located in Thika town, Kiambu County. The project will be developed by Kings Developers Limited through a Public-Private Partnership (PPP) agreement with the government, and will comprise of; i) 975 residential apartment units, of which 20.0% will be reserved for civil servants, ii) a shopping complex with retail outlets, iii) green and well landscaped spaces including kids play areas, and iv) parking spaces. Buyers will benefit from a 2.5-year payment plan for the two and three bedroom units, while payments for studio and one bedroom apartments will be completed within 60 days. The table below highlights the important project particulars;
|
Cytonn Report: Kings Orchid project, Thika, Kiambu County |
||||
|
Typology |
Total Units |
Plinth Area (SQM) |
Price |
Price per SQM |
|
Studio |
130 |
20 |
1,000,000 |
50,000 |
|
One Bedroom |
234 |
30 |
1,500,000 |
50,000 |
|
Two Bedroom |
238 |
59 |
3,274,500 |
55,500 |
|
Two Bedroom (Master Ensuite) |
238 |
70 |
3,885,000 |
55,500 |
|
Three Bedroom |
135 |
83 |
4,606,500 |
55,500 |
|
Grand Total Number of Units |
975 |
|
||
|
|
Average |
52 |
2,853,200 |
53,300 |
Source: Kings Developers Limited
In addition to the above, there also exists several projects initiated by private developers to fast-track the delivery of housing projects to Kenyans. The table below shows various affordable housing projects spearheaded by the private sector;
|
Cytonn Report: Notable Ongoing Affordable Housing Projects by the Private Sector |
||||
|
Name |
Developer |
Location |
Launch Date |
Number of Units |
|
Great Wall Gardens Phase 5 |
Erdemann Limited |
Mavoko, Machakos County |
December 2022 |
1,128 |
|
Samara Estate |
Skymore Pine Limited |
Ruiru |
July 2020 |
1,824 |
|
Moke Gardens |
Moke Gardens Real Estate |
Athi River |
October 2021 |
30,000 |
|
Habitat Heights |
Afra Holding Limited |
Mavoko |
December 2019 |
8,888 |
|
Tsavo Apartments Projects |
Tsavo Real Estate |
Embakasi, Riruta, Thindigua, Roysambu, and, Rongai |
October 2020 |
3,200 |
|
Unity West |
Unity Homes |
Tatu City |
November 2021 |
3,000 |
|
RiverView |
Karibu Homes |
Athi River |
October 2020 |
561 |
|
Kings Serenity |
Kings Developers Limited |
Ongata Rongai, Kajiado County |
October 2022 |
734 |
|
Joinven Estate |
Joinven Investments Limited |
Syokimau, Machakos County |
December 2022 |
440 |
|
Stima Heights |
Stima SACCO |
Ngara West, Nairobi County |
March 2023 |
450 |
|
Kings Orchid |
Kings Developers Limited |
Thika, Kiambu County |
August 2023 |
975 |
|
Total |
|
|
|
51,200 |
Source: Cytonn Research, Boma Yangu
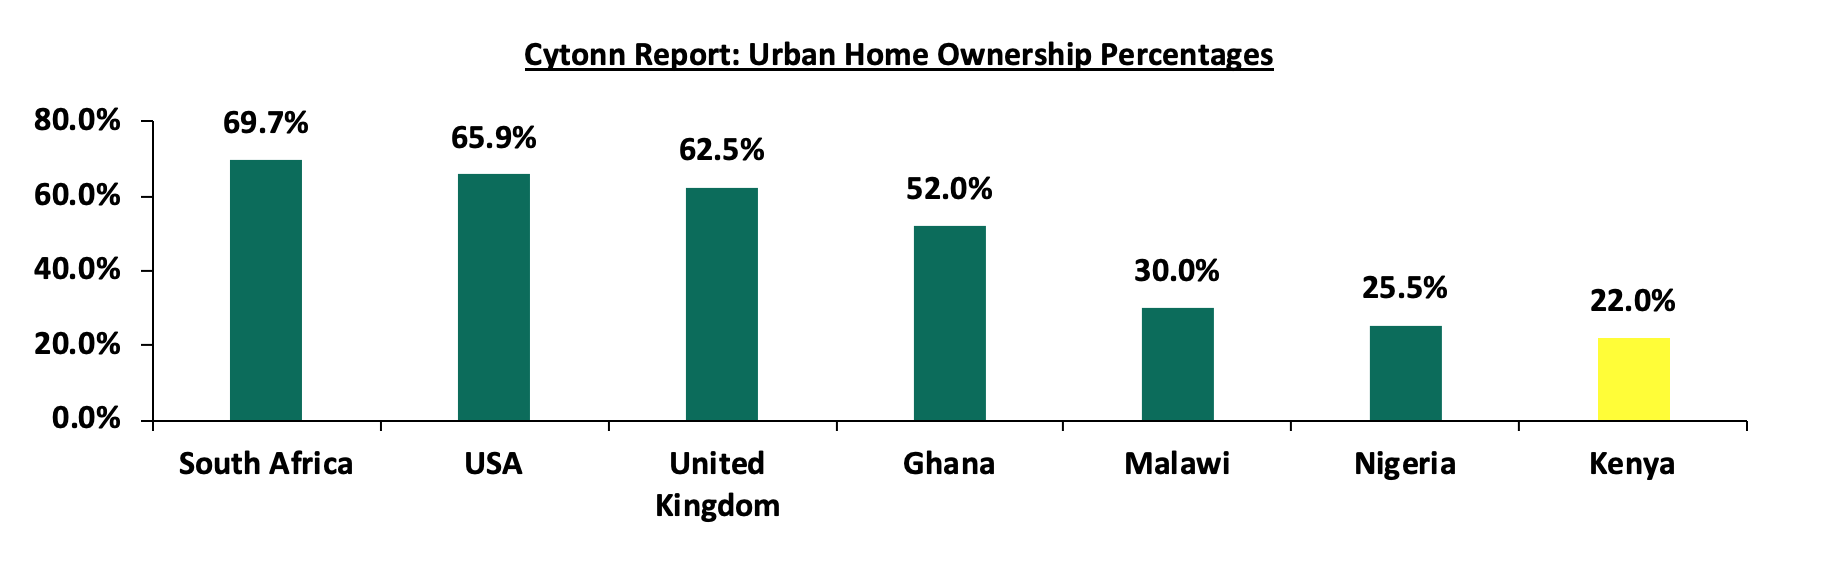
Going forward we expect to see more affordable housing projects being launched by both the private sector and the government in line with the drive to curb the existing housing deficit in Kenya, currently standing at 80%. Additionally, this is expected to promote urban home ownership rates in the country which have remained low at 22.0%, in comparison with other countries such as South Africa and Ghana with rates of 69.7% and 52.0% respectively, as at 2021. The chart below shows urban home ownership rates for various countries;
Source: Centre for Affordable Housing Africa, US Census Bureau, UK Office for National Statistics
- Real Estate Regulated Funds
- Real Estate Investment Trusts (REITs)
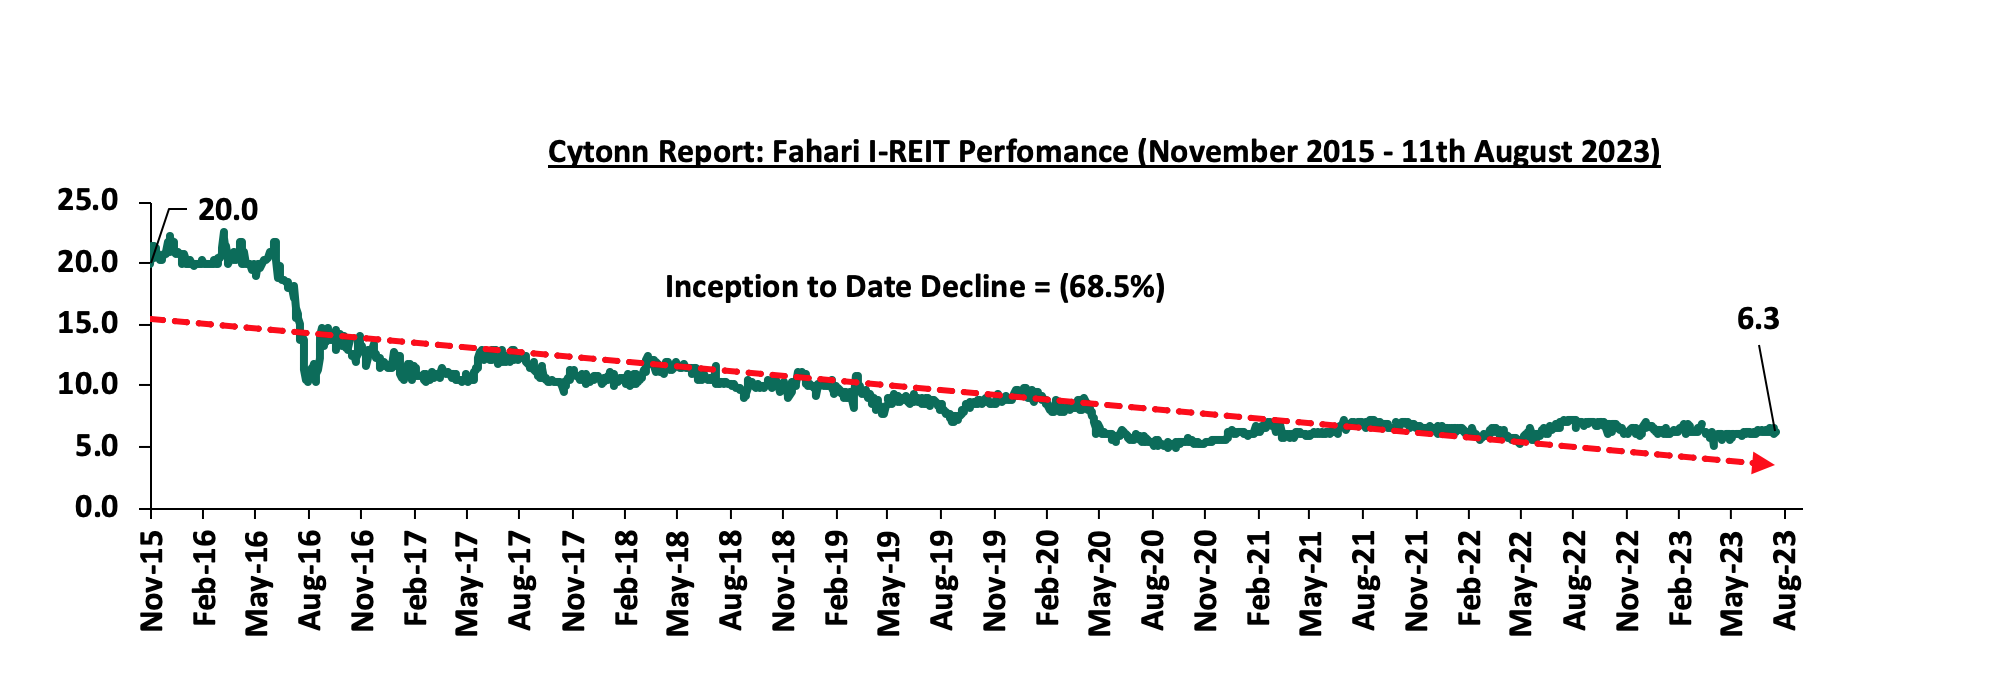
In the Nairobi Securities Exchange, ILAM Fahari I-REIT closed the week trading at an average price of Kshs 6.3 per share. The performance represented a 2.5% decline from Kshs 6.5 per share recorded the previous week, taking it to a 7.1% Year-to-Date (YTD) decline from Kshs 6.8 per share recorded on 3 January 2023. In addition, the performance represented a 68.5% Inception-to-Date (ITD) loss from the Kshs 20.0 price. The dividend yield currently stands at 10.3%. The graph below shows Fahari I-REIT’s performance from November 2015 to 11 August 2023;
In the Unquoted Securities Platform, Acorn D-REIT and I-REIT traded at Kshs 23.9 and Kshs 21.6 per unit, respectively, as at 11 August 2023. The performance represented a 19.5% and 8.0% gain for the D-REIT and I-REIT, respectively, from the Kshs 20.0 inception price. The volumes traded for the D-REIT and I-REIT came in at 12.3 mn and 30.2 mn shares, respectively, with a turnover of Kshs 257.5 mn and Kshs 624.4 mn, respectively, since inception in February 2021.
REITs provide various benefits like tax exemptions, diversified portfolios, and stable long-term profits. However, factors such as; i) inadequate comprehension of the investment instrument among investors, ii) prolonged approval processes for REITs creation, iii) high minimum capital requirements of Kshs 100.0 mn for trustees, and, iv) minimum investment amounts set at Kshs 5.0 mn, continue to limit the performance of the Kenyan REITs market.
- Cytonn High Yield Fund (CHYF)
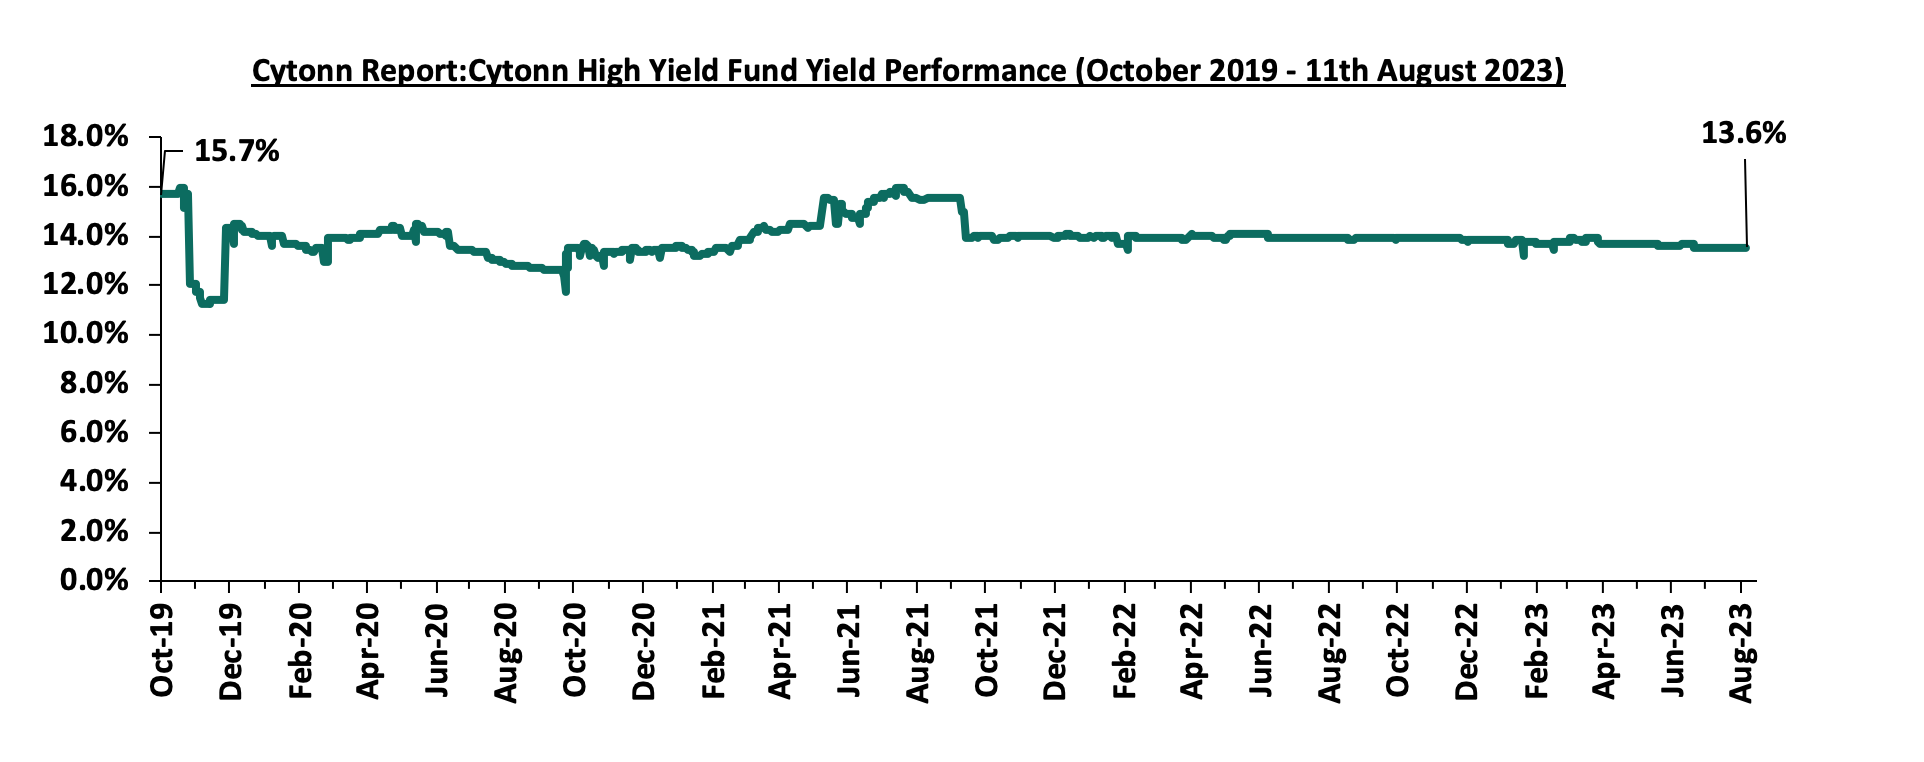
Cytonn High Yield Fund (CHYF) closed the week with an annualized yield of 13.6%, remaining relatively unchanged from the previous week. The performance also represented a 0.3% points Year-to-Date (YTD) decline from 13.9% yield recorded on 1 January 2023, and 2.1% points Inception-to-Date (ITD) decline from the 15.7% yield. The graph below shows Cytonn High Yield Fund’s performance from October 2019 to 11 August 2023;
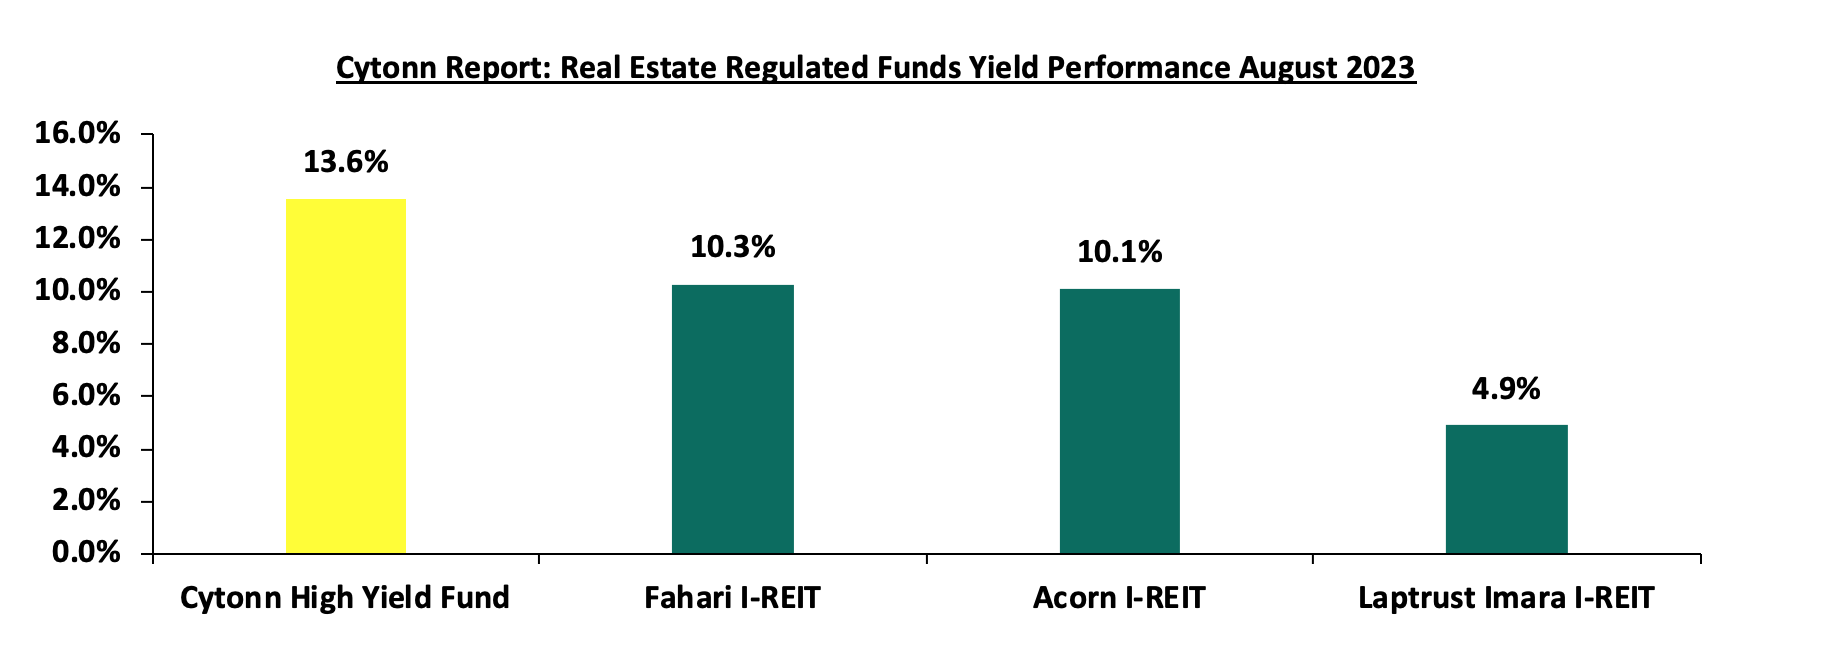
Notably, the CHYF has outperformed other regulated Real Estate funds with an annualized yield of 13.6%, as compared to Fahari I-REIT, Acorn I-REIT, and Laptrust Imara I-REIT with yields of 10.3%, 10.1%, and 4.9% respectively. As such, the higher yields offered by CHYF makes the fund one of the best alternative investment resource in the Real Estate sector. The graph below shows the yield performance of the Regulated Real Estate Funds:
Source: Cytonn Research
We expect the performance of Kenya’s Real Estate sector to remain on an upward trajectory, supported by factors such as; i) initiatives by the government and private sector to prioritize affordable housing projects across various counties, ii) infrastructure developments facilitating investments, and iii) positive demographic trends facilitating increased housing demand. There are, however, a number of challenges that remain, including oversupply in certain real estate sectors, including commercial office and retail sectors, which are both oversupplied, ii) escalating construction costs due to rising inflation, and iii) limited investor knowledge and interest in REITs, which is expected to hinder the sector’s optimal performance.
Insolvency refers to a financial situation where an individual, business or entity, such as a fund, is unable to meet their financial obligations or settle their debts as they become due. In most cases, the state of insolvency occurs due to an increase in business expenses, poor cash management, law suits, poor budgeting, fraud, business expansion, or a reduction in sales. In Kenya, insolvency proceedings are primarily governed by the Insolvency Act of 2015. The act provides for how insolvent companies can be assisted to service creditors obligations and protect the interests of all stakeholders. The options available for such an insolvent company include Administration, Receivership, voluntary arrangements, and liquidation. Previously, we covered the following topics on insolvency:
- Administration as a Business restructuring option in Cytonn Weekly #37/2022 – We analyzed some of the recent companies that have been in administration and noted down the key take outs,
- Debt restructuring in Cytonn Weekly #25/2022 – We analyzed the available debt restructuring options that can be used by companies facing financial distress so as stay afloat and grow in the long run, and
- Business restructuring options in our Topical – We reviewed the business restructuring options under the Insolvency Act of 2015
In this week’s Focus, we found it timely to reiterate the topic and we shall undertake this by looking into the following;
- Introduction,
- The Insolvency Act of 2015
- Financial health of a company and warning signs,
- Business restructuring options under the insolvency act,
- Case Study,
- Challenges affecting insolvency practice, and,
- Recommendations and Conclusion.
Section I: Introduction
Insolvency refers to a financial situation whereby an individual or business is unable to meet its financial obligations or settle its debts as they become due. In most cases, the state of insolvency occurs due to an increase in business expenses, poor cash management, law suits, poor budgeting, fraud, business expansion, or a reduction in sales. Consequently, these situations may lead to:
- Cash flow insolvency – whereby the company does not have enough cash or assets that can be easily converted into cash to settle its short-term obligations. This means that the company is struggling to pay its bills, creditors, and operating expenses on time. It occurs due to a delay in customers settling their invoices, cash disruption due to seasonality (for example, in the tourism industry), or a sudden increase in operating costs. However, the company’s total asset value may exceed its total liabilities, or,
- Balance sheet Insolvency – also known as technical Insolvency, whereby the company’s total liabilities exceed the value of its total assets and the company owes more than it owns. Therefore, the sale of all the company’s assets will not be sufficient to settle all the company’s liabilities. It usually occurs when the value of total assets decreases while the value of total liabilities increases or remains unchanged. However, balance sheet insolvency only looks at the current balance sheet position and fails to account for the business's cash flows. Therefore, the company may have a positive cash flow and be able to settle its short-term obligations.
In Kenya, insolvency proceedings are primarily governed by the Insolvency Act of 2015. This act provides for various mechanisms to address insolvency situations, including bankruptcy for individuals and winding up for companies. It aims to promote the efficient and fair resolution of insolvency cases while at the same time protecting the rights of creditors and debtors.
Prior to the enactment of the Insolvency Act in 2015, insolvency proceedings of both corporate entities and individuals were dealt with under the winding-up provisions of the Companies Act and the Bankruptcy Act. For corporations, the resolution of insolvency proceedings often involved the commencement of a winding-up proceeding, which involved the liquidation of the company under financial distress and paying the firm’s creditors. This effectively meant that creditors and other stakeholders in firms ran the risk of failing to recover total amounts of interest, especially in the event the company’s assets failed to cover the total amounts due. Thus, in an attempt to remedy this, the Insolvency Act was enacted in 2015. The Act consolidated the insolvency proceedings for both incorporated and unincorporated companies, previously under the Companies Act, and those of individuals, previously under the Bankruptcy Act, into one document. The Act focuses more on assisting insolvent corporate bodies whose financial position is deemed redeemable to continue operating as going concerns so that they may be able to meet their financial obligations to the satisfaction of their creditors.
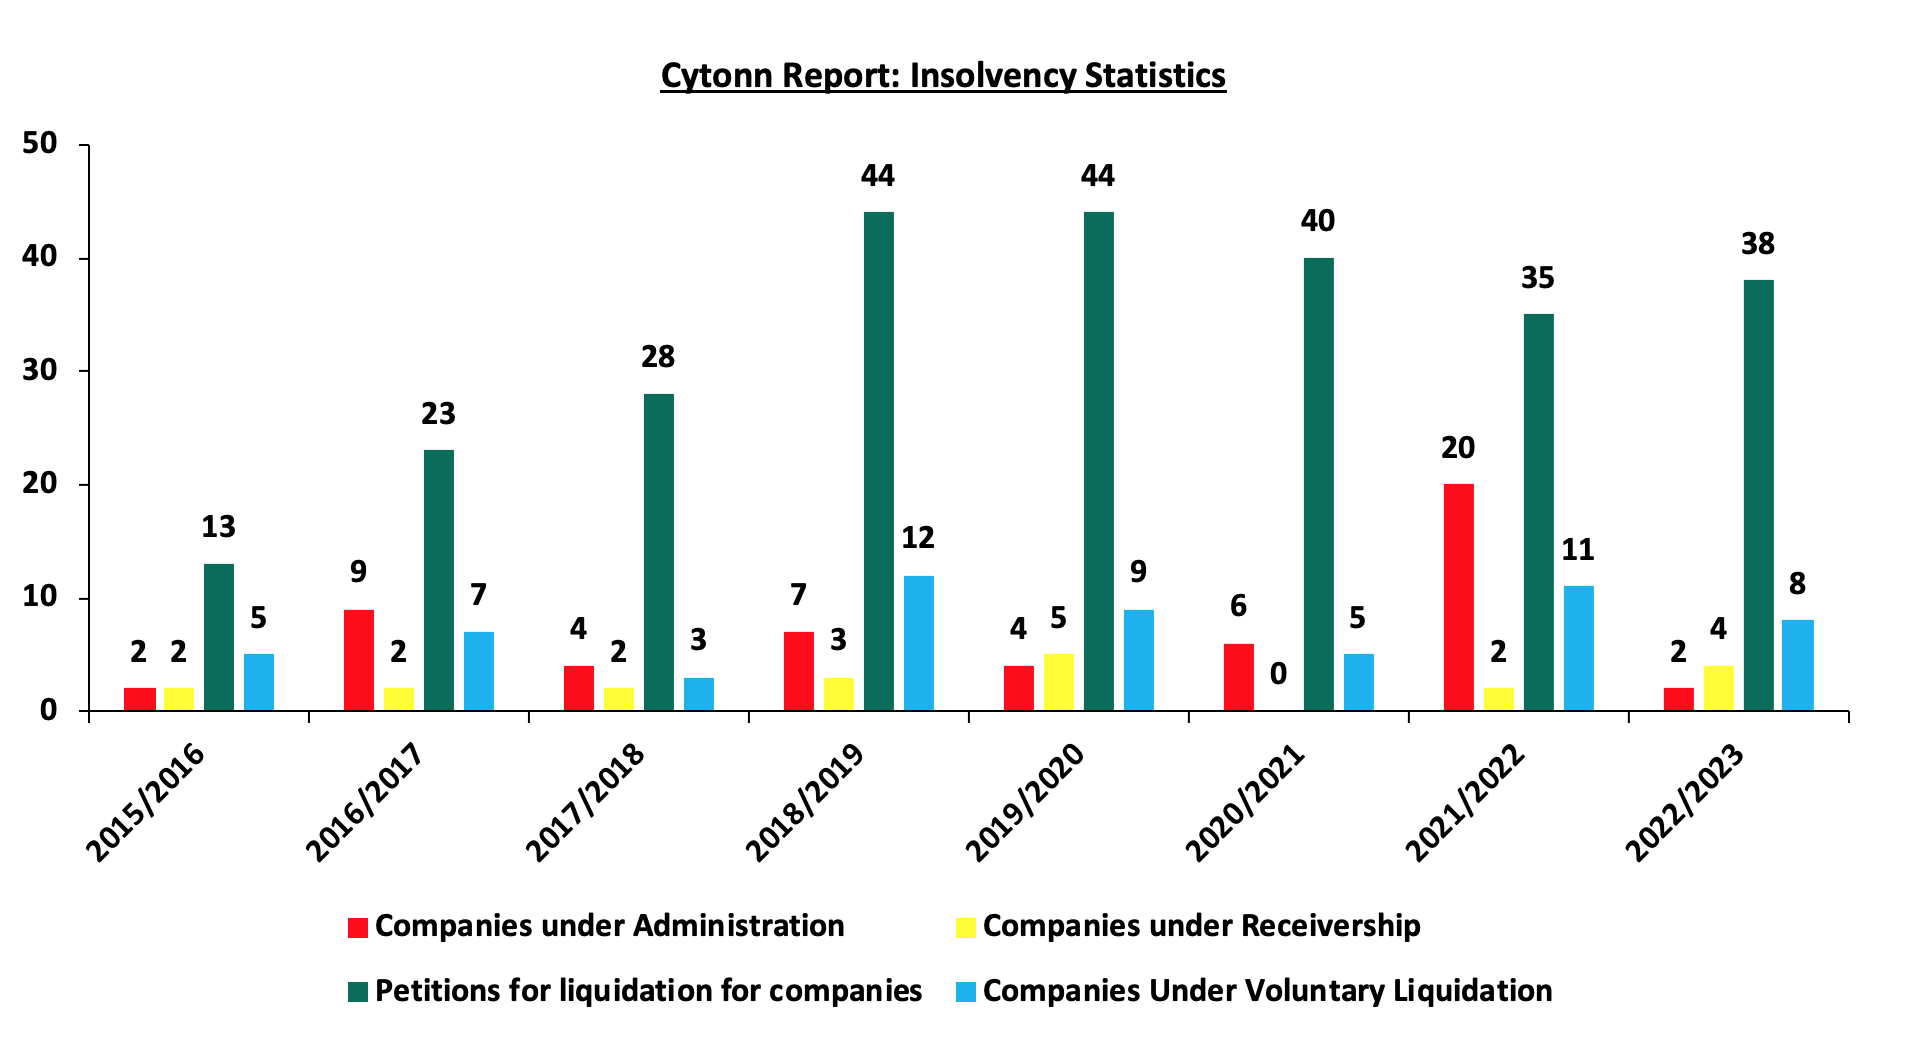
According to the latest statistics by the Kenya’s State Receiver’s office, the total number of petitions for liquidation of companies by courts has been increasing on average by 33 every year. Additionally, on average, the total number of companies under administration, companies under receivership, and companies under voluntary liquidation during each year is 7, 3, and 8, respectively. This situation is partly attributable to the increase in Gross non-performing loans, with the banking sector recording a 5-year CAGR growth of 13.5% to Kshs 540.8 bn in March 2023 from Kshs 287.2 bn in March 2018. Additionally, the tough business operating environment characterized by elevated inflationary pressures and persistent depreciation of the Kenya shilling against the dollar has led to a significant increase in business operating expenses, which has affected the profitability of the business. The graph below shows the trend in the number of applications for insolvency during each year:
Source: Office of the Official Receiver
Section II: The Insolvency Act of 2015
The Insolvency Act was assented into law in September 2015 and came in to assist insolvent companies in strategizing on the best possible solution to bring the company back to financial stability rather than liquidation, with a view to preserving businesses, jobs and tax base as much as possible . Prior to 2015, stakeholders faced the possibility of losing a significant amount, especially in the event that the company’s liability value was higher than the total assets held. The Insolvency Act of 2015 seeks to create a more robust and effective insolvency framework in Kenya by:
- Ensuring a fair balance between the insolvent entity and the creditors by providing for a framework for the efficient and equitable distribution of the assets of the insolvent entity,
- Enabling insolvent companies whose financial position is redeemable, to continue operating as a going concern so that they may ultimately meet their obligations,
- Providing for a better outcome for the creditors than what would likely be the case if the insolvent entities were declared bankrupt or liquidated, and
- Providing for an orderly manner of liquidating the assets of an insolvent company that are irredeemable and ensuring efficient and optimal distributions of the assets for the benefit of the creditors.
Some of the key features and provisions in the act include:
- Types of Insolvency Proceedings - The Act outlines various insolvency proceedings such as administration, receivership, liquidation, and company voluntary agreements. It provides procedures for initiating and filling claims in insolvency proceedings.
- Appointment of Insolvency Practitioners - Licensed insolvency practitioners are appointed to oversee insolvency cases. They are responsible for managing the assets and liabilities of the insolvent party, ensuring fair distribution to creditors, and facilitating the resolution process. They include the Official receiver, Bankruptcy Trustee, Liquidator and Administrator.
- Powers of Insolvency practitioners – The Insolvency practitioners have a fiduciary duty of acting in the best interest of the creditors and stakeholders involved in the insolvency process. The Act provides for the powers of insolvency practitioner with regard to carrying out the business of the insolvent company. Additionally, it also highlights some of the powers that can be excised with or without the approval of the courts or the creditors.
- Moratoriums - The Act allows for the issuance of a moratorium period during which creditors cannot take legal action against the debtor. This allows for an opportunity to reorganize and rehabilitate the debtor's financial position.
- Priority of payment to preferential creditors - In insolvency proceedings, claims are ranked based on their priority level and this is important in determining the order in which the claim will be paid from the available assets of the insolvent debtor to the stakeholders
- Cross-Border Insolvency - The Act provides mechanisms for dealing with cross-border insolvency cases, including cooperation with foreign courts and recognition of foreign insolvency proceedings.
- Role of the Courts in Insolvency Proceedings – The act has provided for the powers of the court to review, rescind the appointment of an insolvent practitioner, allow the substitution of the creditor, and stay the application of insolvency, among others.
Section III: Financial health of a company and warning signs
Assessing the financial health of a company is crucial for investors, creditors, and other stakeholders to understand the company’s ability to meet its financial obligations, manage risks, and sustain long term operations. It helps in identifying warning signs of potential financial distress and allows stakeholders to take corrective actions before the situation worsens. There are a number of indicators that are used in accessing the financial health of a company, which include:
- Profitability – This indicator measures the company’s ability to generate profit relative to its assets, equity, expenses, and revenue. It shows an investor whether the company can survive on its own in the long run without having to rely on additional financing from alternative sources. Some of the ratios used to assess profitability include Return on Assets (ROA), Return on Equity (ROE), EBITDA (Earnings Before Interest Income, Taxes, Depreciation, and Amortization), and Net Profit Margins. A positive ratio is an indication of a profitable company, and vice versa.
- Liquidity – This indicator measures the company’s ability to settle its short-term obligations relative to its available cash and the assets that can be easily converted to cash. A company should be able to settle its expenses and debts without delay. Some of the ratios used to assess liquidity include the current ratio and the quick ratio. A value greater than 1.0 indicates that the company can easily settle its short-term obligations without delays.
- Solvency - This indicator measures the company’s ability to settle its long-term obligations relative to its total assets, or equity. In the event of the winding up of a company, it is expected that both creditors and shareholders will be able to get back the funds they have lent and invested. Some of the ratios include the debt-to asset ratio and the debt-to Equity ratio. A value less than 1.0 indicates that the company is highly solvent and is able to meet all its long-term obligations.
- Efficiency – This indicator measures how well a company is able to utilize its assets to generate income and the management's ability to control the company’s expenses and liabilities. Efficiency has a high correlation with profitability, given that the more efficiently the company's resources are used, the more profitable the company becomes.
- Cash flow – This indicator measures the company’s ability to generate and manage cash to cover operational expenses, investments, and other financial obligations. Cash flow provides insights into a company's liquidity, solvency, and overall financial stability. A positive cash flow is an indication that the company is able to generate sufficient cash to run its operations, as it is generating more than it is spending.
These indicators provide a comprehensive view of a company's financial health. However, they only give relevant insight about the company when compared with the indicators of companies within the same industry or compared to the historical indicator values of the company. The analysis of the financial health of the company is crucial in identifying potential risks and enabling one to take the appropriate actions to address those risks. Some of the warning signs of Insolvency include:
- Persistent loss-making trend: A sustained loss trend over multiple periods can erode a company's equity base, thereby reducing its ability to cover its financial obligations and indicating a potential deterioration of its financial position.
- Increase in debt levels - Rapidly growing debt, especially short-term debt, will lead to the possibility of overextending loans and credit facilities, which will strain a company's finances, thus increasing the default risk.
- Delayed payments - Consistent delaying of payments to suppliers and employees can be an indication that the company is facing cash flow problems and is struggling to meet its short-term liabilities.
- Negative cash flow – When the company's operating cash flow is consistently negative, it indicates that it's not generating sufficient cash from its core operations. This could be partially attributable to the high level of obsolete or slow-moving inventory, which hinders the company's ability to generate cash from sales.
- Numerous legal actions – Lawsuits can have significant negative impacts on a company's financial health, reputation, operations, and overall stability. They can be expensive to defend, requiring legal fees, court costs, and potential settlement payments. The financial burden can strain a company's resources, affecting its cash flow and profitability.
- A low Credit score - A downgrade of a credit score by a Credit rating agency's company is a result of the company's deteriorating financial condition and indicates a higher default risk. This will lead to either the company taking more expensive risks, which will overburden its finances, or the company facing challenges in obtaining new loans.
It's important to note that while these indicators and warning signs can provide insights into a company's financial health and potential risk of insolvency, a comprehensive assessment should consider the company's industry, competitive landscape, and overall economic conditions. However, experiencing one or a few of these warning signs does not necessarily mean a company is insolvent. A combination of these indicators, especially if they persist over time, warrants careful analysis and consideration by stakeholders. In the event the company becomes insolvent, the Insolvency Act contains provisions for corporate rescue mechanisms to help financially troubled businesses restructure and avoid liquidation. The advantages of these provisions include:
- Preservation of the value of the assets - By addressing the financial issues and restructuring the company's operations, assets, and liabilities, it may be possible to preserve the underlying value of the business. This can prevent a complete collapse and potential liquidation, which could result in significant losses for all stakeholders
- Debt Reduction and Negotiation - Restructuring often involves negotiating with creditors to restructure debt repayment terms. This can lead to reduced debt burdens, extended payment periods, or even partial forgiveness of debt, making it more manageable for the company to recover.
- Continued Operations - A well-planned restructuring can enable the company to continue its operations, maintain relationships with customers and suppliers, and honor existing contracts. This can be especially important for businesses with ongoing projects or long-term partnerships.
- Improved Efficiency - Restructuring provides an opportunity to assess and optimize the company's operations, streamline processes, eliminate inefficiencies, and allocate resources more effectively. This can lead to improved profitability and competitiveness.
- Access to New Capital - In some cases, restructuring may attract new investors or lenders who are willing to provide capital to support the company's recovery efforts. This injection of funds can help stabilize the company's finances and fuel its growth.
- Creditor Satisfaction - Creditors may benefit from a structured repayment plan that is more likely to lead to higher recovery rates compared to liquidation. This can lead to more favorable outcomes for both secured and unsecured creditors.
Key to note is that the overall success of a restructuring process depends on various factors, including the severity of the financial distress, the willingness of stakeholders to cooperate, the expertise of the professionals involved, and the overall economic environment.
Section IV: Business Restructuring options under the Insolvency Act
Business restructuring for an insolvent company involves a series of strategic and operational changes aimed at improving the company's financial health, addressing its insolvency, and ensuring its long-term viability. The goal of a restructuring is to reorganize the company's operations, debt, and assets in a way that enables it to overcome financial challenges and continue its business activities. In Kenya, insolvency proceedings are primarily governed by the Insolvency Act of 2015. The act provides for how insolvent companies can be assisted to service creditor’s obligations and protect the interests of all stakeholders. The options available for such an insolvent company include;
- Administration –The primary objective of administration is to rescue the company as a going concern, preserve its value, and maximize returns for creditors rather than immediately liquidate its assets. It is headed by an Administrator, a certified Insolvency Practitioner, who may be appointed by an administration order of the court, unsecured creditors, or a company or its directors. Once an administration application is filed, an automatic moratorium (legal stay order) is imposed, preventing creditors from taking legal action to recover debts or seize assets. This moratorium allows the company and the administrator time to assess the situation, develop a restructuring plan, and implement necessary changes without immediate pressure from creditors. Once the administrator has achieved the objectives of administration, the company can exit administration, which could involve returning control of the company to its directors, implementing a restructuring plan, or transitioning to another form of insolvency proceedings if necessary.
- Company Voluntary Arrangements - This arrangement is entered into when a company is insolvent and the directors propose to the company’s creditors the best way to save the company from liquidation. The proposal consists of repayment plans where the company seeks to extend its repayment period and the debt is repaid through regular installments as opposed to settling the payment dues in full. The directors appoint an insolvency practitioner to supervise the voluntary arrangement. Once the proposal is approved by both the company, the creditors, and the Courts, the voluntary agreement remains binding on the company and the creditors until it ceases. Important to note: banking and insurance companies are not legally allowed to pursue this option.
- Receivership – In this process, the primary objective is to realize and sell the firm’s assets and help settle the outstanding debts. A firm’s creditors may appoint an independent certified Insolvency Practitioner to act as a fiduciary (a receiver’) for the firm to realize and sell the firm’s assets and help settle the outstanding debts. In the banking sector, the CBK can put banks under receivership, as in the case of Imperial Bank and Chase Bank. The Kenya Deposit Insurance Act, No. 10 of 2012, allows the CBK to appoint the Kenya Deposit Insurance Corporation (KDIC) as the sole and exclusive receiver of any institution.
- Liquidation – Liquidation is a common insolvency proceeding whereby a company is wound up after all its assets and liabilities are identified in order to pay off creditors to the greatest extent possible. Liquidation proceedings can be initiated by a court in Kenya or can be voluntary in nature, where the company members or creditors make a liquidation application.
During the insolvency process, the debts of a company are paid out in order of priority. The purpose of prioritization is to ensure that essential debts are settled before other claims are addressed. Under the Insolvency Act, the priority of payment for preferential creditors in Kenya is as follows:
- First Priority Claims – These consist of the expenses incurred in procuring the orders for the insolvency. They Include the fees for the Insolvency practitioner, the costs incurred by the person who applied to the court, and the costs incurred in protecting, preserving, and recovering the value of the assets.
- Second Priority Claims – These are paid out after the first priority claims are settled. They consist of all the wages and other compensations of the employees of the companies. They are given a second priority to ensure that employees are not left without their due compensation.
- Third Priority Claims – These claims rank third after the first and second priority claims have been settled. They consist of tax liabilities of the company, such as Income tax, Value Added Tax (VAT), and Excise tax, among others.
After preferential creditors have been paid, any remaining assets are used to settle the claims of secured creditors (those with collateral) and then the claims of unsecured creditors (those without collateral). Shareholders and equity holders are usually at the bottom of the priority list and are often the last to receive any remaining funds, if there are any left after satisfying higher-ranking claims.
Section V: Case studies
- Kaluworks
Kaluworks was set up in 1929 and was one of Kenya’s leading aluminium products such as utensils and roofing sheets, before the country started to see an influx of imports of similar materials. This came at a time when Kaluworks was on an aggressive expansion drive and had invested Kshs 1.8 bn to upgrade its factory in Mariakani Mombasa, both initiatives largely funded through debt from Commercial banks. This was also followed by interruptions brought about by the COVID-19 pandemic, which saw a slowdown in building activities in the country. In a gazette notice dated 18th June 2021, one of the main creditors, placed Kaluworks under receivership on May 27th 2021 by virtue of being holders of a qualifying floating charge. The creditors include NCBA Banks which was owed Kshs 4.3 bn, Cooperative Bank, which was owed Kshs 4.8 bn, while other unsecured lenders such as I&M Bank, commercial paper holders such as Sanlam Kenya held a combined of Kshs 3.5 bn. Pongangipalli Rao was appointed an insolvency practitioner in a bid to recover the amounts owed to them. On 25th August 2022, the High Court of Kenya in Nairobi, consented to the termination of administration of Kaluworks Limited under the Company Voluntary Agreement between Kaluwork’s and the secured creditors, with Orlando Mario da Costa-Luis appointed as the supervisor in the gazette notice dated 16th September 2022, effective 26th August 2022. NCBA Group and Cooperative Bank agreed with the administrator and Kaluworks Limited to write off a total Kshs 6.4 bn out of the total Kshs 9.1 bn owed to them, equating to a 70.0% haircut. In the agreement, NCBA was to receive Kshs 580.0 mn while Cooperative bank received Kshs 680.4 mn. In the tabled agreement, Kaluworks shareholders agreed to a Kshs 1.2 bn capital injection, with a section paid to the secured lenders as is in the schedule below:
|
Cytonn Report: Kaluworks’ Limited Disbursement to Creditors |
|||||
|
Lender |
Amount owed (Kshs bn) |
Amount paid (Kshs bn) |
Unpaid amount (Kshs bn) |
Amount written off (Kshs bn) |
Haircut |
|
NCBA Bank |
4.3 |
0.5 |
3.8 |
3.8 |
88.0% |
|
Cooperative Bank |
4.8 |
2.2 |
2.6 |
2.6 |
55.0% |
|
Other Creditors |
3.5 |
-* |
-* |
-* |
100.0%* |
|
Total |
12.6 |
2.7 |
6.4 |
6.4 |
78.6% |
|
*Not disclosed |
|||||
Source: Administrator’s filings
In our view, the Insolvency act gave Kaluworks Limited a fighting chance, which may not have been achieved through liquidation given that the company owed a total of Kshs 12.6 bn against its realizable assets worth Kshs 1.3 bn. Additionally, the restructuring plan gives the other unsecured creditors future hope of realizing the amounts once the company is back on its feet. Key to note, its successful exit from administration highlights how collaborative efforts from all stakeholder are crucial in saving a business.
- ARM Cement
ARM is a Kenyan manufacturing company listed at the Nairobi Securities Exchange, with operations in Kenya, Tanzania and Rwanda. The firm specializes in the production of cement, fertilizers, quicklime, and other industrial minerals. ARM cement, once a stable company, started experiencing difficulty in 2016, as the firm’s revenue lines started decreasing. Revenues declined by 32.0% from Kshs 12.8 bn in FY’2016 to Kshs 8.7 bn in FY’2017 while operating expenses rose by 34.8% to Kshs 3.1 bn from Kshs 2.3 bn in FY’2016. This saw the operating loss widen to Kshs 4.2 bn in FY’2017 from Kshs 0.3 bn in FY’2016, and consequently the loss after tax widened by 87.5% to Kshs 7.5 bn in FY’2017 from Kshs 4.0 bn in FY’2016. The shrinking revenue lines were largely attributed to stiff competition in the cement industry both in Kenya and Tanzania, the company’s main revenue contributors. The declining performance pushed the company into a negative working capital position, further exacerbating the poor performance, thereby rendering the company unable to service its debt obligations to various creditors, such as African Finance Corporation (AFC), Stanbic Bank of Kenya and UBA Bank of Kenya of Kshs 4.6 bn, Kshs 3.2 bn and Kshs 0.5 bn respectively.
The company was then placed under administration in August 2018, with PwC’s Muniu Thoithi and George Weru appointed as the administrators. The administrators, having full control held a creditor’s meeting in October 2018, where creditors voted to give the administrators up to September 2019, to revive the company. The creditors also approved the sale of some or even all of the company’s assets, and capital injections from strategic investors as part of the strategies to revive the company. The administrators wrote off the Kshs 21.3 bn in loans advanced to its Tanzanian Subsidiary, due to alleged misrepresentation of the loan given that it had been non-performing for several years and that the subsidiary was deemed unable to repay the loan. As such, the company slipped to a negative equity position of Kshs 2.4 bn, effectively meaning a complete write-off for shareholders in the event of a liquidation, and that only secured lenders could be fully covered by the then Kshs 14.2 bn asset base. Proposed moves to look for a strategic investor such as several major companies like Dangote Cement and Oman Based Raylat limited did not bear fruit
Despite the Insolvency Act enabling the company to remain operational as it undertook the turnaround strategy, ARM failed to revive and the administrators only option was to sell the salvageable assets in an attempt to return value to the creditors and shareholders. In October 2019, National Cement, owned by the Devki Group, acquired all cement and non-cement assets and businesses of ARM Cement at a cost of Kshs 5.0 bn. However, this was still a drop in the ocean with the listed Cement manufacturer owing its creditors in upwards of Kshs 28.4 bn. In May 2020, ARM sold its Tanzania subsidiary Maweni Limestone Limited to a Chinese firm Huaxin Cement, in a deal priced at Kshs 11.9 bn. When it was clear that all creditors and shareholders’ demands could not be met, the administrators in April 2021 advised liquidation and subsequent delisting from the Nairobi Securities Exchange (NSE).
Disclosures made by PwC’s Muniu Thoithi and George Weru as at 31st July 2022 revealed that following liquidation, the net amount available for distribution to secured, preferential and unsecured creditors of ARM stood at USD 52.0 mn (Kshs 6.2 bn), with the creditors having suffered a combined shortfall in upwards of USD 100.0 mn (Kshs 11.9 bn). As a result, there would be no disbursement to shareholders. The disbursement is summarized in the table below;
|
Cytonn Report: ARM Cement Distribution to Creditors |
||||
|
Item |
Amount (Kshs bn) |
|||
|
Net realized amount from liquidation |
6.2 |
|||
|
Utilization of Funds |
||||
|
Item |
Amount Owed (Kshs bn) |
Amount Paid (Kshs bn) |
Amount Lost (Kshs bn) |
Haircut |
|
Preferential creditors |
0.3 |
0.3 |
- |
- |
|
Secured creditors |
8.3 |
5.5 |
2.8 |
33.7% |
|
Unsecured creditors |
9.0 |
0.7 |
8.3 |
92.2% |
|
Shareholders |
5.3* |
0 |
5.3 |
100.0% |
|
*Based on last traded price of Kshs 5.5 |
||||
Source: Administrator’s filings
In our view, had ARM gotten into administration earlier enough, shareholders value would not have been completely wiped out. This further emphasizes the need to rehabilitate a company rather that option for the liquidation option so as to ensure favourable outcomes to all the stake holders
- Nakumatt
Nakumatt Holdings is a Kenyan supermarket chain. Until February 2017, Nakumatt was regarded as the largest Kenyan retailer, with 62 branches across the region, (45 in Kenya, 9 in Uganda, 5 in Tanzania and 3 in Rwanda) and a gross turnover of Kshs 52.2 bn. However, what was fueling Nakumatt’s rapid expansion was funded through debt. This included short-term borrowings, bank loans and letters of credit to its numerous suppliers. Following the collapse of Imperial Bank, the Commercial Paper market, which Nakumatt had been relying on, dried up and Nakumatt started experiencing serious cash-flow difficulties in 2016. The retailer was therefore unable to meet its financial obligations to landlords, its suppliers and employees. It was for these reasons that the administrator was appointed by an order of the court pursuant to an application filed by unsecured creditors, and Nakumatt Holdings was placed under administration in January 2018.
Following the assessment of Nakumatt’s financial position, the administrator, PKF Consulting Limited (PKF) determined that if a liquidation route was used, then out of the total creditors with amounts worth Kshs 35.8 bn, Kshs 30.6 bn was unlikely to be paid. This represented a significant 85.0% potential loss to the creditors. In essence, all unsecured creditors, namely Trade Creditors, Commercial Paper Holders and Short Term Noteholders, as well as private placement loan providers would suffer the maximum 100% loss of their debt amounts, as the available assets would first pay off secured creditors. Since Nakumatt’s business model could support a better outcome for all the creditors as compared to a liquidation scenario, the Administrator set out to come up with a restructuring proposal to achieve this outcome based on the company remaining a going concern. Nakumatt’s administrator came back to creditors with proposals that the creditors were supposed to take a vote on. The creditors rejected the proposal which entailed a debt waiver and restructuring into equity in order to ease the debt burden for the company and turn the business around. The plan would have seen bank debt, Kenya Revenue Authority and Employee liabilities were treated as preferential creditors; thus exempting them from the 25.0% waiver that non-preferential creditors took on their debt, as well as the 75.0% debt to equity mandatory conversion.
In our view, he best-case scenario for all creditors was a debt to equity conversion of their creditor claims, as liquidation was not in the best interest of anyone. This should have included even the banks who had taken preferential debt. Case in point being, the recent restructuring of Kenya Airways. In the case of Kenya Airways’ restructuring, the Government and several banks converted their debt into equity to the tune of Kshs 59.0 bn. The Government’s stake in Kenya Airways rose to 46.5% from 29.8% before the debt to equity conversion, while the bank’s consortium (KQ Lenders Co.) ended up owning 35.7% of the company. Ordinary shareholders who did not inject additional equity were diluted by 95.0%.
- Hashi Energy
Hashi Energy started off as a Kerosene distributor for Chevron Kenya to supply Kerosene to Rwanda and DRC markets. In 2008, the company rebranded itself to Hashi Energy Ltd, with the core business being importation, distribution, and marketing of petroleum products through imports, exports, bulk trading, petroleum depots, distribution networks, and service stations. Hashi Energy’s operations extends from Kenya to Uganda, Rwanda, Tanzania, Zambia, Southern Sudan, the United Arab Emirates, Mauritius and the Democratic Republic of Congo. In 2017, Hashi Energy sold off its petrol stations to Lake Oil, a company incorporate in Tanzania. The move came after Hashi Energy inked a deal with a Dubai conglomerate worth USD 140 mn, to supply food and fuel military personnel’s and non-governmental organizations in Democratic republic of Congo. The company has been under financial distress and on the gazette dated 10th March 2023, the company issued a notice to its creditors inviting them to a meeting to consider and pass a resolution for the company to be wound up voluntarily. The resolution was passed and KVSK Sastry was appointed as the liquidator to implement the resolution from its meeting. From the information available, the company owes Ecobank a total of USD 5.0 bn (Kshs 7.2 bn), with the bank seeking to sell off the company’s assets to recover is debt.
In our view, the appointed liquidator should work on resolving disputes arising between the company and Eco bank through open and constructive negotiation and mediation so as to streamline the voluntary liquidation process that had been initiated by the company on March 2023. This will ensure the planned auction does not interfere with the intended goal of the company meeting its objective. Additionally, the sale of the company’s properties through auction, may results in realizing less amount than intended in the event of lack of competitive bids
Summary of Various Insolvencies:
The table below shows a summary table of various insolvencies in Kenya;
|
Cytonn Report: Data on Various Insolvencies |
|||||||
|
Company |
Amount Owed (Kshs bn) |
Amount Recovered (Kshs bn) |
Recovery % |
Total Haircut |
|||
|
Secured |
Unsecured |
Secured |
Unsecured |
Secured |
Unsecured |
||
|
Kaluworks |
9.1 |
3.5 |
2.7 |
* |
29.7% |
* |
78.6% |
|
ARM Cement |
8.3 |
9.0 |
5.5 |
0.7 |
66.3% |
7.8% |
64.2% |
|
Nakumatt |
5.2 |
30.6 |
5.2 |
0.0 |
100.0% |
0.0% |
85.5% |
|
Tuskys |
* |
19.6 |
* |
6.7 |
* |
34.2% |
65.8% |
|
Chase Bank bond |
|
4.8 |
|
0.0 |
|
0.0% |
100.0% |
|
Imperial Bank bond |
|
2.0 |
|
0.0 |
|
0.0% |
100.0% |
|
Britania Foods |
1.3 |
* |
* |
* |
* |
* |
* |
|
Average |
|
82.3% |
|||||
|
*Not disclosed |
|||||||
Source: Cytonn Research
Section VI: Challenges facing insolvency practice
While insolvency practitioners play an important role in rehabilitation and maximizing the value of the debtor’s assets, the practice involve a number of challenges such as:
- Poor track record – the biggest challenge with insolvency in Kenya today is a poor track record, there is not a single case of successful restructuring. The Insolvency Act was to supposed to lead to a better outcome for creditors and all stakeholders, with a view to preserving maximum value, jobs and tax base. However, the insolvency regime has proven to be more of an orderly winddown or bankruptcy process; the only advantage over the previous regime is that the winddown or bankruptcy is orderly, but the benefits of business survival are yet to be realized.
- Getting into administration too late – Most companies goes through the administration route when their situations are so dire that there is little or no hope of recovery or returning the company back to its profitability. This limits the available options for restructuring to turn around the company hence leading the focus to shift to liquidation rather than rehabilitation. Early involvement allows insolvency practitioners to explore a wider range of potential solutions, such as debt restructuring, refinancing, or negotiations with creditors. Additionally, the longer a company operates in financial distress, the more likely its assets may deteriorate or become devalued. This lead the practitioner with a weaker leverage position to negotiate favourable terms with creditors, suppliers and stakeholders. Kaluworks started experiencing financial challenges in 2020 and therefore got into administration at a favourable time in 2021. After 1 year they were able to get out of the administration process with both the creditors and company agreeing on term suitable to all stakeholders, which has led the company to remain operation,
- Liquidation being most popular option – the lack of knowledge around administration given that most creditors, and even regulators and businesses, are yet to understand or accept administration as a legitimate business restructuring option. Compared to other restructuring option, liquidation provides a clear and definitive outlook due to its simplicity and therefore creditors, suppliers and stakeholders have a straightforward process of how the value will be realized and distributed. Additionally, the liquidation process is faster compared to the other restructuring process and thus preferred by most creditors. In the case of ARM, it started in 2018 and ended in 2022, almost 5 years, this can only be beneficial to the service providers around the administration, and not the creditors. It would be helpful if administrations were conducted and closed as fast as possible,
- High Insolvency costs – Insolvency process requires engaging professionals such as lawyers and accountants, who may demand a significant amount of fees to offer their services. This may end up eating into the value that the creditors will receive, given that such services are given first claim preferential priority once the value for the business will be realized. As was the case with ARM, spending Kshs 2.5 bn on administration costs is too high, given that it was over 40.3% of amount recovered. It is important the administration costs are kept low to ensure creditors recover meaningful amounts and service providers align with the interest of creditors,
- Managing Stakeholders Interests - Insolvency practitioners often need to balance the interests of various stakeholders, including creditors, shareholders, employees, and regulators. Conflicting interests can make decision-making and negotiations challenging. In the case of Nakumatt, the retail creditors who held the commercial paper were not collaborative with the administrator and insisted on either full refunds or liquidation. They ended up with 100.0% loss, yet an equity restructuring would have given them value, which is now being enjoyed by competitors such as Carrefour,
- Complexity of Cases - Insolvency cases can be extremely complex, involving multiple stakeholders, intricate financial structures, and various legal and operational issues. Managing and unraveling these complexities requires a high level of expertise and experience. Additionally, Insolvency practitioners handles large volumes of information which may be time consuming and delay them in achieving their objectives,
- Economic Uncertainties - Economic instability and uncertainty can lead to an increase in business failures, resulting in higher demand for insolvency services. However, predicting economic trends accurately can be challenging, making it difficult for insolvency practitioners to anticipate and plan for their workload. This weighs down on the success rate of insolvency practitioners as some challenges are beyond their control
- Negative publicity around administration - Administration especially when not well understood by all stakeholders, poses as a risk to the business continuity. This is because the process often attracts negative publicity and uncertainty which deals inadvertent blows to the business and may lead to total collapse, and
- Lack of good will from companies in distress – Transparent and accurate information is crucial for making informed decisions and developing effective strategies. However, there are a number of instances that insolvency practitioners have stated that they there is lack cooperation with companies in distress in terms of sharing information with them. This leads to the insolvency practitioner to have limited understanding of the company’s financial health and consequently lead them to make impaired decisions. The Office of the official receiver has also noted that there are rising cases where company owners obtain court injunctions just to stall the process as they strip company assets during which litigation drags in court
Section VII: Recommendations and Conclusions
Improving insolvency practice involves addressing various aspects of the process to enhance efficiency, transparency, stakeholder cooperation, and overall effectiveness. This include:
- Need for a success story to change the narrative – there is urgent need for a success story to change the negative perception of the industry as business undertakers
- Early Intervention - Addressing financial distress early can lead to more viable and cost-effective solutions. Timely action might help prevent the situation from deteriorating further and becoming more complex,
- Transparent Communication - Clear and open communication among stakeholders and insolvency professionals can help streamline processes and avoid misunderstandings that might lead to additional costs,
- Efficient Asset Realization - Developing a well-thought-out strategy for selling assets can help maximize returns and minimize associated costs. Efficient marketing and sales processes can reduce unnecessary expenses,
- Appropriate Professional Selection - Selecting experienced and reputable insolvency professionals with relevant restructuring experience and who offer reasonable fees can help manage costs while still ensuring high-quality services,
- Streamline Regulatory Frameworks - Governments and regulatory bodies can work to create clear and consistent insolvency regulations that facilitate efficient processes while ensuring creditor protection and fair treatment of stakeholders
In conclusion, the Insolvency Act of 2015 seeks to create a more robust and effective insolvency framework in Kenya, foster a conducive business environment, and protect the interests of all stakeholders involved in the insolvency process. It provides a mechanism to restructure debts, reduce financial pressures, and maintain business continuity. However, the success of a restructuring process depends on the company's ability to adhere to the repayment plan, gain creditor support, and effectively implement its restructuring efforts.
Disclaimer: The views expressed in this publication are those of the writers where particulars are not warranted. This publication, which is in compliance with Section 2 of the Capital Markets Authority Act Cap 485A, is meant for general information only and is not a warranty, representation, advice or solicitation of any nature. Readers are advised in all circumstances to seek the advice of a registered investment advisor.

- Talk to us
- Kenya
- P.O Box 20695 - 00200, Nairobi, Kenya
- Cell +254709101200
- Tel +254709101200
- WhatsApp +254741676635
- United States
- +254709101200
- DOWNLOAD OUR APP
-


- Kenya
- 8th Floor, Pinetree Plaza, Kaburu Drive, Ngong Road, Nairobi, Kenya
- USA
- Suite 1150, 1775 Eye Street NW, USA, Washington DC 20006, USA
- Investments
- High Yield
- Private Equity
- Real Estate
- Real Estate
- RiverRun Estates
- Cytonn Towers
- The Ridge
- Taraji Heights
- The Alma