Retirement Benefit Schemes Q3’2024 Performance Report and Cytonn Weekly #49/2024
By Research Team, Dec 8, 2024
Executive Summary
Fixed Income
During the week, T-bills were oversubscribed for the tenth consecutive week, with the overall oversubscription rate coming in at 176.3%, albeit lower than the oversubscription rate of 211.1% recorded the previous week. Investors’ preference for the shorter 91-day paper persisted, with the paper receiving bids worth Kshs 18.9 bn against the offered Kshs 4.0 bn, translating to an oversubscription rate of 473.2%, slightly higher than the oversubscription rate of 470.4% recorded the previous week. The subscription rates for the 182-day and 364-day papers decreased to 67.6% and 166.2% respectively, from to 104.2% and 214.2% recorded the previous week. The government accepted a total of Kshs 42.2 bn worth of bids out of Kshs 42.3 bn bids received, translating to an acceptance rate of 99.8%. The yields on the government papers were on a downward trajectory, with the yields on the 364-day, 182-day and 91-day papers decreasing by 52.3 bps, 78.9 bps and 79.4 bps to 12.0%, 10.5% and 10.5% respectively, from 12.5%, 11.3% and 11.3% respectively recorded the previous week;
Also, during the week, the Central Bank of Kenya (CBK) released released the auction results for the re-opened bonds, FXD1/2023/010 with a tenor to maturity of 8.1 years, and a fixed coupon rate of 14.2% and FXD1/2018/020 with a tenor to maturity of 13.2 years, and a fixed coupon rate of 13.2%. The bonds were oversubscribed with the overall subscription rate coming in at 285.3%, receiving bids worth Kshs 71.3 bn against the offered Kshs 25.0 bn. The government accepted bids worth Kshs 53.4 bn, translating to an acceptance rate of 74.9%. The weighted average yield for the accepted bids for the FXD1/2023/010 came in at 14.7% which was above our expectation of within a bidding range of 13.20%-13.75%, while the of the FXD1/2018/020 came in at 15.1%, below our expectation of within a bidding range of 16.35%-16.55%. Notably, the 14.7% yield on the FXD1/2023/010 was lower than the 16.0% rate recorded on the last sale in November 2024, while the yield on the FXD1/2018/020 was higher than the 13.2% recorded the last time it was offered in December 2021. With the Inflation rate at 2.8% as of November 2024, the real return of the FXD1/2023/010 and the FXD1/2018/020 is 11.9% and 12.3% respectively;
During the week, the Monetary Policy Committee met on to review the outcome of its previous policy decisions against a backdrop of improved global outlook for growth, easing in inflation in advanced economies as well as the persistent geopolitical tensions. The MPC decided to lower the CBR rate by 75.0 bps to 11.25%, from 12.00% which was in line with our expectation for the MPC to lower the CBR rate;
Also, during the week, Stanbic Bank released its monthly Purchasing Manager's Index (PMI) highlighting that the index for the month of November 2024 improved, coming in at 50.9, up from 50.4 in October 2024, signaling a mild recovery in business conditions. This is majorly attributable to stable fuel prices and a decrease in borrowing costs, which resulted to the increase sales to its strongest performance in six months;
Equities
During the week, the equities market recorded a mixed performance, with NASI, NSE 10 and NSE 25 gaining by 3.3%, 3.0% and 2.5% respectively, while NSE 20 declined by 1.6%, taking the YTD performance to gains of 32.2%, 31.5%, 25.3% and 21.4% for NSE 10, NSE 25, NASI and NSE 20 respectively. The equities market performance was mainly driven by gains recorded by large-cap stocks such as DTBK, Safaricom and EABL of 12.6%, 8.3%, and 3.8% respectively. The gains were however weighed down by loses recorded by large-cap stocks such as Bamburi and KCB of 10.7%, and 1.2% respectively;
Also, during the week, the Capital Markets Authority (CMA) notified the shareholders of Bamburi Cement PLC and the public that Savannah clinker limited had withdrawn its competing offer for acquisition of Bamburi Cement PLC shares. This is on the back of the arrest of the chairman and the main shareholder of the company, Mr. Benson Ndeta, coupled with the decline by the Capital Markets Authority (CMA) of a request made on 2 December 2024, to extend the offer period by 60 days to enable the competing offer to respond to any inquiries. Following this development, the only valid offer for Bamburi Cement Plc shares is from Amsons Industries (K) Limited, as approved by CMA without modifications;
Real Estate
During the week, President William Ruto launched the construction works for the upgrading to Bitumen standards of Taita town roads in Taita Taveta County. The proposed 7.5 Kilometers road will be funded by the government through the Road Maintenance Fuel Levy (RMLF) at a total cost of Ksh 1.3bn and the project is set to link the JKUAT (Proposed Taveta branch) to Eldoro township to Mrabani Primary School in Taita.
Additionally, the president launched the upgrading to bitumen standard of 25 kilometers Cess (Nghonji)-Rekeke-Lake Jipe Road, Cessi, Taita Taveta County. The road is expected to boost the agricultural activities in the area by facilitating efficiency in transportation of farm produce, support fishing around lake Jipe and enhance tourism by connecting the county of Kwale to Tsavo West National Park and Lake Jipe.
Also, during the week, President William Ruto launched the last Mile Electricity Connectivity project in Wundanyi, Taita Taveta County which aims to connect rural and underserved areas in the country with Electricity.
During the week, President William Ruto launched the 2,000-acre Vipingo Free Trade Zone (VFTZ) in Kilifi County, a transformative project expected to create over 50,000 jobs over the next decade. Developed in partnership with Arise Integrated Industrial Platforms, the VFTZ will accommodate over 200 industries spanning across agriculture processing, logistics, manufacturing and pharmaceuticals, among other sectors. In line with these efforts Centum Investment Company Plc was granted a permit to operate a Special Economic Zone (SEZ) in Vipingo, Kilifi County. This designation covers 637.3 Ha of land and positions Kilifi as a leading hub for SEZs, with 10 out of the 39 approved nationwide located in the coastal region.
On the Unquoted Securities Platform, Acorn D-REIT and I-REIT traded at Kshs 25.4 and Kshs 22.2 per unit, respectively, as per the last updated data on 31st October 2024. The performance represented a 27.0% and 11.0% gain for the D-REIT and I-REIT, respectively, from the Kshs 20.0 inception price. Additionally, ILAM Fahari I-REIT traded at Kshs 11.0 per share as of 31st October 2024, representing a 45.0% loss from the Kshs 20.0 inception price;
Focus of the Week
According to the ACTSERV Q3’2024 Pension Schemes Investments Performance Survey, the ten-year average return for segregated schemes over the period 2015 to 2024 was 7.7% with the performance fluctuating over the years reflective of the markets performance. Notably, segregated retirement benefits scheme returns increased to 0.4% return in Q3’2024, up from the 2.9% loss recorded in Q3’2023. The y/y growth in overall returns was largely driven by the 3.0% points increase in returns from Offshore investments to 4.7% from 1.7% in Q3’2023 as well as the 2.1% gain from equities attributable to the positive returns realized from the banking sector stocks. This was however a 6.2% points decline from the overall return of 6.6% recorded in Q2’2024. This week, we shall focus on understanding Retirement Benefits Schemes and look into the quarterly performance and current state of retirement benefits schemes in Kenya with a key focus on Q3’2024;
Investment Updates:
- Weekly Rates: Cytonn Money Market Fund closed the week at a yield of 17.97 % p.a. To invest, dial *809# or download the Cytonn App from Google Play store here or from the Appstore here;
- We continue to offer Wealth Management Training every Tuesdays, from 7:00 pm to 8:00 pm. The training aims to grow financial literacy among the general public. To register for any of our Wealth Management Trainings, click here;
- If interested in our Private Wealth Management Training for your employees or investment group, please get in touch with us through wmt@cytonn.com;
- Cytonn Insurance Agency acts as an intermediary for those looking to secure their assets and loved ones’ future through insurance namely; Motor, Medical, Life, Property, WIBA, Credit and Fire and Burglary insurance covers. For assistance, get in touch with us through insuranceagency@cytonn.com;
- Cytonn Asset Managers Limited (CAML) continues to offer pension products to meet the needs of both individual clients who want to save for their retirement during their working years and Institutional clients that want to contribute on behalf of their employees to help them build their retirement pot. To more about our pension schemes, kindly get in touch with us through pensions@cytonn.com;
Hospitality Updates:
- We currently have promotions for Staycations. Visit cysuites.com/offers for details or email us at sales@cysuites.com;
Money Markets, T-Bills Primary Auction:
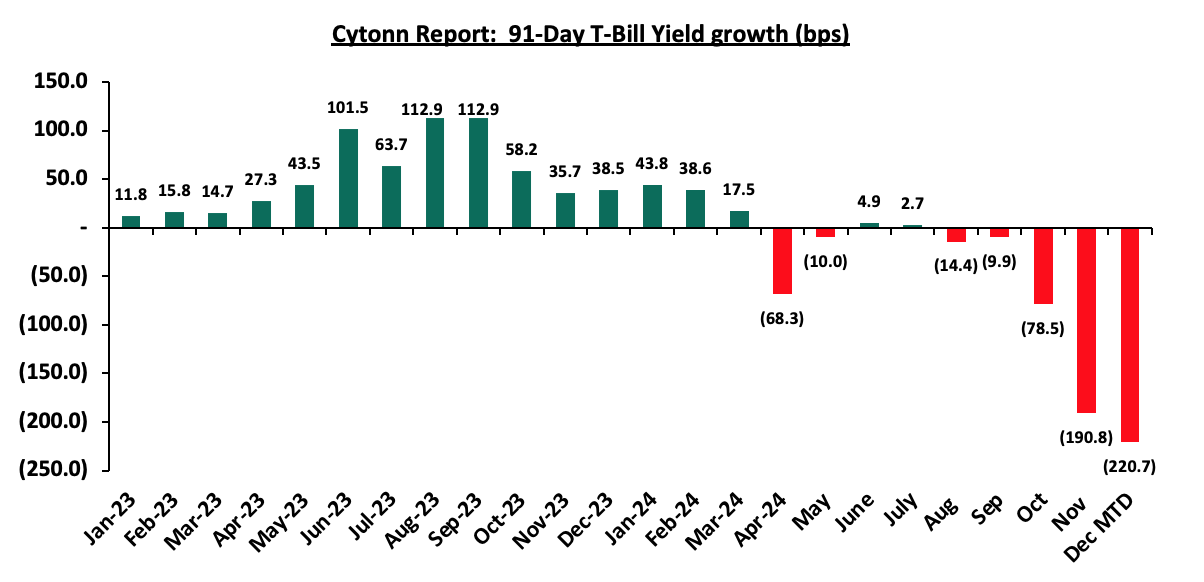
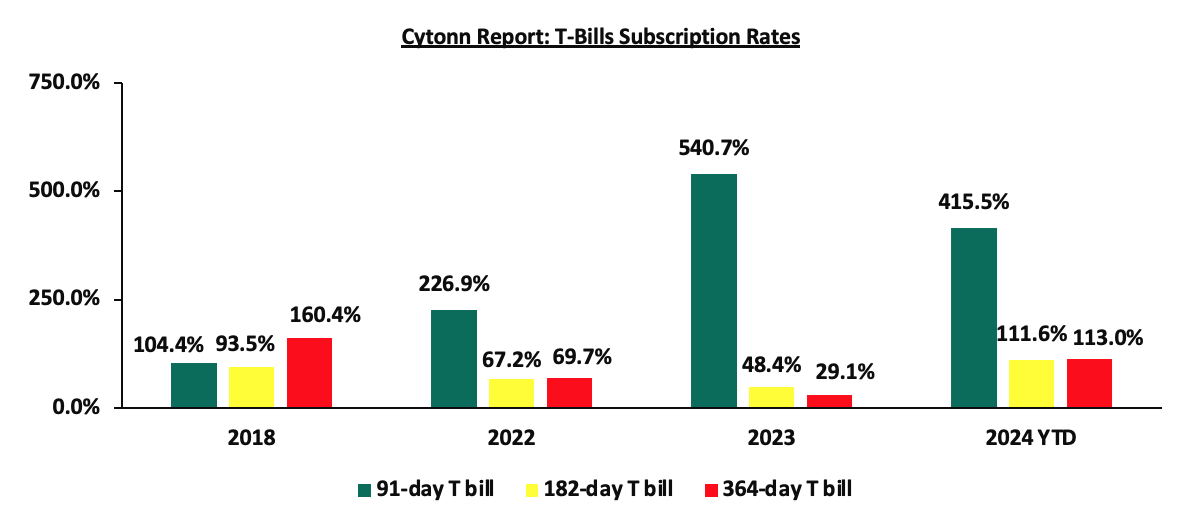
During the week, T-bills were oversubscribed for the tenth consecutive week, with the overall oversubscription rate coming in at 176.3%, albeit lower than the oversubscription rate of 211.1% recorded the previous week. Investors’ preference for the shorter 91-day paper persisted, with the paper receiving bids worth Kshs 18.9 bn against the offered Kshs 4.0 bn, translating to an oversubscription rate of 473.2%, slightly higher than the oversubscription rate of 470.4% recorded the previous week. The subscription rates for the 182-day and 364-day papers decreased to 67.6% and 166.2% respectively, from to 104.2% and 214.2% recorded the previous week. The government accepted a total of Kshs 42.2 bn worth of bids out of Kshs 42.3 bn bids received, translating to an acceptance rate of 99.8%. The yields on the government papers were on a downward trajectory, with the yields on the 364-day, 182-day and 91-day papers decreasing by 52.3 bps, 78.9 bps and 79.4 bps to 12.0%, 10.5% and 10.5% respectively, from 12.5%, 11.3% and 11.3% respectively recorded the previous week.
The chart below compares the overall average T-bill subscription rates obtained in 2018, 2022, 2023, and 2024 Year-to-date (YTD):
Also, during the week, the Central Bank of Kenya (CBK) released released the auction results for the re-opened bonds, FXD1/2023/010 with a tenor to maturity of 8.1 years, and a fixed coupon rate of 14.2% and FXD1/2018/020 with a tenor to maturity of 13.2 years, and a fixed coupon rate of 13.2%. The bonds were oversubscribed with the overall subscription rate coming in at 285.3%, receiving bids worth Kshs 71.3 bn against the offered Kshs 25.0 bn. The government accepted bids worth Kshs 53.4 bn, translating to an acceptance rate of 74.9%. The weighted average yield for the accepted bids for the FXD1/2023/010 came in at 14.7% which was above our expectation of within a bidding range of 13.20%-13.75%, while the of the FXD1/2018/020 came in at 15.1%, below our expectation of within a bidding range of 16.35%-16.55%. Notably, the 14.7% yield on the FXD1/2023/010 was lower than the 16.0% rate recorded on the last sale in November 2024, while the yield on the FXD1/2018/020 was higher than the 13.2% recorded the last time it was offered in December 2021. With the Inflation rate at 2.8% as of November 2024, the real return of the FXD1/2023/010 and the FXD1/2018/020 is 11.9% and 12.3% respectively.
Money Market Performance:
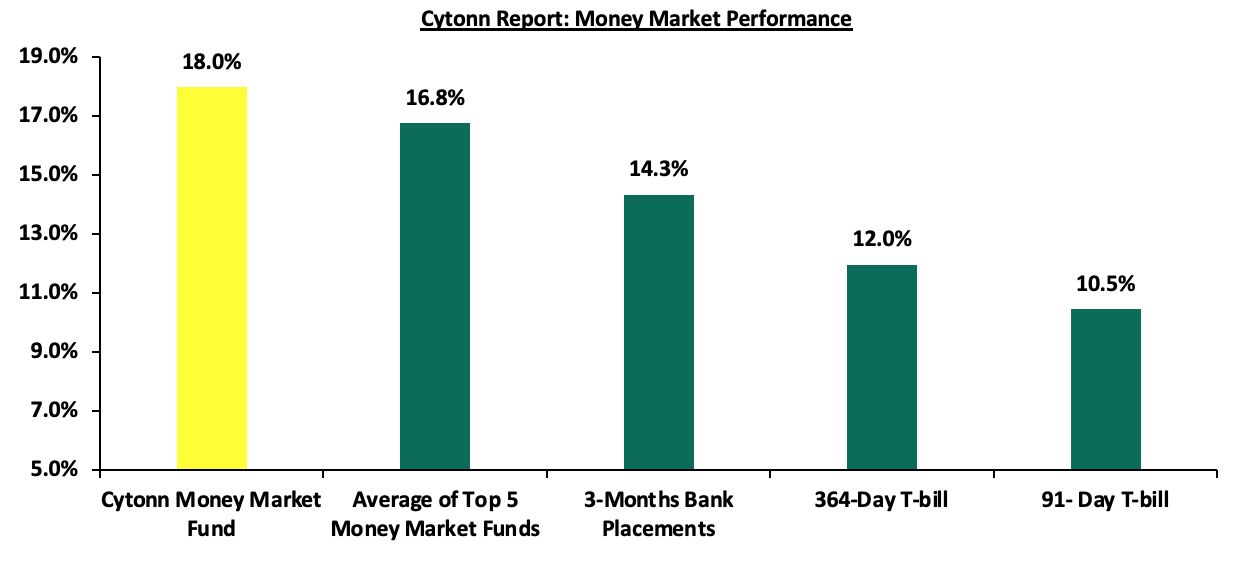
In the money markets, 3-month bank placements ended the week at 14.3% (based on what we have been offered by various banks), and the yields on the government papers were on a downward trajectory, with the yields on the 364-day and 91-day papers decreasing by 52.3 bps and 79.4 bps to 12.0% and 10.5% respectively, from 12.5% and 11.3% respectively recorded the previous week. The yields on the Cytonn Money Market Fund decreased marginally by 6 bps to close the week at 18.0%, relatively unchanged from the previous week, while the average yields on the Top 5 Money Market Funds decreased by 9.8 bps to close the week at 16.8%, from 16.9% recorded the previous week.
The table below shows the Money Market Fund Yields for Kenyan Fund Managers as published on 6th November 2024:
|
Cytonn Report: Money Market Fund Yield for Fund Managers as published on 6th December 2024 |
||
|
Rank |
Fund Manager |
Effective Annual Rate |
|
1 |
Cytonn Money Market Fund (Dial *809# or download the Cytonn app) |
18.0% |
|
2 |
Lofty-Corban Money Market Fund |
16.9% |
|
3 |
Etica Money Market Fund |
16.6% |
|
4 |
Gulfcap Money Market Fund |
16.3% |
|
5 |
Arvocap Money Market Fund |
16.1% |
|
6 |
Kuza Money Market fund |
16.0% |
|
7 |
Ndovu Money Market Fund |
15.5% |
|
8 |
Mali Money Market Fund |
15.2% |
|
9 |
Jubilee Money Market Fund |
14.9% |
|
10 |
Orient Kasha Money Market Fund |
14.7% |
|
11 |
KCB Money Market Fund |
14.6% |
|
12 |
Mayfair Money Market Fund |
14.5% |
|
13 |
Faulu Money Market Fund |
14.4% |
|
14 |
Sanlam Money Market Fund |
14.3% |
|
15 |
Madison Money Market Fund |
14.3% |
|
16 |
Nabo Africa Money Market Fund |
14.2% |
|
17 |
Genghis Money Market Fund |
14.1% |
|
18 |
Enwealth Money Market Fund |
14.1% |
|
19 |
Dry Associates Money Market Fund |
13.8% |
|
20 |
Apollo Money Market Fund |
13.7% |
|
21 |
Co-op Money Market Fund |
13.7% |
|
22 |
GenAfrica Money Market Fund |
13.7% |
|
23 |
Old Mutual Money Market Fund |
13.4% |
|
24 |
British-American Money Market Fund |
13.4% |
|
25 |
ICEA Lion Money Market Fund |
13.3% |
|
26 |
Absa Shilling Money Market Fund |
13.1% |
|
27 |
CIC Money Market Fund |
13.0% |
|
28 |
AA Kenya Shillings Fund |
12.6% |
|
29 |
Stanbic Money Market Fund |
12.3% |
|
30 |
Equity Money Market Fund |
8.7% |
Source: Business Daily
Liquidity:
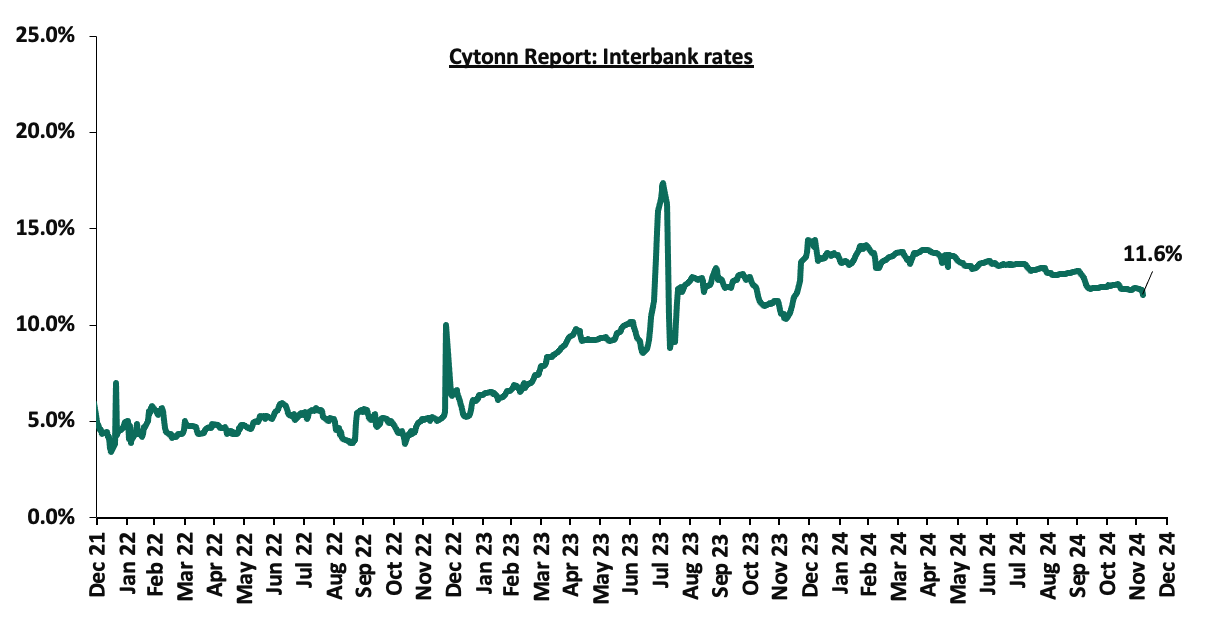
During the week, liquidity in the money markets marginally eased, with the average interbank rate decreasing by 10.5 bps, to 11.8% from the 11.9% recorded the previous week, partly attributable to government payments that offset tax remittances. The average interbank volumes traded increased significantly by 89.1% to Kshs 43.2 bn from Kshs 22.8 bn recorded the previous week. The chart below shows the interbank rates in the market over the years:
Kenya Eurobonds:
During the week, the yields on Eurobonds were on a downward trajectory, with the yields on the 7-year Eurobond issued in 2019 decreasing the most by 46.4 bps to 7.7% from 8.1% recorded the previous week. The table below shows the summary of the performance of the Kenyan Eurobonds as of 5th December 2024;
|
Cytonn Report: Kenya Eurobonds Performance |
||||||
|
|
2018 |
2019 |
2021 |
2024 |
||
|
Tenor |
10-year issue |
30-year issue |
7-year issue |
12-year issue |
13-year issue |
7-year issue |
|
Amount Issued (USD) |
1.0 bn |
1.0 bn |
0.9 bn |
1.2 bn |
1.0 bn |
1.5 bn |
|
Years to Maturity |
3.2 |
23.2 |
2.5 |
7.5 |
9.6 |
6.2 |
|
Yields at Issue |
7.3% |
8.3% |
7.0% |
7.9% |
6.2% |
10.4% |
|
01-Jan-24 |
9.8% |
10.2% |
10.1% |
9.9% |
9.5% |
|
|
02-Dec-24 |
8.6% |
8.6% |
7.9% |
9.7% |
10.1% |
9.8% |
|
28-Nov-24 |
8.7% |
8.6% |
8.1% |
9.8% |
10.1% |
9.9% |
|
29-Nov-24 |
8.6% |
8.6% |
8.0% |
9.7% |
10.1% |
9.8% |
|
02-Dec-24 |
8.6% |
8.6% |
7.9% |
9.7% |
10.1% |
9.8% |
|
03-Dec-24 |
8.6% |
8.8% |
7.9% |
9.7% |
10.1% |
9.7% |
|
04-Dec-24 |
8.6% |
8.8% |
7.8% |
9.6% |
10.0% |
9.6% |
|
05-Dec-24 |
8.4% |
8.6% |
7.7% |
9.5% |
9.9% |
9.5% |
|
Weekly Change |
(0.3%) |
(0.0%) |
(0.5%) |
(0.3%) |
(0.2%) |
(0.4%) |
|
MTD Change |
(0.2%) |
(0.0%) |
(0.3%) |
(0.2%) |
(0.2%) |
(0.3%) |
|
YTD Change |
(1.4%) |
(1.6%) |
(2.5%) |
(0.4%) |
0.4% |
- |
Source: Central Bank of Kenya (CBK) and National Treasury
Kenya Shilling:
During the week, the Kenya Shilling appreciated against the US Dollar by 28.9 bps, to close the week at Kshs 129.3, from the Kshs 129.7 recorded the previous week. On a year-to-date basis, the shilling has appreciated by 17.6% against the dollar, a contrast to the 26.8% depreciation recorded in 2023.
We expect the shilling to be supported by:
- Diaspora remittances standing at a cumulative USD 4,804.1 mn in the 12 months to October 2024, 15.3% higher than the USD 4,165.1 mn recorded over the same period in 2023, which has continued to cushion the shilling against further depreciation. In the October 2024 diaspora remittances figures, North America remained the largest source of remittances to Kenya accounting for 56.7% in the period, and,
- The tourism inflow receipts which came in at USD 352.5 bn in 2023, a 31.5% increase from USD 268.1 bn inflow receipts recorded in 2022, and owing to tourist arrivals that improved by 14.9% in the 12 months to October 2024, compared to a similar period in 2023.
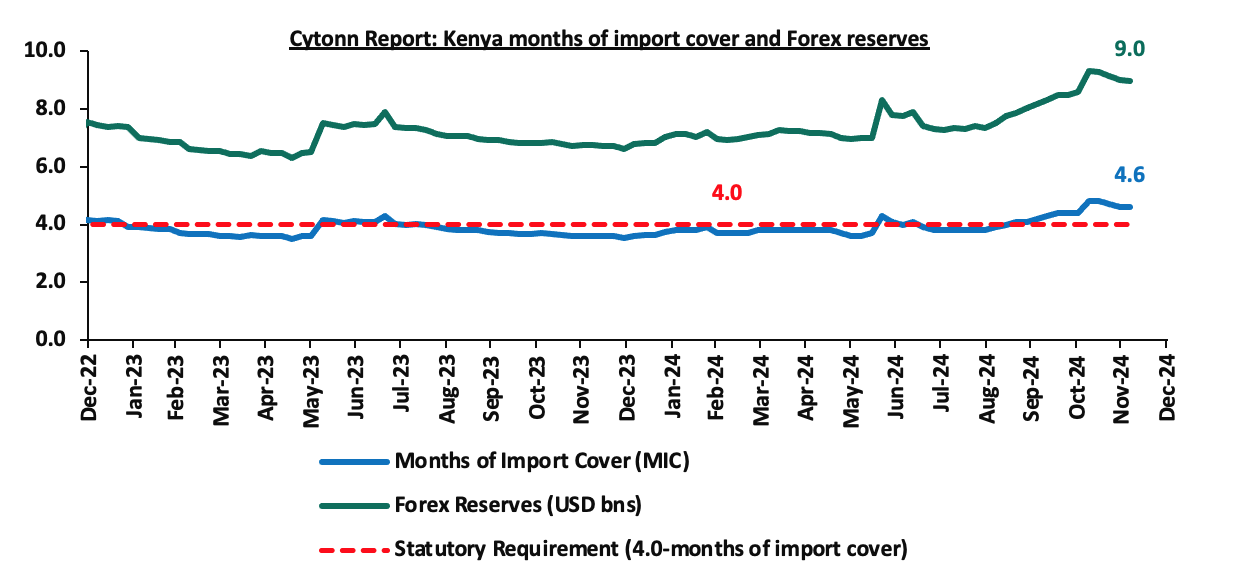
- Improved forex reserves currently at USD 9.0 bn (equivalent to 4.6-months of import cover), which is above the statutory requirement of maintaining at least 4.0-months of import cover and the EAC region’s convergence criteria of 4.5-months of import cover.
The shilling is however expected to remain under pressure in 2024 as a result of:
- An ever-present current account deficit which came at 3.8% of GDP in Q2’2024 from 3.7% recorded in Q2’2023, and,
- The need for government debt servicing, continues to put pressure on forex reserves given that 67.2% of Kenya’s external debt is US Dollar-denominated as of June 2024.
Key to note, Kenya’s forex reserves declined marginally by 0.4% during the week, remaining relatively unchanged from the USD 9.0 bn recorded in the previous week, equivalent to 4.6 months of import cover, and above to the statutory requirement of maintaining at least 4.0-months of import cover. The recent increase in forex reserves is primarily attributed to the disbursement from the International Monetary Fund (IMF). On October 30, 2024, the IMF approved a combined disbursement of around USD 606.1 mn following the successful completion of Kenya’s seventh and eighth reviews under the Extended Fund Facility (EFF), Extended Credit Facility (ECF), and Resilience and Sustainability Facility (RSF) arrangements. The chart below summarizes the evolution of Kenya's months of import cover over the years:
Weekly Highlights:
- Monetary Policy Committee (MPC) December meeting
During the week, the monetary policy committee met on December 5th, 2024, to review the outcome of its previous policy decisions against a backdrop of improved global outlook for growth, easing in inflation in advanced economies as well as the persistent geopolitical tensions. The MPC decided to lower the CBR rate by 75.0 bps to 11.25%, from 12.00% which was in line with our expectation for the MPC to lower the CBR rate. Our expectation to cut the rate was mainly on the back of rate cuts by some major economies, a stable exchange rate, anchored inflationary pressures, with inflation coming in at 2.8% in November 2024, marginally up from 2.7% in October, remaining within the CBK preferred range of 2.5%-7.5% for the seventeenth consecutive month, as well as the need to support the economy by adopting an accommodative policy that will ease financing activities. Key to note, the MPC had cut the CBR rate to 12.00% in the previous meeting in October from 12.75%. Below are some of the key highlights from the December meeting:
- The overall inflation increased marginally by 0.1% points to 2.7% in November 2024, from 2.7% in October 2024, positioning it below the mid-point of the preferred CBK range of 2.5%-7.5%, mainly driven by the decline in fuel inflation. Fuel inflation decreased by 1.6% in November 2024 from 1.7% decrease in October 2024, largely attributable to a downward adjustment in pump prices and lower electricity tariffs. The food inflation rose by 0.2% points to 4.5% in November from 4.3% recorded in October, attributable largely to a modest rise in non-vegetables price inflation attributed to higher prices of a few items particularly cooking oil. The non-food non-fuel inflation slightly decreased by 0.1% points to 3.2% in November 2024 from 3.3% in October 2024, reflecting muted demand pressures in the economy. We expect the overall inflation to remain below the mid-point of the target range in the near term, supported by lower food inflation owing to improved supply from the ongoing harvests, a stable exchange rate, and stable fuel prices,
- The recently released Quarterly Gross Domestic Product Report, for Q2’2024 showed a slowdown in the performance of the Kenyan economy, with real GDP growing by 4.8%, although slower than the growth of 5.5% recorded a similar period in 2023. This was attributable to deceleration in growth in most sectors of the economy, particularly agriculture and forestry, real estate, financial and insurance, information and communication, and transport and storage. The economy is expected to continue to strengthen in 2024, supported by resilient services sector, sustained performance in agriculture, and enhanced exports. However, this positive outlook is tempered by potential risks, including geopolitical tensions.
- Goods exports increased by 11.9% in the 12 months to October 2024, compared to a similar period in 2023, reflecting a rise in exports of agricultural commodities and re-exports. Receipts from tea and fruits & vegetables exports increased by 2.1% and 16.8% respectively, while re-exports grew by 73.5% in the period. Notably, exports increased 15.0% in the first ten months of 2024 compared to the same period in 2023. Imports increased by 7.9% in the 12 months to October 2024 compared to a similar period in 2023, mainly reflecting increases in intermediate and capital goods. In addition, imports increased by 9.6% in the first ten months of 2024 compared to the same period in 2023. Tourist arrivals improved by 14.9% in the 12 months to October 2024, compared to a similar period in 2023. Additionally, remittances totalled USD 4,804.0 million in the 12 months to October 2024 and were 15.3% higher compared to USD 4,165.0 million in a similar period in 2023. The current account deficit is estimated at 3.8% of GDP in the 12 months to October 2024, up from 3.7% of GDP in a similar period in 2023, and is projected at 4.0% of GDP in 2024, remaining unchanged from 2023, reflecting improvement in exports of agricultural products, sustained remittances, recovery in imports supported by stable exchange rate and effects of regional trade integration initiatives.
- The CBK foreign exchange reserves, which currently stand at USD 8,966 mn representing 4.6 months of import cover, continue to provide adequate cover and a buffer against any short-term shocks in the foreign exchange market,
- The banking sector remains stable and resilient, with strong liquidity and capital adequacy ratios. The ratio of gross non-performing loans (NPLs) to gross loans decreased to 16.5% in October 2024 compared to 16.7% in August 2024. Decreases in NPLs were noted in the manufacturing, energy and water, financial services and agriculture sectors. Banks have continued to make adequate provisions for the NPLs,
- The CEOs Survey and Market Perceptions Survey conducted ahead of the MPC meeting revealed a sustained optimism about business activity and economic growth prospects for the next 12 months. The optimism was attributed to the stable macroeconomic environment reflected in the low inflation rate and stability in the exchange rate, expectations of a decline in interest rates, continued strong performance of agriculture, resilience of the services sector, and improved global growth prospects. Nevertheless, respondents expressed concerns about high cost of doing business, subdued consumer demand, and high cost of credit,
- The Survey of the Agriculture Sector for November 2024 revealed an expectation for inflation to either remain unchanged or decrease in the next three months, on account of improved food supply with the ongoing harvests, the stable exchange rate, and reductions in pump prices,
- Global growth is expected to continue to recover and is projected at 3.2% in 2024, attributable to strong growth in the United States, strong growth in some large emerging market economies such as India, and improved growth prospects in the United Kingdom. Additionally, headline inflation rates have moderated, with central banks in some major economies including the US Federal Reserve lowering their interest rates. Food inflation has risen slightly, mainly driven by higher edible oil prices. International oil prices have moderated, but the risk of potential volatility remains elevated due to heightened geopolitical tensions.
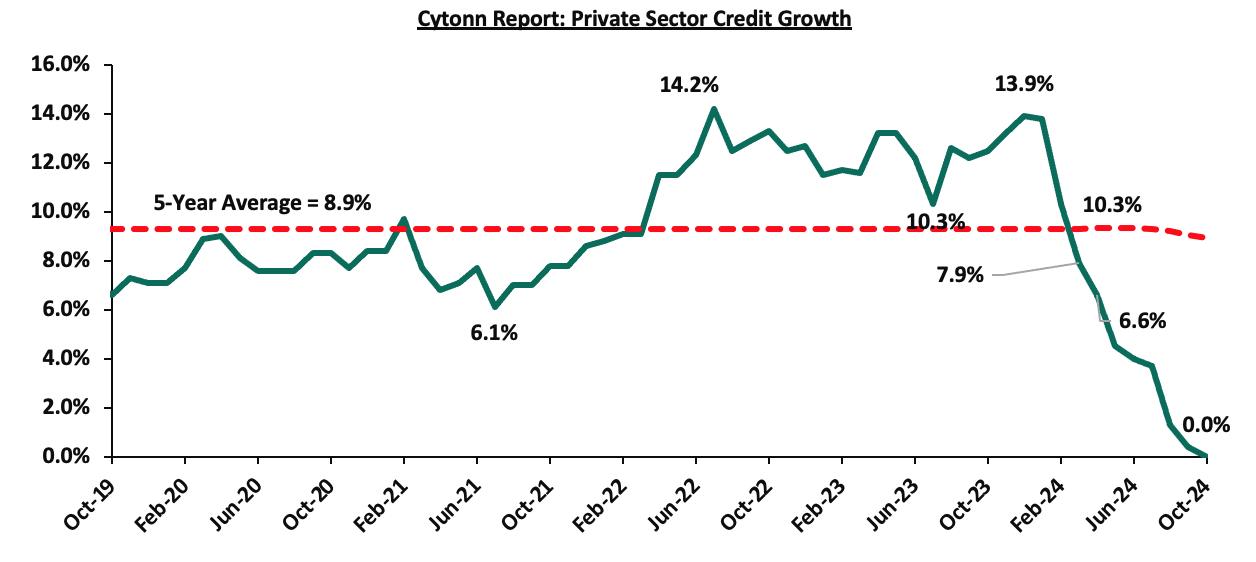
- Growth in private sector credit remained broadly unchanged in October 2024 compared to the previous year, largely due to the decline in foreign currency-denominated loans, which outweighed the modest growth in local currency loans due to the appreciation of the Shilling. In October, local currency loan growth stood at 4.0%, while foreign currency loans, which make up around 26.0% of total loans, decreased by 11.8%. A weighted average analysis indicates an overall contraction of approximately 0.1%, highlighting the significant impact of the decline in foreign currency loans on overall credit growth. The chart below shows the movement of the private sector credit growth over the last five years:
- The Committee acknowledged the ongoing implementation of the FY’2024/25 Supplementary Budget I. These measures are anticipated to further support fiscal consolidation, reducing the fiscal deficit to 4.3% of GDP in FY’2024/25, from 5.2% of GDP in FY’2023/24. The fiscal consolidation in the medium-term should reduce debt vulnerabilities while moving the present-value-of-debt to GDP ratio towards the target anchor of 55.0%.
The MPC noted that its previous measures have successfully reduced overall inflation to below the mid-point of the target range of 2.5% - 7.5%, stabilized the exchange rate, and anchored inflationary expectations. The Committee also noted a moderation in NFNF inflation, while central banks in several major economies have reduced interest rates in response to easing inflationary pressures, with signs that others may soon follow suit. Consequently, the MPC concluded that there was scope for a gradual easing of monetary policy, while maintaining exchange rate stability, which we expect to gradually ease the interest rates in the country. The MPC will closely monitor the impact of its policy measures, as well as developments in the global and domestic economy, and stands ready to take further action as necessary in line with its mandate. We anticipate that the reduction in the CBR rate will start to lower borrowing costs, leading to increased spending and an uptick in the business environment as well as reduced debt servicing costs for the government, as the MPC closely monitors inflation and exchange rate stability to ensure the continuation of the current trend of stability and eased inflation. The Committee will meet again in February 2025.
- Stanbic Bank’s November 2024 Purchasing Manager’s Index (PMI)
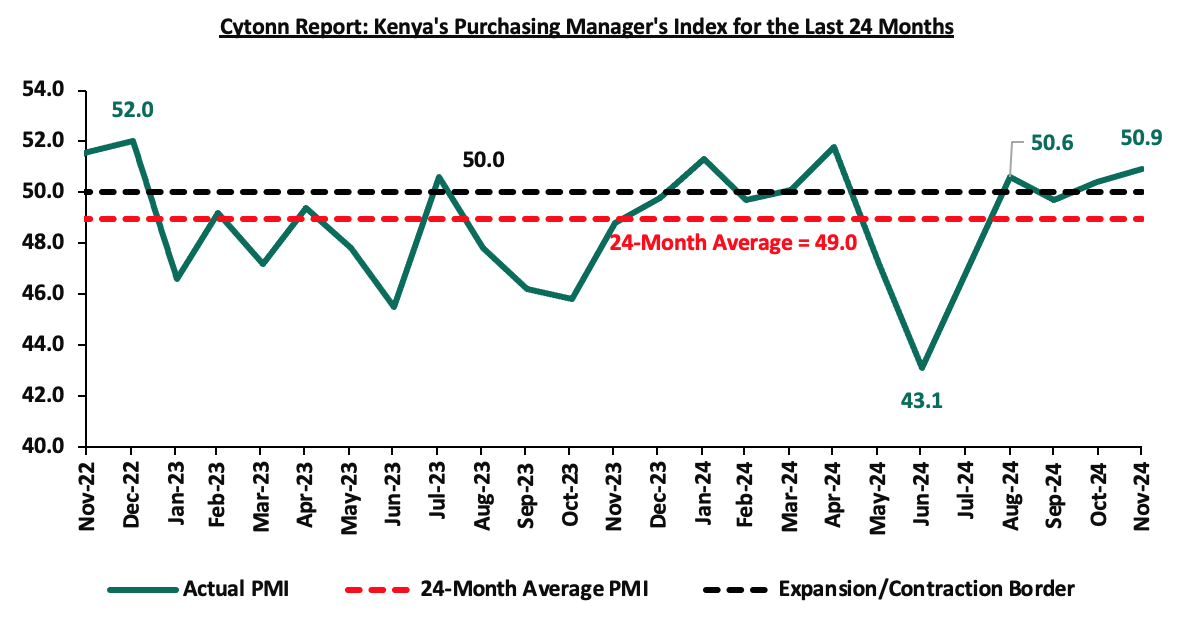
During the week, Stanbic Bank released its monthly Purchasing Manager's Index (PMI) highlighting that the index for the month of November 2024 improved, coming in at 50.9, up from 50.4 in October 2024, signaling a mild recovery in business conditions. This is majorly attributable to stable fuel prices and a decrease in borrowing costs, which resulted to the increase sales to its strongest performance in six months.
Kenyan firms experienced improved business conditions midway through Q4’2024, with sales growing at their fastest pace since May. This growth drove a moderate increase in output and stronger purchasing activity. New order volumes also rose moderately, supported by higher customer spending and increased travel. The growth was primarily concentrated in the services and wholesale & retail sectors, while agriculture, manufacturing, and construction saw declines in new orders.
The overall rise in sales, marking the strongest performance in six months, fueled an expansion in private sector activity during November. Output growth accelerated compared to October, surpassing the series average. The increased demand for output drove a significant boost in purchasing activity, reaching its fastest pace since September 2022.
However, despite the growth in sales, job creation across the economy remained subdued in November. While some firms hired additional staff due to higher workloads and increased marketing budgets, the majority maintained stable workforce levels. Meanwhile, outstanding work volumes edged upward following a decline in October.
On prices, the latest survey data pointed to an acceleration of input cost inflation in the private sector, with the y/y inflation for the month of November increasing marginally by 0.1% to 2.8% from the 2.7% recorded in October. Overall costs increased at the fastest pace in three months, which firms largely attributed to greater taxes on purchased items.
Business expectations remained relatively weak and softened slightly since the start of the fourth quarter. Just 8.0% of firms expect activity to rise over the next 12 months, with comments relating positivity to new marketing, digital technologies and branch openings.
The chart below summarizes the evolution of PMI over the last 24 months:
Going forward, we anticipate that the business environment will improve in the short to medium term as a result of the improving economic environment driven by lower interest rates following the easing monetary policy, the stability of the Kenyan Shilling against the USD and the easing inflation, which is currently at its lowest in years and stable fuel prices. However, we expect businesses to be weighed down by the high cost of living coupled with the high taxation, which are set to increase input costs.
Rates in the Fixed Income market have been on a downward trend given the continued low demand for cash by the government and the improved liquidity in the money market. The government is 162.9% ahead of its prorated net domestic borrowing target of Kshs 180.6 bn, and 16.3% ahead of the total FY’2024/25 net domestic borrowing target of Kshs 408.4 bn, having a net borrowing position of Kshs 474.9 bn. However, we expect a continued downward readjustment of the yield curve in the short and medium term, with the government looking to increase its external borrowing to maintain the fiscal surplus, hence alleviating pressure in the domestic market. As such, we expect the yield curve to normalize in the medium-term and hence investors are expected to shift towards the long-term papers to lock in the high returns.
Market Performance:
During the week, the equities market recorded a mixed performance, with NASI, NSE 10 and NSE 25 gaining by 3.3%, 3.0% and 2.5% respectively while NSE 20 declined by 1.6%, taking the YTD performance to gains of 32.2%, 31.5%, 25.3% and 21.4% for NSE 10, NSE 25, NASI and NSE 20 respectively. The equities market performance was mainly driven by gains recorded by large-cap stocks such as DTBK, Safaricom and EABL of 12.6%, 8.3%, and 3.8% respectively. The gains were however weighed down by loses recorded by large-cap stocks such as Bamburi and KCB of 10.7%, and 1.2% respectively;
During the week, equities turnover decreased by 26.2% to USD 14.8 mn from USD 20.0 mn recorded the previous week, taking the YTD turnover to USD 583.5 mn. Foreign investors remained net sellers for the ninth consecutive week, with a net selling position of USD 7.9 mn, from a net selling position of USD 2.8 mn recorded the previous week, taking the YTD net selling position to USD 15.4 mn.
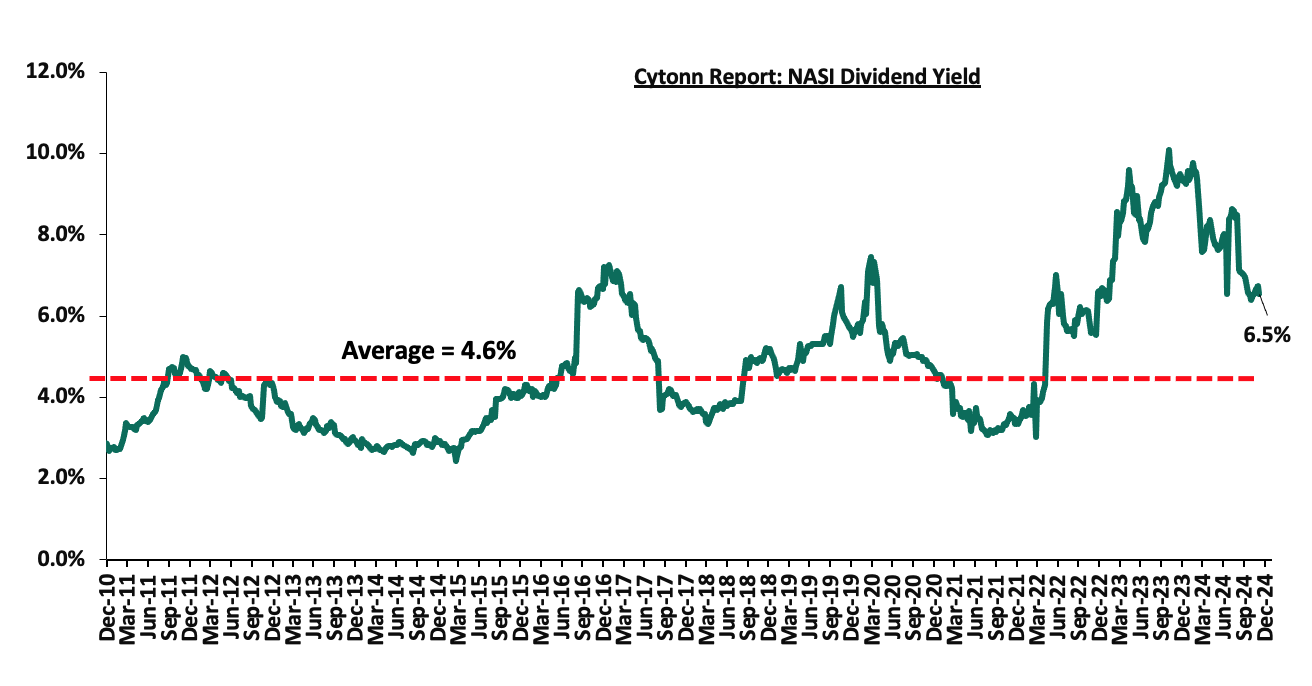
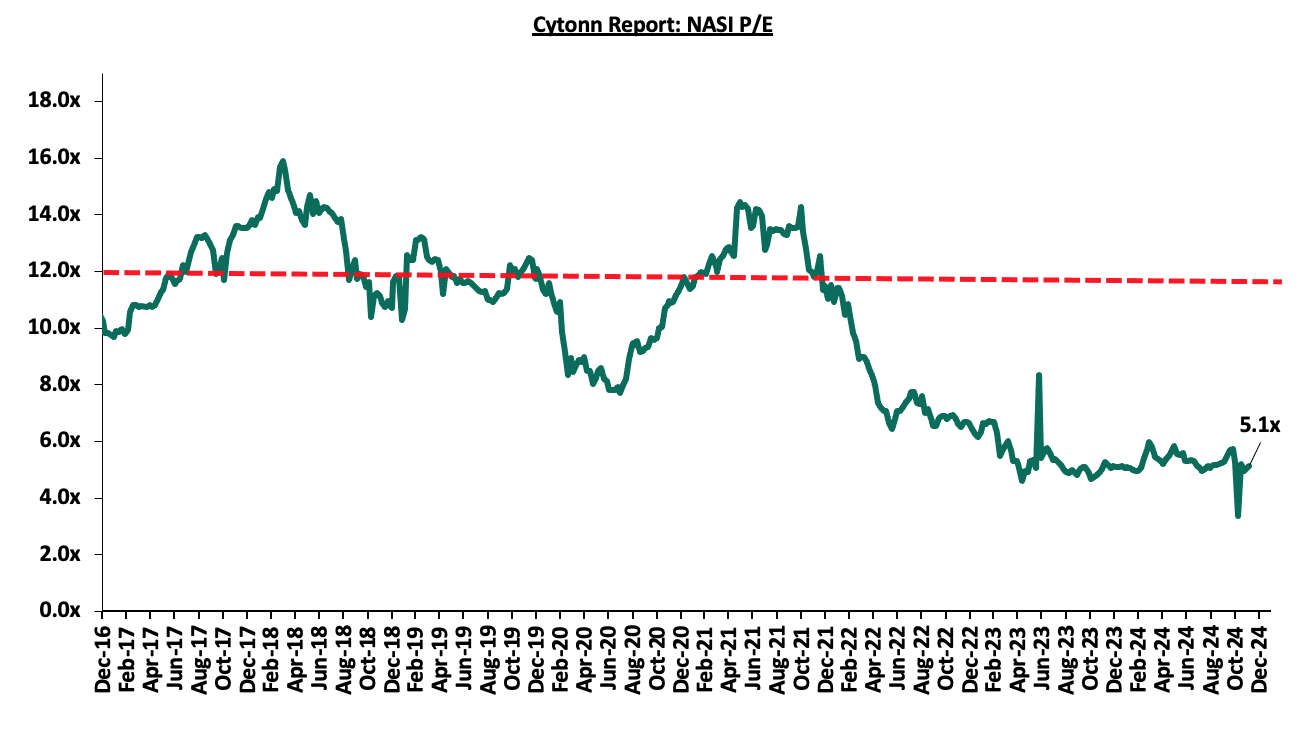
The market is currently trading at a price-to-earnings ratio (P/E) of 5.1x, 56.1% below the historical average of 11.7x, and a dividend yield of 6.5%, 1.9% points above the historical average of 4.6%. Key to note, NASI’s PEG ratio currently stands at 0.6x, an indication that the market is undervalued relative to its future growth. A PEG ratio greater than 1.0x indicates the market may be overvalued while a PEG ratio less than 1.0x indicates that the market is undervalued.
The charts below indicate the historical P/E and dividend yields of the market;
Universe of Coverage:
|
Cytonn Report: Equities Universe of Coverage |
||||||||||
|
Company |
Price as at 29/11/2024 |
Price as at 06/12/2024 |
w/w change |
YTD Change |
Year Open 2024 |
Target Price* |
Dividend Yield*** |
Upside/ Downside** |
P/TBv Multiple |
Average |
|
Jubilee Holdings |
172.0 |
172.5 |
0.3% |
(6.8%) |
185.0 |
260.7 |
8.3% |
59.9% |
628.8 |
Buy |
|
CIC Group |
2.0 |
2.0 |
0.0% |
(10.9%) |
2.3 |
2.8 |
6.4% |
43.6% |
3.2 |
Buy |
|
Equity Group |
45.0 |
45.4 |
0.9% |
32.7% |
34.2 |
60.2 |
8.9% |
42.7% |
50.9 |
Buy |
|
NCBA |
43.2 |
44.6 |
3.4% |
14.8% |
38.9 |
55.2 |
11.0% |
38.9% |
54.0 |
Buy |
|
ABSA Bank |
15.0 |
15.1 |
1.0% |
30.7% |
11.6 |
18.9 |
10.4% |
36.8% |
12.6 |
Buy |
|
Co-op Bank |
13.8 |
14.2 |
2.9% |
25.1% |
11.4 |
17.2 |
10.9% |
35.5% |
21.7 |
Buy |
|
Diamond Trust Bank |
53.5 |
60.3 |
12.6% |
34.6% |
44.8 |
65.2 |
9.3% |
31.2% |
262.6 |
Buy |
|
KCB Group |
38.4 |
38.0 |
(1.2%) |
72.9% |
22.0 |
50.3 |
0.0% |
31.0% |
65.0 |
Buy |
|
Britam |
6.0 |
6.0 |
0.0% |
16.3% |
5.1 |
7.5 |
0.0% |
25.4% |
7.3 |
Buy |
|
Stanbic Holdings |
130.0 |
130.0 |
0.0% |
22.6% |
106.0 |
145.3 |
11.8% |
23.6% |
147.9 |
Buy |
|
Standard Chartered Bank |
243.3 |
250.3 |
2.9% |
56.2% |
160.3 |
260.9 |
11.9% |
19.2% |
149.6 |
Accumulate |
|
I&M Group |
30.1 |
30.8 |
2.2% |
76.2% |
17.5 |
31.4 |
8.5% |
12.8% |
48.8 |
Accumulate |
|
*Target Price as per Cytonn Analyst estimates **Upside/ (Downside) is adjusted for Dividend Yield ***Dividend Yield is calculated using FY’2023 Dividends |
||||||||||
Weekly Highlights
- Withdrawal of Savannah Clinker Limited competing offer Highlight
During the week, the Capital Markets Authority (CMA) notified the shareholders of Bamburi Cement PLC and the public that Savannah clinker limited had withdrawn its competing offer for acquisition of Bamburi Cement PLC shares. This is on the back of the arrest of the chairman and the main shareholder of the company, Mr. Benson Ndeta, coupled with the decline by the Capital Markets Authority (CMA) of a request made on 2 December 2024, to extend the offer period by 60 days to enable the competing offer to respond to any inquiries. Following this development, the only valid offer for Bamburi Cement Plc shares is from Amsons Industries (K) Limited, as approved by CMA without modifications
On 10 July 2024, Bamburi Cement PLC received a notice of intent from Amsons Industries (K) Limited, a subsidiary of Tanzanian conglomerate Amsons Group, to pursue the acquisition of up to 100.0% of the Company's ordinary shares at an offer price of KES 65.0 per share or a total of KES 23.5 billion. On 227th August 2024, Savannah Clinker Limited submitted a competing bid to acquire 100.0% of the shares in Bamburi Cement PLC at an offer price of KES 70.00. Savannah Clinker's competitive bid prompted Holcim, a Switzerland-based construction company and majority stakeholder in Bamburi PLC with a 58.6% stake, to revoke its binding agreement to sell its shares to Amsons Group. Following this development, Savannah increased its offer to a bid of KES 76.55 per share from KES 70.00. Savannah Clinker is a private company established in 2019 and primarily engages in mining, processing, and selling cement. This bid reflects Savannah's strategic dedication to increasing Bamburi's value while maintaining its listing on the Nairobi Securities Exchange (NSE). Savannah's takeover bid ensures shareholders can continue benefiting from future market opportunities, with a commitment to keeping the cement maker listed on the NSE. The table below shows a comparison of the two offers;
|
|
Item |
Savannah Offer |
Amsons Offer |
|
1 |
Price |
KES 76.55 per Share |
Kes 65.00 Per share |
|
2 |
Long stop Date for the Completion |
28th February 2025 |
28th November 2025 |
|
3 |
Conditions of the Offers |
· Approval of the transfer of mining licenses · Approval by the Competition Authority of Kenya · Subject to acceptances by holders of at least 60.0% of the issued shares of Bamburi |
· Approval of the Transfer of mining licenses · Approval by COMESA Competition Authority · Approval by East African Competition Commission (EACC), if required under law · Subject to the delivery of acceptances as set out in the Offer Document
|
|
4 |
Special Dividend in relation to the proceeds received from the completed divestments of Bamburi's shareholding in Hima Cement Limited,Uganda(if any) |
Same as in Offer |
Paid to existing shareholders
|
|
5 |
2024 Dividend |
Same as in Offer |
Payable to the shareholders of Bamburi if the Offer does not close by 23.59 hours Nairobi time on 30 June 2025
|
Bamburi Cement Plc a Kenya-based company specializing in the production and distribution of cement and related products. It has a market cap of 17.1 billion with Holcim being the biggest shareholder with a 58.6% stake. Holcim’s two investments vehicles in Bamburi are Fincem Holdinggs Limited and Kencem Holdings Limited with 29.3% shareholdings each in Bamburi Cement. The table below shows top shareholders;
|
Shareholder |
No of shares |
Percentage of shareholders |
|
Fincem Holding Limited |
106,360,798.00 |
29.30% |
|
Kencem Holding Limited |
106,360,797.00 |
29.30% |
|
Standard Chartered Nominees |
56,906,640.00 |
15.68% |
|
Aksaya Investment Holdings |
14,956,990.00 |
4.12% |
|
Standard Chartered Nominees |
6,659,900.00 |
1.83% |
|
Standard Chartered Kenya Nominees |
4,080,337.00 |
1.12% |
|
Standard Chartered Nom Non resident |
2,768,400.00 |
0.76% |
|
Standard Chartered Nom |
2,607,700.00 |
0.72% |
|
Standard Chartered Kenya Nominees |
2,187,900.00 |
0.60% |
|
ICEA Lion Life Assurance Company |
2,055,663.00 |
0.57% |
|
Others (4,599 Shareholders) |
58,014,150.00 |
15.98% |
|
Total Shares Issued |
362,959,275.00 |
100.00% |
Following this development, the only valid offer for Bamburi Cement Plc shares is from Amsons Industries (K) Limited, as approved by CMA without modifications. The price of Bamburi stock closed at KES 56.5 on Thursday ahead of its suspension from trading in NSE in order to facilitate reconciliation and the suspension will be for a period to be determined by CMA and NSE. The current share price represents 10.7% depreciation from the KES 62.3 traded the previous week and 56.9% gain on year to date.
Amsons group has been approved for Bamburi takeover by Ministry of Mining, Blue Economy and Maritime Affairs for its proposed acquisition of up to 100% shares of Bamburi Cement Plc. This approval follows the prior unconditional clearance from the COMESA Competition Commission. The Ministry of Mining approved the Katani Mining License (Registration Number ML/2017/0011) under the Mining Act, and the COMESA Competition Commission verified that the transaction aligns with regional competition regulations. Amsons is ready to conclude the transaction, ushering in a new era of growth for Bamburi Cement Plc. With the support of KCB Investment Bank, Amsons is dedicated to ensuring a smooth closing process, including timely payments to shareholders who accept the offer, enabling them to realize the value of their investment in Bamburi Cement Plc.
We are “Neutral” on the Equities markets in the short term due to the current tough operating environment and huge foreign investor outflows, and, “Bullish” in the long term due to current cheap valuations and expected global and local economic recovery. With the market currently being undervalued for its future growth (PEG Ratio at 0.6x), we believe that investors should reposition towards value stocks with strong earnings growth and that are trading at discounts to their intrinsic value. We expect the current foreign investors’ sell-offs to continue weighing down the equities outlook in the short term.
- Infrastructure Development
During the week, President William Ruto launched the construction works for the upgrading to Bitumen standards of Taita town roads in Taita Taveta County. The proposed 7.5 Kilometers road will be funded by the government through the Road Maintenance Fuel Levy (RMLF) at a total cost of Ksh 1.3bn and the project is set to link the JKUAT (Proposed Taveta branch) to Eldoro township to Mrabani Primary School in Taita. The Ministry of Roads and Transport highlights that the projects are in line with the Government’s Bottom-Up Economic Transformation Agenda (BETA) specifically aiming to improve accessibility to agricultural land and public institutions in Taita Taveta County.
The project is expected to be complete by August 2025 and will create more than 180 job opportunities for the locals, improve the transport network to agricultural zones, improve the drainage systems and uplift livelihoods of local residents.
Additionally, the president launched the upgrading to bitumen standard of 25 kilometers Cess (Nghonji)-Rekeke-Lake Jipe Road, Cessi, Taita Taveta County. The road is expected to boost the agricultural activities in the area by facilitating efficiency in transportation of farm produce, support fishing around lake Jipe and enhance tourism by connecting the county of Kwale to Tsavo West National Park and Lake Jipe.
Also, during the week, President William Ruto launched the last Mile Electricity Connectivity project in Wundanyi, Taita Taveta County in line with the project aims to connect rural areas underserved with Electricity. This initiative comes after the president secured a total of Ksh 27.0 bn from the European Union, the European Investment Bank and the Agence Francaise de Development (AFD) in May 2024 with an aim of connecting more than 280,000 households from 32 Counties to the grid subsequently accelerating the attainment of vision 2030.
We expect that this initiative may boost local economies through job creation and better access to power. Additionally, it may improve the quality of life in Wundanyi areas through access to reliable electricity for their schools and health facilities.
- Industrial Sector
During the week, President William Ruto launched the 2,000-acre Vipingo Free Trade Zone (VFTZ) in Kilifi County, a transformative project expected to create over 50,000 jobs over the next decade. Developed in partnership with Arise Integrated Industrial Platforms, the VFTZ will accommodate over 200 industries spanning across agriculture processing, logistics, manufacturing and pharmaceuticals, among other sectors. The project is set to begin in 2025, with already a 600-acre designed masterplan to attract investors and promote industrialization.
In line with these efforts Centum Investment Company Plc was granted a permit to operate a Special Economic Zone (SEZ) in Vipingo, Kilifi County. This designation covers 637.3 Ha of land and positions Kilifi as a leading hub for SEZs, with 10 out of the 39 approved nationwide located in the coastal region. Centum aims to attract industries and subsequently drive economic growth through exports and job creation. The dual initiatives of the VFTZ and Centum’s SEZ highlight the region’s growing importance in the country’s industrial sector.
We expect that together the VFTZ and SEZ initiatives will create significant employment opportunities, boost export competitiveness and attract international and local investments,
- Real Estate Investments Trusts (REITs)
On the Unquoted Securities Platform, Acorn D-REIT and I-REIT traded at Kshs 25.4 and Kshs 22.2 per unit, respectively, as per the last updated data on 31st October 2024. The performance represented a 27.0% and 11.0% gain for the D-REIT and I-REIT, respectively, from the Kshs 20.0 inception price. The volumes traded for the D-REIT and I-REIT came in at Kshs 12.3 mn and Kshs 31.6 mn shares, respectively, with a turnover of Kshs 311.5 mn and Kshs 702.7 mn, respectively, since inception in February 2021. Additionally, ILAM Fahari I-REIT traded at Kshs 11.0 per share as of 31st October 2024, representing a 45.0% loss from the Kshs 20.0 inception price. The volume traded to date came in at 138,600 for the I-REIT, with a turnover of Kshs 1.5 mn since inception in November 2015.
REITs offer various benefits, such as tax exemptions, diversified portfolios, and stable long-term profits. However, the ongoing decline in the performance of Kenyan REITs and the restructuring of their business portfolios are hindering significant previous investments. Additional general challenges include:
- Insufficient understanding of the investment instrument among investors leading to a slower uptake of REIT products,
- Lengthy approval processes for REIT creation,
- High minimum capital requirements of Kshs 100.0 mn for REIT trustees compared to Kshs 10.0 mn for pension funds Trustees, essentially limiting the licensed REIT Trustee to banks only
- The rigidity of choice between either a D-REIT or and I-REIT forces managers to form two REITs, rather than having one Hybrid REIT that can allocate between development and income earning properties
- Limiting the type of legal entity that can form a REIT to only a trust company, as opposed to allowing other entities such as partnerships, and companies,
- We need to give time before REITS are required to list – they would be allowed to stay private for a few years before the requirement to list given that not all companies maybe comfortable with listing on day one, and,
- Minimum subscription amounts or offer parcels set at Kshs 0.1 mn for D-REITs and Kshs 5.0 mn for restricted I-REITs. The significant capital requirements still make REITs relatively inaccessible to smaller retail investors compared to other investment vehicles like unit trusts or government bonds, all of which continue to limit the performance of Kenyan REITs.
We expect the performance of Kenya’s Industrial sector to remain resilient supported by several factors:
i) the rising demand for data centers in the country, ii) an increasing demand for cold rooms, especially in the Nairobi Metropolitan Area, iii) demand for quality warehouses due to the growing e-commerce business in the country, iv) support from the government, as evidenced by the establishment of Special Economic Zones (SEZ) and Export Processing Zones (EPZ), v) increased development activities by industry players such as ALP Africa Logistics, vi) Kenya’s continued recognition as a regional hub, hence attracting international investors, and, vii) efforts by the government to support agricultural and horticultural products in the international market. Vii) Government increased investment in infrastructural projects.
According to the ACTSERV Q3’2024 Pension Schemes Investments Performance Survey, the ten-year average return for segregated schemes over the period 2015 to 2024 was 7.7% with the performance fluctuating over the years reflective of the markets performance. Notably, segregated retirement benefits scheme returns increased to 0.4% return in Q3’2024, up from the 2.9% loss recorded in Q3’2023. The y/y growth in overall returns was largely driven by the 3.0% points increase in returns from Offshore investments to 4.7% from 1.7% in Q3’2023 as well as the 2.1% gain from equities attributable to the positive returns realized from the banking sector stocks. This was however a 6.2% points decline from the overall return of 6.6% recorded in Q2’2024. This week, we shall focus on understanding Retirement Benefits Schemes and look into the quarterly performance and current state of retirement benefits schemes in Kenya with a key focus on Q3’2024.
In our previous report, we highlighted that treasury data revealed that for the FY’2023/2024, Kshs 23.8 bn of pension perks were not released to pensioners, citing liquidity challenges. This was in violation of the fiscal requirement to treat pension payments as the first charge in the budget and affected at least 250,000 retirees. This brought back to light the biggest challenge that the country’s civil servants' pension system has had, the overreliance on the exchequer for payment of benefits. The Government had operated a defined benefits (non-contributory) Pension Scheme since independence fully financed through the Exchequer. Given the clear challenges that this system had and the need for reforms in the Public Service Pensions Sector, the Government enacted the Public Service Superannuation Scheme Act 2012. The Act set up the Public Service Superannuation Scheme in 2021, converting all the defined benefit schemes in the public sector to one defined contributions scheme to align with the best practices in the industry. The now new system took in all government officers below 45 years, and gave those above that age the option to join the new system while closing any new entrants to the previous system. Currently, employees in the scheme contribute 7.5% of their basic salary, while the government contributes 15.0%. The scheme is currently managed by Gen Africa Asset Managers, and of the latest data, has assets under management of Kshs 78.8 bn. Given the country’s fiscal constraints, the older pension scheme is likely to remain under pressure until the new system fully kicks in.
We have been tracking the performance of Kenya’s Pension schemes with the most recent topicals being, Retirement Benefits Schemes Q2’2024 Performance Report, Kenya Retirement Benefits Schemes Q1’2024, Performance Kenya Retirement Benefits Schemes Q4’2023 Performance, Progress of Kenya’s Pension Schemes-2022 and Kenya Retirement Benefits Schemes FY’2021 Performance. This week, we shall focus on understanding Retirement Benefits Schemes and looking into the historical and current state of retirement benefits schemes in Kenya with a key focus on 2023 (latest official data) and what can be done going forward. We shall also analyze other asset classes such as REITs that the schemes can tap into to achieve higher returns. Additionally, we shall look into factors and challenges influencing the growth of the RBSs in Kenya as well as the actionable steps that can be taken to improve the pension industry. We shall do this by looking into the following:
- Introduction to Retirement Benefits Schemes in Kenya,
- Historical and Current State of Retirement Benefits Schemes in Kenya,
- Factors Influencing the Growth of Retirement Benefits Scheme in Kenya,
- Challenges that Have Hindered the Growth of Retirement Benefit Schemes, and,
- Recommendations on Enhancing the Performance of Retirement Benefits Schemes in Kenya;
Section I: Introduction to Retirement Benefits Schemes in Kenya
A retirement benefits scheme is a savings avenue that allows contributing individuals to make regular contributions during their productive years into the scheme and thereafter get income from the scheme upon retirement. There are a number of benefits that accrue to retirement benefits scheme members, including:
- Income Replacement – Retirement savings ensure that your income stream does not stop even when you stop working. After retirement, many people experience a decline in the amount and stability of income relative to their productive years. Retirement savings ensure that this decline is manageable or non-existent and enables you to be able to live the lifestyle you desire even after retirement,
- Compounded and Tax-free interest – Savings in a pension scheme earn compounded interest which means that your money grows faster as the interest earned is reinvested. Additionally, retirement schemes’ investments are tax-exempt meaning that the schemes have more to reinvest,
- Tax-exempt contributions – Pension contributions enjoy a monthly tax relief of up to Kshs 20,000 or 30.0% of your salary whichever is less – this lessens the total PAYE deducted from your earnings,
- Avoid old age poverty – By providing an income in retirement, pension schemes ensure that the scheme members do not experience old age poverty where they have to rely on their family, relatives, and friends for survival, and,
- Home Ownership - Savings in a pension scheme can help you achieve your dream of owning a home. This can be done through a mortgage or a direct residential house purchase using your pension savings. A member may assign up to 60.0% of their pension benefits or the market value of the property, whichever is less, to provide a mortgage guarantee. The guarantee may enable the member to acquire immovable property on which a house has been erected, erect a house, add, or carry out repairs to a house, secure financing or waiver, as the case may be, for deposits, stamp duty, valuation fees and legal fees and any other transaction costs required. On the other hand, a pension scheme member may utilize up to 40.0% of their benefits to purchase a residential house directly subject to a maximum allowable amount of Kshs 7.0 mn and the amount they use should not exceed the buying price of the house.
Section II: Historical and the Current State of Retirement Benefits Schemes in Kenya
- Growth of Retirement Benefits Schemes
According to the latest Retirement Benefits Authority (RBA) Industry Report for June 2024, assets under management for retirement benefits schemes increased by 14.7% to Kshs 2.0 tn in June 2024 from the Kshs 1.7 tn recorded in December 2023. The growth of the assets is attributed to the improved market and economic conditions during the period as evidenced by improved business conditions, eased inflationary pressures and stability of the exchange rate. The Purchasing Manager’s Index (PMI) for HY’2024 came in at 50.0, up from 48.7 recorded in HY’2023. Additionally, the average inflation rate in HY’2024 came in at 5.6% compared to 8.5% recorded in a similar period in 2023. Notably, on a year-on -year basis, assets under management increased by 16.1% from the Kshs 1.7 tn recorded in June 2023, partly attributable to the enhanced contributions to the mandatory scheme, NSSF, which began in earnest in February 2023 following the court of appeal ruling.
The graph below shows the growth of Assets under Management of the retirement benefits schemes over the last 10 years:
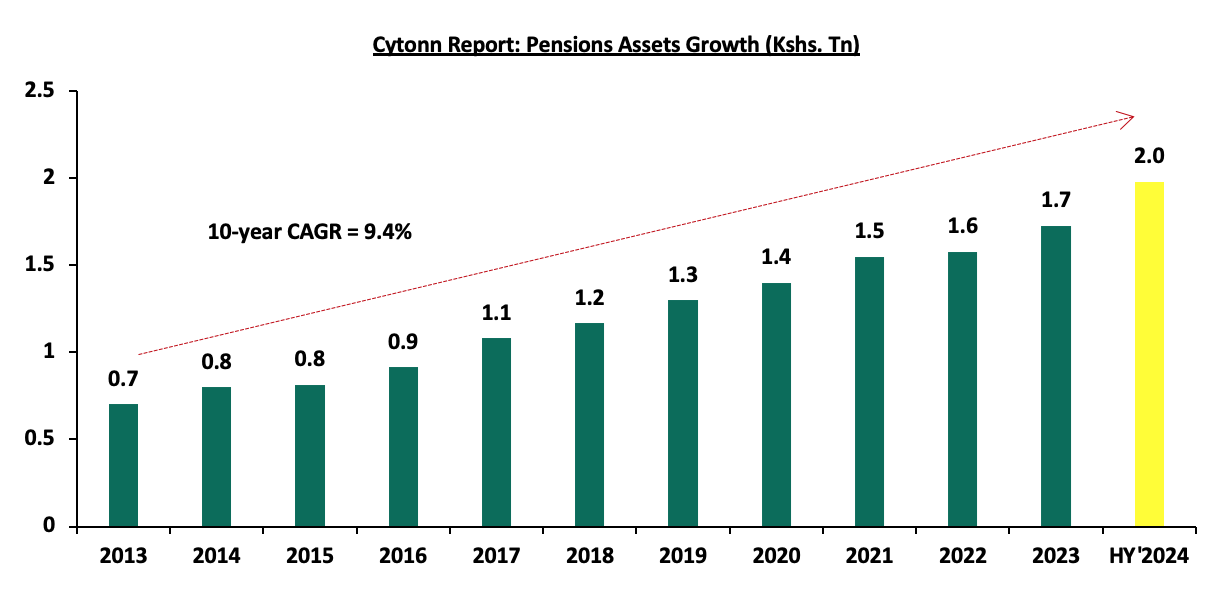
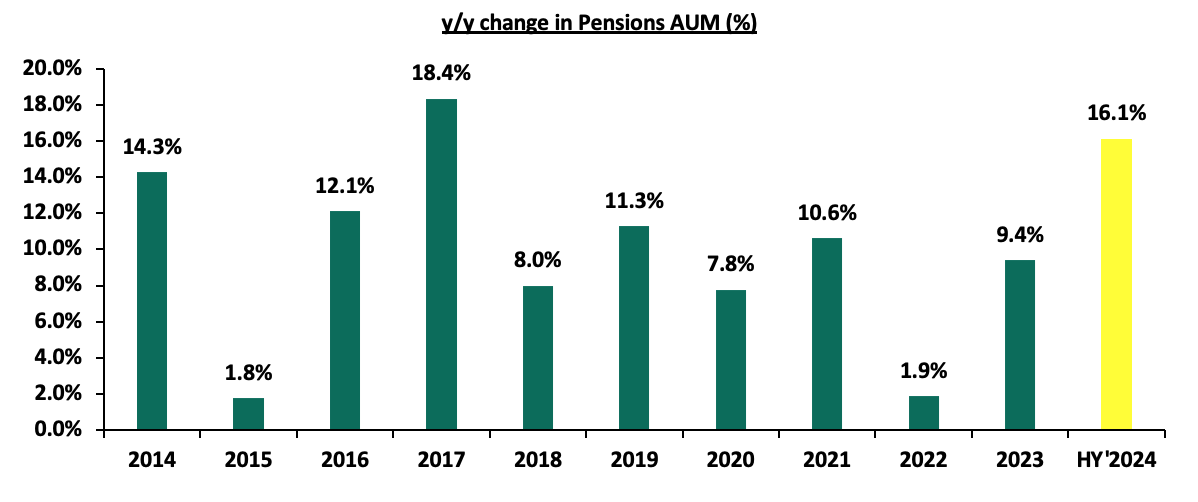
The 16.1% y/y growth to Kshs 2.0 mn in HY’2024 from Kshs 1.7 mn in HY’2023, is 6.7% points increase from the 9.4% growth between 2023 and 2022. Additionally, the 9.4% increase in Assets Under Management is 7.5% points increase in growth from the 1.9% growth that was recorded in 2022, demonstrating the significant role that the enhanced NSSF contributions made to the recovery of the industry’s performance following a difficult period in 2022.
The chart below shows the y/y changes in the assets under management for the schemes over the years.
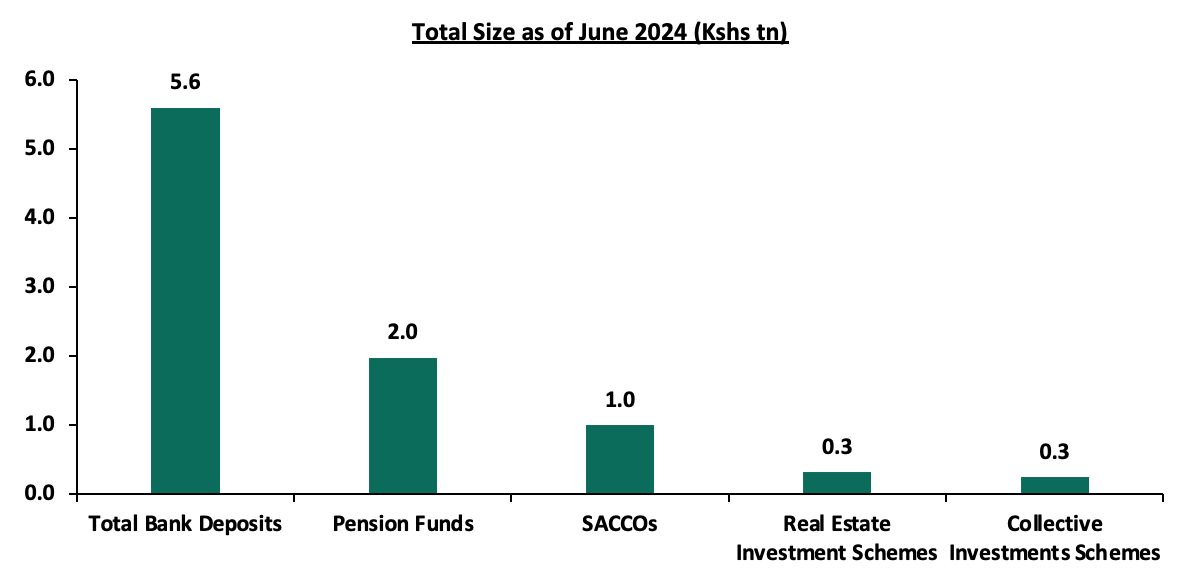
Despite the continued growth, Kenya is characterized by a low saving culture with research by the Federal Reserve Bank only 14.2% of the adult population in the labor force save for their retirement in Retirement Benefits Schemes (RBSs).
The graph below shows the Assets under Management of Pensions against other Capital Markets products and bank deposits:
Sources: CMA, RBA, SASRA and REIT Financial Statements
- Retirement Benefits Schemes Allocations and Various Investment Opportunities
Retirement Benefits Schemes strategically allocate funds across various asset classes available in the market to safeguard members' contributions while striving to generate attractive returns. These schemes have access to a diverse range of investment opportunities, including traditional asset classes such as equities and fixed income securities. Additionally, they can explore alternative investments such as real estate, private equity, infrastructure, and other non-traditional assets, which may offer higher returns and diversification benefits. The choice of investments is guided by the scheme's Investment Policy Statement (IPS), regulatory guidelines, and the need to align with the risk tolerance and long-term goals of the members. As such, the performance of Retirement Benefits Schemes in Kenya depends on a number of factors such as;
- Asset allocation,
- Selection of the best-performing security within a particular asset class,
- Size of the scheme,
- Risk appetite of members and investors, and,
- Investment horizon.
The Retirement Benefits (Forms and Fees) Regulations, 2000 offers investment guidelines for retirement benefit schemes in Kenya in terms of the asset classes to invest in and the limits of exposure to ensure good returns and that members’ funds are hedged against losses. According to RBA’s Regulations, the various schemes through their Trustees can formulate their own Investment Policy Statements (IPS) to Act as a guideline on how much to invest in the asset option and assist the trustees in monitoring and evaluating the performance of the Fund. However, the Investment Policy Statements often vary depending on risk-return profile and expectations mainly determined by factors such as the scheme’s demography and the economic outlook.
The Retirement Benefits Authority (RBA) regulations also emphasize the importance of diversification as a key principle in managing pension funds. By setting limits on exposure to specific asset classes, the regulations mitigate the risks associated with market volatility, ensuring that no single investment disproportionately affects the scheme's overall performance. Trustees are required to regularly review and update their Investment Policy Statements (IPS) to reflect changes in market conditions, economic dynamics, and the evolving needs of the scheme's members. This proactive approach not only aligns the investment strategy with the scheme’s objectives but also enhances accountability and transparency in fund management, safeguarding members’ retirement savings. The table below represents how the retirement benefits schemes have invested their funds in the past:
|
Cytonn Report: Kenyan Pension Funds’ Assets Allocation |
||||||||||||||
|
Asset Class |
2014 |
2015 |
2016 |
2017 |
2018 |
2019 |
2020 |
2021 |
2022 |
2023 |
HY’2024 |
Average |
Limit |
|
|
Government Securities |
31.0% |
29.8% |
38.3% |
36.5% |
39.4% |
42.0% |
44.7% |
45.7% |
45.8% |
47.5% |
51.1% |
41.1% |
90.0% |
|
|
Quoted Equities |
26.0% |
23.0% |
17.4% |
19.5% |
17.3% |
17.6% |
15.6% |
16.5% |
13.7% |
8.4% |
8.8% |
16.7% |
70.0% |
|
|
Immovable Property |
17.0% |
18.5% |
19.5% |
21.0% |
19.7% |
18.5% |
18.0% |
16.5% |
15.8% |
14.0% |
11.9% |
17.3% |
30.0% |
|
|
Guaranteed Funds |
11.0% |
12.2% |
14.2% |
13.2% |
14.4% |
15.5% |
16.5% |
16.8% |
18.9% |
20.8% |
20.5% |
15.8% |
100.0% |
|
|
Listed Corporate Bonds |
6.0% |
5.9% |
5.1% |
3.9% |
3.5% |
1.4% |
0.4% |
0.4% |
0.5% |
0.4% |
0.4% |
2.5% |
20.0% |
|
|
Fixed Deposits |
5.0% |
6.8% |
2.7% |
3.0% |
3.1% |
3.0% |
2.8% |
1.8% |
2.7% |
4.8% |
2.7% |
3.5% |
30.0% |
|
|
Offshore |
2.0% |
0.9% |
0.8% |
1.2% |
1.1% |
0.5% |
0.8% |
1.3% |
0.9% |
1.6% |
2.0% |
1.2% |
15.0% |
|
|
Cash |
1.0% |
1.4% |
1.4% |
1.2% |
1.1% |
1.2% |
0.9% |
0.6% |
1.1% |
1.5% |
1.2% |
1.1% |
5.0% |
|
|
Unquoted Equities |
0.0% |
0.4% |
0.4% |
0.4% |
0.3% |
0.3% |
0.2% |
0.2% |
0.3% |
0.2% |
0.2% |
0.4% |
5.0% |
|
|
Private Equity |
0.0% |
0.0% |
0.0% |
0.0% |
0.1% |
0.1% |
0.1% |
0.2% |
0.2% |
0.3% |
0.4% |
0.1% |
10.0% |
|
|
REITs |
0.0% |
0.0% |
0.1% |
0.1% |
0.1% |
0.0% |
0.0% |
0.0% |
0.0% |
0.6% |
0.6% |
0.1% |
30.0% |
|
|
Commercial Paper, non-listed bonds by private companies |
0.0% |
0.0% |
0.0% |
0.0% |
0.0% |
0.0% |
0.0% |
0.0% |
0.0% |
0.0% |
0.2% |
0.0% |
10.0% |
|
|
Others e.g. unlisted commercial papers |
0.0% |
0.0% |
0.0% |
0.0% |
0.0% |
0.0% |
0.0% |
0.1% |
0.2% |
- |
0.0% |
0.0% |
10.0% |
|
|
Total |
100.0% |
100.0% |
100.0% |
100.0% |
100.0% |
100.0% |
100.0% |
100.0% |
100.0% |
100.0% |
|
100.0% |
100.0% |
|
Source: Retirement Benefits Authority
Key Take-outs from the table above are;
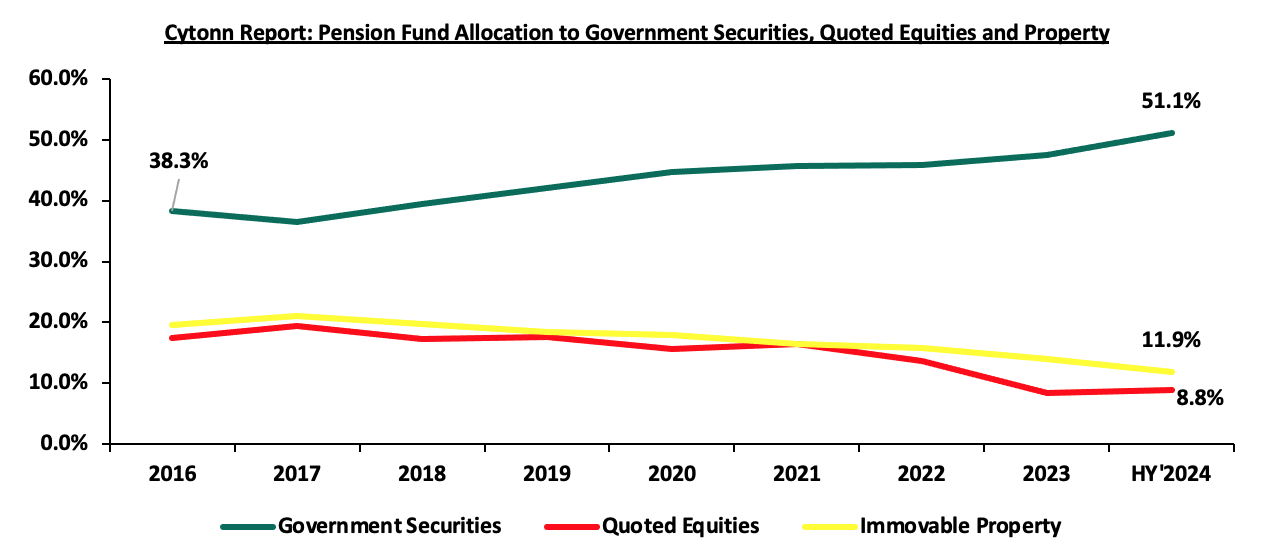
- Schemes in Kenya allocated an average of 57.8% of their members’ funds towards government securities and Quoted Equities between the period of 2013 and end of June 2024. The 41.1% average allocation to government securities is the highest among the asset classes attributable to safety assurances of members’ funds because of low-risk associated with government securities. Notably, allocation towards government securities increased by 3.6% points to 51.1% in HY’2024 from 47.5% in FY’2023 attributable to high yields by the government papers and increased issuance of treasury bonds to finance fiscal deficits as well as increase domestic borrowing during the period,
- The allocation towards quoted equities increased to 8.8% as of June 2024, from 8.4% in December 2023 on the back of improved performance in the Kenyan equities market as evidenced by 19.0% of the NASI index in H1’2024, driven by a recovery in corporate earnings and increased investor confidence. Favourable macroeconomic conditions, such as easing inflation and a strengthened shilling, boosted market sentiment, have encouraged trustees to allocate more funds to equities during the period,
- Retirement Benefits Schemes investments in offshore markets increased by 0.4% points to 2.0% as of June 2024, from 1.6% in December 2023 as a result of the opportunities in developed and emerging markets, and currency hedging strategies that allowed schemes to benefit from foreign exchange gains, and,
- The 0.2% points increase in investment in commercial paper, non-listed bonds issued by private companies was due to an investment of Kshs 3.0 bn in Linzi sukuk bond by one of the schemes during the period.
The chart below shows the allocation by pension schemes on the three major asset classes over the years:
Source: RBA Industry report
- Performance of the Retirement Benefit Schemes
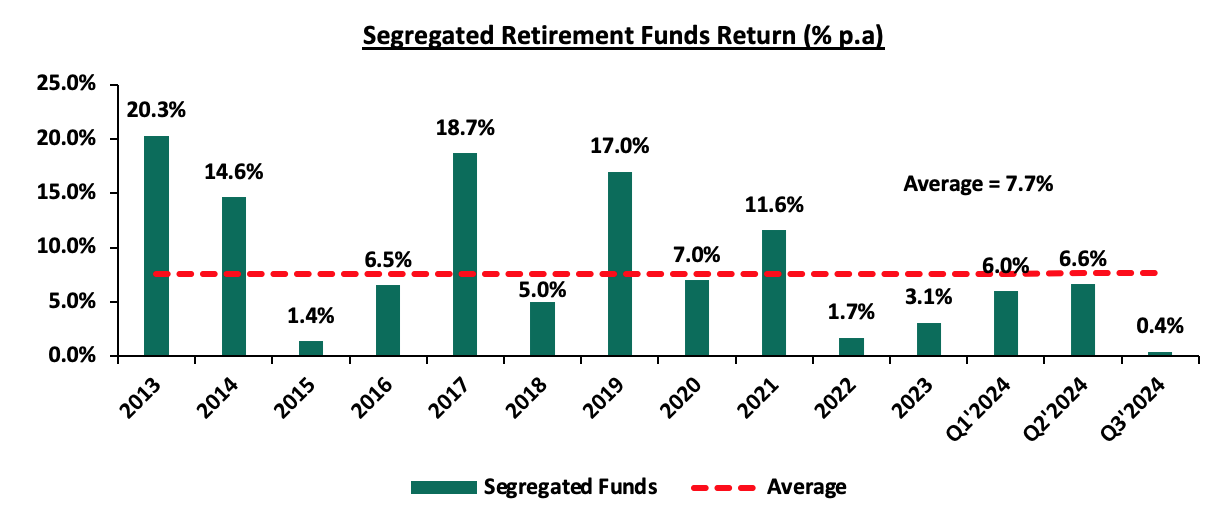
According to the ACTSERV Q3’2024 Pension Schemes Investments Performance Survey, the ten-year average return for segregated schemes over the period 2015 to 2024 was 7.7% with the performance fluctuating over the years to a high of 18.7% in 2017 and a low of 1.4% in 2015 reflective of the markets performance. Notably, segregated retirement benefits scheme returns increased to 0.4% return in Q3’2024, up from the 2.9% loss recorded in Q3’2023. The y/y growth in overall returns was largely driven by the 3.0% points increase in returns from Offshore investments to 4.7% from 1.7% in Q3’2023 as well as the 2.1% gain from equities attributable to the positive returns realized from the banking sector stocks. This was however a 6.2% points decline from the overall return of 6.6% recorded in Q2’2024. The chart below shows the performance of segregated pension schemes since 2013:
Source: ACTSERV Survey Reports (Segregated Schemes)
The key take-outs from the graph include:
- Schemes recorded a 0.4% gain in Q3’2024, representing 6.2% points decrease from the 6.6% gain recorded in Q2’2024. The performance was largely driven by a decline in gain from fixed income investments to the 0.04% gain recorded in Q3’2024, from 8.0% in Q2’2024 largely attributable to declining interest rates across the yield curve, occasioned by easing inflation and decreased government domestic borrowing appetite The decline was however supported by the increase in gains from Offshore assets, recording a 4.7% gain in Q3’2024, from the 1.6% gain recorded in Q2’2024, majorly on the back of investor sentiment shift to opportunities in the global markets, and,
- Returns from segregated retirement funds have exhibited significant fluctuations, ranging from a high of 20.3% recorded in 2013 to a low of 0.4% in HY’2024, highlighting the sensitivity of fund performance to market and economic conditions.
The survey covered the performance of asset classes in three broad categories: Fixed Income, Equity, Offshore, and Overall Return.
Below is a table showing the third quarter performances over the period 2020-2024:
|
Cytonn Report: Quarterly Performance of Asset Classes (2020 – 2024) |
||||||
|
|
Q3'2020 |
Q3'2021 |
Q3'2022 |
Q3’2023 |
Q3'2024 |
Average |
|
Offshore |
11.3% |
1.9% |
(2.8%) |
1.7% |
4.7% |
3.4% |
|
Equity |
5.1% |
5.2% |
6.3% |
(10.4%) |
2.1% |
1.7% |
|
Fixed Income |
4.0% |
2.9% |
2.3% |
(1.5%) |
0.04% |
1.5% |
|
Overall Return |
4.2% |
3.4% |
3.0% |
(2.9%) |
0.4% |
1.6% |
Source: ACTSERV Surveys
Key take-outs from the table above include;
- Returns from Fixed Income recorded an increase of 1.5% points to 0.04% in Q3’2024 from the 1.5% loss recorded in Q3’2023. This performance in Q3’2024 is partially attributable to improved market conditions compared to a similar period in 2023, as evidenced by the higher yields on government securities and improved investor sentiment towards government debt instruments as well as an ease in inflationary pressures with the average inflation rate for Q3’2024 coming in at 4.1% from in 6.9% Q3’2023,
- Returns from Equity investments also recorded a significant increase by 12.5% points to a 2.1% gain in Q3’2024, from the 10.4% loss recorded in Q3’2023. The performance was partly attributable to positive investor sentiment and renewed investor confidence following the performance of the Kenyan currency this year, having gained by 17.4% on a year-to-date basis, and,
- Returns from the Offshore investments recorded an increase to a 4.7% return in Q3’2024 from the 1.7% recorded in Q3’2023. The performance was partly attributable to favourable global market conditions, including improved economic growth in key international markets and a recovery in international equity and fixed-income assets. Additionally, stable currency performance during this period minimized foreign exchange losses, allowing the investments to benefit purely from the positive returns of the underlying global assets.
Other Asset Classes that Retirement Benefit Schemes Can Leverage on
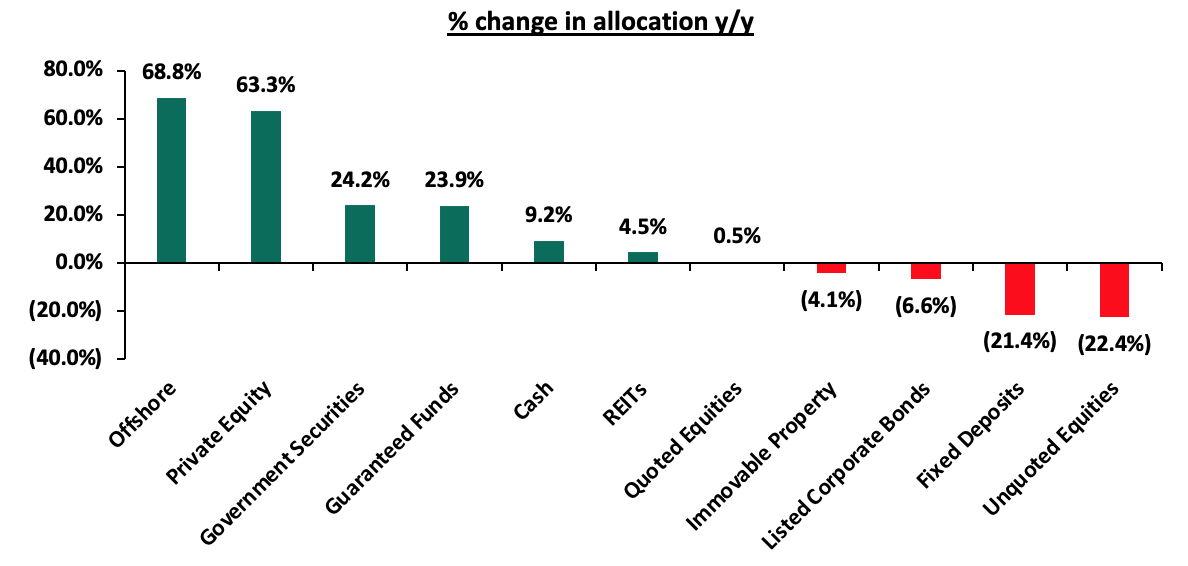
Retirement benefits schemes have for a long time skewed their investments towards traditional assets, mostly, government securities and the equities market, averaging 57.8% as of 30th June 2024, leaving only 42.2% for the other asset classes. In the asset allocation, alternative investments that include immovable property, private equity as well as Real Estate Investments Trusts (REITs) account for an average of only 17.5% against the total allowable limit of 70.0%. This is despite the fact that these asset classes such as REITs offer benefits such as low-cost exposure to Real Estate and tax incentives hence the potential for better returns. It is vital to note, however, that in HY’2024 the second largest increase in allocation was recorded in investments in private equity by 63.3% to 8.8 bn from 5.4 bn recorded in HY’2023. This is partly attributable to favourable interest rates following monetary policy adjustments creating conducive conditions for private equity investments by reducing the cost of financing and encouraging long-term investments in high-growth sectors. Allocation to immovable property decreased by 4.1% to Kshs 236.3 bn in HY’2024 from Kshs 246.3 bn in HY’2023, while investments in Real Estate Investments Trusts increased by 4.5% to Kshs 11.1 bn in HY’2024 from Kshs 10.6 bn in HY’2023
The graph below shows the y/y change in allocation to the various asset classes;
Source: RBA Industry Report
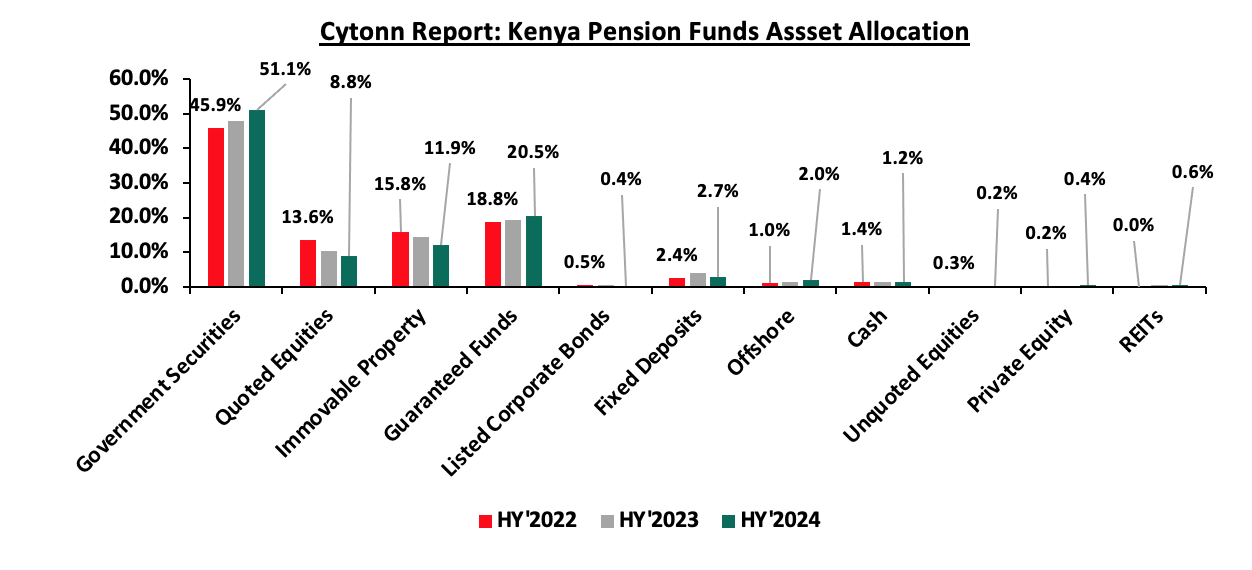
However, in terms of overall asset allocation, alternative investments still lagged way behind the other asset classes, as demonstrated in the graph below;
Source: RBA Industry Report
We believe that Alternative Investments including REITs would play a big role in improving the performance of retirement benefits schemes;
Alternative Investments (Immovable Property, Private Equity and REITs)
Alternative Investments refers to investments that are supplemental strategies to traditional long-only positions in equities, bonds, and cash. They differ from traditional investments on the basis of complexity, liquidity, and regulations and can invest in immovable property, private equity, and Real Estate Investment Trusts (REITs) to a limit of 70.0% exposure. We believe that Alternative Investments, including REITs, would play a significant role in improving the performance of retirement benefits schemes by providing opportunities for higher returns and enhanced portfolio resilience.
Alternative Investments, such as immovable property, private equity, and REITs, offer not only diversification and competitive long-term returns but also the potential to hedge against inflation. Investments in real assets like immovable property and REITs often benefit from inflationary environments, as property values and rental incomes tend to rise with inflation. Additionally, private equity provides access to high-growth sectors, such as technology and renewable energy, which are less correlated to traditional market movements, offering an attractive risk-adjusted return profile.
Furthermore, REITs in Kenya, particularly Development and Income REITs, present unique opportunities for retirement schemes. They provide exposure to the real estate sector without the liquidity constraints and management challenges associated with direct property ownership. As the Kenyan real estate market continues to mature and regulatory frameworks for REITs improve, these instruments are becoming more viable for retirement funds seeking stable, inflation-protected income streams and long-term growth. By strategically allocating a portion of their portfolio to alternative investments, retirement schemes can enhance overall returns while safeguarding members' contributions against market volatility.
Section III: Factors Influencing the Growth of Retirement Benefit Schemes
The retirement benefit scheme industry in Kenya has registered significant growth in the past 10 years with assets under management growing at a CAGR of 9.4% to Kshs 1.7 tn in FY’2023, from Kshs 0.7 tn in 2013. The growth is attributable to:
- Increased Pension Awareness – More people are becoming increasingly aware of the importance of pension schemes and as such, they are joining schemes to grow their retirement pot which they will use during their golden years. Over the last 20 years, pension coverage has grown from 12.0% to about 26.0% of the labour force. The Retirement Benefits Authority, through their Strategic Plan 2024-2029, aims to further expand this coverage to 34.0% by 2029. This growth reflects industry-wide initiatives to increase awareness among Kenyan citizens on the need for retirement planning and innovations,
- Public-Private partnerships - Public-private partnerships can be instrumental in expanding financial inclusion in the Kenyan pension sector. Collaborations between the government and private financial institutions can lead to the development and promotion of inclusive pension products. In Kenya, the National Social Security Fund (NSSF) is currently licensing and partnering with the private sector (Pension Fund Managers) to invest and manage NSSF Tier II contributions. This is a good example that the government is giving employees, employers, and persons in the informal sector to invest and save for their retirement in the private sector,
- Legislation – The National Assembly, on 1st November 2024, published the Tax Laws (Amendment) Bill 2024. The Bill aims to amend the Income Tax Act by increasing the deductible amount for contributions to registered pension, provident, and individual retirement funds or public pension schemes to Kshs 360,000 annually from Kshs 240,000, and to Kshs 30,000 from Kshs 20,000 monthly. These changes aim to adjust for inflation and modernize deductions that have remained unchanged for over a decade. The revisions are expected to reduce individual taxable income and enhance retirement benefits. In addition, the implementation of the National Social Security Fund Act, 2013 is entering its second year and is expected to foster the growth of the pension industry by allowing both the employees in the formal and informal sector to save towards their retirement, as opposed to the previous NSSF Act cap 258 of 1965, which was only targeting the employees in the formal sector,
- Tax Incentives - Members of Retirement Benefit Schemes are entitled to a maximum tax-free contribution of Kshs 20,000 monthly or 30.0% of their monthly salary, whichever is less. Consequently, pension scheme members enjoy a reduction in their taxable income and pay less taxes. This incentive has motivated more people to not only register but also increase their regular contributions to pension schemes,
- Micro-pension schemes - Micro-pension schemes are tailored to address the needs of Kenyans in the informal sector with irregular earnings. These schemes allow people to make small, flexible contributions towards their retirement. By accommodating their financial realities, micro-pensions can attract a broader segment of the population into the pension sector. Examples of these pension schemes are Mbao Pension Plan and Individual Pension Schemes i.e. Britam Individual Pension Plan where one can start saving voluntarily and any amount towards their retirement,
- Relevant Product Development – Pension schemes are not only targeting people in formal employment but also those in informal employment through individual pension schemes, with the main aim of improving pension coverage in Kenya. To achieve this, most Individual schemes have come up with flexible plans that fit various individuals in terms of affordability and convenience. Additionally, the National Social Security Fund Act, 2013 contains a provision for self-employed members to register as members of the fund, with the minimum aggregate contribution in a year being Kshs 4,800 with the flexibility of making the contribution by paying directly to their designated offices or through mobile money or any other electronics transfers specified by the board,
- Demographics - Kenya’s rising population has played a big role in supporting the pensions industry in Kenya. The young population aged 15-24, currently at a population of 10.4 mn approximately 19.6% of the total population, has grown rapidly with the United Nations projecting that the corresponding population of youth in Kenya aged 15-24 years and ready to join the workforce will increase to 18.0 mn, from 9.5 mn over the period 2015 to 2065. This will support the continuous increase in people joining the workforce and saving for retirement. Which will consequently increase scheme membership significantly,
- Technological Advancement – The adoption of technology into pension schemes has improved the efficiency and management of pension schemes. A notable example of pension technology in Kenya is the M-Akiba platform. This is a mobile-based platform that was developed by the government to enable Kenyans to save for their retirement using their mobile phones. Additionally, the improvement of mobile penetration rate and internet connectivity has enabled members to make contributions and track their benefits from the convenience of their mobile phones, and,
- Financial literacy programs - Financial literacy programs play a vital role in promoting the growth of retirement benefit schemes by enhancing financial inclusion among the public. Educating the public about the benefits of retirement savings and how to navigate pension schemes can empower individuals to take control of their financial future. The Retirement Benefits Authority (RBA) is at the forefront of ensuring the public is educated on financial literacy by organizing free training.
Section IV: Challenges that Have Hindered the Growth of Retirement Benefit Schemes
Despite the expansion of the Retirement Benefit industry, several challenges continue to hinder its growth. Key factors include:
- Market Volatility – In segregated schemes, investment returns are not guaranteed and are subject to market fluctuations. In Q3’2024, the equities market saw a decline of 2.2%, following a 3.2% drop in Q2’2024 and a notable 28% gain in Q1’2024. This level of volatility introduces uncertainty in the growth of retirement savings,
- Low Pension Coverage in the Informal Sector – The informal sector is a significant part of Kenya's economy but is marked by irregular incomes and job insecurity. The Retirement Benefit Statistical Digest 2021 reports that only 266,764 individuals are registered in individual pension schemes. This number is low compared to the 15.2 mn people in the informal sector, representing 83.2% of the total workforce (Kenya National Bureau of Statistics Economic Survey Report 2023). Many in this sector prioritize immediate financial needs over long-term savings, and traditional pension products may not meet their financial realities,
- Inadequate Contributions - Even when individuals are covered by retirement schemes, their contributions are often inadequate to meet future financial needs due to factors such as low disposable income, delayed enrolment in schemes and inadequate contribution rates. Insufficient contributions translate directly into lower payouts upon retirement. For retirees, this can result in financial insecurity, dependence on family or government assistance and inability to meet basic living expenses,
- High Unemployment Rate – According to the Kenya National Bureau of Statistics Q4’2022 labour report, 6% of Kenya’s 29.1 mn working-age population aged between 15-64 years was unemployed. The high unemployment rate poses a significant challenge for many individuals, making it difficult for them to contribute consistently to retirement schemes,
- Low Awareness and Financial Literacy- Many people do not fully understand the importance of saving for retirement or the long-term benefits of participating in a pension plan. This is because many people are unaware of their existence, the benefits they offer, or how to enrol. This is especially prevalent in rural or underserved areas where access to information is limited,
- Premature Access to Savings – Members of individual pension schemes have the ability to withdraw 100.0% of their personal contributions, excluding any transferred employer contributions. On the other hand, members of umbrella and occupational schemes can access up to 50.0% of their benefits before retirement age, typically in cases of job loss or a change of employment. While this option offers immediate financial relief, it reduces the value of retirement savings, which in turn hinders the long-term growth potential of the pension sector,
- Unremitted Contributions – Financial constraints have led some employers to delay or fail to remit pension contributions to umbrella and occupational schemes. As a result, unremitted contributions have increased significantly, growing from Ksh 34.7 billion in 2020 to Ksh 42.8 billion in 2021, according to the Retirement Benefits Statistical Digest 2021, and,
- Delayed Benefit Payments – Simplify the approval process by reducing the number of steps and parties involved. Pension scheme administrators should be given more autonomy in calculating and authorizing payments to speed up the disbursement process. Implement automated systems for calculating and processing benefits, reducing manual intervention and the time spent moving files between service providers.
Section V: Recommendations to Enhance the Growth and Penetration of Retirement Benefit Schemes in Kenya
- Reintroduction of Finance Bill 2024 proposals for the industry – The proposals in the Finance Bill 2024 were forward-thinking for the pensions industry and would be beneficial if reintroduced. These reforms had significant potential to strengthen the retirement system. Shifting the registration of retirement funds from the Commissioner to the Retirement Benefits Authority (RBA) would simplify the process, while expanded tax exemptions on withdrawals for early retirement and health-related needs would provide more equitable support. Extending the pension withdrawal period from 15 to 20 years promotes long-term savings and reduces reliance on government assistance in the future. Additionally, increasing the gratuity tax exemption limit to Ksh 30,000.0 could encourage higher contributions to retirement schemes, though its advantages would primarily benefit high-income earners
- Strengthen Public Education and Awareness –Launch targeted campaigns to educate the public about the importance of retirement planning and the benefits of pension schemes. Conduct workshops and seminars in rural and underserved areas to demystify pension schemes and enhance understanding. The Retirement Benefits Authority (RBA) has recently been at the fore front of this much-needed campaign, organizing seminars, workshops, and roadshows to meet this objective,
- Develop Tailored Pension Products for the Informal Sector – Design micro-pension plans with low, flexible contribution thresholds to suit irregular income patterns in the informal sector. Leverage mobile money platforms and apps to facilitate seamless enrolment, contributions, and tracking of pension accounts.
- Improve Regulatory Framework to Address Unremitted Contributions – The Retirement Benefits Authority (RBA) should increase its monitoring and auditing of employers to ensure timely and full remittance of pension contributions. Employers found non-compliant should face stricter penalties, including fines or legal action, to incentivize timely remittance. For employers facing temporary financial constraints, the RBA could offer the option of negotiating manageable payment plans or extensions to clear overdue contributions, preventing companies from defaulting entirely.
- Streamline the Benefit Payment Process – The process of approving and disbursing retirement benefits should be streamlined to reduce delays. Automating certain steps and creating clear timelines for each stage of the process would help retirees receive their benefits promptly, improving trust and encouraging broader participation in pension schemes,
- Promote Employer Participation in Pension Schemes – The government and industry stakeholders should incentivize all employers to enrol their employees in occupational pension schemes. This can be achieved through tax benefits, financial support programs, or public recognition for employers who consistently contribute to their employees' retirement plans, and,
- Introduce Policy Reforms to Limit Premature Withdrawals –Limit the percentage of pension savings that can be withdrawn before retirement to a lower amount to reduce the impact on long-term retirement savings. Withdrawals should only be allowed for specific emergencies, such as critical illness, with clear documentation and justification. Additionally, schemes could offer workshops and educational materials to help members understand the long-term benefits of saving for retirement and the negative impact of early withdrawals on their future financial security.
These recommendations will definitely foster sustainable growth in Kenya's retirement benefit schemes by addressing some of the structural challenges that currently hinder the sector's potential.
Disclaimer: The views expressed in this publication are those of the writers where particulars are not warranted. This publication, which is in compliance with Section 2 of the Capital Markets Authority Act Cap 485A, is meant for general information only and is not a warranty, representation, advice, or solicitation of any nature. Readers are advised in all circumstances to seek the advice of a registered investment advisor.

