Retirement Benefits Schemes Q2’2024 Performance Report and Cytonn Weekly #36/2024
By Investments Team, Sep 8, 2024
Executive Summary
Fixed Income
During the week, T-bills were oversubscribed for the second consecutive, with the overall oversubscription rate coming in at 162.3%, higher than the oversubscription rate of 100.8% recorded the previous week. Investors’ preference for the shorter 91-day paper persisted, with the paper receiving bids worth Kshs 23.2 bn against the offered Kshs 4.0 bn, translating to an oversubscription rate of 580.2%, higher than the oversubscription rate of 437.4% recorded the previous week. The subscription rates for the 182-day and 364-day papers increased to 101.7% and 55.7% respectively from the 44.5% and 22.5% respectively recorded the previous week. The government accepted a total of Kshs 36.9 bn worth of bids out of Kshs 38.9 bn bids received, translating to an acceptance rate of 94.8%. The yields on the government papers were on a downward trajectory, with the yields on the 364-day, 182-day, and 91-day papers decreasing by 1.9 bps, 0.7 bps, and 1.7 bps to 16.82%, 16.63%, and 15.77% respectively from 16.84%, 16.63% and 15.78% respectively recorded the previous week;
In the primary bond market, the government is looking to raise Kshs 30.0 bn through the reopened bonds FXD1/2024/010 and FXD1/2016/020 with a tenor to maturity of 9.5 and 12.0 years respectively. The bonds will be offered at fixed coupon rates of 16.0% and 14.0% respectively. Given the current market conditions and the recent bond issues, we expect the average rate of accepted bids for the two bonds to come in at a range of 16.25%-16.65% for the FXD1/2024/010 and 16.55%-17.20% for the FXD1/2016/020;
During the week, Stanbic Bank released its monthly Purchasing Manager's Index (PMI) highlighting that the index for the month of August 2024 improved significantly, coming in at 50.6, up from 43.1 in July 2024, signaling a mild recovery in business conditions. This is attributable to the rise in activity following the conclusion of political demonstrations, which enabled businesses to resume operations;
Equities
During the week, the equities market was on an upward trajectory, with NASI gaining the most by 1.8%, while NSE 20, NSE 25 and NSE 10 all gained by 1.7% each, taking the YTD performance to gains of 21.4%, 19.9%, 14.8%, and 13.2% for NSE 10, NSE 25, NASI, and NSE 20 respectively. The equities market performance was driven by gains recorded by large-cap stocks such as KCB Group, Equity Group, and Standard Chartered Bank of 6.1%, 5.1%, and 3.8% respectively. The performance was, however, weighed down by losses recorded by large-cap stocks such as Co-op Bank, BAT, and Absa Bank of 3.3%, 2.4%, and 1.7% respectively;
During the week, Centum Investment Company Plc extended its ongoing Share Buyback Program, which began on February 6, 2023. The initial phase of the buyback was set to last for 18 months, concluding on 2nd August 2024. However, the company recently secured approval from the Capital Markets Authority (CMA) to extend the program up until its next Annual General Meeting (AGM), scheduled for September 20, 2024;
Real Estate
During the week, Acorn Holdings, a Real Estate developer, completed the acquisition of a 0.79-acre piece of land in Eldoret along Makasembo Road, near the Moi Teaching & Referral Hospital and Moi University Medical School. The company is expected to launch a Kshs 1.6 bn two-hostel project under their Qwetu and Qejani brands, with each having a total of 514 rooms and 510 rooms respectively, and a combined bed capacity of 2,291;
On the Unquoted Securities Platform, Acorn D-REIT and I-REIT traded at Kshs 25.4 and Kshs 22.2 per unit, respectively, as per the last updated data on 6th September 2024. The performance represented a 27.0% and 11.0% gain for the D-REIT and I-REIT, respectively, from the Kshs 20.0 inception price Additionally, ILAM Fahari I-REIT traded at Kshs 11.0 per share as of 6th September, 2024, representing a 45.0% loss from the Kshs 20.0 inception price;
Focus of the Week
According to the ACTSERV Q2’2024 Retirement Benefits Schemes Investments Performance Survey, segregated retirement benefits schemes recorded a 6.6% return in Q2’2024, up from the 0.1% recorded in Q2’2023. The increase was largely supported by the performance of fixed income investments made by the schemes which recorded an 8.0% gain, 7.3% points above the 0.7% return recorded in Q2’2023. This week, we shall focus on understanding Retirement Benefits Schemes and look into the quarterly performance and current state of retirement benefits schemes in Kenya with a key focus on Q2’2024;
Investment Updates:
- Weekly Rates:
- Cytonn Money Market Fund closed the week at a yield of 18.22% p.a. To invest, dial *809# or download the Cytonn App from Google Play store here or from the Appstore here;
- We continue to offer Wealth Management Training every Monday, from 10:00 am to 12:00 pm. The training aims to grow financial literacy among the general public. To register for any of our Wealth Management Trainings, click here;
- If interested in our Private Wealth Management Training for your employees or investment group, please get in touch with us through wmt@cytonn.com;
- Cytonn Insurance Agency acts as an intermediary for those looking to secure their assets and loved ones’ future through insurance namely; Motor, Medical, Life, Property, WIBA, Credit and Fire and Burglary insurance covers. For assistance, get in touch with us through insuranceagency@cytonn.com;
- Cytonn Asset Managers Limited (CAML) continues to offer pension products to meet the needs of both individual clients who want to save for their retirement during their working years and Institutional clients that want to contribute on behalf of their employees to help them build their retirement pot. To more about our pension schemes, kindly get in touch with us through pensions@cytonn.com;
Hospitality Updates:
- We currently have promotions for Staycations. Visit cysuites.com/offers for details or email us at sales@cysuites.com;
Money Markets, T-Bills Primary Auction:
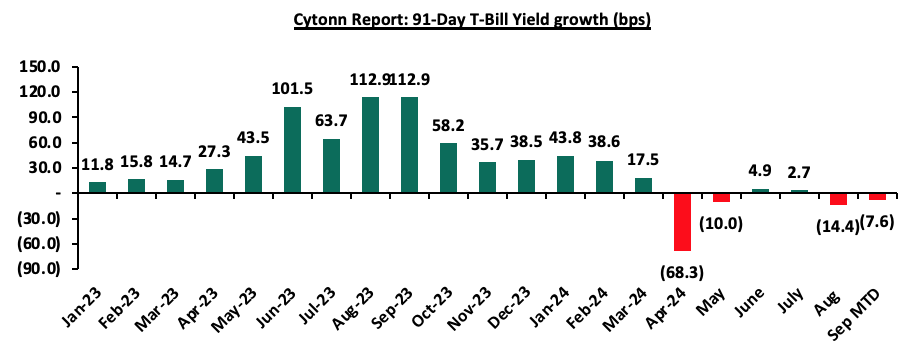
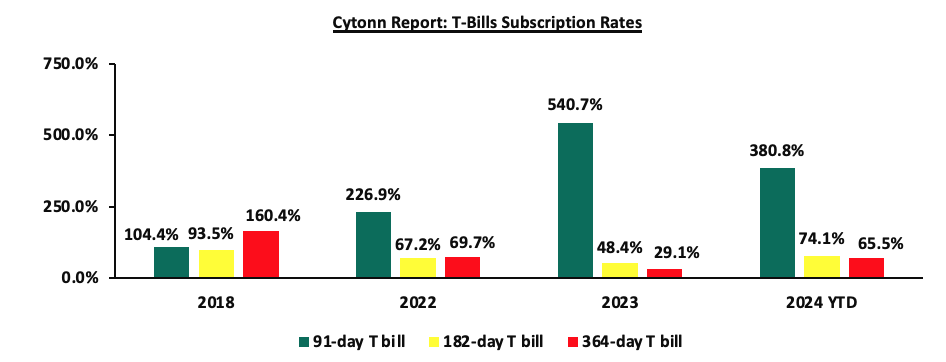
During the week, T-bills were oversubscribed for the second consecutive, with the overall oversubscription rate coming in at 162.3%, higher than the oversubscription rate of 100.8% recorded the previous week. Investors’ preference for the shorter 91-day paper persisted, with the paper receiving bids worth Kshs 23.2 bn against the offered Kshs 4.0 bn, translating to an oversubscription rate of 580.2%, higher than the oversubscription rate of 437.4% recorded the previous week. The subscription rates for the 182-day and 364-day papers increased to 101.7% and 55.7% respectively from the 44.5% and 22.5% respectively recorded the previous week. The government accepted a total of Kshs 36.9 bn worth of bids out of Kshs 38.9 bn bids received, translating to an acceptance rate of 94.8%. The yields on the government papers were on a downward trajectory, with the yields on the 364-day, 182-day, and 91-day papers decreasing by 1.9 bps, 0.7 bps, and 1.7 bps to 16.82%, 16.63%, and 15.77% respectively from 16.84%, 16.63% and 15.78% respectively recorded the previous week. The chart below shows the yield growth rate for the 91-day paper over the period:
The chart below compares the overall average T-bill subscription rates obtained in 2018, 2022, 2023, and 2024 Year-to-date (YTD):
Also, in the primary bond market, the government is looking to raise Kshs 30.0 bn through the reopened bonds FXD1/2024/010 and FXD1/2016/020 with a tenor to maturity of 9.5 and 12.0 years respectively. The bonds will be offered at fixed coupon rates of 16.0% and 14.0% respectively. Given the current market conditions and the recent bond issues, we expect the average rate of accepted bids for the two bonds to come in at a range of 16.25%-16.65% for the FXD1/2024/010 and 16.55%-17.20% for the FXD1/2016/020.
Money Market Performance:
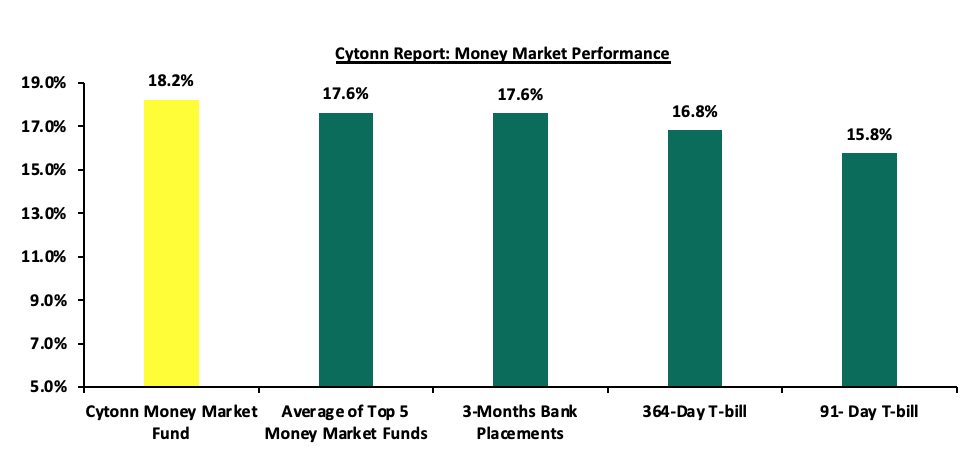
In the money markets, 3-month bank placements ended the week at 17.6% (based on what we have been offered by various banks), and the yields on the government papers were on a downward trajectory, with the yields on the 364-day and 91-day papers decreasing by 1.9 bps and 1.7 bps to 16.82% and 15.77% respectively from 16.84% and 15.78% respectively recorded the previous week. The yields on the Cytonn Money Market Fund decreased by 4.0 bps to close the week at 18.2% from the 18.3% recorded the previous week, while the average yields on the Top 5 Money Market Funds decreased by 12.0 bps to 17.6% from the 17.8% recorded the previous week.
The table below shows the Money Market Fund Yields for Kenyan Fund Managers as published on 6th September 2024:
|
Cytonn Report: Money Market Fund Yield for Fund Managers as published on 6th September 2024 |
||
|
Rank |
Fund Manager |
Effective Annual Rate |
|
1 |
Cytonn Money Market Fund (Dial *809# or download the Cytonn App) |
18.2% |
|
2 |
Lofty-Corban Money Market Fund |
18.2% |
|
3 |
Etica Money Market Fund |
17.7% |
|
4 |
Kuza Money Market fund |
17.0% |
|
5 |
Arvocap Money Market Fund |
17.0% |
|
6 |
GenAfrica Money Market Fund |
16.8% |
|
7 |
Nabo Africa Money Market Fund |
16.1% |
|
8 |
Jubilee Money Market Fund |
16.0% |
|
9 |
Enwealth Money Market Fund |
16.0% |
|
10 |
KCB Money Market Fund |
16.0% |
|
11 |
Sanlam Money Market Fund |
15.8% |
|
12 |
Co-op Money Market Fund |
15.6% |
|
13 |
Madison Money Market Fund |
15.6% |
|
14 |
Absa Shilling Money Market Fund |
15.5% |
|
15 |
Genghis Money Market Fund |
15.4% |
|
16 |
Mali Money Market Fund |
15.2% |
|
17 |
Mayfair Money Market Fund |
15.2% |
|
18 |
Stanbic Money Market Fund |
15.1% |
|
19 |
Apollo Money Market Fund |
15.1% |
|
20 |
Orient Kasha Money Market Fund |
14.9% |
|
21 |
AA Kenya Shillings Fund |
14.9% |
|
22 |
Old Mutual Money Market Fund |
14.2% |
|
23 |
Dry Associates Money Market Fund |
14.1% |
|
24 |
ICEA Lion Money Market Fund |
13.9% |
|
25 |
CIC Money Market Fund |
13.7% |
|
26 |
British-American Money Market Fund |
13.2% |
|
27 |
Equity Money Market Fund |
12.7% |
Source: Business Daily
Liquidity:
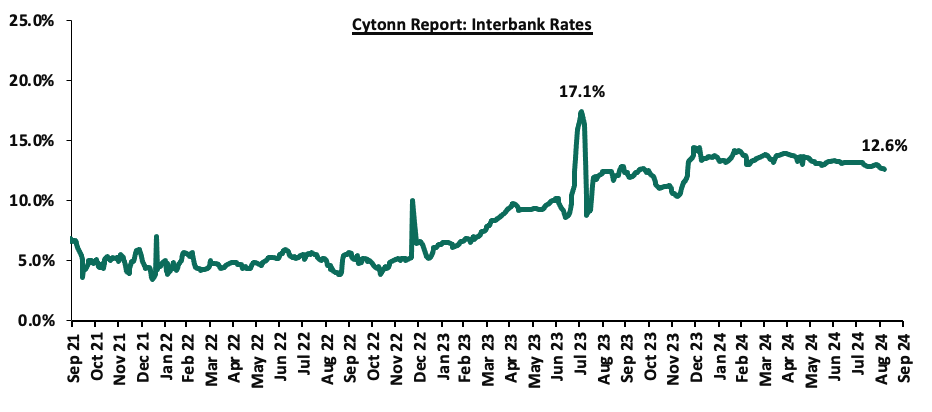
During the week, liquidity in the money markets eased, with the average interbank rate decreasing by 23.8 bps, to 12.6% from the 12.9% recorded the previous week, partly attributable to government payments that offset tax remittances. The average interbank volumes traded increased significantly by 95.6% to Kshs 28.7 bn from Kshs 14.7 bn recorded the previous week. The chart below shows the interbank rates in the market over the years:
Kenya Eurobonds:
During the week, the yields on Eurobonds were on an upward trajectory, with the yields on the 7-year Eurobond issued in 2019 increasing the most by 11.5 bps to 10.1% from 9.9% recorded the previous week. The table below shows the summary of the performance of the Kenyan Eurobonds as of 5th September 2024;
|
Cytonn Report: Kenya Eurobonds Performance |
||||||
|
|
2018 |
2019 |
2021 |
2024 |
||
|
Tenor |
10-year issue |
30-year issue |
7-year issue |
12-year issue |
13-year issue |
7-year issue |
|
Amount Issued (USD) |
1.0 bn |
1.0 bn |
0.9 bn |
1.2 bn |
1.0 bn |
1.5 bn |
|
Years to Maturity |
3.5 |
23.5 |
2.7 |
7.7 |
9.8 |
6.4 |
|
Yields at Issue |
7.3% |
8.3% |
7.0% |
7.9% |
6.2% |
10.4% |
|
01-Jan-24 |
9.8% |
10.2% |
10.1% |
9.9% |
9.5% |
|
|
29-Aug-24 |
10.3% |
10.8% |
9.9% |
10.4% |
10.4% |
10.6% |
|
30-Aug-24 |
10.2% |
10.7% |
9.9% |
10.4% |
10.3% |
10.5% |
|
02-Sep-24 |
10.2% |
10.7% |
9.9% |
10.4% |
10.3% |
10.5% |
|
03-Sep-24 |
10.3% |
10.8% |
10.0% |
10.5% |
10.4% |
10.7% |
|
04-Sep-24 |
10.4% |
10.8% |
10.0% |
10.6% |
10.4% |
10.7% |
|
05-Sep-24 |
10.3% |
10.8% |
10.1% |
10.5% |
10.4% |
10.6% |
|
Weekly Change |
0.1% |
0.0% |
0.1% |
0.1% |
0.0% |
0.1% |
|
MTD Change |
0.1% |
0.0% |
0.2% |
0.1% |
0.1% |
0.1% |
|
YTD Change |
0.5% |
0.6% |
(0.0%) |
0.6% |
0.9% |
- |
Source: Central Bank of Kenya (CBK) and National Treasury
Kenya Shilling:
During the week, the Kenya Shilling appreciated marginally against the US Dollar by 1.2 bps, to remain relatively unchanged at the Kshs 129.2 recorded the previous week. On a year-to-date basis, the shilling has appreciated by 17.7% against the dollar, a contrast to the 26.8% depreciation recorded in 2023.
We expect the shilling to be supported by:
- Diaspora remittances standing at a cumulative USD 4,571.7 mn in the 12 months to July 2024, 12.2% higher than the USD 4,075.7 mn recorded over the same period in 2023, which has continued to cushion the shilling against further depreciation. In the July 2024 diaspora remittances figures, North America remained the largest source of remittances to Kenya accounting for 54.9% in the period, and,
- The tourism inflow receipts which came in at USD 352.5 bn in 2023, a 31.5% increase from USD 268.1 bn inflow receipts recorded in 2022, and owing to tourist arrivals that improved by 27.2% in the 12 months to June 2024, from the arrivals recorded during a similar period in 2023.
The shilling is however expected to remain under pressure in 2024 as a result of:
- An ever-present current account deficit which came at 3.2% of GDP in Q1’2024 from 3.0% recorded in Q1’2023,
- The need for government debt servicing, continues to put pressure on forex reserves given that 67.9% of Kenya’s external debt is US Dollar-denominated as of March 2024, and,
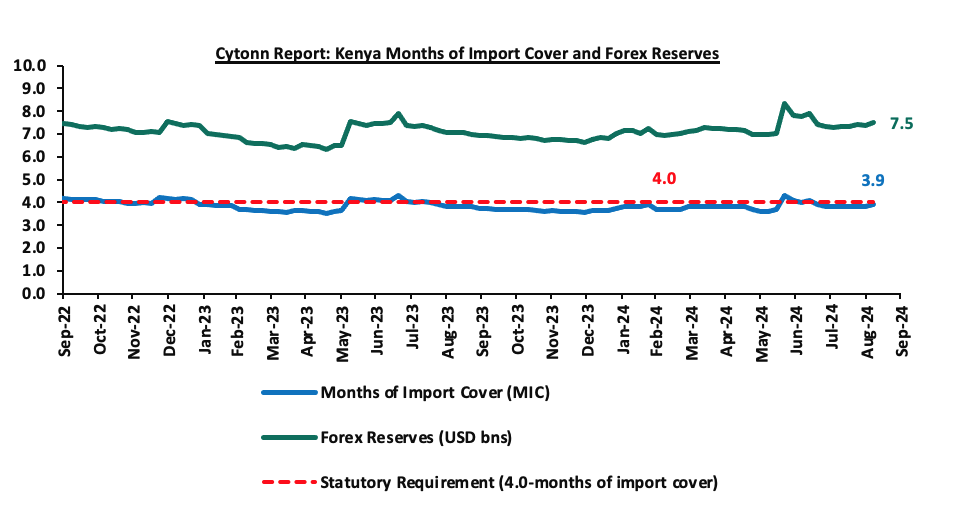
- Dwindling forex reserves currently at USD 7.5 bn (equivalent to 3.9-months of import cover), which is below the statutory requirement of maintaining at least 4.0-months of import cover, and also lower than the EAC region’s convergence criteria of 4.5-months of import cover.
Key to note, Kenya’s forex reserves increased marginally by 2.1% during the week to close the week at USD 7.5 bn from the USD 7.3 bn recorded the previous week, equivalent to 3.9 months of import cover, up from the 3.8 months recorded last week, and below the statutory requirement of maintaining at least 4.0-months of import cover. The chart below summarizes the evolution of Kenya's months of import cover over the years:
Weekly Highlights:
- Stanbic Bank’s August 2024 Purchasing Manager’s Index (PMI)
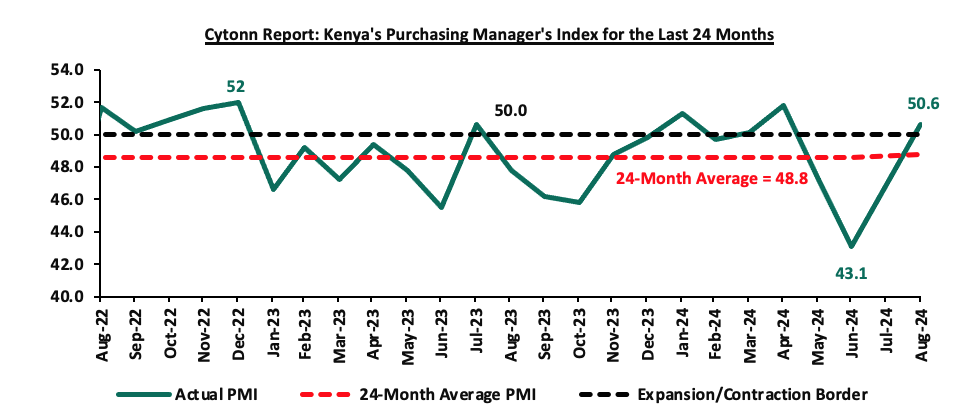
During the week, Stanbic Bank released its monthly Purchasing Manager's Index (PMI) highlighting that the index for the month of August 2024 improved, coming in at 50.6, up from 43.1 in July 2024, signaling a mild recovery in business conditions. This is attributable to the rise in activity following the conclusion of political demonstrations, which enabled businesses to resume operations.
Rising import prices and increased taxation resulted in the steepest increase in input costs since February. The rise in import prices was mainly attributable to the elevated fuel prices with the prices for Super Petrol, Diesel, and Kerosene remaining unchanged from the prices announced in July 2024. Consequently, Super Petrol, Diesel, and Kerosene will continue to retail at Kshs 188.8, Kshs 171.6, and Kshs 161.8 per litre respectively. However, overall inflationary pressures were relatively mild compared to historical trends. Notably, the y/y inflation in August 2024 rose marginally by 0.1% points to 4.4%, from the 4.3% recorded in July 2024.
In August, Kenyan businesses raised their output levels for the first time in three months. The growth rate was moderate but marked the second-fastest increase in over a year and a half. This is attributable to the rise in activity following the conclusion of political demonstrations, which enabled them to resume operations and fulfill new orders.
Output rose in three of the five key sector-services, wholesale & retail, and construction—while manufacturing and agriculture saw declines. New orders for Kenyan businesses also increased slightly, though weak customer spending remained a concern for some firms. Despite the marginal recovery in sales following a sharp drop in July, businesses chose to cut staff, marking the first employment decline of 2024.
Despite the general upturn, confidence in future activity levels declined even further in August. In fact, optimism reached its lowest point since the series began in 2024, with just 5.0% of companies anticipating growth over the next 12 months. The chart below summarizes the evolution of PMI over the last 24 months:
Going forward, we anticipate that the business environment will improve in the short to medium term as a result of the improving economic environment driven by lower interest rates following the easing monetary policy, the strengthening of the Kenyan Shilling against the USD and conclusion of the anti-government protests. However, we expect businesses to be weighed down by the high cost of living coupled with the high taxation, which are set to increase input costs.
Rates in the Fixed Income market have been on an upward trend given the continued high demand for cash by the government and the occasional liquidity tightness in the money market. The government is 126.2% ahead of its prorated net domestic borrowing target of Kshs 78.5 bn, having a net borrowing position of Kshs 177.7 bn. However, we expect a downward readjustment of the yield curve in the short and medium term, with the government looking to increase its external borrowing to maintain the fiscal surplus, hence alleviating pressure in the domestic market. As such, we expect the yield curve to normalize in the medium to long-term and hence investors are expected to shift towards the long-term papers to lock in the high returns.
Market Performance:
During the week, the equities market was on an upward trajectory, with NASI gaining the most by 1.8%, while NSE 20, NSE 25, and NSE 10 all gained by 1.7% each, taking the YTD performance to gains of 21.4%, 19.9%, 14.8%, and 13.2% for NSE 10, NSE 25, NASI, and NSE 20 respectively. The equities market performance was driven by gains recorded by large-cap stocks such as KCB Group, Equity Group, and Standard Chartered Bank of 6.1%, 5.1%, and 3.8% respectively. The performance was, however, weighed down by losses recorded by large-cap stocks such as Co-op Bank, BAT, and Absa Bank of 3.3%, 2.4%, and 1.7% respectively.
During the week, equities turnover decreased by 45.6% to USD 10.0 mn from USD 18.4 mn recorded the previous week, taking the YTD total turnover to USD 454.2 mn. Foreign investors remained net sellers with a net selling position of USD 2.3 mn, from a net selling position of USD 2.4 mn recorded the previous week, taking the YTD foreign net selling to USD 0.4 mn.
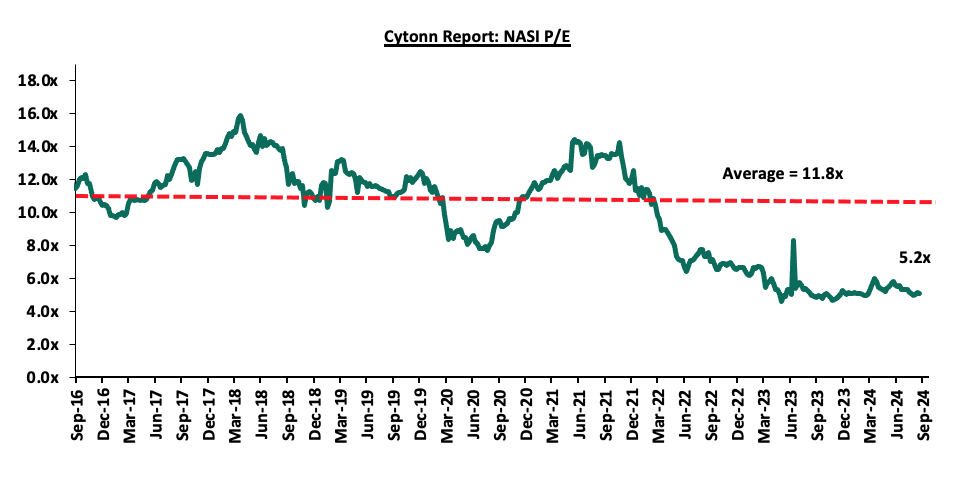
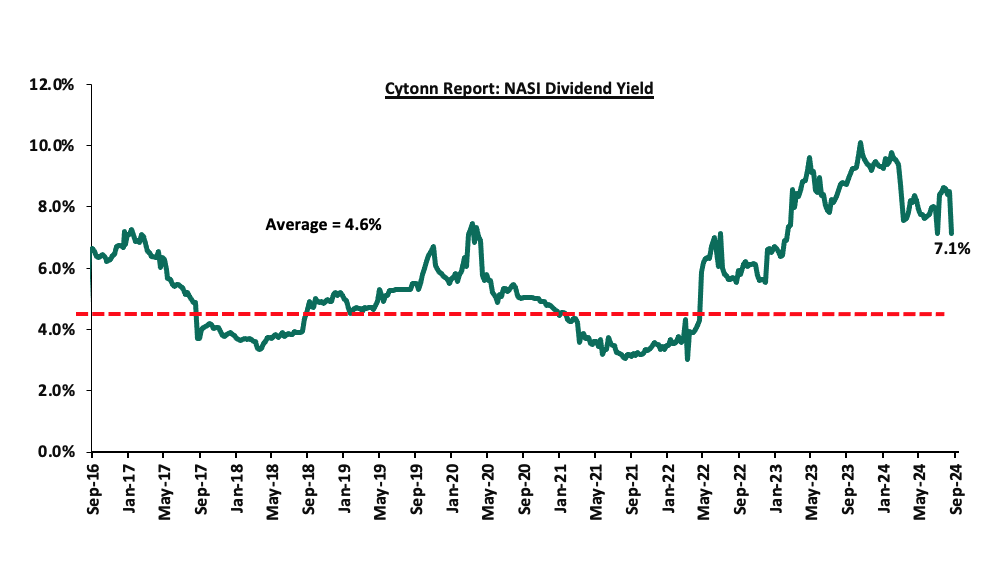
The market is currently trading at a price-to-earnings ratio (P/E) of 5.2x, 56.3% below the historical average of 11.8x. The dividend yield stands at 7.1%, 2.5% points above the historical average of 4.6%. Key to note, NASI’s PEG ratio currently stands at 0.6x, an indication that the market is undervalued relative to its future growth. A PEG ratio greater than 1.0x indicates the market is overvalued while a PEG ratio less than 1.0x indicates that the market is undervalued. The charts below indicate the historical P/E and dividend yields of the market;
Universe of Coverage:
|
Cytonn Report: Equities Universe of Coverage |
||||||||||
|
Company |
Price as at 30/08/2024 |
Price as at 06/09/2024 |
w/w change |
YTD Change |
Year Open 2024 |
Target Price* |
Dividend Yield |
Upside/ Downside** |
P/TBv Multiple |
Recommendation |
|
Jubilee Holdings |
150.3 |
155.0 |
3.2% |
(16.2%) |
185.0 |
260.7 |
9.2% |
77.4% |
0.2x |
Buy |
|
Diamond Trust Bank*** |
45.3 |
45.5 |
0.6% |
1.7% |
44.8 |
65.2 |
11.0% |
54.3% |
0.2x |
Buy |
|
Equity Group*** |
41.1 |
43.2 |
5.1% |
26.2% |
34.2 |
60.2 |
9.3% |
48.8% |
0.8x |
Buy |
|
CIC Group |
2.0 |
2.0 |
1.0% |
(11.4%) |
2.3 |
2.8 |
6.4% |
44.3% |
0.6x |
Buy |
|
Co-op Bank*** |
13.6 |
13.1 |
(3.3%) |
15.4% |
11.4 |
17.2 |
11.5% |
42.7% |
0.6x |
Buy |
|
KCB Group*** |
31.8 |
33.7 |
6.1% |
53.5% |
22.0 |
46.7 |
0.0% |
38.4% |
0.5x |
Buy |
|
NCBA*** |
43.1 |
43.7 |
1.5% |
12.5% |
38.9 |
55.2 |
10.9% |
37.2% |
0.8x |
Buy |
|
ABSA Bank*** |
14.3 |
14.1 |
(1.7%) |
21.6% |
11.6 |
17.3 |
11.0% |
34.2% |
1.1x |
Buy |
|
Stanbic Holdings |
119.8 |
121.3 |
1.3% |
14.4% |
106.0 |
145.3 |
12.7% |
32.5% |
0.8x |
Buy |
|
I&M Group*** |
22.1 |
22.0 |
(0.2%) |
26.1% |
17.5 |
26.5 |
11.6% |
32.0% |
0.5x |
Buy |
|
Britam |
5.5 |
5.8 |
4.3% |
12.1% |
5.1 |
7.5 |
0.0% |
30.2% |
0.8x |
Buy |
|
Target Price as per Cytonn Analyst estimates **Upside/ (Downside) is adjusted for Dividend Yield ***For Disclosure, these are stocks in which Cytonn and/or its affiliates are invested in |
||||||||||
Weekly Highlights
- Centum Investment Extends Share Buyback Program to September 2024
Centum Investment Company Plc has extended its ongoing Share Buyback Program, which began on February 6, 2023. The initial phase of the buyback was set to last for 18 months, concluding on 2nd August 2024. However, the company recently secured approval from the Capital Markets Authority (CMA) to extend the program up until its next Annual General Meeting (AGM), scheduled for September 20, 2024.
The buyback program was initiated as part of Centum's broader strategy to enhance shareholder value. Centum is authorized to repurchase up to 10.0% of its issued share capital from the open market. This translates to a potential buyback of up to 66,544,171 shares, with the maximum purchase price set at Kshs 9.03 per share. To date, the company has successfully repurchased 9,759,600 shares. The buyback is aimed at offering shareholders liquidity at a time when the company’s share price has been undervalued, with the share price dropping from Kshs 31.50 in 2019 to Kshs 7.98 by the buyback reference date of November 28, 2022.
The buyback program seeks to balance the supply and demand for Centum’s shares, stabilizing the stock price while providing an option for shareholders to realize immediate value. By reducing the number of outstanding shares, the program is expected to improve the company’s net asset value per share. Furthermore, it is designed to offer long-term shareholders potential future capital gains as market conditions improve
We are “Neutral” on the Equities markets in the short term due to the current tough operating environment and huge foreign investor outflows, and, “Bullish” in the long term due to current cheap valuations and expected global and local economic recovery. With the market currently being undervalued for its future growth (PEG Ratio at 0.6x), we believe that investors should reposition towards value stocks with strong earnings growth and that are trading at discounts to their intrinsic value. We expect the current high foreign investors’ sell-offs to continue weighing down the equities outlook in the short term.
- Real Estate Investments Trusts (REITs)
- Acorn Holding to Construct Two Hostels in Eldoret
During the week, Acorn Holdings, a Real Estate developer, completed the acquisition of a 0.79-acre piece of land in Eldoret along Makasembo Road, near the Moi Teaching & Referral Hospital and Moi University Medical School. The company had earlier hinted at this move in their semi-annual report 2024 after identifying Eldoret and Kakamega as the first tier two areas to host its student hostel developments, upon acquisition of land. The company is expected to launch a Kshs 1.6 bn two-hostel project under their Qwetu and Qejani brands, with each having a total of 514 rooms and 510 rooms respectively, and a combined bed capacity of 2,291.
Eldoret stands as a strategic location for the company due to a high student population supported by the presence of tertiary institutions, public universities such as the University of Eldoret, Moi University, and satellite campuses of several other institutions including the Catholic University of East Africa, University of Nairobi and Kisii University.
Upon completion, we expect the project to provide much-needed student accommodation in Eldoret, as demonstrated by the high number of tertiary learning institutions in the area. Additionally, we anticipate the project will economically boost local businesses and attract investment in retail spaces such as shops, as the growing student population will drive demand for goods and services. We also expect the project to encourage private landlords to improve their offerings to match the standards set by Acorn Holdings.
We expect the student accommodation market to remain resilient as enrolment into universities and tertiary institutions continues to rise. The Kenya National Bureau of Statistics (KNBS) highlighted that University enrollment for the 2023/2024 academic year increased by 3.0% year-on-year to 579,046 students from 561,674 in 2022/2023. For Technical, Vocational Education, and Training (TVET) institutions, student enrollment in 2023/2024 increased by 14.0% year-on-year to 642,726 students from 552,744 in 2022/2023. This will in turn increase the demand for quality and affordable student housing creating more opportunities for developers focused on student accommodation.
- REIT Weekly Performance
On the Unquoted Securities Platform, Acorn D-REIT and I-REIT traded at Kshs 25.4 and Kshs 22.2 per unit, respectively, as per the last updated data on 6th September 2024. The performance represented a 27.0% and 11.0% gain for the D-REIT and I-REIT, respectively, from the Kshs 20.0 inception price. The volumes traded for the D-REIT and I-REIT came in at Kshs 12.3 mn and Kshs 31.6 mn shares, respectively, with a turnover of Kshs 311.5 mn and Kshs 702.7 mn, respectively, since inception in February 2021. Additionally, ILAM Fahari I-REIT traded at Kshs 11.0 per share as of 9th August, 2024, representing a 45.0% loss from the Kshs 20.0 inception price. The volume traded to date came in at 138,600 for the I-REIT, with a turnover of Kshs 1.5 mn since inception in November 2015.
REITs offer various benefits, such as tax exemptions, diversified portfolios, and stable long-term profits. However, the ongoing decline in the performance of Kenyan REITs and the restructuring of their business portfolios are hindering significant previous investments. Additional general challenges include: i) insufficient understanding of the investment instrument among investors, ii) lengthy approval processes for REIT creation, iii) high minimum capital requirements of Kshs 100.0 mn for trustees, and iv) minimum investment amounts set at Kshs 5.0 mn for the Investment for D-REITs and Kshs 1.0 Mn for I-REITS, all of which continue to limit the performance of the Kenyan REITs market.
We expect the performance of Kenya’s Real Estate sector to be sustained by: i) increased investment from local and international investors, particularly in the residential sector ii) favorable demographics in the country, leading to higher demand for housing and Real Estate, (iii) government infrastructure development projects e.g. roads, opening up satellite towns for investment, and iv) increased enrollment in universities and other tertiary institutions supporting the take up of Purpose-Built Student Accommodation properties. However, challenges such as rising construction costs, strain on key infrastructure development, and high capital demands in the REITs sector will continue to impede the sector’s optimal performance by restricting developments and investments.
According to the ACTSERV Q2’2024 Retirement Benefits Schemes Investments Performance Survey, segregated retirement benefits schemes recorded a 6.6% return in Q2’2024, up from the 0.1% recorded in Q2’2023. The increase was largely supported by the performance of fixed income investments made by the schemes which recorded an 8.0% gain, 7.3% points above from the 0.7% return recorded in Q2’2023, on the back of declining interest rates across the yield curve, occasioned by easing inflation, decreased government domestic borrowing appetite and the relatively stable exchange rate. This week, we shall focus on understanding Retirement Benefits Schemes and look into the quarterly performance and current state of retirement benefits schemes in Kenya with a key focus on Q2’2024.
In our previous report, we highlighted some of the changes that were expected in the industry following the proposals in the now abandoned Finance Bill of 2024. The changes included:
- Registration of Retirement Funds – Currently, individual retirement Funds and Pension Funds need to be registered with the Commissioner for the enjoyment of tax deductions of up to Kshs 20,000 monthly per individual. The bill proposes that this requirement of registration with the Commissioner be eliminated, and bring this under the purview of the Retirement Benefits Authority (RBA),
- Tax exemptions on withdrawals – The current law grants tax exemptions for withdrawal of pensions for individuals who are sixty-five years old or more. With the proposed change, Pension benefits from registered pension funds, provident funds, individual retirement funds, or National Social Security Fund are now exempted from income tax upon reaching retirement age. This exemption also applies if a person retires early due to ill health or withdraws from the fund after twenty years of membership. This expansion of the exemption to include early retirement seeks to cover for unfortunate occurrences that were earlier not provided for in law,
- Pension withdrawal period – Currently, the law provides for reduced tax rates if payments are made 15 years from the start of contributions into a registered retirement benefits scheme or upon retirement. The bill proposes an extension of this period from the current 15 years to 20 years. This is aimed at encouraging individuals to keep money saved for retirement invested longer, reduce dependency on government upon retirement, and,
- Gratuity Paid to Pension funds – as it stands, the law currently exempts tax on amounts paid to pension funds for up to Kshs 20,000 monthly per individual. This finance bill proposes that the amount be increased to Kshs 30,000. This will offer further relief for individuals contributing to the pension schemes, although it is worth noting that this will majorly benefit high-income earners able to contribute up to Kshs 30,000 monthly to their retirement.
With the bill now abandoned, Treasury has promised to reintroduce these changes through an omnibus bill to be tabled in parliament.
Notably, in recent industry news, treasury data revealed that for the FY’2023/2024, Kshs 23.8 bn of pension perks were not released to pensioners, citing liquidity challenges. This was in violation of the fiscal requirement to treat pension payments as the first charge in the budget and affected at least 250,000 retirees. This brought back to light the biggest challenge that the country’s civil servants' pension system has had, the overreliance on the exchequer for payment of benefits. The Government had operated a defined benefits (non-contributory) Pension Scheme since independence fully financed through the Exchequer. Given the clear challenges that this system had and the need for reforms in the Public Service Pensions Sector, the Government enacted the Public Service Superannuation Scheme Act 2012. The Act set up the Public Service Superannuation Scheme in 2021, converting all the defined benefit schemes in the public sector to one defined contributions scheme to align with the best practices in the industry. The now new system took in all government officers below 45 years, and gave those above that age the option to join the new system while closing any new entrants to the previous system. Currently, employees in the scheme contribute 7.5% of their basic salary, while the government contributes 15.0%. The scheme is currently managed by Gen Africa Asset Managers, and of the latest data, has assets under management of Kshs 78.8 bn. Given the country’s fiscal constraints, the older pension scheme is likely to remain under pressure until the new system fully kicks in.
We have been tracking the performance of Kenya’s Pension schemes with the most recent topicals being, Kenya Retirement Benefits Schemes Q1’2024, Performance Kenya Retirement Benefits Schemes Q4’2023 Performance, Progress of Kenya’s Pension Schemes-2022 and Kenya Retirement Benefits Schemes FY’2021 Performance. This week, we shall focus on understanding Retirement Benefits Schemes and looking into the historical and current state of retirement benefits schemes in Kenya with a key focus on 2023 (latest official data) and what can be done going forward. We shall also analyze other asset classes such as REITs that the schemes can tap into to achieve higher returns. Additionally, we shall look into factors and challenges influencing the growth of the RBSs in Kenya as well as the actionable steps that can be taken to improve the pension industry. We shall do this by looking into the following:
- Introduction to Retirement Benefits Schemes in Kenya,
- Historical and Current State of Retirement Benefits Schemes in Kenya,
- Factors Influencing the Growth of Retirement Benefits Scheme in Kenya,
- Challenges that Have Hindered the Growth of Retirement Benefit Schemes, and,
- Recommendations on Enhancing the Performance of Retirement Benefits Schemes in Kenya;
Section I: Introduction to Retirement Benefits Schemes in Kenya
A retirement benefits scheme is a savings avenue that allows contributing individuals to make regular contributions during their productive years into the scheme and thereafter get income from the scheme upon retirement. There are a number of benefits that accrue to retirement benefits scheme members, including:
- Income Replacement – Retirement savings ensure that your income stream does not stop even when you stop working. After retirement, many experience a decline in the amount and stability of income relative to their productive years. Retirement savings ensure that this decline is manageable or non-existent and enables you to be able to live the lifestyle you desire even after retirement,
- Compounded and Tax-free interest – Savings in a pension scheme earn compounded interest which means that your money grows faster as the interest earned is reinvested. Additionally, retirement schemes’ investments are tax-exempt meaning that the schemes have more to reinvest,
- Tax-exempt contributions – Pension contributions enjoy a monthly tax relief of up to Kshs 20,000 or 30.0% of your salary whichever is less – this lessens the total PAYE deducted from your earnings,
- Avoid old age poverty – By providing an income in retirement, pension schemes ensure that the scheme members do not experience old age poverty where they have to rely on their family, relatives, and friends for survival, and,
- Home Ownership - Savings in a pension scheme can help you achieve your dream of owning a home. This can be done through a mortgage or a direct residential house purchase using your pension savings. A member may assign up to 60.0% of their pension benefits or the market value of the property, whichever is less, to provide a mortgage guarantee. The guarantee may enable the member to acquire immovable property on which a house has been erected, erect a house, add, or carry out repairs to a house, secure financing or waiver, as the case may be, for deposits, stamp duty, valuation fees and legal fees and any other transaction costs required. On the other hand, a pension scheme member may utilize up to 40.0% of their benefits to purchase a residential house directly subject to a maximum allowable amount of Kshs 7.0 mn and the amount they use should not exceed the buying price of the house.
Section II: Historical and the Current State of Retirement Benefits Schemes in Kenya
- Growth of Retirement Benefits Schemes
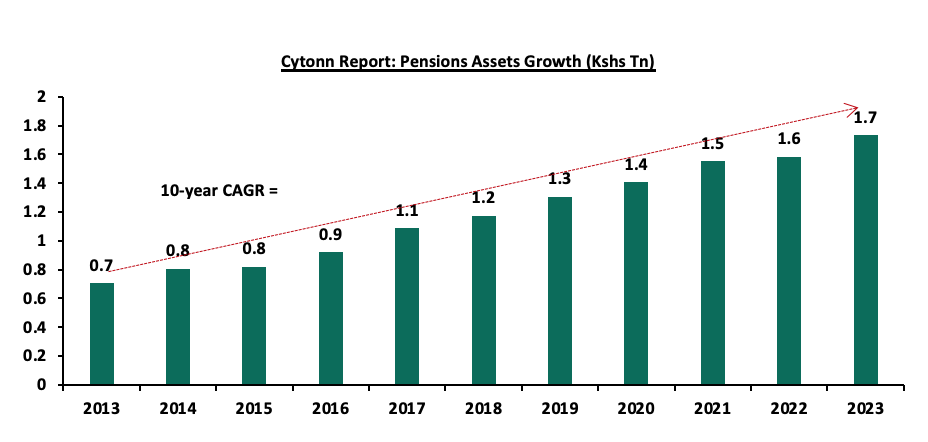
According to the Retirement Benefits Authority (RBA) Industry report for December 2023, assets under management for retirement benefits schemes increased by 9.4% to Kshs 1.7 tn in December 2023 from the Kshs 1.6 tn recorded in 2022. The growth of the assets can be attributed to the enhanced contributions to the mandatory scheme, NSSF, which began in earnest in February 2023 following the court of appeal ruling. The growth of the assets can be attributed to the enhanced contributions to the mandatory scheme, NSSF, which began in earnest in February 2023 following the court of appeal ruling which has now since gone to the supreme court and been reverted back to the lower courts, awaiting determination.
The graph below shows the growth of Assets under Management of the retirement benefits schemes over the last 10 years:
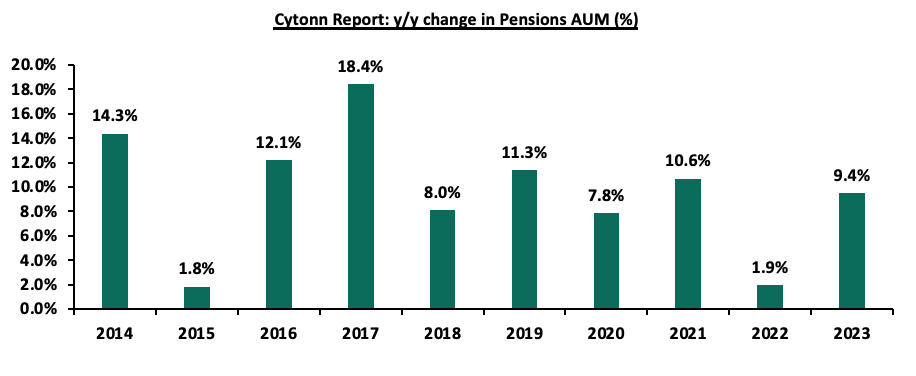
The 9.4% increase in Assets Under Management is a 7.5% increase in growth from the 1.9% growth that was recorded in 2022, demonstrating the significant role that the enhanced NSSF contributions made to the recovery of the industry’s performance following a difficult period in 2022.
The chart below shows the y/y changes in the assets under management for the schemes over the years.
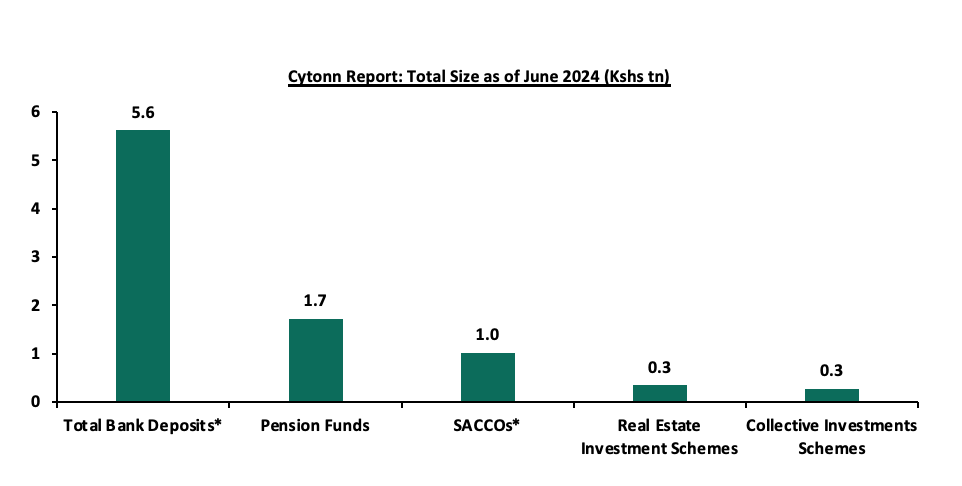
On a semi-annual basis, however, the assets grew by a paltry 1.3% to Kshs 1.73 tn in December 2023 from the Kshs 1.70 tn recorded in June 2023. This subdued growth of assets under management during the period is majorly attributed to negative movement in some asset classes such as quoted equities, listed corporate bonds, and unquoted equities. Despite the continued growth, Kenya is characterized by a low saving culture with research by the Federal Reserve Bank only 14.2% of the adult population in the labor force save for their retirement in Retirement Benefits Schemes (RBSs).
The graph below shows the Assets under Management of Pensions against other Capital Markets products and bank deposits:
Sources: CMA, RBA, SASRA and REIT Financial Statements
- Retirement Benefits Schemes Allocations and Various Investment Opportunities
Retirement Benefits Schemes allocate funds to various available assets in the markets aimed at the preservation of the members’ contributions as well as earning attractive returns. There are various investment opportunities that Retirement Benefits Schemes can invest in such as the traditional asset classes including equities and fixed income as well as alternative investment options such as Real Estate. As such, the performance of Retirement Benefits Schemes in Kenya depends on a number of factors such as;
- Asset allocation,
- Selection of the best-performing security within a particular asset class,
- Size of the scheme,
- Risk appetite of members and investors, and,
- Investment horizon.
The Retirement Benefits (Forms and Fees) Regulations, 2000 offers investment guidelines for retirement benefit schemes in Kenya in terms of the asset classes to invest in and the limits of exposure to ensure good returns and that members’ funds are hedged against losses. According to RBA’s Regulations, the various schemes through their Trustees can formulate their own Investment Policy Statements (IPS) to Act as a guideline on how much to invest in the asset option and assist the trustees in monitoring and evaluating the performance of the Fund. However, IPSs often vary depending on risk-return profile and expectations mainly determined by factors such as the scheme’s demography and the economic outlook. The table below represents how the retirement benefits schemes have invested their funds in the past:
|
Cytonn Report: Kenyan Pension Funds’ Assets Allocation |
|||||||||||||
|
Asset Class |
2014 |
2015 |
2016 |
2017 |
2018 |
2019 |
2020 |
2021 |
2022 |
2023 |
Average |
Limit |
|
|
Government Securities |
31.0% |
29.8% |
38.3% |
36.5% |
39.4% |
42.0% |
44.7% |
45.7% |
45.8% |
47.5% |
40.5% |
90.0% |
|
|
Quoted Equities |
26.0% |
23.0% |
17.4% |
19.5% |
17.3% |
17.6% |
15.6% |
16.5% |
13.7% |
8.4% |
17.5% |
70.0% |
|
|
Immovable Property |
17.0% |
18.5% |
19.5% |
21.0% |
19.7% |
18.5% |
18.0% |
16.5% |
15.8% |
14.0% |
17.4% |
30.0% |
|
|
Guaranteed Funds |
11.0% |
12.2% |
14.2% |
13.2% |
14.4% |
15.5% |
16.5% |
16.8% |
18.9% |
20.8% |
15.4% |
100.0% |
|
|
Listed Corporate Bonds |
6.0% |
5.9% |
5.1% |
3.9% |
3.5% |
1.4% |
0.4% |
0.4% |
0.5% |
0.4% |
2.7% |
20.0% |
|
|
Fixed Deposits |
5.0% |
6.8% |
2.7% |
3.0% |
3.1% |
3.0% |
2.8% |
1.8% |
2.7% |
4.8% |
3.4% |
30.0% |
|
|
Offshore |
2.0% |
0.9% |
0.8% |
1.2% |
1.1% |
0.5% |
0.8% |
1.3% |
0.9% |
1.6% |
1.2% |
15.0% |
|
|
Cash |
1.0% |
1.4% |
1.4% |
1.2% |
1.1% |
1.2% |
0.9% |
0.6% |
1.1% |
1.5% |
1.2% |
5.0% |
|
|
Unquoted Equities |
0.0% |
0.4% |
0.4% |
0.4% |
0.3% |
0.3% |
0.2% |
0.2% |
0.3% |
0.2% |
0.4% |
5.0% |
|
|
Private Equity |
0.0% |
0.0% |
0.0% |
0.0% |
0.1% |
0.1% |
0.1% |
0.2% |
0.2% |
0.3% |
0.1% |
10.0% |
|
|
REITs |
0.0% |
0.0% |
0.1% |
0.1% |
0.1% |
0.0% |
0.0% |
0.0% |
0.0% |
0.6% |
0.1% |
30.0% |
|
|
Commercial Paper, non-listed bonds by private companies |
0.0% |
0.0% |
0.0% |
0.0% |
0.0% |
0.0% |
0.0% |
0.0% |
0.0% |
0.0% |
0.0% |
10.0% |
|
|
Others e.g. unlisted commercial papers |
0.0% |
0.0% |
0.0% |
0.0% |
0.0% |
0.0% |
0.0% |
0.1% |
0.2% |
- |
0.0% |
10.0% |
|
|
Total |
100.0% |
100.0% |
100.0% |
100.0% |
100.0% |
100.0% |
100.0% |
100.0% |
100.0% |
100.0% |
100.0% |
100.0% |
|
Source: Retirement Benefits Authority
Key Take-outs from the table above are;
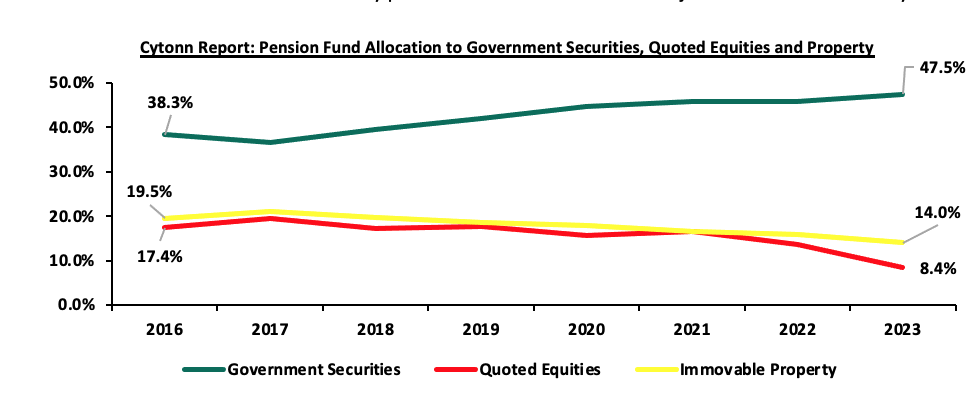
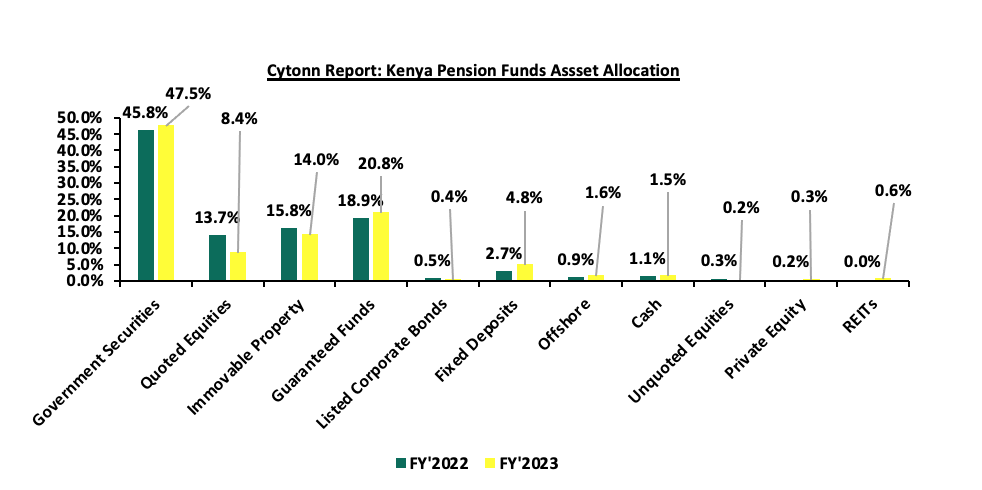
- Schemes in Kenya allocated an average of 58.0% of their members’ funds towards government securities and Quoted Equities between the period of 2013 and 2023. The 40.5% average allocation to government securities is the highest among the asset classes attributable to safety assurances of members’ funds because of low-risk investments and the elevated yields in the country in 2023,
- The allocation towards quoted equities declined to 8.4% as of December 2023, from 13.7% in 2022 on the back of increased capital flight as foreign investors sold off their investments in the Kenyan equities market due to macroeconomic uncertainties in the country as well a series of interest rate hikes in the developed economies, and,
- Retirement Benefits Schemes investments in offshore markets increased by 0.7% points to 1.6% as of December 2023, from 0.9% in 2022 as a result of the weakening Kenyan currency which made offshore investments attractive to preserve the value of investments and take advantage of exchange rate gains.
The chart below shows the allocation by pension schemes on the three major asset classes over the years:
Source: RBA Industry report
Performance of the Retirement Benefit Schemes
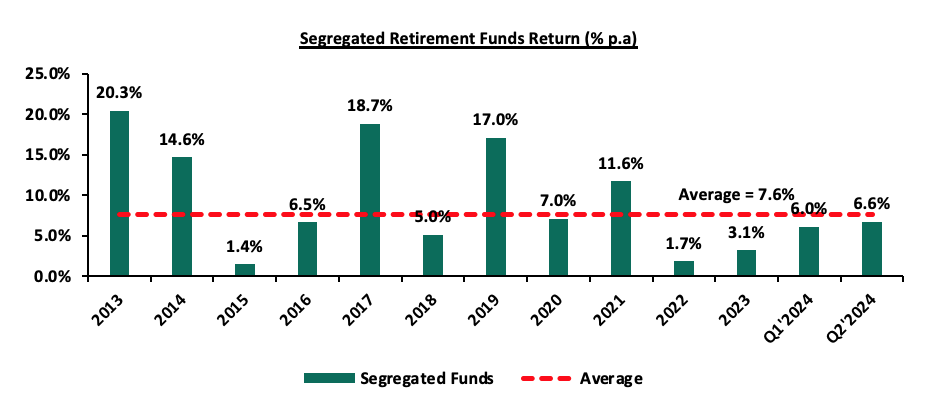
According to the ACTSERV Q2’2024 Pension Schemes Investments Performance Survey, the ten-year average return for segregated schemes over the period 2015 to 2024 was 10.0% with the performance fluctuating over the years to a high of 18.7% in 2017 and a low of 1.4% in 2015 reflective of the markets performance. Notably, segregated retirement benefits scheme returns increased to 6.6% return in Q2’2024, up from the 0.1% recorded in Q1’2023.
The chart below shows the quarterly performance of segregated pension schemes since 2021:
Source: ACTSERV Survey Reports (Segregated Schemes)
The key take-outs from the graph include:
- Schemes recorded a 6.6% gain in Q2’2024, representing a 0.6% increase from the 6.0% gain recorded in Q1’2024. The performance was largely driven by an 8.0% gain in fixed income investments in comparison to the 2.9% gain recorded in Q1’2024, largely attributable to declining interest rates across the yield curve, occasioned by easing inflation, decreased government domestic borrowing appetite and the relatively stable exchange rate. Offshore assets also registered increased returns, recording a 1.6% in Q2’2024, from the 9.2% decline recorded in Q1’2024, a significant 10.8% points increase, majorly on the back of lower interest and,
- Overall returns for Q2’2024 increased by 6.5% points to 6.6%, from 0.1% in Q1’2023 largely due to an 8.0% gain in fixed income investments in comparison to the 0.7% gain recorded in Q2’2024, in addition to the 4.6% points gain in the equities market from a decline of 4.3% to a gain of 0.3%.
The survey covered the performance of asset classes in three broad categories: Fixed Income, Equity, Offshore, and Overall Return.
Below is a graph showing the first quarter performances over the period 2020-2024:
|
Cytonn Report: Quarterly Performance of Asset Classes (2020 – 2024) |
||||||
|
|
Q2'2020 |
Q2'2021 |
Q2'2022 |
Q2'2023 |
Q2'2024 |
Average |
|
Fixed Income |
3.7% |
3.3% |
1.5% |
0.7% |
8.0% |
3.4% |
|
Equity |
5.4% |
11.9% |
(15.4%) |
(4.3%) |
0.3% |
(0.4%) |
|
Offshore |
25.3% |
10.2% |
(17.3%) |
14.6% |
1.6% |
(6.9%) |
|
Overall Return |
4.1% |
5.4% |
(2.9%) |
0.1% |
6.6% |
2.7% |
Source: ACTSERV Surveys
Key take-outs from the table above include;
- Returns from Fixed Income recorded an increase of 7.3% points to 8.0% in Q2’2024 from the 0.7% recorded in Q2’2023. This performance in Q2’2024 is partially attributable to declining interest rates across the yield curve, occasioned by easing inflation, decreased government domestic borrowing appetite, and the relatively stable exchange rate. These lower rates, compared to 2023 rates, meant that existing bonds owned by the schemes were going for higher prices in the secondary bond market and hence higher valuation on the mark -to-market basis. Fixed income has continued to offer stable returns with little volatility over the years, recording the highest return in Q4’2023,
- Returns from Equity investments also recorded a sizeable increase by 4.6% points to a 0.3% gain in Q2’2024, from the 4.3% decline recorded in Q2’2023. The performance was partly attributable to positive investor sentiment and renewed investor confidence following the performance of the Kenyan currency this year, having gained by 18.2% on a year-to-date basis, and,
- Returns from the Offshore investments recorded a sharp decline of 13.0% in Q2’2024, to a 1.6% return from the 14.6% recorded in Q2’2023. The performance was partly attributable to sustained high interest rates as policymakers prioritize inflation control, pushing back anticipated rate cuts to the second half of the year, appreciation of the currency, and rising geopolitical tensions, with the instability in Ukraine and Israel. In H1’2024, the Kenya Shilling gained against the US Dollar by 17.2%, to close at Kshs 129.5, from Kshs 156.5 recorded at the start of the year. This appreciation led to a decrease in returns on offshore investments denominated in foreign currencies.
Other Asset Classes that Retirement Benefit Schemes Can Leverage on
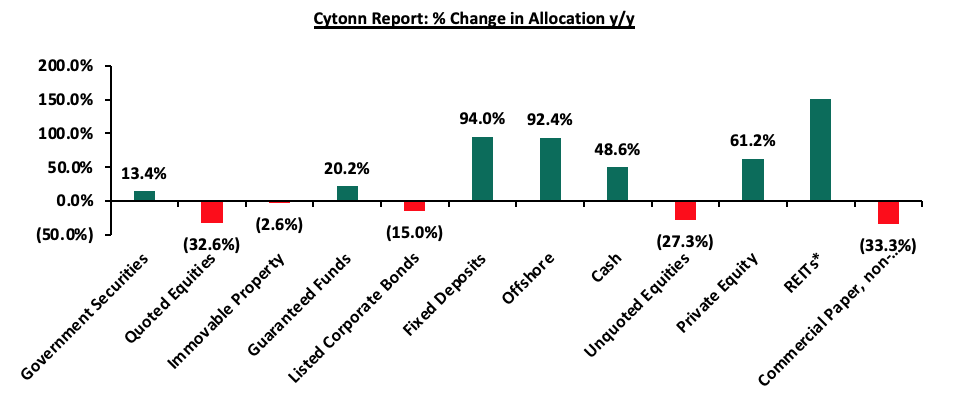
Retirement benefits schemes have for a long time skewed their investments towards traditional assets, mostly, government securities and the equities market, averaging 58.0% as of 2023, leaving only 42.0% for the other asset classes. In the asset allocation, alternative investments that include immovable property, private equity as well as Real Estate Investments Trusts (REITs) account for an average of only 15.4% against the total allowable limit of 70.0%. This is despite the fact that these asset classes such as REITs offer benefits such as low-cost exposure to Real Estate and tax incentives hence the potential for better returns. It is vital to note, however, that FY’2023 recorded one of the most significant increase in investments in Real Estate Investment Trusts by 3,871.4% to 11.1 bn from 0.3 bn recorded in FY’2022. This is partly attributable to the unveiling of the Local Authorities Pension Trust (LAPTRUST) during the year, as the first pension-driven REIT listed in the Nairobi Securities Exchange (NSE). Additionally, allocation to Private Equity increased by 61.2% to Kshs 5.7 bn from Kshs 3.6 bn in FY’2023.
The graph below shows the y/y change in allocation to the various asset classes;
Source: RBA Industry Report
However, in terms of overall asset allocation, alternative investments still lagged way behind the other asset classes, as demonstrated in the graph below;
Source: RBA Industry Report
We believe that Alternative Investments including REITs would play a big role in improving the performance of retirement benefits schemes;
- Alternative Investments (Immovable Property, Private Equity and REITs)
Alternative Investments refers to investments that are supplemental strategies to traditional long-only positions in equities, bonds, and cash. They differ from traditional investments on the basis of complexity, liquidity, and regulations and can invest in immovable property, private equity, and Real Estate Investment Trusts (REITs) to a limit of 70.0% exposure. The schemes’ allocation to alternative investments has averaged only 6.1% in the period 2014 to 2023, with the allocation to immovable property at an average of 17.8% during the period. The low allocation is partly attributable to bureaucracies and insufficient expertise and experience with these asset classes as investing in them requires adequate research and expertise.
According to RBA regulations, schemes can cumulatively invest up to 70.0% of their assets in private equity, immovable property, and REITs. However, the allocation between 2013 and 2021 has averaged 13.9%, with Q1’2024 allocation coming in at 15.4%.
Additionally, asset classes such as listed REITs have experienced numerous challenges and performed poorly over time. It is vital to note, however, that FY’2023 recorded one of the most significant increase in investments in Real Estate Investment Trusts which grew by 3,871.4% to 11.1 bn from 0.3 bn recorded in FY’2022. This follows the unveiling of the Local Authorities Pension Trust (LAPTRUST) during the year, as the first pension-driven REIT listed in the Nairobi Securities Exchange (NSE). Despite the growth in allocation, Kshs 11.0 bn is still a drop in the ocean compared to the assets under management. We believe that there is value in the alternative markets that schemes can take advantage of. Some of the key advantages of alternatives investments include:
- Diversification: Investing in a variety of asset classes such as REITs, fixed income securities and equities helps to reduce risk when incorporated into a single investment, as it spreads the investments across diverse locations, sectors, platforms, and classes. REIT institutions typically own physical assets such as land and buildings, and frequently enter into lengthy leases with their tenants. This makes REITs some of the most dependable investments on the market. This diversification creates the opportunity for a blended portfolio to earn higher returns while reducing the potential for negative or low returns, and,
- Competitive Long-Term Returns: REITs provide robust and long-term yields. This makes them an ideal component of a successful and efficient portfolio.
Section III: Factors Influencing the Growth of Retirement Benefit Schemes
The retirement benefit scheme industry in Kenya has registered significant growth in the past 10 years with assets under management growing at a CAGR of 9.4% to Kshs 1.7 tn in FY’2023, from Kshs 0.7 tn in 2013. The growth is attributable to:
- Increased Pension Awareness – More people are becoming increasingly aware of the importance of pension schemes and as such, they are joining schemes to grow their retirement pot which they will use during their golden years. Over the last 20 years, pension coverage has grown from 12.0% to about 25.0% of the labour force. This growth reflects industry-wide initiatives to increase awareness among Kenyan citizens on the need for retirement planning and innovations,
- Legislation – As earlier discussed, the Finance Bill 2024, is the latest proposed piece of legislation that will affect the pension industry. It adds to the Retirement Benefits (Good Governance Practices) Guidelines, 2018 and Retirement Benefits (Treating Customers Fairly) Guidelines, 2019 which aim to ensure that pension schemes are well anchored on practices that ensure effective and efficient service delivery of the pension schemes. This has raised standards in the way retirement schemes conduct their day-to-day businesses and increased confidence in the pension industry. Additionally, the implementation of the National Social Security Fund Act, 2013 is entering its second year and is expected to foster the growth of the pension industry by allowing both the employees in the formal and informal sector to save towards their retirement, as opposed to the previous NSSF Act cap 258 of 1965, which was only targeting the employees in the formal sector,
- Public-Private partnerships - Public-private partnerships can be instrumental in expanding financial inclusion in the Kenyan pension sector. Collaborations between the government and private financial institutions can lead to the development and promotion of inclusive pension products. In Kenya, the National Social Security Fund (NSSF) is currently licensing and partnering with the private sector (Pension Fund Managers) to invest and manage NSSF Tier II contributions. This is a good example that the government is giving employees, employers, and persons in the informal sector to invest and save for their retirement in the private sector,
- Tax Incentives - Members of Retirement Benefit Schemes are entitled to a maximum tax-free contribution of Kshs 20,000 monthly or 30.0% of their monthly salary, whichever is less. Consequently, pension scheme members enjoy a reduction in their taxable income and pay less taxes. This incentive has motivated more people to not only register but also increase their regular contributions to pension schemes,
- Micro-pension schemes - Micro-pension schemes are tailored to address the needs of Kenyans in the informal sector with irregular earnings. These schemes allow people to make small, flexible contributions towards their retirement. By accommodating their financial realities, micro-pensions can attract a broader segment of the population into the pension sector. Examples of these pension schemes are Mbao Pension Plan and Individual Pension Schemese. Britam Individual Pension Plan where one can start saving voluntarily and any amount towards their retirement,
- Relevant Product Development – Pension schemes are not only targeting people in formal employment but also those in informal employment through individual pension schemes, with the main aim of improving pension coverage in Kenya. To achieve this, most Individual schemes have come up with flexible plans that fit various individuals in terms of affordability and convenience. Additionally, the National Social Security Fund Act, 2013 contains a provision for self-employed members to register as members of the fund, with the minimum aggregate contribution in a year being Kshs 4,800 with the flexibility of making the contribution by paying directly to their designated offices or through mobile money or any other electronics transfers specified by the board,
- Demographics - Kenya’s rising population has played a big role in supporting the pensions industry in Kenya. The young population aged 15-24, currently at a population of 10.4 mn approximately 19.6% of the total population, has grown rapidly with the United Nations projecting that the corresponding population of youth in Kenya aged 15-24 years and ready to join the workforce will increase to 18.0 mn, from 9.5 mn over the period 2015 to 2065. This will support the continuous increase in people joining the workforce and saving for retirement. Which will consequently increase scheme membership significantly,
- Technological Advancement – The adoption of technology into pension schemes has improved the efficiency and management of pension schemes. Additionally, the improvement of mobile penetration rate and internet connectivity has enabled members to make contributions and track their benefits from the convenience of their mobile phones, and,
- Financial literacy programs - Financial literacy programs play a vital role in promoting the growth of retirement benefit schemes by enhancing financial inclusion among the public. Educating the public about the benefits of retirement savings and how to navigate pension schemes can empower individuals to take control of their financial future. The Retirement Benefits Authority (RBA) is at the forefront of ensuring the public is educated on financial literacy by organizing free training.
Section IV: Challenges that Have Hindered the Growth of Retirement Benefit Schemes
Despite the expansion of the Retirement Benefit industry, several challenges continue to hinder its growth. Key factors include:
- Market Volatility – In segregated schemes, investment returns are not guaranteed and are subject to market fluctuations. For instance, in Q2’2024, the equities market experienced a decline of 3.2% in, a reversal from the significant 25.6% gain in the first quarter of 2024. Such volatility creates uncertainty in retirement savings growth,
- Inadequate Contributions - Even where there is coverage, the contributions made are often insufficient to meet future retirement needs, leading to concerns about the adequacy of pension benefits upon retirement,
- High Unemployment Rate – According to the Kenya National Bureau of Statistics Q4’2022 labour report, 6% of Kenya’s 29.1 mn working-age population aged between 15-64 years was unemployed. This high unemployment rate makes it difficult for many individuals to consistently contribute to retirement schemes,
- Premature Access to Savings – Members of individual pension schemes can withdraw 100.0% of their contributions, excluding any transferred employer contributions. In umbrella and occupational schemes, members can access up to 50.0% of their benefits before reaching retirement age, often due to job loss or changing employers. While this provides short-term relief, it reduces the value of retirement savings, limiting the sector's growth potential,
- Low Pension Coverage in the Informal Sector – The informal sector is a significant part of Kenya's economy but is marked by irregular incomes and job insecurity. The Retirement Benefit Statistical Digest 2021 reports that only 266,764 individuals are registered in individual pension schemes. This number is low compared to the 15.2 mn people in the informal sector, representing 83.2% of the total workforce (Kenya National Bureau of Statistics Economic Survey Report 2022). Many in this sector prioritize immediate financial needs over long-term savings, and traditional pension products may not meet their financial realities,
- Unremitted Contributions – Some employers face financial constraints and fail to remit pension contributions to umbrella and occupational schemes. This underfunding has led to an increase in unremitted contributions, rising from Kshs 34.7 bn in 2020 to Kshs 42.8 bn in 2021, as reported in the Retirement Benefit Statistical Digest 2021, and,
- Delayed Benefit Payments – The process of paying retirement benefits involves multiple steps, from determining accrued benefits to obtaining approvals from pension scheme trustees and employers. Delays are common as files move between service providers, creating frustration for retirees. These delays can discourage potential members from joining retirement schemes.
Section V: Recommendations to Enhance the Growth and Penetration of Retirement Benefit Schemes in Kenya
- Reintroduction of Finance Bill 2024 proposals for the industry – the proposals in the infamous Finance Bill 2024 were progressive for the pensions industry and would serve better being brought back. These changes held significant potential for enhancing the retirement system. Bringing the registration of retirement funds under the Retirement Benefits Authority (RBA) instead of the Commissioner will streamline the process, while the expanded tax exemptions on withdrawals for early retirement and health-related circumstances offer more equitable coverage. The other proposal of extending the pension withdrawal period from 15 to 20 years encourages long-term savings and helps alleviate future dependency on government support. Additionally, increasing the gratuity tax exemption limit to Kshs 30,000 will further incentivize contributions to retirement schemes, although its benefits will primarily impact high-income earners.
- Strengthen Public Education and Awareness – To increase participation in pension schemes, particularly in the informal sector, there should be continuous public education on the importance of long-term savings for retirement. Efforts should focus on highlighting the benefits of pension schemes, including tax incentives and the security they offer in old age. The Retirement Benefits Authority (RBA) has recently been at the fore front of this much-needed campaign, organizing seminars, workshops, and roadshows to meet this objective,
- Develop Tailored Pension Products for the Informal Sector – Introducing flexible pension products that cater to the unique financial circumstances of those in the informal sector is critical. Products should allow irregular contributions and be easily accessible through mobile platforms, enabling workers with fluctuating incomes to save for retirement in a way that suits their needs,
- Improve Regulatory Framework to Address Unremitted Contributions – To tackle the issue of unremitted contributions, stricter regulations and penalties for non-compliant employers should be enforced. This would help reduce the increasing amount of unremitted funds and ensure pension schemes are adequately funded,
- Enhance Investment Diversification and Risk Management – Pension schemes should focus on diversifying their portfolios to minimize the impact of market volatility. By balancing investments across different asset classes, such as government bonds, equities, and alternative investments, schemes can provide more stable returns for members,
- Streamline the Benefit Payment Process – The process of approving and disbursing retirement benefits should be streamlined to reduce delays. Automating certain steps and creating clear timelines for each stage of the process would help retirees receive their benefits promptly, improving trust and encouraging broader participation in pension schemes,
- Promote Employer Participation in Pension Schemes – The government and industry stakeholders should incentivize all employers to enroll their employees in occupational pension schemes. This can be achieved through tax benefits, financial support programs, or public recognition for employers who consistently contribute to their employees' retirement plans, and,
- Introduce Policy Reforms to Limit Premature Withdrawals – While providing flexibility to access savings in times of need is important, there should be policy reforms that encourage individuals to retain a larger portion of their savings until retirement. This can be done by limiting the percentage of funds accessible before retirement or introducing financial counselling programs for individuals considering early withdrawals.
These recommendations will definitely foster sustainable growth in Kenya's retirement benefit schemes by addressing some of the structural challenges that currently hinder the sector's potential.
Disclaimer: The views expressed in this publication are those of the writers where particulars are not warranted. This publication, which is in compliance with Section 2 of the Capital Markets Authority Act Cap 485A, is meant for general information only and is not a warranty, representation, advice, or solicitation of any nature. Readers are advised in all circumstances to seek the advice of a registered investment advisor.

