Review of Real Estate Investments Trusts (REITs) in Kenya, & Cytonn Weekly #05/2026
By Cytonn Research, Feb 8, 2026
Executive Summary
Fixed Income
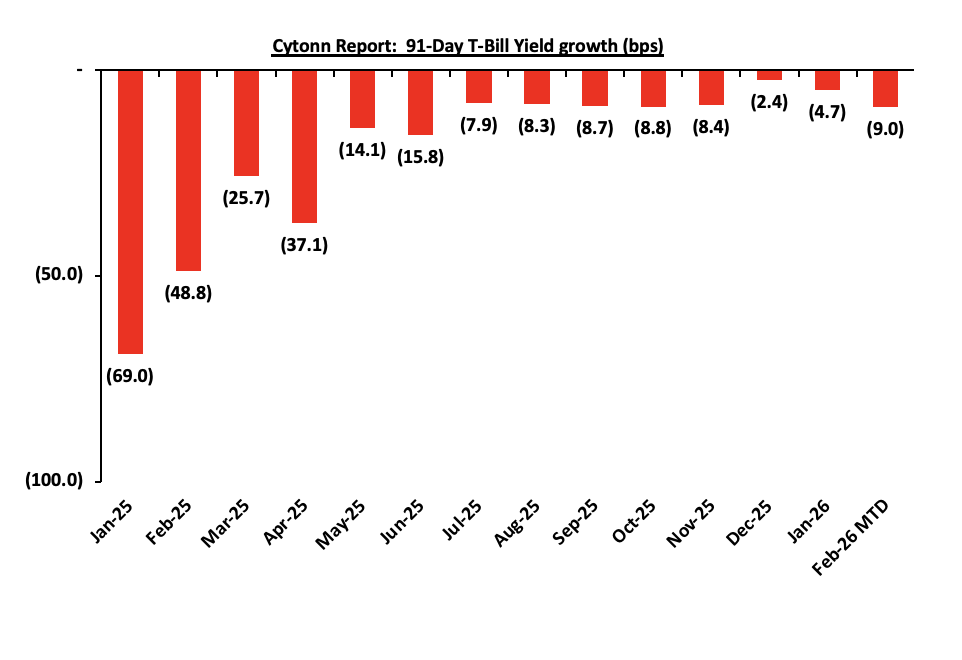
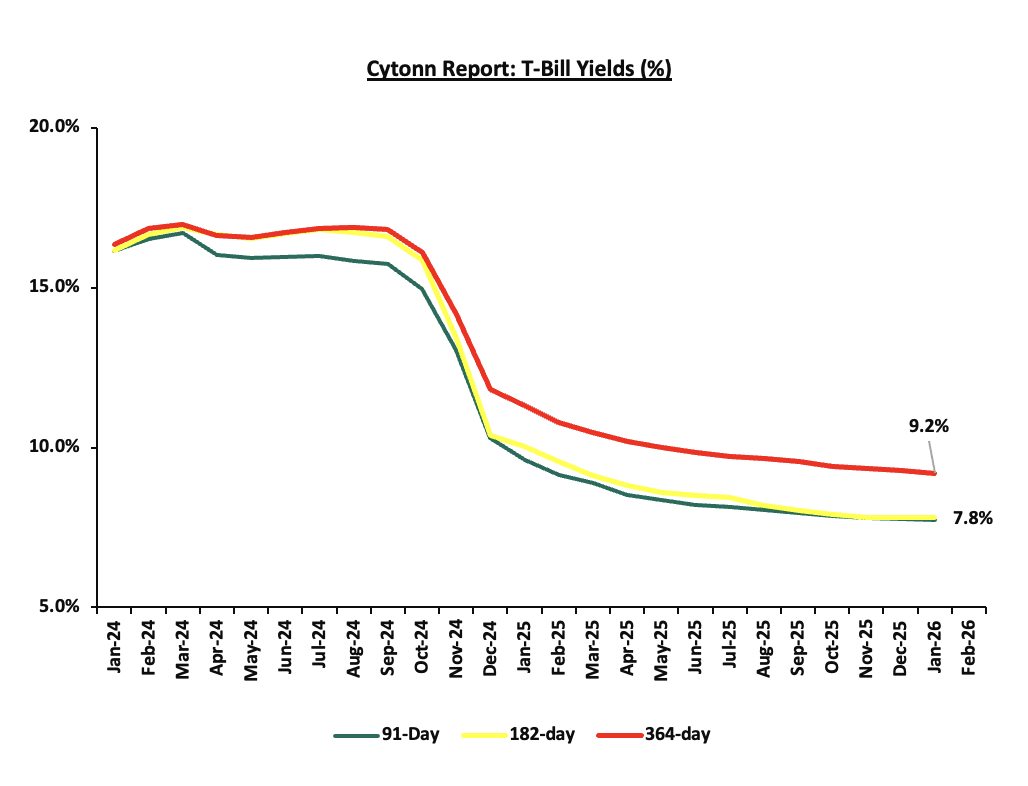
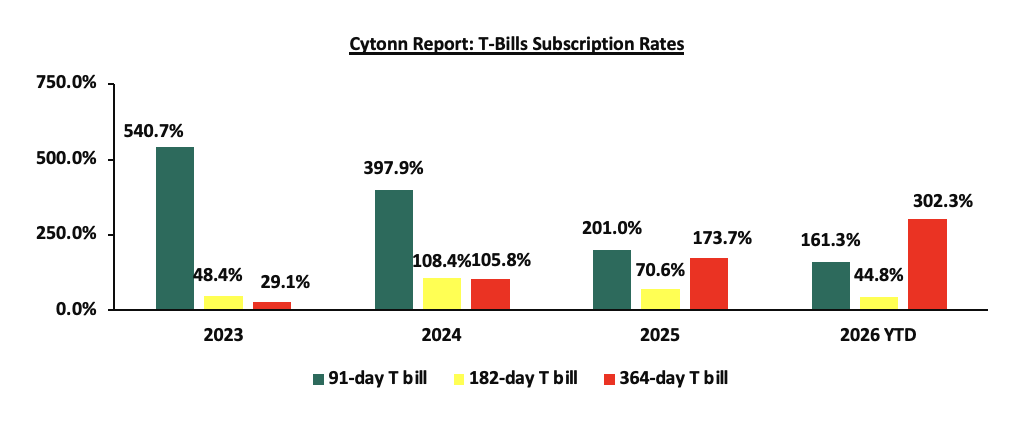
During the week, T-bills were oversubscribed for the second consecutive week, with the overall subscription rate coming in at 267.8%, higher than the subscription rate of 196.7% recorded the previous week. Investors’ preference for the shorter 91-day paper waned, with the paper receiving bids worth Kshs 13.0 bn against the offered Kshs 4.0 bn, translating to a subscription rate of 323.9%, however, higher than the subscription rate of 158.8%, recorded the previous week. The subscription rate for the 182-day paper decreased to 5.0% from the 22.8% recorded the previous week, while that of the 364-day papers increased significantly to 508.3% from 385.8% recorded the previous week. The government accepted a total of Kshs 50.0 bn worth of bids out of Kshs 64.3 bn bids received, translating to an acceptance rate of 77.8%.The yields on the government papers were on a downward trajectory, with the yield on the 182-day paper decreasing the most by 1.2 bps to remain relatively unchanged at the 7.8% compared to the previous week, while the yields on the 364-day and 91-day papers decreased by 0.7 bps and 0.3 bps to remain relatively unchanged at the 9.2% and 7.6% respectively compared to the previous week;
During the week, Stanbic Bank released its monthly Purchasing Manager’s Index (PMI), highlighting that the index for the month of January 2026 remained in expansion territory, coming in at 51.9, albeit lower than 53.7 recorded in December 2025, marking the fifth consecutive month the index remained above the 50.0 neutral mark, signaling a sustained improvement in business conditions, mainly attributable to continued growth in output and new orders;
The Monetary Policy Committee (MPC) is scheduled to meet on Tuesday, 10th February 2026, to review the outcome of its previous policy decisions and recent global and domestic economic developments, and to decide on the direction of the Central Bank Rate (CBR). We expect the MPC to cut the Central Bank Rate (CBR) to within a range of 9.00% - 8.75%. Please see our MPC Note;
Equities
During the week, the equities market was on an upward trajectory, with NASI, NSE 10, NSE 25, and NSE 20 gaining by 3.8%, 2.3%, 2.2%, and 1.5% respectively, taking the YTD performance to gains of 8.2%, 6.6%, 6.3% and 6.0% for NASI, NSE 20, NSE 25 and NSE 10 respectively. The equities market performance was mainly driven by gains recorded by large cap stocks such as Safaricom, BAT, and DTB-K of 8.1%, 5.6% and 5.0% respectively. However, the performance was weighed down by losses recorded by large cap stocks such as EABL and NCBA of 3.3%, and 0.3% respectively;
Also, during the week, the banking sector index gained by 1.6% to 218.5 from 215.0 recorded the previous week. This is attributable to gains recorded by stocks such as DTB-K, Cooperative Bank, and Stanbic, of 5.0%, 4.2% and 3.8% respectively. However, the performance was weighed down by losses recorded by stocks such as NCBA of 0.3%;
Additionally, in the regional equities market, the East African Exchanges 20 (EAE 20) share index gained by 0.6%, attributable to gains recorded by large cap stocks such as CRDB Bank, NMB Bank and MTN Uganda of 17.8%, 9.0% and 8.7% respectively. The performance was however, weighed down by losses recorded by large cap stocks such as Tanga Cement and Cimerwa Plc of 8.5%, and 0.1% respectively;
During the week, Kenya Power & Lighting Company Plc (KPLC) released its HY’2026 financial results, recording an 4.3% increase in profitability to Kshs 10.4 bn, up from Kshs 10.0 bn in HY’2025. The performance was mainly attributable to a 5.9% increase in gross profit to Kshs 38.2 bn, from Kshs 36.0 bn in HY’2025 coupled with a 25.0% decrease in finance costs to Kshs 1.5 bn from the Kshs 2.0 bn in H1’ 2025;
Real Estate
During the week, Knight Frank, an international Real Estate consultancy and management firm, released the Kenya Market Update H2’2025 Report highlighting the performance of key Real Estate sectors in the country;
During the week, the Nairobi City County Government announced plans to redesign and replan Westlands following a surge in high-rise developments that has strained infrastructure and social amenities in the area The county has advertised a tender for the preparation of a Local Physical and Land Use Development Plan for the Westlands zone, which will guide and regulate future developments after City Hall noted that construction activity had deviated from the area’s original low- to medium-rise residential zoning;
During the week, the Government of Kenya stepped up preparations for the construction of two expressways linking Kenya to Uganda, aimed at easing congestion and improving trade efficiency along the Northern Corridor feasibility studies to expand the 243-kilometre Mau Summit-Eldoret-Malaba highway from a two-lane road to a four-lane dual carriageway under a Public-Private Partnership (PPP) model, with the study funded by the Asia Infrastructure Investment Bank (AIIB). In addition, the government plans to develop a 190-kilometre Kisian-Busia expressway, implemented by the Kenya National Highways Authority (KeNHA) under a PPP structure and supported by the African Development Bank (AfDB);
During the week, the National Social Security Fund (NSSF) announced plans to develop a Ksh30.0 bn mixed-use real estate project in Nairobi’s Central Business District (CBD), comprising office blocks and luxury apartments, as part of efforts to promote a work-and-stay city centre The proposed development, to be undertaken on NSSF’s 3.85-acre parcel along Kenyatta Avenue, will consist of twin towers of 35 and 60 floors, and will also incorporate conference facilities, retail space, and a hotel, with the 60-storey tower expected to be the tallest building in Nairobi;
On the Unquoted Securities Platform, Acorn D-REIT and I-REIT traded at Kshs 27.4 and Kshs 23.2 per unit, respectively, as per the last updated data on 30th January 2026. Additionally, ILAM Fahari I-REIT traded at Kshs 11.0 per share as of 30th January 2026 representing a 45.0% loss from the Kshs 20.0 inception price;
Focus of the Week
Real Estate Investment Trusts are crucial to the development given the limited funding available to the developers. Real Estate Investment Trusts (REITs) represent an innovative financing avenue for real estate development in Kenya. REITs provide a structured mechanism for pooling resources from multiple investors to finance or acquire income-generating real estate assets. The Capital Markets Authority (CMA) regulates REITs in Kenya, ensuring transparency and investor protection. Despite being relatively new in the Kenyan financial market, REITs have shown potential as a transformative tool for real estate financing.
Investment Updates:
- Weekly Rates: Cytonn Money Market Fund closed the week at a yield of 11.8 % p.a. To invest, dial *809# or download the Cytonn App from Google Play store here or from the Appstore here;
- We continue to offer Wealth Management Training every Tuesday, from 7:00 pm to 8:00 pm. The training aims to grow financial literacy among the general public. To register for any of our Wealth Management Trainings, click here;
- If interested in our Private Wealth Management Training for your employees or investment group, please get in touch with us through wmt@cytonn.com;
- Cytonn Insurance Agency acts as an intermediary for those looking to secure their assets and loved ones’ future through insurance namely; Motor, Medical, Life, Property, WIBA, Credit and Fire and Burglary insurance covers. For assistance, get in touch with us through insuranceagency@cytonn.com;
- Cytonn Asset Managers Limited (CAML) continues to offer pension products to meet the needs of both individual clients who want to save for their retirement during their working years and Institutional clients that want to contribute on behalf of their employees to help them build their retirement pot. To more about our pension schemes, kindly get in touch with us through pensions@cytonn.com;
Hospitality Updates:
- We currently have promotions for Staycations. Visit cysuites.com/offers for details or email us at sales@cysuites.com;
Money Markets, T-Bills Primary Auction:
This week, T-bills were oversubscribed for the second consecutive week, with the overall subscription rate coming in at 267.8%, higher than the subscription rate of 196.7% recorded the previous week. Investors’ preference for the shorter 91-day paper waned, with the paper receiving bids worth Kshs 13.0 bn against the offered Kshs 4.0 bn, translating to a subscription rate of 323.9%, however, higher than the subscription rate of 158.8%, recorded the previous week. The subscription rate for the 182-day paper decreased to 5.0% from the 22.8% recorded the previous week, while that of the 364-day papers increased significantly to 508.3% from 385.8% recorded the previous week. The government accepted a total of Kshs 50.0 bn worth of bids out of Kshs 64.3 bn bids received, translating to an acceptance rate of 77.8%.The yields on the government papers were on a downward trajectory, with the yield on the 182-day paper decreasing the most by 1.2 bps to remain relatively unchanged at the 7.8% compared to the previous week, while the yields on the 364-day and 91-day papers decreased by 0.7 bps and 0.3 bps to remain relatively unchanged at the 9.2% and 7.6% respectively compared to the previous week.
The chart below shows the yield growth rate for the 91-day paper from January 2025 to date:
The charts below show the performance of the 91-day, 182-day and 364-day papers from January 2024 to February 2026:
The chart below compares the overall average T-bill subscription rates obtained in 2023, 2024, 2025 and 2026 Year-to-date (YTD):
Money Market Performance:
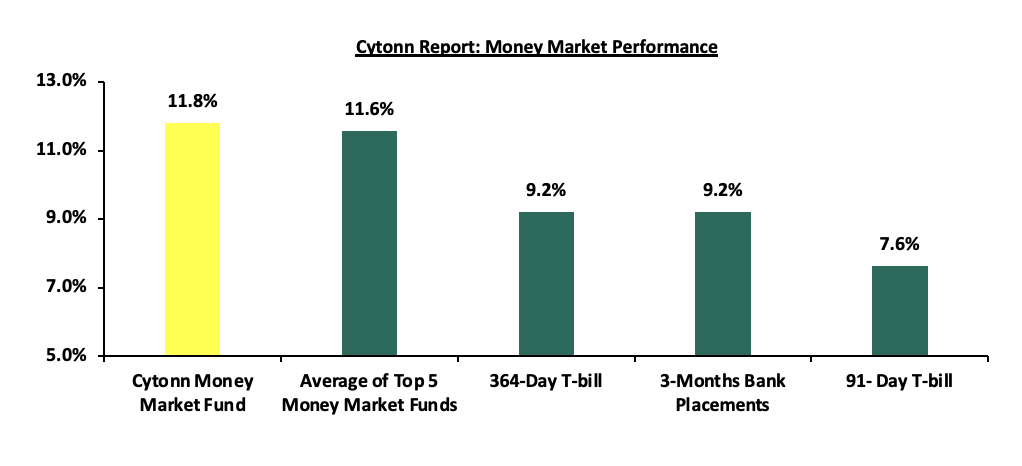
In the money markets, 3-month bank placements ended the week at 9.2% (based on what we have been offered by various banks) and yields on the government papers recorded a downward trajectory with the yields on the 364-day and 91-day papers decreasing by 0.7 bps and 0.3 bps to remain relatively unchanged from the 9.2% and 7.6% recorded the previous week. The yield on the Cytonn Money Market Fund decreased by 5.0 bps to 11.8% from the 11.9% recorded in the previous week, while the average yields on the Top 5 Money Market Funds increased marginally by 1.2 bps to remain relatively unchanged at 11.6% in comparison to the previous week.
The table below shows the Money Market Fund Yields for Kenyan Fund Managers as published on 6th February 2026:
|
Money Market Fund Yield for Fund Managers as published on 6th February 2026 |
||
|
Rank |
Fund Manager |
Effective Annual Rate |
|
1 |
Arvocap Money Market Fund |
12.1% |
|
2 |
Cytonn Money Market Fund (Dial *809# or download Cytonn App) |
11.8% |
|
3 |
Nabo Africa Money Market Fund |
11.8% |
|
4 |
Ndovu Money Market Fund |
11.1% |
|
5 |
Enwealth Money Market Fund |
11.0% |
|
6 |
Lofty-Corban Money Market Fund |
11.0% |
|
7 |
Etica Money Market Fund |
10.9% |
|
8 |
Gulfcap Money Market Fund |
10.8% |
|
9 |
Kuza Money Market fund |
10.3% |
|
10 |
Old Mutual Money Market Fund |
10.1% |
|
11 |
Jubilee Money Market Fund |
10.1% |
|
12 |
Orient Kasha Money Market Fund |
10.1% |
|
13 |
British-American Money Market Fund |
9.9% |
|
14 |
Madison Money Market Fund |
9.9% |
|
15 |
GenAfrica Money Market Fund |
9.7% |
|
16 |
Dry Associates Money Market Fund |
9.6% |
|
17 |
SanlamAllianz Money Market Fund |
9.5% |
|
18 |
Apollo Money Market Fund |
9.5% |
|
19 |
KCB Money Market Fund |
9.3% |
|
20 |
Faulu Money Market Fund |
9.1% |
|
21 |
Genghis Money Market Fund |
9.0% |
|
22 |
CIC Money Market Fund |
8.5% |
|
23 |
ICEA Lion Money Market Fund |
8.3% |
|
24 |
CPF Money Market Fund |
8.2% |
|
25 |
Co-op Money Market Fund |
8.2% |
|
26 |
Mali Money Market Fund |
8.2% |
|
27 |
Absa Shilling Money Market Fund |
7.5% |
|
28 |
Mayfair Money Market Fund |
7.0% |
|
29 |
Ziidi Money Market Fund |
6.2% |
|
30 |
AA Kenya Shillings Fund |
6.1% |
|
31 |
Stanbic Money Market Fund |
5.6% |
|
32 |
Equity Money Market Fund |
4.9% |
Source: Business Daily
Liquidity:
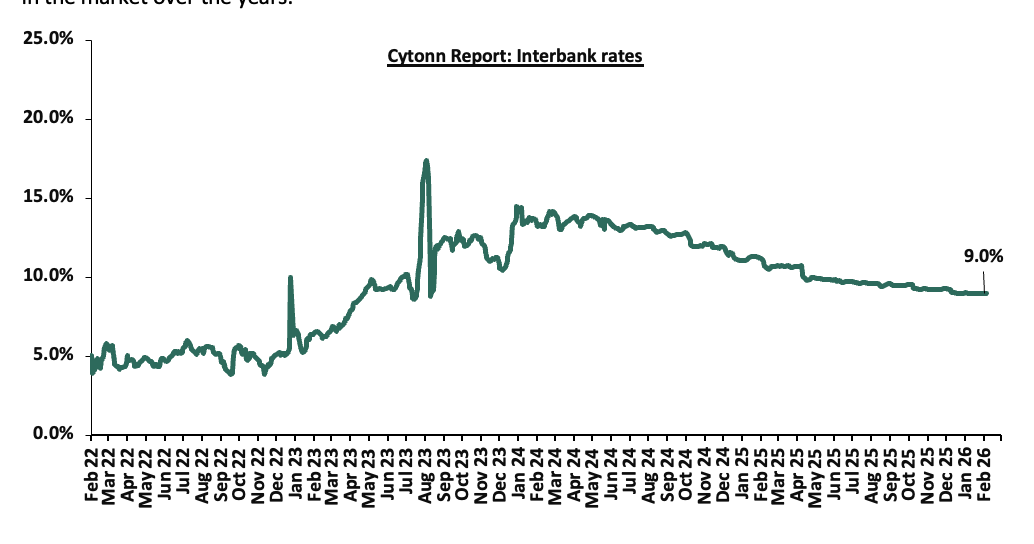
During the week, liquidity in the money markets tightened with the average interbank rate increasing by 0.4 bps to remain relatively unchanged at 9.0% compared to last week, partly attributable to tax remittances that offset government payments. The average interbank volumes traded decreased by 46.5% to Kshs 6.7 bn from Kshs 11.8 bn recorded the previous week. The chart below shows the interbank rates in the market over the years:
Kenya Eurobonds:
During the week, the yields on the Eurobonds recorded a mixed performance with the yield on the 10-year Eurobond issued in 2018 increasing by 12.0 bps to 6.1% from 6.0%, recorded the previous week, while the 12-year Eurobond issued in 2019 and 7-year Eurobond issued in 2024 decreased the most, both decreasing by 11.0 bps to 7.0% and 6.7% respectively from 7.1% and 6.8% recorded the previous week. The table below shows the summary performance of the Kenyan Eurobonds as of 5th February 2026;
|
|
2018 |
2019 |
2021 |
2024 |
2025 |
|||||
|
Tenor |
10-year issue |
30-year issue |
12-year issue |
13-year issue |
7-year issue |
11-year issue |
||||
|
Amount Issued (USD) |
1.0 bn |
1.0 bn |
1.2 bn |
1.0 bn |
1.5 bn |
1.5 bn |
||||
|
Years to Maturity |
2.5 |
22.5 |
6.7 |
8.8 |
5.5 |
10.5 |
||||
|
Yields at Issue |
7.3% |
8.3% |
7.9% |
6.2% |
10.4% |
9.9% |
||||
|
02-Jan-26 |
6.1% |
8.8% |
7.2% |
7.8% |
7.1% |
|
||||
|
29-Jan-26 |
6.0% |
8.7% |
7.1% |
7.8% |
6.8% |
|
||||
|
30-Jan-26 |
6.1% |
8.7% |
7.1% |
7.7% |
6.8% |
|
||||
|
02-Feb-26 |
6.1% |
8.6% |
7.0% |
7.7% |
6.8% |
|
||||
|
03-Feb-26 |
6.1% |
8.6% |
7.0% |
7.7% |
6.7% |
|
||||
|
04-Feb-26 |
6.1% |
8.6% |
6.9% |
7.7% |
6.7% |
10.0% |
||||
|
05-Feb-26 |
6.1% |
8.7% |
7.0% |
7.8% |
6.7% |
|
||||
|
Weekly Change |
0.1% |
(0.1%) |
(0.1%) |
0.0% |
(0.1%) |
0.0% |
||||
|
MTD Change |
0.1% |
0.0% |
0.0% |
0.1% |
(0.1%) |
0.0% |
||||
|
YTD Change |
0.1% |
(0.2%) |
(0.2%) |
(0.1%) |
(0.4%) |
0.0% |
||||
Source: Central Bank of Kenya (CBK) and National Treasury
Kenya Shilling:
During the week, the Kenya Shilling appreciated against the US Dollar by 0.8 bps, but remained relatively unchanged at Kshs 129.0 compared to last week. On a year-to-date basis, the shilling has appreciated by 2.3 bps against the dollar, lower than the 22.9 bps appreciation recorded in 2025.
We expect the shilling to be supported by:
- Diaspora remittances standing at a cumulative USD 5,036.7 mn in the 12 months to December 2025, 1.9% higher than the USD 4,945.2 mn recorded over the same period in 2024. In the December 2025 diaspora remittances figures, North America remained the largest source of remittances to Kenya accounting for 53.3% in the period, and,
- Tourism inflows, which strengthened significantly. Tourism receipts reached Kshs 560.0 bn in 2025, up from Kshs 452.2 bn in 2024, representing a 23.9% increase, supported by improved international arrivals through the country’s major airports, and,
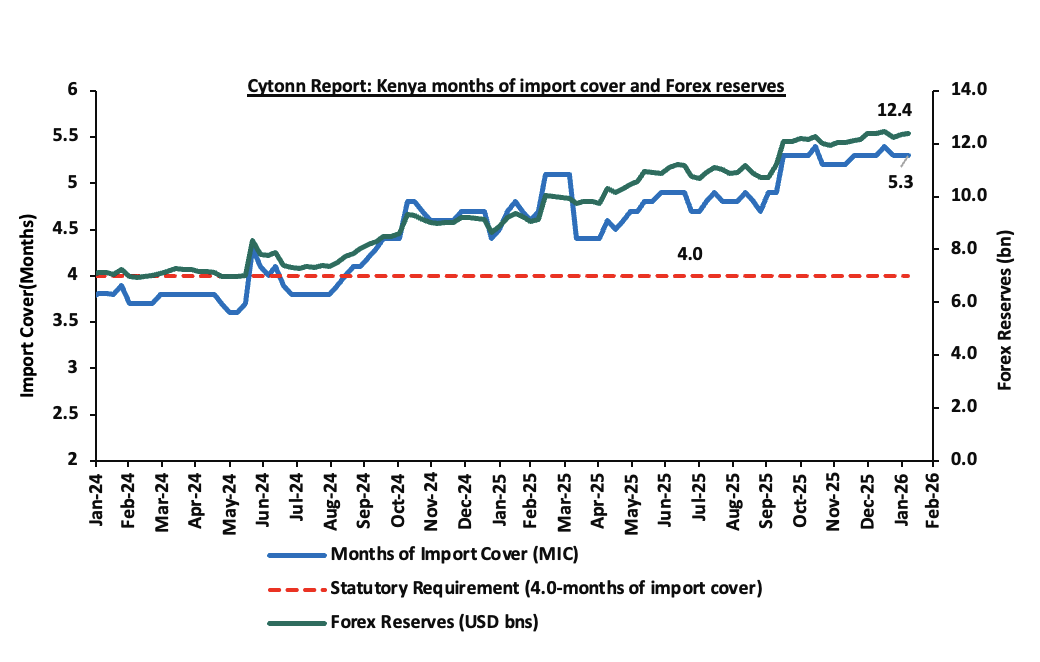
- Improved forex reserves currently at USD 12.4 bn (equivalent to 5.3-months of import cover), which is above the statutory requirement of maintaining at least 4.0-months of import cover and above the EAC region’s convergence criteria of 4.5-months of import cover.
The shilling is however expected to remain under pressure in 2026 as a result of:
- An ever-present current account deficit which came at 2.2% of GDP in the twelve months to October 2025, and,
- Elevated government debt servicing obligations, which continue to exert pressure on foreign exchange reserves, given that 59.7% of Kenya’s external debt is US Dollar-denominated as of June 2025, sustaining demand for hard currency in 2026.
Kenya’s forex reserves increased by 0.4% during the week to USD 12.4 bn from the USD 12.3 bn recorded the previous week, equivalent to 5.3 months of import cover, and above the statutory requirement of maintaining at least 4.0-months of import cover.
The chart below summarizes the evolution of Kenya's months of import cover over the years:
Weekly Highlights
- Stanbic Bank’s January 2026 Purchasing Manager’s Index (PMI)
During the week, Stanbic Bank released its monthly Purchasing Manager’s Index (PMI), Kenya’s Purchasing Managers’ Index (PMI) stood at 51.9 in January 2026, remaining above the 50.0 expansion threshold for the fifth consecutive month, although lower than 53.7 in December and the 55.0 peak recorded in November, indicating that business activity continues to expand but at a slowing pace. Growth was supported by strong output, new orders, tourism activity, and sustained employment creation, with manufacturing demand remaining resilient even as construction, wholesale, and retail sectors softened. At the same time, input and output prices continued to rise, largely driven by taxation and higher purchase costs, highlighting emerging cost pressures. Overall, the data points to moderate but easing economic expansion heading into 2026.
The chart shows Kenya's Purchasing Manager's Index for the Last 24 Months
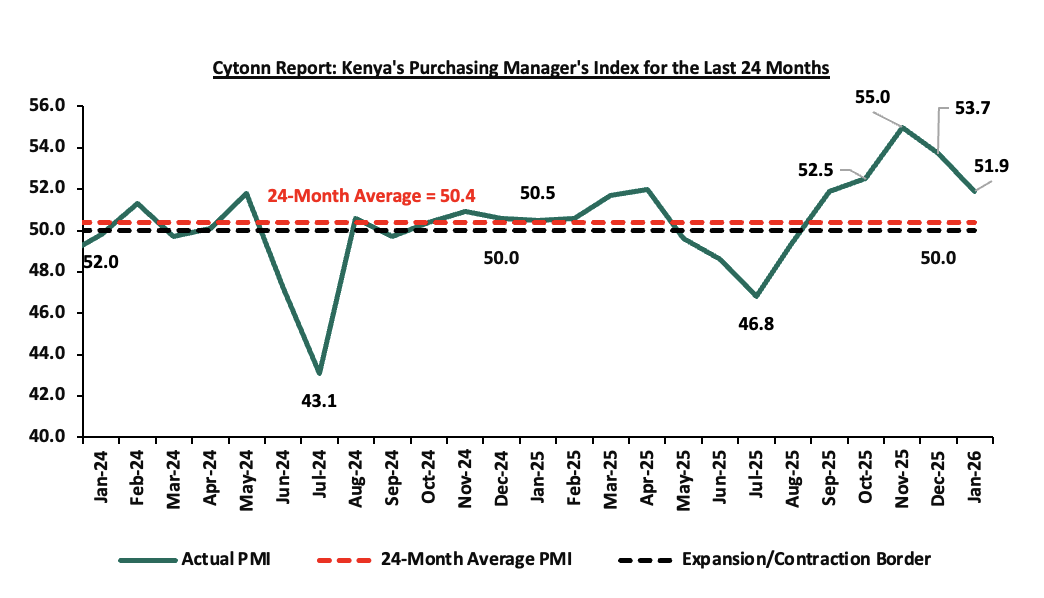
Going forward, the business environment is expected to remain supportive in the short to medium term, underpinned by strengthening demand, improved supply chain performance, and a more accommodative monetary policy stance following the Central Bank of Kenya’s rate cut to 9.0% in December 2025 and the prospect of further easing. However, rising input costs driven by higher taxation and weak consumer purchasing power are likely to constrain profitability and temper growth. Overall, the private sector recovery is expected to continue, though with emerging headwinds in the months ahead.
Rates in the Fixed Income market have been on a downward trend due to high liquidity in the money market which allowed the government to front load most of its borrowing. The government is 95.8% ahead of its prorated net domestic borrowing target of Kshs 388.9bn, having a net borrowing position of Kshs 761.2bn (inclusive of T-bills). However, we expect a stabilization of the yield curve in the short and medium term, with the government looking to increase its external borrowing to maintain the fiscal surplus, hence alleviating pressure in the domestic market. As such, we expect the yield curve to stabilize in the short to medium-term and hence investors are expected to shift towards the long-term papers to lock in the high returns
Market Performance:
The equities market was on an upward trajectory, with NASI, NSE 10, NSE 25, and NSE 20 gaining by 3.8%, 2.3%, 2.2%, and 1.5% respectively, taking the YTD performance to gains of 8.2%, 6.6%, 6.3% and 6.0% for NASI, NSE 20, NSE 25 and NSE 10 respectively. The equities market performance was mainly driven by gains recorded by large cap stocks such as Safaricom, BAT, and DTB-K of 8.1%, 5.6% and 5.0% respectively. However, the performance was weighed down by losses recorded by large cap stocks such as EABL and NCBA of 3.3%, and 0.3% respectively.
Also, during the week, the banking sector index gained by 1.6% to 218.5 from 215.0 recorded the previous week. This is attributable to gains recorded by stocks such as DTB-K, Cooperative Bank, and Stanbic, of 5.0%, 4.2% and 3.8% respectively. However, the performance was weighed down by losses recorded by stocks such as NCBA of 0.3%.
Additionally, in the regional equities market, the East African Exchanges 20 (EAE 20) share index gained by 0.6%, attributable to gains recorded by large cap stocks such as CRDB Bank, NMB Bank and MTN Uganda of 17.8%, 9.0% and 8,7% respectively. The performance was, however, weighed down by losses recorded by large cap stocks such as Tanga Cement and Cimerwa Plc of 8.5%, and 0.1% respectively.
During the week, equities turnover increased by 18.8% to USD 36.7 mn from USD 30.9 mn recorded the previous week, taking the YTD total turnover to USD 141.3 mn. Foreign investors became net sellers for the first time in two weeks with a net selling position of USD 8.2 mn, from a net buying position of USD 4.0 mn recorded the previous week, taking the YTD foreign net selling position to USD 16.6 mn, compared to a net selling position of USD 92.9 mn recorded in 2025.
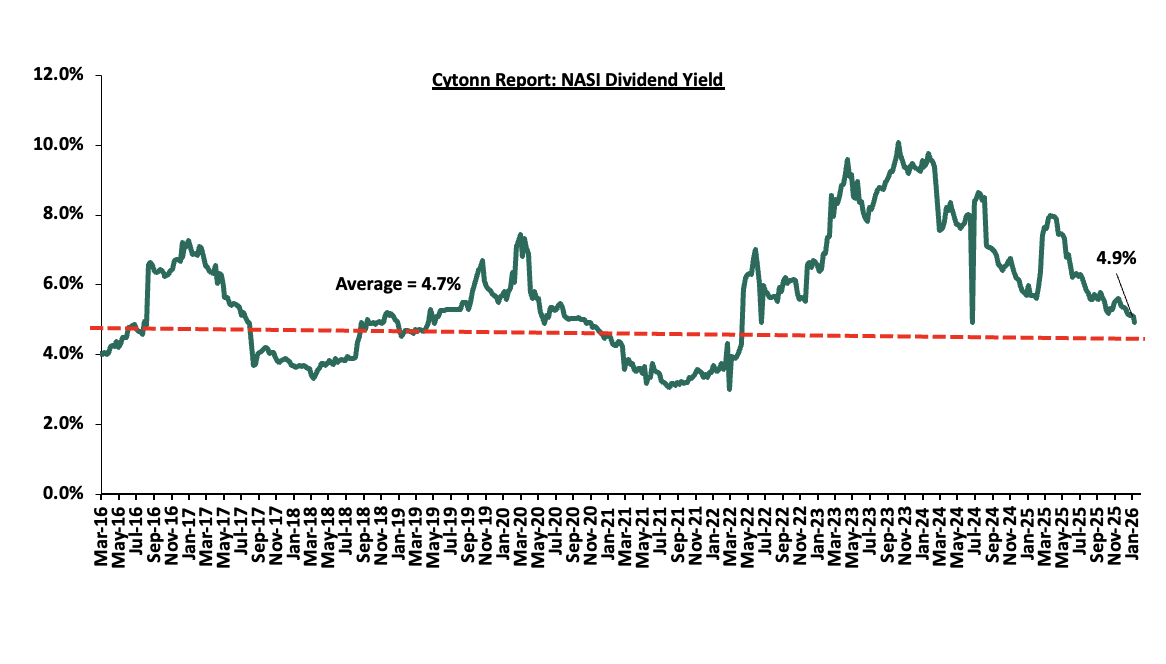
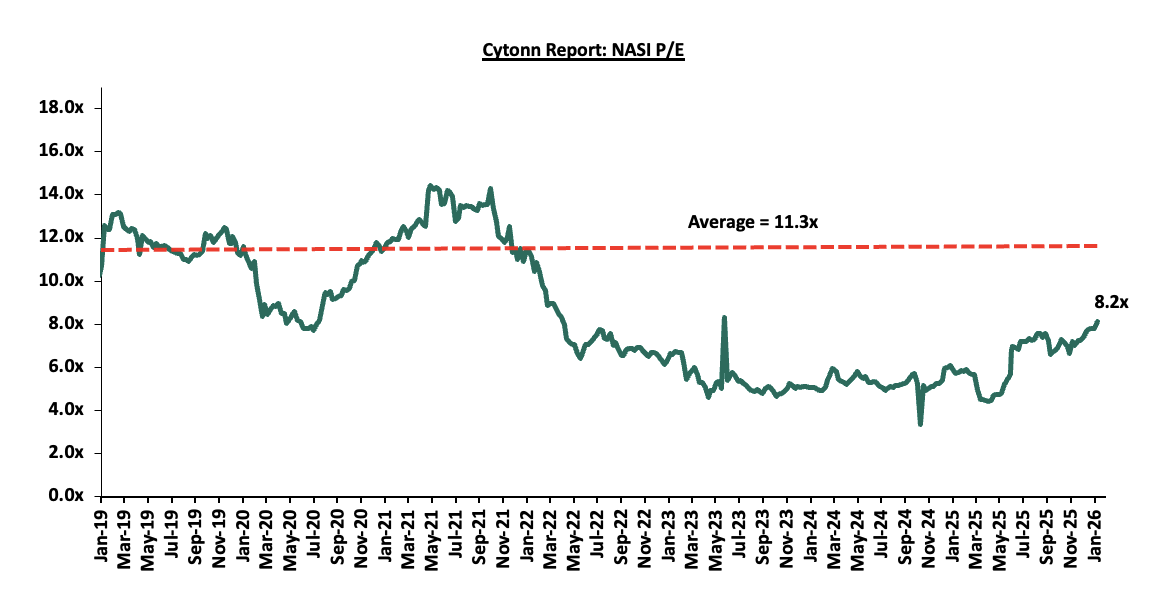
The market is currently trading at a price to earnings ratio (P/E) of 8.2x, 27.9% below the historical average of 11.3x. The dividend yield stands at 4.9%, 0.2% points above the historical average of 4.7%. Key to note, NASI’s PEG ratio currently stands at 1.0x, an indication that the market is fairly valued relative to its future growth. A PEG ratio greater than 1.0x indicates the market may be overvalued while a PEG ratio less than 1.0x indicates that the market is undervalued.
The charts below indicate the historical P/E and dividend yields of the market.
Universe of Coverage:
|
Cytonn Report: Equities Universe of Coverage |
|||||||||||
|
Company |
Price as at 30/01/2026 |
Price as at 06/02/2026 |
w/w change |
YTD Change |
Year Open 2026 |
Target Price* |
Dividend Yield |
Upside/ Downside** |
P/TBv Multiple |
Recommendation |
|
|
Standard Chartered Bank |
310.0 |
314.8 |
1.5% |
5.0% |
299.8 |
354.6 |
14.3% |
27.0% |
1.8x |
Buy |
|
|
I&M Group |
45.0 |
45.0 |
0.0% |
5.1% |
42.8 |
53.1 |
6.7% |
24.7% |
0.8x |
Buy |
|
|
Equity Group |
67.0 |
68.0 |
1.5% |
1.5% |
23.9 |
75.2 |
6.3% |
16.8% |
1.2x |
Accumulate |
|
|
Co-op Bank |
27.2 |
28.4 |
4.2% |
18.6% |
85.0 |
31.5 |
5.3% |
16.4% |
1.2x |
Accumulate |
|
|
NCBA |
92.5 |
92.3 |
(0.3%) |
8.5% |
322.5 |
101.3 |
6.0% |
15.8% |
1.5x |
Accumulate |
|
|
Jubilee Holdings |
325.0 |
329.8 |
1.5% |
2.2% |
197.8 |
354.3 |
4.1% |
11.5% |
0.5x |
Accumulate |
|
|
Stanbic Holdings |
198.0 |
205.5 |
3.8% |
3.9% |
65.8 |
205.5 |
10.1% |
10.1% |
1.2x |
Accumulate |
|
|
KCB Group |
66.5 |
67.3 |
1.1% |
2.3% |
4.5 |
71.0 |
4.5% |
10.0% |
0.8x |
Accumulate |
|
|
CIC Group |
4.5 |
4.6 |
1.5% |
1.1% |
24.9 |
4.8 |
2.8% |
7.8% |
1.2x |
Hold |
|
|
ABSA Bank |
28.0 |
28.2 |
0.9% |
13.5% |
9.1 |
28.3 |
6.2% |
6.6% |
1.8x |
Hold |
|
|
Britam |
9.7 |
10.1 |
4.1% |
11.5% |
114.8 |
10.5 |
0.0% |
4.0% |
0.9x |
Lighten |
|
|
DTB-K |
129.0 |
135.5 |
5.0% |
18.1% |
85.0 |
129.4 |
5.2% |
0.7% |
0.5x |
Lighten |
|
|
*Target Price as per Cytonn Analyst estimates **Upside/ (Downside) is adjusted for Dividend Yield ***Dividend Yield is calculated using FY’2024 Dividends |
|
||||||||||
Weekly Highlights
- KPLC’s Release of H1’2026 Financial results
During the week, Kenya Power & Lighting Company Plc (KPLC) released its H1’2026 financial results, recording an 4.3% increase in profitability to Kshs 10.4 bn, up from Kshs 10.0 bn in H1’2025. The performance was mainly attributable to a 5.9% increase in gross profit to Kshs 38.2 bn, from Kshs 36.0 bn in H1’2025 coupled with a 25.0% decrease in finance costs to Kshs 1.5 bn from the Kshs 2.0 bn in H1’ 2025. The performance was however weighed down by the 7.5% increase in cost of sales to Kshs 76.7 bn from Kshs 71.4 bn recorded in H1’2025. On the balance sheet side, total assets increased by 2.1% to 397.0 bn in H1’2026 from Kshs 388.9 bn in H1’2025 while total liabilities decreased by 0.3% to Kshs 278.8 bn in H1’2026 from 279.5 bn in H1’2025. The tables below summarize the company’s financial performance:
|
Cytonn Report: Kenya Power and Lighting Company (KPLC) Summarized Income Statement |
|||
|
Income Statement |
H1'2025 |
H1'2026 |
Y/Y Change |
|
Kshs (bn) |
Kshs (bn) |
||
|
Revenue from contracts with customers |
107.4 |
114.9 |
6.9% |
|
Cost of Sales |
(71.4) |
(76.7) |
7.5% |
|
Gross Profit |
36.0 |
38.2 |
5.9% |
|
Other Income |
3.4 |
3.0 |
(10.4%) |
|
Operating Costs |
(23.7) |
(25.2) |
6.0% |
|
Operating Profit |
15.7 |
16.0 |
2.2% |
|
Interest income |
0.4 |
0.3 |
(18.0%) |
|
Finance Costs |
(2.0) |
(1.5) |
(25.0%) |
|
Profit Before Income Tax |
14.1 |
14.8 |
5.5% |
|
Income Tax Expenses |
(4.1) |
(4.4) |
8.2% |
|
Profit After Tax |
10.0 |
10.4 |
4.3% |
|
Earnings Per Share (Kshs) |
5.1 |
5.3 |
4.3% |
|
Dividend Per share (Kshs) |
0.2 |
0.3 |
50.0% |
|
Annualized Dividend Yield |
18.1% |
7.2% |
(60.0%) |
|
Dividend Payout Ratio |
3.9% |
5.6% |
43.8% |
Source: Kenya Power and Lighting Company (KPLC) H1’2026 financial statements
|
Cytonn Report: Kenya Power and Lighting Company (KPLC) Summarized Balance sheet |
|||
|
Balance Sheet |
H1'2025 |
H1'2026 |
Y/Y Change |
|
Kshs (bn) |
Kshs (bn) |
||
|
Property and equipment |
287.5 |
288.6 |
0.4% |
|
Current Assets |
98.1 |
105.3 |
7.3% |
|
Other Non-Current Assets |
3.3 |
3.2 |
(5.1%) |
|
Total Assets |
388.9 |
397.0 |
2.1% |
|
Current Liabilities |
117.3 |
117.8 |
0.5% |
|
Other Non-Current Liabilities |
162.3 |
161.0 |
(0.8%) |
|
Total Liabilities |
279.5 |
278.8 |
(0.3%) |
|
Total Equity |
109.3 |
118.2 |
8.1% |
|
Total Equity and liabilities |
388.9 |
397.0 |
2.1% |
Source: Kenya Power and Lighting Company (KPLC) H1’2026 financial statements
Key take outs from the financial performance include;
- Total revenue rose by 6.9% to Kshs 114.9 bn in H1’2026, from Kshs 107.4 bn in H1’2025, mainly attributable to higher electricity sales, increased demand and improved distribution efficiency.
- Operating expenses rose by 6.0% to Kshs 25.2 bn, from Kshs 23.7 bn in H1’2025, mainly attributed to higher provisions for expected credit losses following growth in customer debt levels, increased depreciation arising from the capitalization of completed network projects, and staff-related cost movements.
- Net finance costs decreased by 25.0% to Kshs 1.5 bn in H1’2026, from Kshs 2.0 bn in H1’2025, mainly driven by lower interest expenses following scheduled loan repayments and reduced debt levels. Interest income decreased by 18.0% to Kshs 0.3 bn from Kshs 0.4 bn in H1’2025.
- Profit after tax (PAT) grew by 4.3% to Kshs 10.4 bn from Kshs 10.0 bn in H1’2025 while earnings per share grew by 4.3% to Kshs 5.3 from Kshs 5.1 in H1’2025, attributable to higher revenue from electricity sales, a stable currency reducing finance costs, and improved operational efficiency.
- The company’s balance sheet recorded an expansion as total assets grew by 2.1% to 397.0 bn from 388.9 bn in H1’2026, mainly attributable to a 7.3% increase in current assets to Kshs 105.3 bn from Ksh 98.1 bn in H1’2025, coupled with a 0.4% increase in property and equipment to Kshs 288.6 bn in H1’2026 from Kshs 287.5 bn in H1’2025
- The company’s total liabilities recorded a decrease of 0.3% to Kshs 278.8 bn from 279.5bn in H1’2025.This was mainly driven by the 0.8% decrease in non-current liabilities to Kshs 161.0 bn from Kshs 162.3 bn in H1’2025, but was supported by a 0.5% increase in current liabilities to Kshs 117.8 bn from Kshs 117.3 bn in H1’2025.
The Board of Directors recommended an interim dividend of Kshs 0.3 per share for the year ended 31st December 2025, translating to a dividend payout ratio of 5.6% and an annualized dividend yield of 7.2%. KPLC has maintained a resilient financial performance, through a stronger balance sheet. The continued growth in electricity sales, supported by rising demand, improving distribution efficiency, combined with lower finance cost, lay out a solid foundation for improved profitability, enhanced service delivery, and financial sustainability into the future. Going forward, Kenya Power aims to safeguard supply adequacy as demand grows and accelerate their loss reduction programme. They are also advancing their grid modernization and digitization projects to improve service reliability and efficiency, enhance customer experience, and support sustainable growth.
We are “Bullish” on the Equities markets in the short term due to current attractive valuations, lower yields on short-term government papers and expected global and local economic recovery, and, “Neutral” in the long term due to persistent foreign investor outflows. With the market currently trading at par to its future growth (PEG Ratio at 1.0x), we believe that investors should reposition towards value stocks with strong earnings growth and that are trading at discounts to their intrinsic value. We expect the current high foreign investors sell-offs to continue weighing down the economic outlook in the short term.
- Industry Reports
- Kenya Market Update H2’2025 Report by Knight Frank
During the week, Knight Frank, an international Real Estate consultancy and management firm, released the Kenya Market Update H2’2025 Report highlighting the performance of key Real Estate sectors in the country. The following were the key take outs from the report:
- In the residential sector, the average selling prices for prime housing units increased by 6.2% points in H2’2025, the performance was lower than the 8.3% surge recorded in H2’2024. The slower pace of price appreciation reflected persistently high mortgage interest rates averaging at 14.9% and tighter credit conditions, which weighed on affordability and tempered transaction volumes, even as demand for high-quality properties in select prime locations remained relatively resilient amid ongoing project completions. Additionally, during the period under review, the average monthly rents increased by 4.1%. The performance can be attributed to the periodic rental reviews, appreciation of the Kenyan currency and the increase in demand for housing. There is a growing consumer awareness among buyers, leading them to demand value for their money, which is compelling developers to present high-quality properties in the market to meet consumer needs and expectations,
- The average monthly asking rents for prime commercial office spaces remained relatively unchanged at USD 1.2 per SQFT in H2’2025 from H2’2024. Commercial office space occupancy slightly increased by 5.0% to 81.6% in H1’2025 from 77.7% recorded in H1’2024. The performance was attributable to a limited supply of grade A offices, and, increased uptake of existing A-grade properties. Additionally, the growth of grade A office continued driven by growing demand from international investors, governments, diplomatic missions, and multinational corporations attracted by Kenya’s appeal as a top investment destination in Africa. Furthermore, many organizations showing preference for physical offices to the working-from-home model. This has facilitated continued expansion of the flexible workspaces market in Nairobi,
- The retail sector, continues to grow, driven by the physical expansion of major retail chains, which acted as the primary engine for the real estate sector. During the period under review, Naivas; solidified its position as Kenya’s largest supermarket chain by store count. It opened several new outlets, including stores at Westbay Mall in Gachie (its 110th), OUR Mall on Magadi Road (111th), Mihango area on Kigwathi Road (112th), and culminated the year with its 113th store in Athi River in December. Similarly, Carrefour Kenya, operated by Majid Al Futtaim, continued its growth trajectory, reaching 34 stores nationwide by December 2025.
- The industrial sector continues to grow, driven by a combination of policy momentum, sector specific investment, and logistics expansion. During the period under review, the government operationalized the long-delayed projects such as the Kshs 5.0 bn Kenanie Leather Industrial Park in Machakos signalling improved execution of industrial policy. Kenya’s regional logistics role was further reinforced by strategic partnerships such as the Yusen Logistics and Africa Global Logistics joint venture, while the rollout of the County Aggregation Industrial Parks programme, backed by a Kshs 4.5 billion allocation in the national budget for financial year ending June 2026, added to the sector’s positive momentum,
The findings of this report are in line with our Annual Markets Review 2025 Report which highlighted a rise in occupancy rates within the commercial office sector and an increased demand for industrial space in the region. We maintain our view that the Real Estate sector's performance will mainly be driven by several factors: i) growing foreign investment in the retail segment, ii) strong housing demand driven by favourable demographics, iii) government investments in infrastructure development, iv) the Affordable Housing Program (AHP) initiatives, v) Special Built Developments, vi) aggressive expansion by local and international retailers, and, vii) positive demographics. However, the sector's growth may face challenges such as: i) an oversupply of space in some Real Estate classes, ii) constrained financing to developers, and, iii) subdued REITs Market.
- Statutory Review
- City Hall plans to redesign Westlands as amenities choke under Real Estate boom
During the week, the Nairobi City County Government announced plans to redesign and replan Westlands following a surge in high-rise developments that has strained infrastructure and social amenities in the area. The county has advertised a tender for the preparation of a Local Physical and Land Use Development Plan for the Westlands zone, which will guide and regulate future developments after City Hall noted that construction activity had deviated from the area’s original low- to medium-rise residential zoning.
Westlands, alongside Upper Hill, has in recent years attracted significant commercial and mixed-use developments, intensifying pressure on infrastructure systems such as water supply, sewerage, drainage, transport networks, and social amenities, while also raising concerns around environmental sustainability and preservation of neighbourhood character in areas such as Parklands, Loresho, Kyuna, and Spring Valley. The move follows the repeal of the Physical Planning Act, which rendered the 2004 zoning guidelines obsolete, and comes amid rising legal challenges from residents over uncontrolled developments. It is expected that the new planning framework to influence the pace and nature of real estate development in Westlands, with stricter controls likely to shape future residential and commercial supply.
We expect the proposed planning framework to slow high-density developments in the near term as zoning and infrastructure-capacity requirements are tightened, potentially constraining new residential and office supply in Westlands while supporting the long-term sustainability, rental performance, and capital values of compliant developments.
- Infrastructure
- Kenya Steps Up Plans for Two Expressways Linking Uganda
During the week, the Government of Kenya stepped up preparations for the construction of two expressways linking Kenya to Uganda, aimed at easing congestion and improving trade efficiency along the Northern Corridor. A consortium comprising CPCS of Canada and Avatech Engineering of Kenya commenced pre-feasibility studies to expand the 243-kilometre Mau Summit-Eldoret-Malaba highway from a two-lane road to a four-lane dual carriageway under a Public-Private Partnership (PPP) model, with the study funded by the Asia Infrastructure Investment Bank (AIIB). The project will complement the Kshs 170.0 bn Rironi-Mau Summit dual carriageway, strengthening road connectivity to Uganda and the wider Great Lakes region.
In addition, the government plans to develop a 190-kilometre Kisian-Busia expressway, implemented by the Kenya National Highways Authority (KeNHA) under a PPP structure and supported by the African Development Bank (AfDB). The East African Community (EAC) approved the viability of the Kisian-Malaba expressway in October, with Uganda expected to construct a 60-kilometre Jinja-Busesa expressway to connect to the Kenyan road network. The Mau Summit-Eldoret-Malaba corridor, which is part of the Northern Corridor, currently experiences heavy traffic volumes and a high incidence of accidents, underscoring the need for capacity expansion
We expect the development of the Mau Summit–Eldoret–Malaba and Kisian–Busia expressways to enhance accessibility and reduce transit times along the Northern Corridor, supporting increased demand for logistics, warehousing, industrial parks, and roadside commercial developments in towns along the corridor, while strengthening land values in strategically located nodes due to improved connectivity and trade efficiency.
- Mixed-Used Developments (MUDS)
- NSSF plans city centre apartments in Sh30bn project
During the week, the National Social Security Fund (NSSF) announced plans to develop a Ksh30.0 bn mixed-use real estate project in Nairobi’s Central Business District (CBD), comprising office blocks and luxury apartments, as part of efforts to promote a work-and-stay city centre. The proposed development, to be undertaken on NSSF’s 3.85-acre parcel along Kenyatta Avenue, will consist of twin towers of 35 and 60 floors, and will also incorporate conference facilities, retail space, and a hotel, with the 60-storey tower expected to be the tallest building in Nairobi.
According to NSSF, the inclusion of residential units is aimed at regenerating the CBD, which has witnessed an exodus of corporates to alternative commercial nodes, while aligning with global trends towards mixed-use, city-centre living. The fund expects to fully finance the project over the next four years, leveraging its growing contribution inflows, which are projected at Ksh100.0 bn this year. As at June 2025, NSSF held Ksh35.45 bn in immovable property, accounting for 6.4% of its total investment assets. I
We expect the proposed mixed-use development to support the revitalisation of the Nairobi CBD by increasing residential presence, encouraging longer activity hours, and strengthening demand for retail, hospitality, and office space within the city centre, while potentially setting a benchmark for large-scale, institution-led mixed-use developments in the CBD.
- REITs
- REITs Weekly Performance
On the Unquoted Securities Platform, Acorn D-REIT and I-REIT traded at Kshs 27.4 and Kshs 23.2 per unit, respectively, as per the last updated data on 30th January 2026. The performance represented a 33.4% and 14.5% gain for the D-REIT and I-REIT, respectively, from the Kshs 20.0 inception price. The volumes traded for the D-REIT and I-REIT came in at 13.4 mn and 42.0 mn shares respectively. Additionally, ILAM Fahari I-REIT traded at Kshs 11.0 per share as of 30th January 2026, representing a 45.0% loss from the Kshs 20.0 inception price. The volume traded to date came in at 1.2 mn shares for the I-REIT. REITs offer various benefits, such as tax exemptions, diversified portfolios, and stable long-term profits. However, the ongoing decline in the performance of Kenyan REITs and the restructuring of their business portfolios are hindering significant previous investments. Additional general challenges include:
- Insufficient understanding of the investment instrument among investors leading to a slower uptake of REIT products,
- Lengthy approval processes for REIT creation,
- High minimum capital requirements of Kshs 100.0 mn for REIT trustees compared to Kshs 10.0 mn for pension funds Trustees, essentially limiting the licensed REIT Trustee to banks only
- The rigidity of choice between either a D-REIT or and I-REIT forces managers to form two REITs, rather than having one Hybrid REIT that can allocate between development and income earning properties
- Limiting the type of legal entity that can form a REIT to only a trust company, as opposed to allowing other entities such as partnerships, and companies,
- We need to give time before REITS are required to list – they would be allowed to stay private for a few years before the requirement to list given that not all companies maybe comfortable with listing on day one, and,
- Minimum subscription amounts or offer parcels set at Kshs 0.1 mn for D-REITs and Kshs 5.0 mn for restricted I-REITs. The significant capital requirements still make REITs relatively inaccessible to smaller retail investors compared to other investment vehicles like unit trusts or government bonds, all of which continue to limit the performance of Kenyan REITs.
We expect the performance of Kenya’s Real Estate sector to remain resilient, supported by several factors: i) plans by the Kenyan government to construct two expressways linking Kenya and Uganda ii) plans by NSSSF to develop a Ksh 30.0 bn mixed-use Development in Nairobi CBD. However, challenges such as rising construction costs, infrastructure constraints, weak investor appetite in listed REITs such as ILAM Fahari I-REIT, oversupply in select real estate classes, and high capital demands will continue to impede the sector’s optimal performance.
In 2025, the general Real Estate sector continued to witness considerable growth in activity in terms of property transactions and development activities. Consequently, the sector’s activity contribution to Gross Domestic Product (GDP) grew by 7.6% to Kshs 368.7 bn in Q3’2025, from Kshs 342.6 bn recorded during the same period in 2024. In addition, the sector contributed 8.6% to the country’s GDP, 0.2% points decrease from 8.8% recorded in Q3’2024. Cumulatively, the Real Estate and Construction sectors contributed 16.6% to GDP, 0.1 % points increase from 16.5% in Q3’2024, attributable to a surge in construction sector contribution to GDP by 9.3 % points, to 6.7% in Q3’2025, from a contraction of 2.6% recorded in Q3’2024. The graph below highlights the Real Estate and Construction sectors’ contribution to GDP from 2020 to Q3’2025;
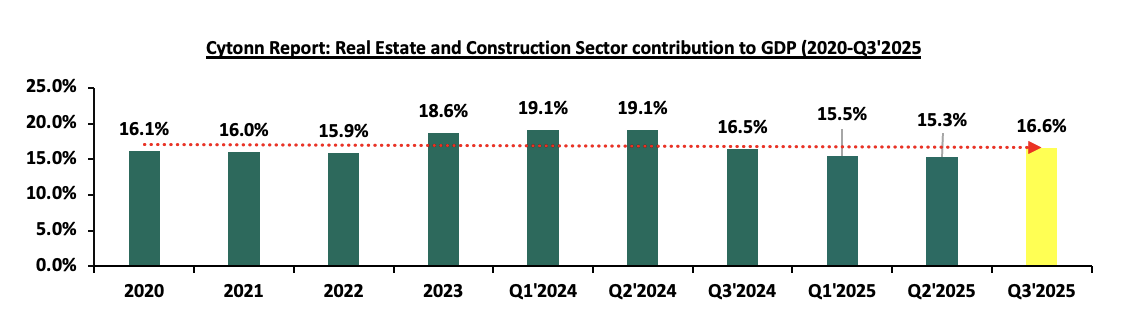
Source: Kenya National Bureau of Statistics (KNBS)
Some of the key factors that continued to positively shape the performance of the Real Estate sector include; i) The government's ongoing focus on the Affordable Housing Program has been a major driver of growth, ii) Continuous improvements in infrastructure, such as new roads, bridges, and utilities, have opened up previously inaccessible areas for real estate development, iii) Kenya Mortgage Refinance Company (KMRC) has continued to drive the availability and affordability of home loans to Kenyans by providing single-digit fixed rate, and long-term finance to Primary Mortgage Lenders (PMLs) such as banks and SACCOs, iv) the retail landscape has seen a surge in growth, with both domestic and international retailers like Naivas, QuickMart, China Square, and Carrefour aggressively expanding their market presence, v) Kenya continues to enjoy recognition as a regional business hub, vi) high urban population growth and population growth rates of 2.8% p.a and 2.0% p.a, respectively, against the global average of 1.4% p.a and 1.0% p.a, respectively, as at 2024, there is a sustained demand for more housing units in the country, vii) increase in investor confidence has greatly influenced hospitality sector and this is evident through mergers, acquisitions and expansions of hotels, viii) increased popularity of purpose-built properties to host Student housing, medical centers, diplomatic residentials, data centers which offer potential for growth to the Real Estate sector through alternative markets, and ix) Construction costs decreased by 9.0% in 2025 to an average of Kshs 76,230 per SQM from an average of Kshs 83,731 per SQM recorded in 2024,
Despite the above cushioning factors, there were various challenges that impeded the optimum performance of the Real Estate sector such as; i) existing oversupply of physical space in select sectors, ii) The Kenyan REITs market remains subdued, hampered by key challenges, which include, high capital requirements for trustees (Kshs 100.0 mn vs. Kshs 10.0 mn for pension funds), which effectively restricts the role to banks. Furthermore, the market faces prolonged approval processes, a scarcity of qualified legal entities for incorporation, and high entry thresholds, Kshs 0.1 mn for D-REITs and Kshs 5.0 mn for restricted I-REITs, iii) constrained financing to developers as lenders continue to tighten their lending requirements and demand more collateral from developers as a result of the high credit risk in the real estate sector.
As the REITs continue to gain popularity in Kenya, we set to explore and review the REITs environment in 2025 building on the previous report we did: Kenya’s REITs H1’2025.
This week’s report will focus on the below sections as we dig deeper to understand REITs in Kenya.
- Overview of the REITs Sector in Kenya
- Key Drivers and Market Trends in 2025
- Challenges and Opportunities in the REITs Sector
- Conclusion and Outlook for the REITs Sector in 2026
Section I: Overview of the REITs Sector in Kenya
Real Estate Investment Trusts are crucial to the development given the limited funding available to the developers. Real Estate Investment Trusts (REITs) represent an innovative financing avenue for real estate development in Kenya. REITs provide a structured mechanism for pooling resources from multiple investors to finance or acquire income-generating real estate assets. The Capital Markets Authority (CMA) regulates REITs in Kenya, ensuring transparency and investor protection. Despite being relatively new in the Kenyan financial market, REITs have shown potential as a transformative tool for real estate financing.
In Kenya, REITs are classified into two main types:
- Development REITs (D-REITs): These focus on financing the construction of new real estate projects. Developers utilize D-REITs to raise capital for large-scale projects, such as residential complexes, commercial buildings, or mixed-use developments. Investors in D-REITs anticipate returns from the eventual sale or lease of the completed properties. Example of this REIT include Acorn D-REIT.
- Income REITs (I-REITs): These are designed for properties that generate consistent rental income. I-REITs appeal to investors seeking steady cash flow from established properties such as office buildings, shopping malls, or industrial parks. In Kenya examples of I-REITs include Acorn I-REIT and Stanbic Fahari I-REITs.
REITs in Kenya are governed by strict regulations aimed at safeguarding investors. REITs are formally established in accordance with regulations set forth for Real Estate Investment Trusts (REITs) and granted approval by the Capital Markets Authority (CMA) under the Capital Markets Real Estate Investment Trusts Collective Investment Schemes Regulations of 2013. Instead of taking the form of conventional companies, they are structured as trusts. The management of investment properties falls under the purview of a corporate REIT manager, licensed by the CMA. Units of listed REITs are traded on the Nairobi Securities Exchange (NSE), akin to shares of any other company listed on both the Main Market Segment and the Unquoted Security Platform (USP), providing investors with a liquid stake in Real Estate. Both individual and corporate investors have the opportunity to partake in a public offering on the NSE, as outlined in the Regulations of 2013.
Furthermore, the regulations stipulate that Kenyan REITs are mandated to distribute a minimum of 80.0% of distributable earnings to their unitholders as dividends, making them attractive to those seeking regular income. Additionally, REITs automatically qualify for several tax exemptions such as the Income Tax Act (ITA), Value Added Tax (VAT), and Capital Gains Tax (CGT) under the authorization of the Kenya Revenue Authority (KRA) which enhance their appeal to both developers and investors.
In 2013, the Capital Markets Authority (CMA) introduced a detailed framework and regulations for REITs, enabling developers to secure capital through this investment avenue.
Kenya's Real Estate sector has been expanding due to ongoing construction activities driven by strong demand for real estate developments. The residential market is significantly under-supplied, with a 2.0 mn units housing deficit growing by 250,000 units per year; only 50,000 units are delivered annually against an estimated need for 200,000 units per year. Additionally, the formal retail market in Kenya is still in its nascent stages, with a penetration rate of approximately 30.0%, as reported by the World Bank. Despite the high demand, developers in Kenya encounter limited financing options, with local banks providing nearly 99.0% of construction financing, in stark contrast to the 40.0% typically seen in developed countries. The graph below illustrates the comparison of construction financing in Kenya versus developed economies;
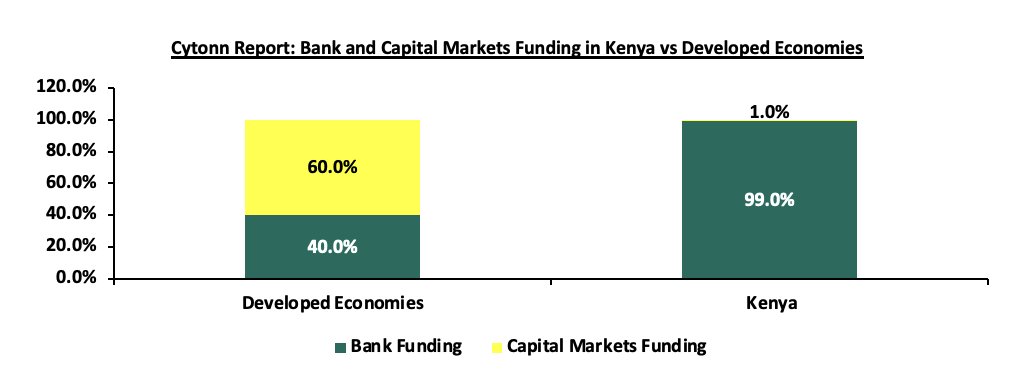
Source: World Bank, CMA
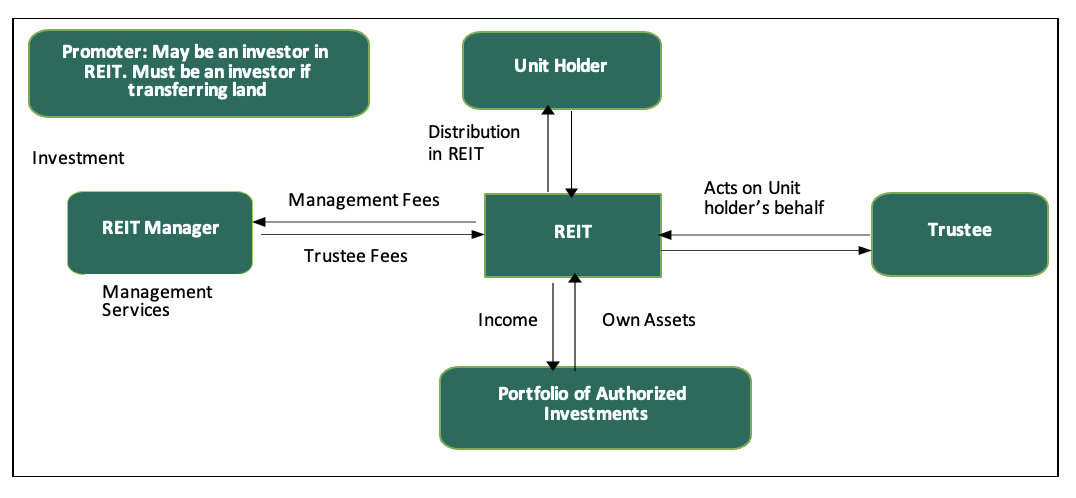
To bridge the funding gap, developers are increasingly turning to alternative financing methods. In 2013, the Capital Markets Authority (CMA) introduced a regulatory framework for Real Estate Investment Trusts (REITs) in Kenya. REITs are collective investment vehicles that pool funds from investors, who then acquire rights or interests in a trust divided into units. Investors benefit from profits or income generated by the real estate assets held within the trust. To ensure transparency, accountability, and the protection of investors' interests, four essential entities play key roles in the REIT structure in Kenya:
- The Promoter: This entity is responsible for establishing the REIT scheme. The promoter acts as the initial issuer of REIT securities and handles submissions to regulatory authorities for approvals of trust deeds, prospectuses, or offering memorandums. Examples of REIT promoters in Kenya include Acorn Holdings Limited and LAP Trust.
- The REIT Manager: This is a licensed company in Kenya that provides real estate and fund management services for a REIT scheme on behalf of investors. There are currently 10 REIT Managers in Kenya, including Cytonn Asset Managers Limited, Acorn Investment Management, and Stanlib Kenya Limited.
- The Trustee: A corporation or company appointed under a trust deed and licensed by the CMA to hold real estate assets on behalf of investors. The trustee's primary role is to act in the best interests of investors by evaluating investment proposals from the REIT Manager and ensuring compliance with the Trust Deed. REIT trustees in Kenya include Kenya Commercial Bank (KCB) and Co-operative Bank.
- Project/Property Manager: The project manager oversees the planning and execution of construction projects within the REITs. Meanwhile, the property manager handles the management of completed real estate developments acquired by a REIT, with a focus on generating profit.
The relationship between key parties in a typical REIT structure is depicted in the figure below;
Since its introduction in 2013, the REIT market in Kenya has faced several hurdles that have hindered its growth. Key challenges include the hefty capital requirement of Kshs 100.0 mn for trustees, limiting this role largely to banks, and a protracted approval process for setting up REITs. Additionally, the high minimum investment threshold of Kshs 5.0 mn discourages potential investors, while a lack of sufficient investor education and awareness further impedes market expansion. As a result, the REIT market capitalization in Kenya remains significantly lower compared to other regions
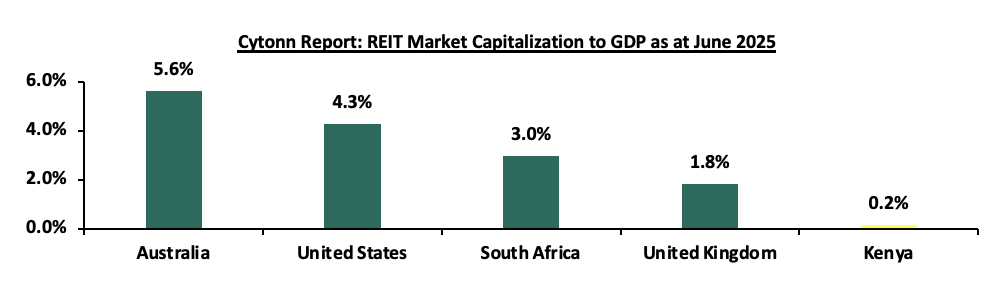
The underdeveloped capital markets in Kenya has continually failed to provide alternative means of financing Real Estate developments. Due to this, most property developers rely on conventional sources of funding such as banks, compared to other developed countries. As a result, Kenya’s REIT Market Capitalization to GDP has remained significantly low at 0.2%, compared to other countries such as South Africa with 3.0%, as shown below;
Source: European Public Real Estate Association (EPRA), World Bank, Cytonn Research
Most property developers in Kenya continue to rely on traditional funding sources, such as banks, unlike in more developed markets. Since the establishment of REIT regulations, four REITs have been approved in Kenya, all structured as closed-ended funds with a fixed number of shares. However, none of these REITs are actively trading on the Main Investment Market Segment of the Nairobi Securities Exchange (NSE). Following the delisting of ILAM Fahari I-REIT on February 2024, LAPTrust Imara I-REIT is the only listed REIT in the country, quoted on the restricted market sub-segment of the NSE's Main Investment Market. It is important to note that Imara I-REIT did not raise funds upon listing. The ILAM Fahari I-REIT, Acorn I-REIT and D-REIT are not listed but trade on the Unquoted Securities Platform (USP), an over-the-counter market segment of the NSE. The table below outlines all REITs authorized by the Capital Markets Authority (CMA) in Kenya
|
Cytonn Report: Authorized REITs in Kenya |
||||||
|
# |
Issuer |
Name |
Type of REIT |
Listing Date |
Market Segment |
Status |
|
1 |
ICEA Lion Asset Management (ILAM) |
Fahari |
I-REIT |
July 2024 |
Unquoted Securities Platform (USP) |
Trading |
|
2 |
Acorn Holdings Limited |
Acorn Student Accommodation (ASA) – Acorn ASA |
I-REIT |
February 2021 |
Unquoted Securities Platform (USP) |
Trading |
|
3 |
Acorn Holdings Limited |
Acorn Student Accommodation (ASA) – Acorn ASA |
D-REIT |
February 2021 |
Unquoted Securities Platform (USP) |
Trading |
|
4 |
Local Authorities Pension Trust (LAPTrust) |
Imara |
I-REIT |
March 2023 |
Restricted Market Sub-Segment of the Main Invesment Market |
Restricted |
Source: Nairobi Securities Exchange, CMA
Advantages of REITs
- Access to real estate with lower capital outlay: REITs allow investors to gain exposure to income-generating real estate without the large capital requirements associated with direct property ownership. Instead of purchasing land or buildings outright, investors can buy REIT units with comparatively smaller amounts, making property investment more accessible to retail, diaspora, and institutional investors.
- Stable and predictable income streams: Kenyan REITs, particularly Income REITs (I-REITs), generate regular cash flows from rental income. Regulations require REITs to distribute a significant portion of their taxable income to unit holders, providing investors with consistent dividend yields, which is especially attractive in an environment of volatile capital markets.
- Portfolio Diversification: REITs offer investors a way to diversify across asset classes, locations, and tenant profiles without directly managing properties. By holding a single REIT unit, investors gain exposure to multiple properties such as offices, retail, student housing, or residential assets, reducing concentration risk compared to owning a single property.
- Professional Management and Governance: REITs in Kenya are managed by licensed and regulated professional fund managers under the oversight of the Capital Markets Authority (CMA). This structure ensures stronger governance, transparent reporting, and professional asset management advantages that individual property owners often lack.
- Liquidity compared to direct property ownership: Unlike physical real estate, which can take months to sell, REIT units can be traded (subject to market conditions) on the Nairobi Securities Exchange or the Unquoted Securities Platform. While liquidity is still developing, REITs offer relatively faster exit options compared to traditional property investments.
- Tax efficiency: REITs in Kenya offer a highly tax-efficient vehicle for real estate exposure, primarily through an exemption from the standard 30.0% corporate income tax for both the registered REIT and its investee companies, provided they distribute the mandated portion of earnings to unitholders. While distributions are subject to withholding tax for non-exempt investors, the structure benefits from significant Capital Gains Tax (CGT) exemptions on unit redemptions and property sales by the REIT. Furthermore, although a 15.0% CGT and Stamp Duty typically apply to property transfers and D-REIT to I-REIT transitions, exemptions are available for transfers from life insurance companies to a REIT, internal restructurings via SPVs, and direct asset transfers which are also VAT-exempt. This combination of incentives enhances net returns and provides a superior alternative to owning property through traditional corporate entities,
- Risk mitigation through regulation: REIT regulations impose limits on leverage, asset concentration, and related-party transactions, reducing systemic and governance risks. These safeguards protect investors and promote market stability, especially important for pension funds and long-term institutional investors.
- Inflation Hedge: Rental income and property values tend to adjust upward over time, making REITs a natural hedge against inflation. In Kenya’s inflationary environment, REITs help preserve purchasing power while generating real (inflation-adjusted) returns.
- Gateway for institutional and foreign capital: REITs provide a structured, transparent vehicle through which institutional investors, DFIs, and foreign investors can deploy capital into Kenya’s real estate market. This supports sector formalization, deepens capital markets, and reduces reliance on bank lending.
- Support for housing and infrastructure development: Development REITs (D-REITs) mobilize long-term capital for housing, student accommodation, and mixed-use developments, supporting Kenya’s urbanization and housing agenda. This aligns private capital with national development priorities while offering investors exposure to growth assets.
- Reduced operational burden for investors: REIT investors are insulated from day-to-day property management issues such as tenant management, maintenance, and regulatory compliance. This makes REITs particularly attractive to passive investors seeking real estate exposure without operational complexity.
Section II: Themes that Shaped the REIT Sector in 2025
In this section, we examine the key themes that have significantly shaped the REIT sector in 2025. We explore how strategic acquisitions, and capital-raising initiatives have influenced the REIT industry's trajectory. Additionally, we provide insights into the broader factors that have impacted the sector's performance and overall direction during this period.
- Portfolio Holdings & Acquisitions
Acquisitions play a pivotal role in the dynamic landscape of the Kenyan REITs industry. These strategic moves signify the industry's evolution, adaptability, sustainability, and growth potential. As of January 2025, the industry has witnessed noteworthy acquisitions that are reshaping the sector. These acquisitions hold a promising outlook for the industry, contributing to its progress and value proposition. They exemplify how REITs are actively enhancing their portfolios, expanding their market presence, and optimizing their performance. Some of the notable acquisitions and developments in 2025 include;
- In 2025, Acorn Student Accommodation Development REIT continued to be the most active acquirer and developer within Kenya’s REIT market, expanding beyond Nairobi into key university towns. During the year, the D-REIT acquired land near Masinde Muliro University of Science and Technology (MMUST) in Kakamega, marking its entry into Western Kenya’s student housing market. In addition, the REIT progressed with the Eldoret CBD student accommodation development, comprising Qwetu and Qejani branded hostels, collectively adding approximately 2,100 new student beds to its development pipeline. These acquisitions and developments reinforced Acorn D-REIT’s strategy of geographic diversification and scale-driven growth within the purpose-built student accommodation segment.
- During 2025, LAPTRUST Imara I-REIT did not record any publicly disclosed new property acquisitions. The REIT maintained its existing diversified portfolio comprising office, retail, residential, and institutional assets, focusing on asset stabilization, rental performance, and portfolio optimization rather than expansion. As such, no material additions to its property holdings were reported during the year.
- ILAM Fahari I-REIT similarly did not announce any new portfolio acquisitions. The REIT continued to hold its existing commercial real estate assets, including retail and office properties, with performance during the year driven mainly by asset revaluations, rental income management, and balance-sheet optimization rather than active acquisition activity.
In the future, we expect REITs to maintain a strategic acquisition strategy. This will involve actively seeking opportunities to expand their portfolios, diversify their holdings, and respond to evolving market demands. Additionally, REITs are likely to prioritize environmental sustainability, as exemplified by Acorn Holding's issuance of green bonds. Such acquisitions can also stimulate innovation within the industry, encouraging the development of new ideas, designs, and services that cater to the needs of both investors and tenants.
- Capital Raising
Raising capital is essential in the REITs industry, fueling growth, development, and innovation. Securing funds from diverse sources, whether through debt or equity, enables REITs to expand their portfolios, improve existing properties, and explore new investment opportunities. This practice benefits the REITs and significantly shapes the Real Estate landscape, providing attractive investment options to stakeholders. Some of the notable capital infusion in the REITs industry as of 2025 include;
- Mi Vida Homes announced plans to raise between Kshs 15.0 bn and 20.0 bn from both local and international institutional investors in the first quarter of 2026. This is considered a big stride in Kenya’s Real Estate sector because this is set to be earmarked as Kenya’s first hybrid real estate fund. A hybrid Real Estate fund describes an investment vehicle that is designed to pool capital from investors by combining both an Income and Development Real Estate Investment Trust (REIT).
- Africa Logistics Properties (ALP) received approval from the Capital Markets Authority (CMA) to proceed with a restricted offer for its ALP Industrial Real Estate Investment Trust (I-REIT), targeting professional investors only. The offer involves issuing up to 30 mn units at USD 1.0 per unit to raise up to USD 30.0 mn, alongside a promoter consideration of up to 15 mn units issued in exchange for seed logistics assets. The I-REIT will invest in modern Grade A and B warehousing and logistics facilities across East Africa, with initial seed assets located in Imara Daima and Tatu City, Nairobi.
- Centum Investment Company announced that they expect to issue a dollar denominated Income Real Estate Investment Trust (I-REIT) at its Two Rivers Special Economic zone in Nairobi in January 2026. Centum is eyeing Kshs 4.8 bn from the proposed I-REIT, which is pending regulatory approval, with the proceeds budgeted for the construction of green commercial property in the Two Rivers International Finance and Innovation Centre (TRIFIC). The launch will be done within the month of February 2026
Section III: Challenges and Opportunities in the REITs Sector
Kenya’s REIT market is evolving, and while it offers promising investment prospects, several challenges continue to shape its growth trajectory. At the same time, these challenges create opportunities for strategic improvements and market expansion of the sector;
- Challenges
- Regulatory and compliance hurdles
One of the major challenges confronting the REIT market in Kenya is the evolving regulatory framework. Although the Capital Markets Authority (CMA) has introduced guidelines to enhance transparency and protect investors, frequent changes and complex compliance requirements often create uncertainty for REIT managers and potential issuers. The intricate registration process and continuous updates in regulatory policies can discourage market participants, limiting the number of listings. However, this challenge also provides an opportunity for the industry to collaborate more closely with regulators, streamlining processes and establishing more predictable compliance standards that could, in turn, bolster investor confidence and market stability. The REITS association of Kenya can help to advocate for clear, stable and supportive frameworks and streamlining of compliance processes to reduce uncertainties for REIT managers and issuers. Some of the regulatory and compliance challenges include:
- Limiting the type of legal entity that can form a REIT to only a trust company, as opposed to allowing other entities such as partnerships, and companies,
- We need to give time before REITS are required to list – they would be allowed to stay private for a few years before the requirement to list given that not all companies maybe comfortable with listing on day one,
- Minimum subscription amounts or offer parcels set at Kshs 0.1 mn for D-REITs and Kshs 5.0 mn for restricted I-REITs. The significant capital requirements still make REITs relatively inaccessible to smaller retail investors compared to other investment vehicles like unit trusts or government bonds, all of which continue to limit the performance of Kenyan REITs,
- Lengthy approval processes for REIT creation,
- The rigidity of choice between either a D-REIT or and I-REIT forces managers to form two REITs, rather than having one Hybrid REIT that can allocate between development and income earning properties. However, Mi Vida Homes announced plans to have a hybrid REIT to raise up to Kshs 20.0 bn, and,
- High minimum capital requirements of Kshs 100.0 mn for REIT trustees compared to Kshs 10.0 mn for pension funds Trustees, essentially limiting the licensed REIT Trustee to banks only.
- Limited Liquidity and Thin Trading
One of the most persistent challenges facing Kenya’s REIT market in 2025 was limited liquidity on public markets. Most REITs, including Acorn Student Accommodation I-REIT, ASA D-REIT, and ILAM Fahari I-REIT, continued to trade on the Unquoted Securities Platform (USP) rather than the Main Market of the Nairobi Securities Exchange (NSE). Even for LAPTRUST Imara I-REIT, which is listed on the NSE, trading remained restricted to the professional investor segment with low turnover and limited price discovery. This constrained investor participation, making it difficult for some unit holders to exit positions or achieve market valuations reflective of underlying asset performance.
- Investor awareness and confidence
A critical challenge in the Kenyan REIT landscape is the insufficient understanding of the investment instrument among investors leading to a slower uptake of REIT products. The low level of investor awareness about these investment vehicles. Many local investors are still more comfortable with traditional bank deposits and direct property investments. Historical performance issues in some segments of the real estate market, coupled with a lack of comprehensive educational initiatives, have contributed to cautious investor sentiment. This challenge, however, presents a considerable opportunity. By launching targeted investor education programs, hosting seminars, and enhancing market transparency through better reporting and digital platforms, REIT managers can gradually shift public perception. Building a robust narrative around stable, income-generating real estate investments can lead to increased participation and sustained growth in the market.
- Limited Institutional Participation
While institutional investor interest remained in principle, actual deployment by pension funds and insurers was still measured. Many institutional frameworks require longer track records, transparent governance structures, and broader market participation before allocating meaningful portions of portfolios to REITs. This slowed down large ticket capital inflows that could otherwise scale the market quickly.
- Operational and management challenges
Managing a diverse portfolio of real estate assets across different regions requires advanced operational systems and strategic expertise. Inefficient property management, underutilization of assets, and the lack of technological integration can hinder the overall performance of REITs. This challenge, however, also opens the door for innovation. The adoption of modern property management software, digital leasing platforms, and data-driven decision-making tools can significantly enhance operational efficiency. By embracing technology, REITs can reduce costs, improve tenant satisfaction, and increase overall yields, thereby creating a more attractive proposition for investors.
- Opportunities for growth and expansion
Despite the challenges, the opportunities in the Kenyan REIT market are significant. Rapid urbanization in major cities such as Nairobi, Mombasa, and Kisumu are driving demand for quality commercial and residential spaces. Government initiatives to improve infrastructure and attract foreign investment further enhance the market potential. With supportive policy reforms and a growing emphasis on financial inclusion, REITs are well positioned to tap into new asset classes and diversify their investment portfolios. By capitalizing on these trends, REITs can not only improve their performance but also play a crucial role in shaping Kenya’s broader real estate landscape. The two upcoming Cities: Eldoret and Nakuru will see an increase in demand for Real Estate infrastructures in retail, hospitality, office, residential, and industrial spaces. Below are the opportunities available for the REITs in Kenya in 2026
- Growth of student accommodation as a core asset class
A standout opportunity in 2025 was the expansion of purpose-built student accommodation as a REIT-eligible asset class. The Acorn Student Accommodation REITs leveraged this demand, expanding bed capacity not only in Nairobi but into Tier-2 university towns like Eldoret and Kakamega. High occupancy rates and stable cash flows made this segment attractive for both income-oriented and long-term investors, proving resilience even in a tighter economic environment.
- Emergence of dollar-denominated and hybrid REIT structures
To mitigate currency risk and broaden investor appeal, 2025 saw early development of USD-denominated REIT products and hybrid structures that blend income and development features. These products attracted interest from diaspora investors and offshore funds seeking hard currency yields. Such innovations expanded the investor base and reduced reliance on local currency exposure.
- Institutional anchor capital and creative funding models
As traditional public capital raising faced headwinds, REIT sponsors increasingly turned to institutional anchor capital, consortium funding, and phased equity calls. For example, structured deals involving development capital from infrastructure funds and development finance institutions (DFIs) helped launch new REIT vehicles and reduced sponsor risk. These hybrid models increased deal feasibility and established new pathways for growth.
- Increased investor education and market sophistication
With more REIT product launches and deeper media coverage in 2025, investors, both retail and institutional, became more knowledgeable about REIT mechanics, yield profiles, and diversification benefits. This improved investor literacy laid the groundwork for increased future participation and deeper capital markets activity.
- Policy support and tax incentives potential
While regulatory frameworks remained imperfect, incremental reforms in tax treatment, listing incentives, and pension fund guidelines signaled government recognition of REITs as capital market deepening tools. Should these reforms accelerate in 2026 and beyond, the sector is well positioned to benefit from enhanced investor confidence and cleaner regulatory triggers for broader adoption.
Addressing these challenges will go a long way ensuring the sector thrives and the funding constraint improves. The REITS association of Kenya can intervene and advocate for the rights and welfare of the REITs managers and issuers
Section IV: Conclusion, Recommendations, and Outlook for the REITs Sector
Kenya's REITs market has seen moderate performance, shaped by various factors. Despite challenges, there are encouraging trends, such as growth in net operating incomes, indicating improved financial performance. Additionally, leverage ratios for most REITs have remained low, with many REITs being ungeared and relying on short-term debt for their operations to avoid overexposure to rising interest rates. This trend is expected to continue as REITs seek to maintain financial sustainability, as evidenced by Acorn Holdings' issuance of a green bond. Moreover, the recent regulatory proposal by the Capital Markets Authority (CMA) to reduce the minimum investment amounts for professional investors to Kshs 10,000 is anticipated to increase interest in the sector and attract a broader investor base.
Recommendations to Enhance the REITs Sector:
- Stakeholder education: There is an urgent need to enhance understanding of the REIT framework among all key stakeholders. Comprehensive investor education and awareness initiatives should be implemented to clearly communicate both the benefits and risks associated with REIT investments. Improved investor literacy will expand participation, deepen market confidence, and support the long-term growth and sustainability of the REIT sector.
- Broadening permissible legal structures: In contrast to Kenya’s predominantly trust-based REIT framework, markets such as South Africa, Belgium, and the United States permit REITs to be established under various legal forms, including public limited companies, limited liability companies, cooperatives, and partnerships. This structural flexibility accommodates diverse business models and investor preferences. To enhance the competitiveness and accessibility of Kenya’s REIT market, it is recommended that allowable structures be expanded beyond trusts to include corporate and partnership models. Such diversification would reduce entry barriers and foster a more resilient and dynamic REIT ecosystem.
- Streamlining the approval and regulatory process: The current REIT approval process involves oversight by both the Capital Markets Authority (CMA) and the Kenya Revenue Authority (KRA), creating procedural duplication and delays. Consolidating the approval function under a single regulatory framework would significantly improve efficiency. A unified approval process would reduce compliance costs, shorten timelines, and enhance transparency, thereby making REIT formation more attractive to issuers and fund managers.
- Encourage hybrid REIT vehicles: Currently, investors are required to subscribe separately to income and development REITs, resulting in duplicated costs and administrative complexity. Introducing hybrid REIT vehicles that combine development-stage growth potential with stable income-generating assets would offer investors a more balanced risk-return profile. Such structures would simplify investment decisions, reduce costs, and enhance overall market attractiveness.
- Flexibility in listing: Given the apprehensions of many companies regarding an immediate shift to public listing, a phased approach is recommended. Providing REITs with an initial period of private operation before mandating public listing could ensure a smoother transition and align with corporate comfort levels. For example, Belgium’s model, requiring 30% public shareholding, strikes a balance between public participation and promoter flexibility. Kenya could adopt a similar strategy, or even consider offering REITs the choice between public and private listings, which would foster inclusivity and better accommodate diverse investor preferences while bolstering market liquidity.
- Lower capital requirement for trustees: Currently, the minimum capital requirement for REIT trustees is set at Kshs 100.0 mn, a threshold that effectively restricts trusteeship primarily to major banking institutions. With only a handful of banks registered as REIT trustees, such as Kenya Commercial Bank (KCB), Co-operative Bank, Housing Finance Bank, and NCBA Bank Kenya, it is recommended that this minimum be reduced to Kshs 10.0 mn. This adjustment, aligning with the minimum standards set for Pension Fund Trustees, would expand the pool of potential trustees and encourage more competitive, innovative service provision for REIT managers.
- Introduce tokenization of REITs: Embracing the concept of tokenization presents an innovative avenue to broaden market participation. By digitizing REIT units into smaller denominations, potentially allowing investments as low as Kshs 100.0, it becomes possible to lower entry barriers, enhance liquidity, and attract a broader range of investors, including those with limited capital.
- Diminishing Entry Barriers: Revisiting the current minimum investment requirement of Kshs 0.1 mn for D-REITs and Kshs 5.0 mn for the restricted I-REIT, is essential to eliminate barriers that restrict individual participation. Notably, given that D-REITs are riskier compared to I-REITS, it makes no sense having I-REITs with higher minimum investment requirements compared to D-REITs. Lowering this threshold to Kshs 50,000 for I-REITs would foster a more inclusive investment environment, allowing a wider array of investors to access and benefit from the REIT market, ultimately bolstering overall market vibrancy and liquidity.
The outlook for Kenya's REITs sector remains cautiously optimistic. While challenges such as high construction costs and market saturation in certain areas persist, the continued government support through infrastructure development and affordable housing initiatives provides a positive backdrop. Investors are expected to remain focused on income-generating REITs, particularly those tied to resilient sectors like retail and commercial properties. The sector's growth will likely hinge on increased investor awareness and the broadening of investment options within the REITs market.
In 2026, we expect REITS to gain popularity as developers such as Centum Real Estate looking forward to launch a dollar based Income REIT and we expect that the dollar based I-REIT will: i) increase foreign investments by boosting investors’ confidence against local currency uncertainties, ,ii) dollar-denominated REITs provide an alternative for investors seeking more liquid and globally recognized investment options, iii) the dollar based move is likely to set a precedent for other players in the market, encouraging the development of more innovative and investor-centric financial products, and, iv) the fund could force policy regulatory framework improvement to ensure transparency and investments protection.
In addition, we expect the sector will continue to lag behind in comparison to other African countries such as South Africa, attributable to several challenges facing the sector such as; i) lack of sufficient investor awareness regarding the potential of REITs as an investment tool, ii) lengthy approval procedures for establishing REITs have hindered their formation and deployment in the market, iii) high minimum capital requirement of Kshs 100.0 mn for REIT trustees compared to Kshs 10.0 mn for pension funds Trustees, essentially limiting the licensed REIT Trustee to banks only,, and, iv) steep minimum subscription amounts or offer parcels set at Kshs 0.1 mn for D-REITs and Kshs 5.0 mn for restricted I-REITs.
However, we also expect the trend of strategic acquisitions to persist, with REITs actively seeking opportunities to broaden and diversify their portfolios, cater to evolving market demands and also set standards in promoting environmental sustainability such as execution of green bonds by Acorn holding. While there are supportive factors for the growth of REITs in Kenya, such as urbanization and government infrastructure projects, challenges like high interest rates and regulatory constraints may tamper performance. Stakeholders in the REIT sector are advised to monitor these dynamics closely and engage in strategic planning to navigate the evolving market landscape effectively.
Moving forward, we also expect the trend of strategic acquisitions to persist, with REITs actively seeking opportunities to broaden and diversify their portfolios, cater to evolving market demands and also set standards in promoting environmental sustainability such as execution of green bonds by Acorn holding.
Disclaimer: The views expressed in this publication are those of the writers where particulars are not warranted. This publication, which is in compliance with Section 2 of the Capital Markets Authority Act Cap 485A, is meant for general information only and is not a warranty, representation, advice, or solicitation of any nature. Readers are advised in all circumstances to seek the advice of a registered investment advisor.

- Talk to us
- Kenya
- P.O Box 20695 - 00200, Nairobi, Kenya
- Cell +254709101200
- Tel +254709101200
- WhatsApp +254741676635
- United States
- +254709101200
- DOWNLOAD OUR APP
-


- Kenya
- 8th Floor, Pinetree Plaza, Kaburu Drive, Ngong Road, Nairobi, Kenya
- USA
- Suite 1150, 1775 Eye Street NW, USA, Washington DC 20006, USA
- Investments
- High Yield
- Private Equity
- Real Estate
- Real Estate
- RiverRun Estates
- Cytonn Towers
- The Ridge
- Taraji Heights
- The Alma