Cytonn Annual Markets Review - 2025
By Cytonn Research, Jan 4, 2026
Executive Summary
Global Markets Review
According to the World Bank's June 2025 Global Economic Prospects report, the global economy is projected to grow at 2.3% in 2025, lower than the 2.8% growth recorded in 2024. This forecast marks a significant downward revision from earlier projection in January of 2.7%, reflecting anticipated economic downturn, particularly due to rising international trade disputes and policy uncertainties. The World Bank’s growth projection of 2.3% is 0.9% points lower than the IMF’s October 2025 World Economic Outlook forecast of 3.2%, which was also revised from the July 2025 projection of 3.0%. In their last Global Economic Prospects Report in June 2025, the World Bank revised their global growth forecasts downward due to weakening global trade, largely driven by rising U.S. tariffs and the resulting trade tensions, which disrupted global supply chains and slowed cross-border economic activity. Notably, advanced economies are expected to record a 1.2% growth in 2025, down from the 1.7% expansion recorded in 2024. Additionally, emerging markets and developing economies are projected to expand by 3.8% in 2025, down from the 4.2% expansion recorded in 2024. On the other hand, the IMF revised their projection upwards to 3.2% from the July 2025 projection of 3.0% due to private sector agility, new trade deals, and restraint from most countries in keeping markets open. However, with U.S. tariffs still high and trade tensions unresolved, the longer‑term impact may intensify as costs shift to consumers and efficiency declines;
Sub-Saharan Africa Regional Review
According to the World Bank, the Sub-Saharan economy is projected to grow at a moderate rate of 3.7% in 2025, which is 0.2% points higher than the 3.5% growth recorded in 2024, but a downward revision from the January 2025 projection of 4.1%. The downward revision is mainly due to the rising trade barriers coupled with the weakened global investor confidence. The expected recovery from 2024 is primarily driven by global economic stability, and easing of monetary policy rates in the region, which is expected to boost private consumption and investment. However, most countries face the risk of increased inflation due to increased food prices resulting from drought, prompting them to increase or hold off on further easing of the rates. Nevertheless, the risk of debt distress remains high with the region’s public debt to GDP ratio expected to remain high at 58.0% in 2025, with more than half of countries facing unsustainable debt burdens. Public debt is expected to remain high due to increased debt servicing costs as a result of high interest rates in developed economies and a reduction in donor support;
In 2025, most of the select Sub-Saharan currencies appreciated against the US Dollar, primarily due to the respective central bank efforts, increased foreign currency inflows and debt-restructuring and policy reforms which have improved forex reserves. Foreign currency inflows supported currency appreciation by boosting foreign exchange reserves, increasing dollar supply, and strengthening market confidence in the domestic currency’s stability. The Ghanaian Cedi appreciated the most by 25.7% in 2025 to close at GHS 10.9 against the US Dollar, compared to GHS 14.7 recorded in 2024 while the Tanzanian shilling was the worst performer during the year, depreciating by 2.2% against the dollar to close the year at TSh 2,447.5 from TSh 2,394.8 in 2024;
Kenya Macro Economic Review
According to the Kenya National Bureau of Statistics (KNBS) Q2’2025 Quarterly Gross Domestic Product Report, the Kenyan economy recorded a 5.0% growth in Q2’2025, 0.4% points higher from the 4.6% growth rate recorded in Q2’2024. The main contributor to Kenyan GDP remains the Agriculture, Fishing and Forestry sector which grew by 4.4% in Q2’2025, albeit lower than the 4.5% expansion recorded in Q2’2024. All sectors in Q2’2025 recorded positive growths, with varying magnitudes across activities. Most sectors recorded contraction in growth rates compared to Q2’2024 with Accommodation & Food Services, Financial Services Indirectly Measured and Other services recording growth rate declines of 27.2%, 8.9% and 3.4% points to 7.8%, 1.4% and 1.4% from 35.0%, 10.3% and 4.8% respectively. Other sectors recorded an expansion in growth rates, from what was recorded in Q2’2024, with Mining and Quarrying, Construction and Electricity and Water Supply recording the highest growths in rates of 20.8%, 9.4% and 4.5% points, to 15.3%, 5.7% and 5.7% from (5.5%), (3.7%) and 1.2% respectively. Notably, the overall economic performance highlighted modest growth despite a slowdown in several key sectors, reflecting the mixed performance across industries amid a challenging operating environment;
For FY’2025, the Kenyan economy is projected to grow at an average of 5.0%, up from 4.7% in FY’2024. The faster growth is supported by easing monetary policy, accommodative financial conditions, and a rebound in key sectors, particularly agriculture which has benefited from favorable weather conditions after previous droughts. The economic environment has been bolstered by several positive macroeconomic indicators, including inflation within the Central Bank's target range, a stable exchange rate, and foreign exchange reserves at record highs. The services sector, including tourism and financial services, is also expected to contribute positively to growth. Additionally, improved business sentiment and gradually recovering consumer demand are supporting economic expansion. However, growth remains constrained by fiscal consolidation efforts as the government works to address budget deficits and manage elevated public debt levels, alongside higher taxation measures that have weighed on disposable incomes, private consumption, and overall business activity;
During the week, KNBS released the y/y inflation for December 2025 highlighting that inflation remained unchanged from the 4.5% recorded in November 2025. This was in line with our projection, where our projection was mainly driven by the appreciation of the Kenya Shilling against the USD coupled with the stability of fuel prices. The headline inflation in December 2025 was majorly driven by a rise in prices of items in the Food and Non-Alcoholic Beverages at 7.8 %, Transport at 5.2 %, and Housing, Water, Electricity, Gas and other fuels at 1.6%;
Fixed Income
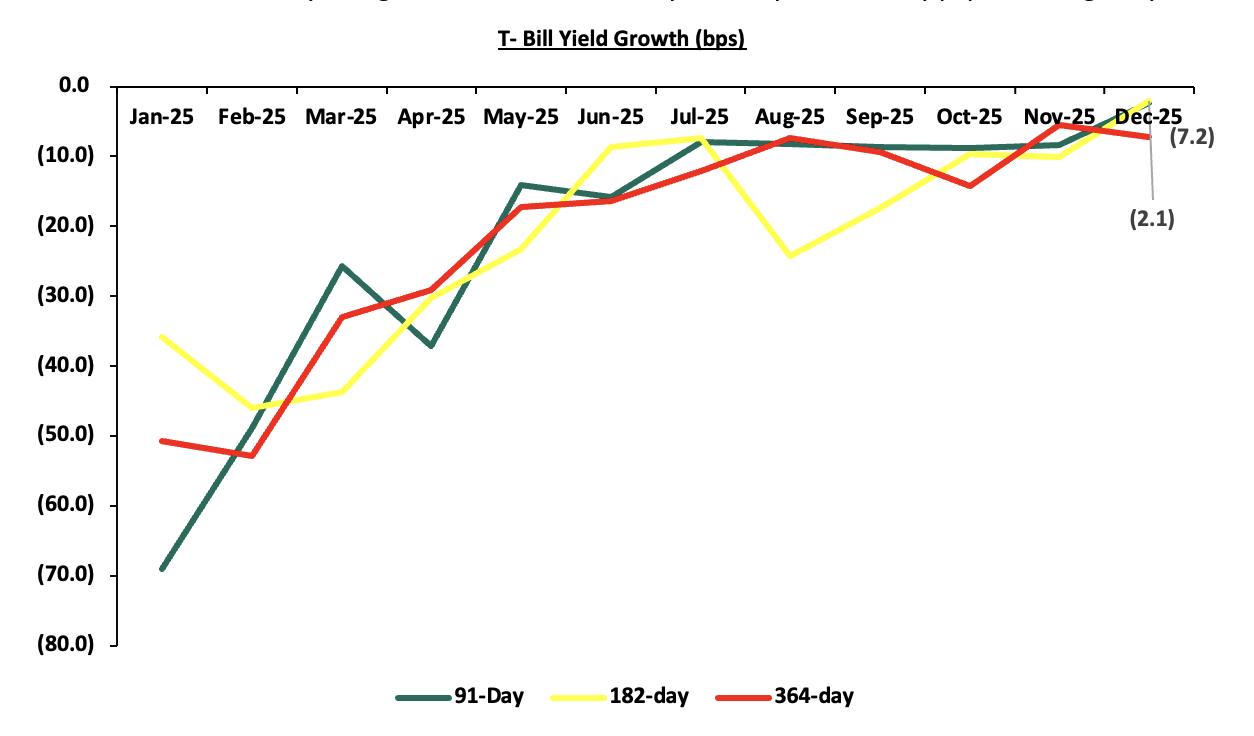
During the year, T-bills were oversubscribed, with the overall subscription rate coming in at 135.6%, down from 153.3% in FY’2024. Investors’ preference for the 91-day paper persisted as they sought to avoid duration risk, with the paper receiving bids worth Kshs 423.5 bn against the offered Kshs 208.0 bn, translating to an oversubscription rate of 203.6%, albeit lower than the oversubscription rate of 399.7% recorded in FY’2024. Overall subscription rates for the 364-day paper came in at 175.0% higher than the 103.0% recorded in FY’2024 while that of the 182-day papers came in 69.1%, lower than the 104.9%, recorded in FY’2024. The average yields on the 364-day, 182-day, and 91-day papers were on a downward trajectory with the 182-day yields decreasing the most by 7.2% points to 8.6%, from 15.7% in 2024, while the 91-day and 364-day decreased by 6.9% points and 6.1% points bps to 8.3% and 10.0% in 2025, from 15.2% and 16.0% in 2024, respectively. Additionally, on y/y basis, the yields on the government papers registered significant decline in 2024 with the 182-day paper decreasing the most by 222.2 bps to close the year at 7.8% from the 10.0% recorded at the close of FY’2024, while the yields on the 364-day and 91-day decreased by 219.9 bps and 216.7 bps to close the year at 9.2% and 7.7%, from the 11.4% and 9.9%, respectively, recorded at the end of FY’2024. The year-on-year decline in yields is primarily driven by investors perceiving lower risks due to eased inflation, currency appreciation, and improved liquidity positions. As a result, there is less demand for higher returns to compensate for potential losses. The average acceptance rate during the period came in at 88.7%, higher than the 77.3% recorded in FY’2024, with the government accepting a total of Kshs 1,501.8 bn out of the Kshs 1,692.7 bn worth of bids received. Notably, the decline in the government papers yields continued in December 2025, with the yields on the 91-day paper decreasing by 2.4 bps, compared to 8.4 bps decline that was recorded in November 2025, as the government manages the borrowing costs amid budgetary pressures;
Primary T-bond auctions in 2025 were generally oversubscribed, with bonds receiving bids worth Kshs 1,691.7 bn against the offered Kshs 755.0 bn, translating to an oversubscription rate of 224.1%, higher than the oversubscription rate of 171.1% recorded in 2024. The government accepted Kshs 1,109.3 bn of the Kshs 1,691.7 bn worth of bids received, translating to an acceptance rate of 65.6%;
During the week, T-bills were oversubscribed for the first time in three weeks, with the overall subscription rate coming in at 108.0%, higher than the subscription rate of 22.5% recorded the previous week. Investors’ preference for the shorter 91-day paper persisted, with the paper receiving bids worth Kshs 6.3 bn against the offered Kshs 4.0 bn, translating to a subscription rate of 158.2%, significantly higher than the subscription rate of 60.4%, recorded the previous week. The subscription rate for the 182-day paper increased to 112.9% from the 7.1% recorded the previous week, while that of the 364-day papers increased to 83.0% from 22.8% recorded the previous week. The government accepted a total of Kshs 25.91 bn worth of bids out of Kshs 25.92 bn bids received, translating to an acceptance rate of 99.97%. The yields on the government papers showed mixed performance with the yield on the 182-day paper remaining unchanged at the 7.8% recorded the previous week, while the yield on the 91-day paper increased by 0.1 bps to remain relatively unchanged at the 7.7% recorded the previous week. The yield on the 364-day paper decreased by 0.1 bps to remain relatively unchanged at the 9.2% recorded the previous week;
Equities
During the year, the Kenyan equities market was on an upward trajectory, with NSE 20 gaining the most by 52.5%, while NASI, NSE 10 and NSE 25 gained by 48.9%, 48.0% and 47.4% respectively. The equities market performance was driven by gains recorded by large-cap stocks such as DTBK, Safaricom, NCBA, KCB, EABL, Stanbic, Equity, Co-operative, ABSA, BAT and SCBK of 71.5%, 64.8%, 64.7%, 55.1%, 49.9%, 41.5%, 39.1%, 37.2% 31.0%, 22.0% and 4.2% respectively. The performance was, however, marginally weighed down by losses by large-cap stocks such Bamburi of 1.8%;
In the banking sector, the Kenya listed banks recorded a weighted growth in the core Earnings Per Share of 7.6% in Q3’2025, compared to a weighted growth of 24.6% recorded in Q3’2024, while in the Insurance sector, the listed insurers recorded a weighted decline in core earnings per share of 6.6% in H1’2025, compared to the weighted growth of 39.6%, in H1’2024. During the year, the Nairobi Securities Exchange (NSE) welcomed two notable new listings that broadened investment options and deepened market participation, Shri Krishana Overseas Ltd (SKL) was listed on 24th July 2025 on the NSE’s Small and Medium Enterprises segment, marking the first new equity listing in five years and offering 50.5 mn shares by introduction to public investors and the Satrix MSCI World Feeder ETF was listed on 16th July 2025, becoming Kenya’s first equity based exchange traded fund on the NSE and providing local investors with accessible exposure to over 1,300 global large and mid cap companies in developed markets. The NSE also suspended Bamburi Cement, East African Cables and Trans- Century bringing the total suspended companies in the NSE to 6 including are Mumias Sugar Company, ARM Cement, and Deacons East Africa bringing the total companies trading in the NSE to 66 in 2025During the year, 8 companies issued profit warnings, as compared to 9 companies in 2024, and 15 companies in 2023 an indication that the operating environment became slightly better in 2025 compared to the previous years. Some of the companies that issued profit warnings include Centum Plc, Standard Chartered, Kenya Airways and Williamson Tea Kenya;
During the year, the Nairobi Securities Exchange (NSE) launched the NSE Banking Sector Share Index (NSE BSI) on 1st October 2025 to track the performance of all listed commercial banks in Kenya. This index provides investors with a transparent benchmark to measure the performance of banking stocks and serves as a basis for structured products and investment strategies;
During the year, Sanlam Kenya Plc executed a rights issue, raising additional capital to strengthen its balance sheet and support growth initiatives, while the East Africa Equity (EAE) 20 Share Index was launched, providing a regional benchmark that tracks 20 leading companies by liquidity and free-float, enhancing market transparency and offering investors a robust tool for portfolio management;
During the year, major consolidation and strategic divestments continued to shape the market, highlighted by Diageo Plc agreeing to sell its 65.0% stake in East African Breweries Ltd (EABL) to Japan’s Asahi Group Holdings for about USD 2.3 bn, marking one of the largest deals involving a Kenyan-listed company and aligning with Diageo’s strategy to reduce non-core assets while securing long-term brand licensing arrangements. Vodafone Kenya also announced plans to acquire an additional 15.0% stake in Safaricom Plc from the Government of Kenya for USD 1.6 bn, which would increase Vodafone’s total holding to 55.0%, with the government retaining 20.0% and the public 25.0%. This move reflects ongoing foreign investment and ownership restructuring in key Kenyan blue-chips;
Additionally, during the year, Kalahari Cement Ltd announced plans to acquire a 29.2% stake in East African Portland Cement Plc (EAPC) for Kshs 27.30 per share, positioning the deal as a strategic, long-term investment to support EAPC’s recovery, pending regulatory approvals;
Real Estate
In 2025, the general Real Estate sector continued to witness considerable growth in activity in terms of property transactions and development activities. Consequently, the sector’s activity contribution to Gross Domestic Product (GDP) grew by 5.5% to Kshs 364.6 bn in Q2’2025, from Kshs 339.2 bn recorded during the same period in 2024. In addition, the sector contributed 8.1% to the country’s GDP, to remain relatively unchanged from the 8.1% recorded in Q1’2025. Cumulatively, the Real Estate and Construction sectors contributed 15.3% to GDP, 3.8% points decrease from 19.1% in Q2’2024, attributable to decline in construction contribution to GDP by 3.7% points, to 5.0% in Q2’2025, from 8.7% recorded in Q2’2024;
The NMA residential sector recorded a marginal increase in performance, with the average total returns to investors coming in at 6.6%, a 0.8%-point increase from 5.8% recorded in FY’2024. The performance was attributed to an increase in the residential average y/y price appreciation which came in at 0.8% in FY’2025, 0.4%-points higher than the 0.4% appreciation recorded in FY’2024, driven by increased property transactions during the year. On the other hand, the average rental yield came in at 5.9% in FY’2025, recording a 0.5%-points increase from the 5.4% rental yield recorded in FY’2024. This was driven by an increase in the average rent per SQM by 9.7% to Kshs 622, from Kshs 567 recorded in FY’2024;
On the Unquoted Securities Platform, Acorn D-REIT and I-REIT traded at Kshs 27.4 and Kshs 23.2 per unit, respectively, as per the last updated data on 5th December 2025. The performance represented a 33.4% and 14.5% gain for the D-REIT and I-REIT, respectively, from the Kshs s 20.0 inception price. Additionally, ILAM Fahari I-REIT traded at Kshs 11.0 per share as of 5th December 2025, representing a 45.0% loss from the Kshs 20.0 inception price;
Investment Updates:
-
Weekly Rates: Cytonn Money Market Fund closed the week at a yield of 12.0% p.a. To invest, dial *809# or download the Cytonn App from Google Play store here or from the Appstore here;
-
We continue to offer Wealth Management Training every Tuesday, from 7:00 pm to 8:00 pm. The training aims to grow financial literacy among the general public. To register for any of our Wealth Management Trainings, click here;
-
If interested in our Private Wealth Management Training for your employees or investment group, please get in touch with us through wmt@cytonn.com;
-
Cytonn Insurance Agency acts as an intermediary for those looking to secure their assets and loved ones’ future through insurance namely; Motor, Medical, Life, Property, WIBA, Credit and Fire and Burglary insurance covers. For assistance, get in touch with us through insuranceagency@cytonn.com;
-
Cytonn Asset Managers Limited (CAML) continues to offer pension products to meet the needs of both individual clients who want to save for their retirement during their working years and Institutional clients that want to contribute on behalf of their employees to help them build their retirement pot. To more about our pension schemes, kindly get in touch with us through pensions@cytonn.com;
Hospitality Updates:
-
We currently have promotions for Staycations. Visit cysuites.com/offers for details or email us at sales@cysuites.com;
Global Economic Growth:
According to the World Bank's June 2025 Global Economic Prospects report, the global economy is projected to grow at 2.3% in 2025, lower than the 2.8% growth recorded in 2024. This forecast marks a significant downward revision from earlier projection in January of 2.7%, reflecting anticipated economic downturn, particularly due to rising international trade disputes and policy uncertainties. The World Bank’s growth projection of 2.3% is 0.9% points lower than the IMF’s October 2025 World Economic Outlook forecast of 3.2%, which was also revised from the July 2025 projection of 3.0%. In their last Global Economic Prospects Report in June 2025, the World Bank revised their global growth forecasts downward due to weakening global trade, largely driven by rising U.S. tariffs and the resulting trade tensions, which disrupted global supply chains and slowed cross-border economic activity. Notably, advanced economies are expected to record a 1.2% growth in 2025, down from the 1.7% expansion recorded in 2024. Additionally, emerging markets and developing economies are projected to expand by 3.8% in 2025, down from the 4.2% expansion recorded in 2024. On the other hand, the IMF revised their projection upwards to 3.2% from the July 2025 projection of 3.0% due to private sector agility, new trade deals, and restraint from most countries in keeping markets open. However, with U.S. tariffs still high and trade tensions unresolved, the longer‑term impact may intensify as costs shift to consumers and efficiency declines. The expected slowed down in global economic growth in 2025 as compared to 2024 is majorly attributable to;
-
Heightened trade tensions and rising U.S. tariffs - Escalating U.S. tariffs, particularly on imports from China and key trading partners have disrupted global supply chains and increased the cost of goods. This has led to the slowdown in international trade volumes and weakened export-driven growth in the emerging markets and developing economies. However, if the major economies settle their trade disputes, it could ease global economic pressures,
-
Trade policy uncertainty -The global economic landscape in 2025 is clouded by unpredictable trade policies, especially from major economies such as the United States, China and the European Union. Sudden tariff hikes, retaliatory measures and inconsistent enforcement have created a volatile environment for global trade. Developing countries, particularly those reliant on exports are facing reduced trading volumes and lower commodity prices, and,
-
Elevated Global Inflationary Pressures - Inflation remains above central bank targets and pre-pandemic averages, with some advanced economies even experiencing renewed price increases since late 2024. Disinflation over the past six months has largely reflected goods price stabilization, but services prices remain persistently high, keeping core inflation elevated. Trade restrictions have further fueled consumer inflation expectations, reinforcing upward price pressures. As a result, GDP-weighted global inflation is projected to average 2.9% in 2025, still above target levels, which dampens growth prospects.
The global economy is expected to remain subdued in 2025, mainly as a result of rising global trade tensions as well as volatile and unclear trade policies, which are expected to slow down economic growth.
Global Commodities Market Performance:
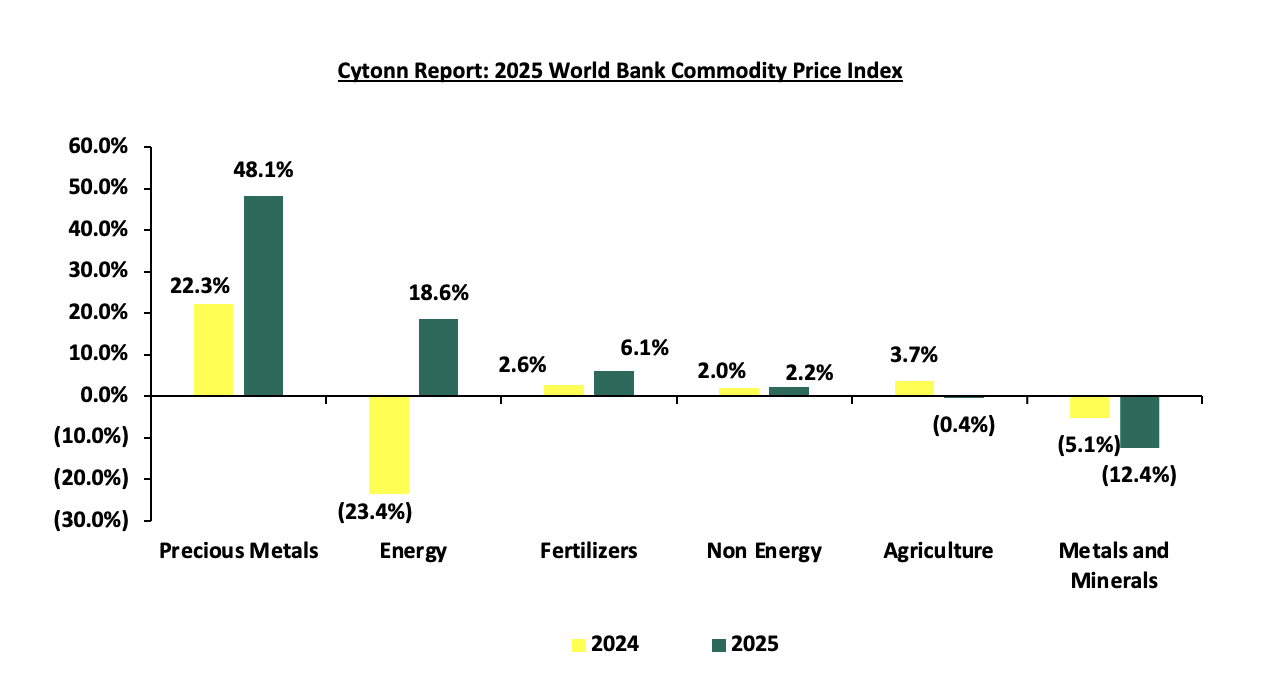
Global commodity prices registered mixed performance in 2025, with prices of precious metals increasing by 48.1%, compared to the 22.3% decrease recorded in 2024, mainly as a result of surging investment demand, fueled by geopolitical tensions, macroeconomic uncertainties, and heightened policy risks. This was reinforced by a weaker U.S. dollar, recent monetary policy easing in the U.S., and a sharp rise in global demand, up 13.0% in the first half of 2025, driven by a 117.0% surge in investment flows, particularly into gold-backed ETFs. Additionally, prices of energy increased by 18.6% compared to the 23.4% decline recorded in 2024 due to heightened trade policy uncertainty in April and were further driven up by geopolitical tensions following the June airstrikes on Iran’s nuclear facilities, which amplified concerns over supply disruptions. The prices of Fertilizers and Non-Energy increased by 6.1% and 2.2% from the 2.6% and 2.0% respectively recorded in 2024, due to increased demand, trade restrictions and production shortfalls. On the other hand, prices of metals and minerals decreased by 12.4% in 2025, compared to the 5.1% decline recorded in 2024, mainly due to strong global metal demand and increased investment in renewable energy and supporting infrastructure projects. Additionally, Agriculture prices declined by 0.4% compared to the 3.7% increase recorded in 2024, attributable to a decline in beverage and raw material prices. The chart below shows a summary of the performance of various commodities.
Source: World Bank
Global Equities Market Performance:
The global stock market was on an upward trajectory in 2025, with most indices in the developed countries recording gains during the period, largely attributable to increased investor sentiments as a result of continued economic recovery following strong corporate earnings, multiple Federal Reserve interest rate cuts, and the easing of severe trade tensions. Notably, GGSECI was the best performer during the period, recording a gain of 149.7% in 2025 largely driven rebounded investor confidence, supported by Ghana’s strengthening macroeconomic fundamentals, appreciation of the Cedi, and lower interest rates;

*The index values are dollarized for ease of comparison
According to the World Bank, the Sub-Saharan economy is projected to grow at a moderate rate of 3.7% in 2025, which is 0.2% points higher than the 3.5% growth recorded in 2024, but a downward revision from the January 2025 projection of 4.1%. The downward revision is mainly due to the rising trade barriers coupled with the weakened global investor confidence. The expected recovery from 2024 is primarily driven by global economic stability, and easing of monetary policy rates in the region, which is expected to boost private consumption and investment. However, most countries face the risk of increased inflation due to increased food prices resulting from drought, prompting them to increase or hold off on further easing of the rates. Additionally, due to their relatively low trade exposure to the United States, Sub-Saharan African countries are well-positioned to weather the impact of higher US tariffs. Nevertheless, the risk of debt distress remains high with the region’s public debt to GDP ratio expected to remain high at 58.0% in 2025, with more than half of countries facing unsustainable debt burdens. Public debt is expected to remain high due to increased debt servicing costs as a result of high interest rates in developed economies and a reduction in donor support. The growth in the region’s economic growth is attributable to;
-
Easing of Monetary Policy Rates - Most Sub-Saharan African countries including Kenya, South Africa and Ghana gradually eased the monetary policy interest rates supported by declining inflation across the region. The reduction in borrowing costs enhanced household purchasing power, while simultaneously stimulating private sector activity, driving business investment, and reinforcing overall economic momentum,
-
Declining Inflation - Consumer price inflation has steadily declined across much of Sub-Saharan Africa, with the number of countries achieving single-digit inflation rising from 27 in 2022 to 37 in 2025. Nearly 60.0% of the region experienced a slowdown in inflation in 2025 compared to the previous year, supported by favorable commodity prices and more stable exchange rates, which together have created a more predictable and growth-friendly macroeconomic environment and,
-
Narrowed Primary Deficits - Primary fiscal balances strengthened during the year due to ongoing consolidation measures, supporting greater stability in public finances despite existing interest rate obligations,
Currency Performance
In 2025, most of the select Sub-Saharan currencies appreciated against the US Dollar, mainly attributable to primarily due to the respective central bank efforts, increased foreign currency inflows and debt-restructuring and policy reforms which have improved forex reserves. Foreign currency inflows supported currency appreciation by boosting foreign exchange reserves, increasing dollar supply, and strengthening market confidence in the domestic currency’s stability. The table below shows the performance of select African currencies against the USD;
|
Cytonn Report: Select Sub-Saharan Africa Currency Performance vs USD |
|||||
|
Currency |
Dec-23 |
Dec-24 |
Dec-25 |
2024 y/y change (%) |
2025 y/y change (%) |
|
Ghanaian Cedi |
11.9 |
14.7 |
10.9 |
(23.7%) |
25.7% |
|
Zambian Kwacha |
25.7 |
27.8 |
22.2 |
(8.4%) |
20.1% |
|
South African Rand |
18.3 |
18.7 |
16.6 |
(2.3%) |
11.3% |
|
Botswana Pula |
13.4 |
13.9 |
13.0 |
(3.9%) |
6.4% |
|
Nigerian Naira |
899.4 |
1,535.3 |
1,456.9 |
(70.7%) |
5.1% |
|
Mauritius Rupee |
44.5 |
47.5 |
46.1 |
(6.7%) |
2.9% |
|
Ugandan Shilling |
3,815.0 |
3,670.3 |
3,619.7 |
3.8% |
1.4% |
|
Malawian kwacha |
1,683.4 |
1,734.0 |
1,716.0 |
(3.0%) |
1.0% |
|
Kenyan Shilling |
156.5 |
129.3 |
129.0 |
17.4% |
0.2% |
|
Tanzanian Shilling |
2,540.0 |
2,394.8 |
2,447.5 |
5.7% |
(2.2%) |
Key take outs from the table include:
-
The Ghanaian Cedi appreciated the most by 25.7% in 2025 to close at GHS 10.9 against the US Dollar, compared to GHS 14.7 recorded in 2024, driven rising global gold prices and the weakness of the U.S. dollar. The central bank’s increased bullion purchases, the establishment of GoldBod to formalize small-scale gold output, and stronger reserves boosted confidence in the currency, while fiscal discipline following debt restructuring reduced dollar demand,
-
The Tanzanian shilling was the worst performer during the year, depreciating by 2.2% against the dollar to close the year at TSh 2,447.5 from TSh 2,394.8 in 2024, attributable to the sustained import demand and foreign currency shortages which exerted downward pressure on its value, and,
-
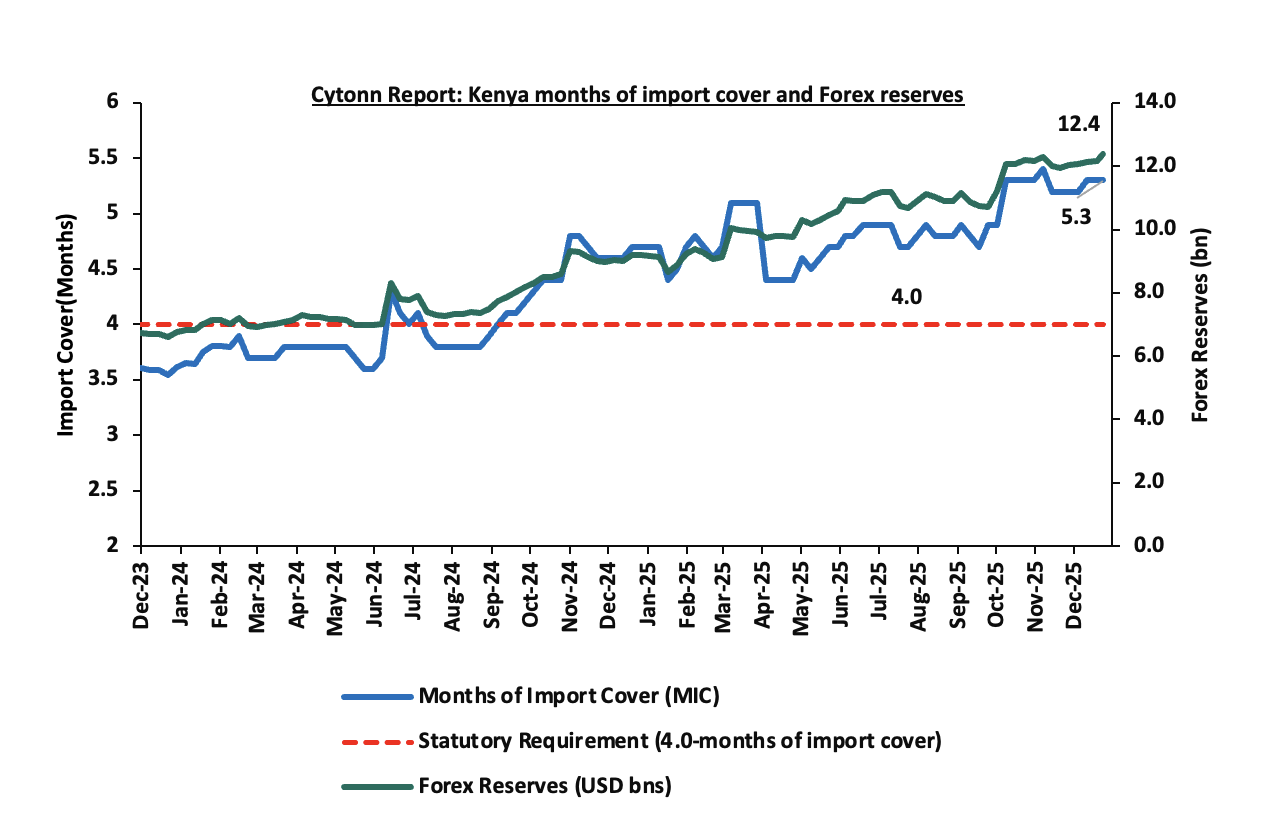
Notably, the Kenyan Shilling appreciated by 0.2% against the dollar, closing the year at Kshs 129.0 compared from Kshs 129.3 in 2024, attributable to stronger forex inflows from diaspora remittances and tourism coupled with improved foreign reserves which amounted to USD 12.4 bn as of December 2025.
African Eurobonds:
Africa’s appetite for foreign-denominated debt has increased in recent times with the issuers in 2025 being being Ivory Coast and Benin raising a total of USD 1.8 bn and USD 0.5 bn respectively in March 2025 and January 2025 respectively. In February 2025, Kenya issued a new USD 1.5 bn 11-year Eurobond with a coupon rate of 9.5% to facilitate the buyback of 7-year tenor USD 900.0 mn Eurobond notes issued in 2019, with that was set to mature in May 2027. Additionally, in October 2025, Kenya issued a USD 1.5 bn Eurobond in two parts, that is, a 7-year loan at an interest rate of 7.9% and a 12-year loan at 8.8%. The proceeds were used primarily to repurchase Kenya’s outstanding USD 1.0 bn 7.25% 2028 notes, with the remaining funds being allocated toward budgetary support and external debt refinancing. In October, Angola issued a dual-tranche Eurobond comprising a USD 1.0 billion 5‑year note with a 9.25% coupon and a USD 750 million 10‑year note carrying a 9.78% coupon. Notably, all the bonds were oversubscribed with the high support being driven by the yield hungry investors and also the outlook of positive recovery in the regional economies.
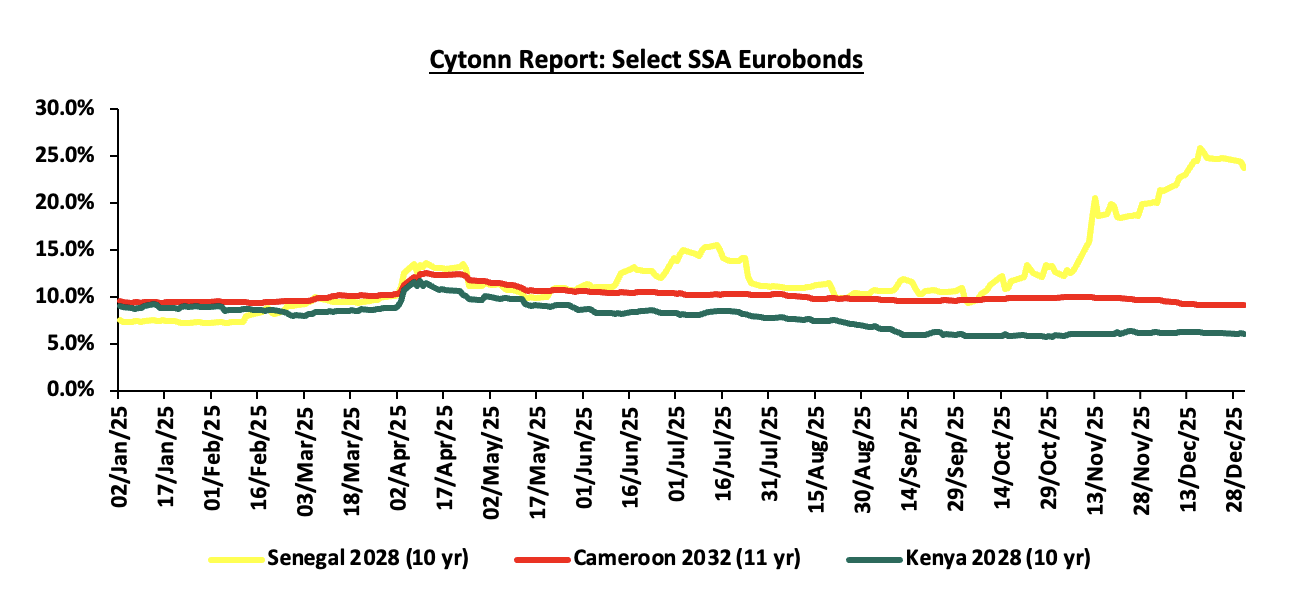
The Yields of the Kenya’s 10-year Eurobond maturing in 2028 decreased by 3.0% points to 6.0% as at the end of December 2025 from 9.1% in at the beginning of the year. Similarly, the yields for Cameroon’s 11-year maturing in 2032 decreased by 0.4% points to 9.2% from 9.6% recorded at the beginning of the year. On the other hand, the yields for Senegal’s 10-year Eurobond increased by 16.3% points to 23.8% from 7.5% recorded at the beginning of the year. Senegal’s Eurobond yields spiked in 2025 after an audit revealed USD 11.0 bn in hidden debt, significantly increasing the country’s debt-to-GDP ratio and heightening fears of default. The fiscal instability, revenue shortfalls, and subsequent sovereign credit rating downgrades by S&P and Moody’s to B- from B with a negative outlook led investors to demand higher yields to compensate for the elevated risk. Below is a graph showing the Eurobond secondary market performance of select Eurobonds issued by the respective countries.
Equities Market Performance:
Sub-Saharan Africa (SSA) stock markets recorded mixed performance in 2025, with the Ghana Stock Exchange Composite Index (GGSECI) being best performing market gaining by 149.7% in 2025 largely driven by gains in the large-cap stocks in the banking and telecommunication sectors following improved earnings during the period, supported by appreciation of the Ghana Cedi and easing inflation. Notably, Rwanda All Share Index declined by 5.4% in 2025, due to the depreciation of the Rwandan Franc against the dollar having depreciated by 5.1% in 2025 which has resulted to reduced foreign exchange reserves which affected market stability coupled with the liquidity constraints in the market. Below is a summary of the performance of the key SSA indices:
|
Cytonn Report: Equities Market Performance |
||||||
|
Country |
Index |
Dec-23 |
Dec-24 |
Dec-25 |
2024 YTD change (%) |
2025 YTD change (%) |
|
Ghana |
GSECI |
254.5 |
330.7 |
804.6 |
26.9% |
149.7% |
|
Zambia |
LASILZ |
420.6 |
577.1 |
1,168.2 |
26.7% |
101.8% |
|
Nigeria |
NGEASI |
84.9 |
67.1 |
106.8 |
(20.9%) |
59.2% |
|
South Africa |
JALSH |
4137.9 |
4494.3 |
6,978.7 |
8.9% |
55.0% |
|
Kenya |
NASI |
0.6 |
1.0 |
1.4 |
61.8% |
49.2% |
|
Uganda |
USEASI |
0.2 |
0.3 |
0.5 |
42.2% |
42.3% |
|
Tanzania |
DARSDEI |
0.7 |
0.9 |
1.1 |
22.4% |
32.0% |
|
Rwanda |
RSEASI |
0.1 |
0.1 |
0.1 |
(6.3%) |
(5.4%) |
|
*The index values are dollarized for ease of comparison |
||||||
The tough macroeconomic environment experienced globally is expected to continue weighing down Sub-Saharan Africa’s growth prospects in 2025. As such, the region’s GDP growth rate, though projected at a moderate 3.7%, remains subdued relative to its potential, in line with the broader slowdown in the global economy. Elevated inflationary pressures, persistent debt sustainability concerns, and fiscal vulnerabilities are expected to remain key challenges, further compounded by volatile commodity prices and heightened trade policy uncertainty. Additionally, while select currencies such as the Ghanaian Cedi and Zambian Kwacha registered strong appreciations in 2025, others such as the Tanzanian Shilling weakened, underscoring the uneven resilience of regional economies. The continued reliance on external borrowing, coupled with rising debt servicing costs, is expected to increase perceived risks in the region, thereby dampening investor confidence. Nevertheless, easing monetary policy rates, declining inflation in several economies, and improved foreign exchange reserves provide cautious optimism that targeted reforms and prudent fiscal management could gradually restore stability and support sustainable growth in the medium term.
Economic Growth:
According to the Kenya National Bureau of Statistics (KNBS) Q2’2025 Quarterly Gross Domestic Product Report, the Kenyan economy recorded a 5.0% growth in Q2’20250.4% points higher from the 4.6% growth rate recorded in Q2’2024. The main contributor to Kenyan GDP remains the Agriculture, Fishing and Forestry sector which grew by 4.4% in Q2’2025, lower than the 4.5% expansion recorded in Q2’2024. All sectors in Q2’2025 recorded positive growths, with varying magnitudes across activities. Most sectors recorded contraction in growth rates compared to Q2’2024 with Accommodation & Food Services, Financial Services Indirectly Measured and Other services recording growth rate declines of 27.2%, 8.9% and 3.4% points to 7.8%, 1.4% and 1.4% from 35.0%, 10.3% and 4.8% respectively. Other sectors recorded an expansion in growth rates, from what was recorded in Q2’2024, with Mining and Quarrying, Construction and Electricity and Water Supply recording the highest growths in rates of 20.8%, 9.4% and 4.5% points, to 15.3%, 5.7% and 5.7% from (5.5%), (3.7%) and 1.2% respectively. Notably, the overall economic performance highlighted modest growth despite a slowdown in several key sectors, reflecting the mixed performance across industries amid a challenging operating environment. The Kenyan Economy is projected to grow at an average of 5.0% in 2025 according to various organizations as shown below:
|
Cytonn Report: Kenya 2025 Growth Projections |
||
|
No. |
Organization |
2025 GDP Projections |
|
1 |
International Monetary Fund |
4.8% |
|
2 |
National Treasury |
5.3% |
|
3 |
World Bank |
4.5% |
|
4 |
Fitch Solutions |
5.1% |
|
5 |
Cytonn Investments Management PLC |
5.4% |
|
Average |
5.0% |
|
Source: Cytonn Research
In 2025, the Kenyan economy is projected to grow at an average of 5.0%, up from 4.7% in 2024. The faster expected growth is supported by easing monetary policy, accommodative financial conditions, and a rebound in key sectors, particularly agriculture which has benefited from favorable weather conditions after previous droughts. The economic environment has been bolstered by several positive macroeconomic indicators, including inflation within the Central Bank's target range, a stable exchange rate, and foreign exchange reserves at record highs. The services sector, including tourism and financial services, is also expected to contribute positively to growth. Additionally, improved business sentiment and gradually recovering consumer demand are supporting economic expansion. However, growth remains constrained by fiscal consolidation efforts as the government works to address budget deficits and manage elevated public debt levels, alongside higher taxation measures that have weighed on disposable incomes, private consumption, and overall business activity.
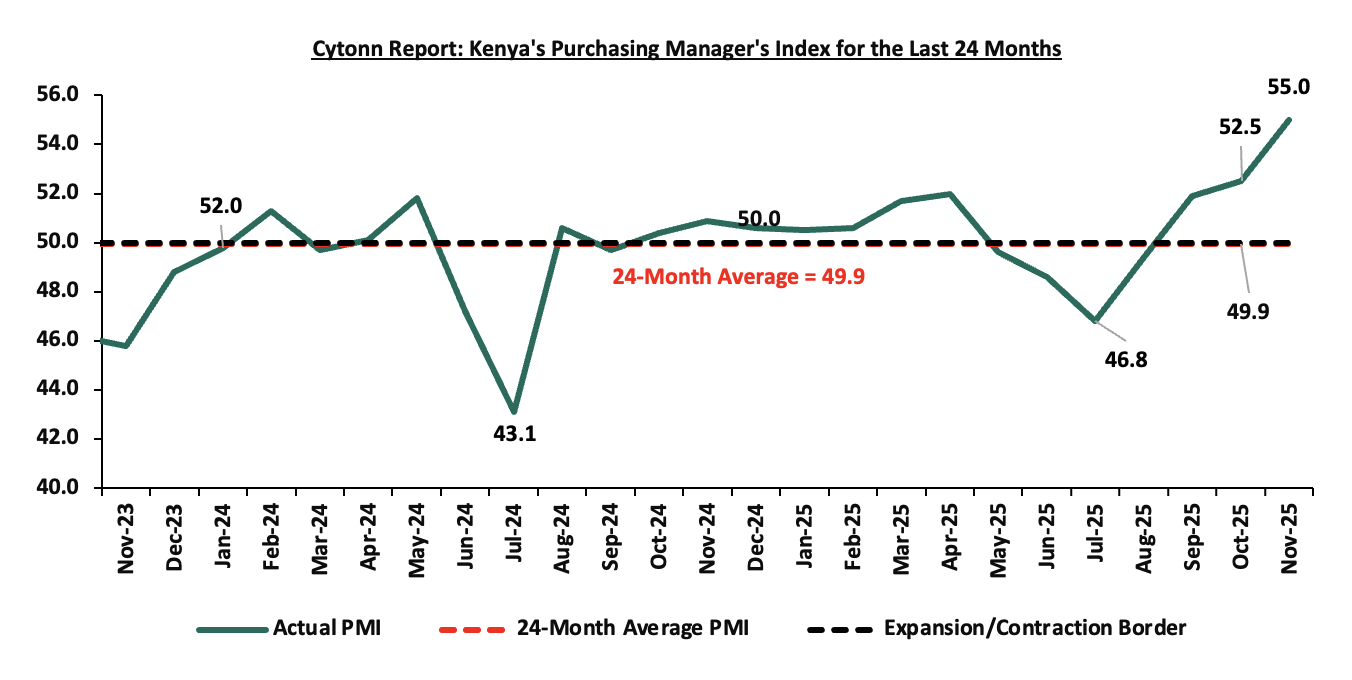
Business conditions in the Kenyan private sector recorded an improvement during the year, with the average Stanbic Bank Monthly Purchasing Managers’ Index (PMI) for the first eleven months averaging at 50.8, 1.3 points higher than the average of 49.5 recorded during a similar period in 2024. Similarly, PMI for the month of November 2025 came in at 55.0, up from 52.5 in October 2025 signaling an uptick of the business environment and for the third consecutive month. The improvement was largely driven by a faster pace of growth in output and new orders, as firms benefited from robust demand, promotional pricing and new product launches. Input prices rose marginally, with inflation rate decreasing marginally by 0.1% points to 4.5% in November 2025 from 4.6% as of October 2025 and improved supply chain efficiency, while output charges increased modestly as firms sought to maintain competitiveness and support sales. The chart below shows the trend of Kenya’s Purchasing Managers index for the last 24 months:
Source: Stanbic PMI
Kenyan Shilling:
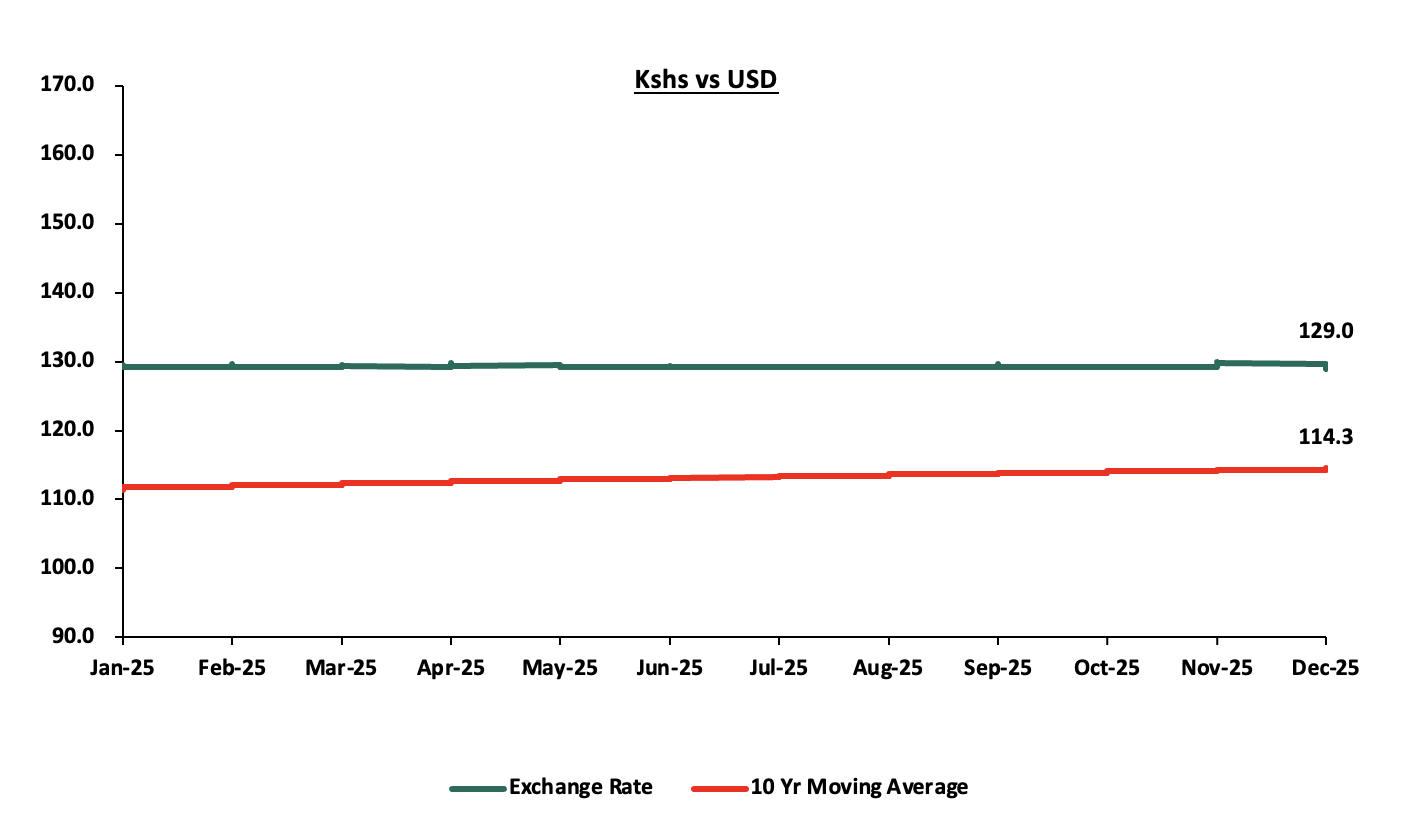
The Kenya Shilling appreciated by 0.2% against the US Dollar to close the year at Kshs 129.0 in 2025, compared to Kshs 129.3 at the end of 2024, a significant moderation from the 17.4% appreciation recorded in 2024. The chart below highlights the performance of the Kenyan Shilling against the US Dollar in 2025:
Source: Central Bank of Kenya
The appreciation of the Kenyan shilling in 2025 was driven by;
-
Diaspora remittances standing at a cumulative USD 5,046.6 mn in the twelve months to November 2025, 3.6% higher than the USD 4,872.2 mn recorded over the same period in 2024. This has continued to cushion the shilling against further depreciation. In the November 2025 diaspora remittances figures, North America remained the largest source of remittances to Kenya accounting for 60.6% in the period,
-
Tourism inflow receipts which are projected by the Ministry of Tourism to reach Ksh 560.0 bn in 2025, up from Ksh 452.2 bn in 2024, representing a 23.9% increase. Furthermore, according to the Kenya National Bureau of Statistics’ Leading Economic Indicators report for September 2025, arrivals through Jomo Kenyatta International Airport (JKIA) and Moi International Airport (MIA) rose by 52.2% to 745,720 visitors in Q3’2025, up from 489,831 visitors in Q3’2024, and,
-
Improved forex reserves currently at USD 12.4 bn (equivalent to 5.3-months of import cover), which is above the statutory requirement of maintaining at least 4.0-months of import cover and above the EAC region’s convergence criteria of 4.5-months of import cover. The following is a graph showing Kenya months of import cover and forex reserves for the last two years;
Source: Central Bank of Kenya
The shilling was however weighed down by:
-
An ever-present current account deficit which came at 2.9% of GDP in Q2’2025 from 1.7% recorded in a similar period last year. Key to note, the current account deficit widened by 76.6% to Kshs 83.7 bn from Kshs 47.4 bn in Q2’2024. The y/y widening of the current account was brought about by the widening of the merchandise trade account deficit (the value of import goods exceeds the value of export goods, resulting in a negative net foreign investment) by 11.7% to Kshs 348.4 bn in Q2’2025, from Kshs 311.8 bn recorded in Q2’2024 coupled with a 7.5% decline in the services trade balance to a surplus of Kshs 65.5 bn from a surplus of Kshs 70.8 bn in Q2’2024, and,
-
The need for government debt servicing, continues to put pressure on forex reserves given that 59.7% of Kenya’s external debt is US Dollar-denominated as of June 2025.
The Kenyan shilling gained by 0.2% in 2025 to close the year at Kshs 129.0. We expected the shilling to remain within a range of Kshs 134.4 and Kshs 140.5 against the USD by the end of 2025 with a bias towards a 4.6% depreciation by the end of the year. The currency has averaged Kshs 129.3 in 2025, supported in part by the Central Bank of Kenya’s crawling-peg–like approach, which has allowed for gradual and controlled exchange rate adjustments in response to inflation dynamics and external sector conditions. Read on our outlook on Performance of Kenya Currency. Looking ahead, we expect the currency to continue to remain steady in the short term with CBK's interventions and favorable foreign exchange inflows likely to play a crucial role in mitigating excessive volatility.
Inflation:
The inflation rate for the year 2025 averaged at 4.1%, compared to 4.5% recorded in 2024. Notably, the y/y inflation in December 2025 remained unchanged from the 4.5% recorded in November 2025. The headline inflation in December 2025 was majorly driven by increases in prices of commodities in the following categories; Food & Non-Alcoholic Beverages, Transport sector and Housing, Water, Electricity, Gas & other fuels by 7.8%, 5.2% and 1.6% respectively. Below is a chart showing the inflation trend for the last five years:
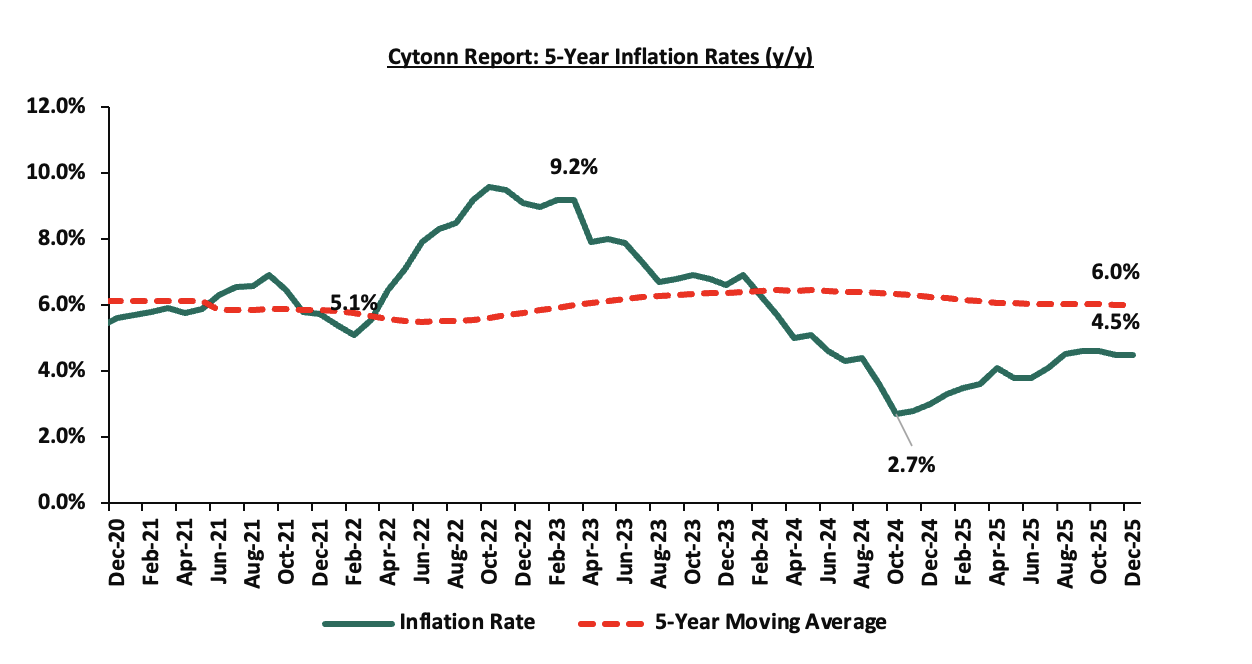
For the last 30 months, Kenya’s inflation has persistently remained within the Central Bank of Kenya (CBK) target range of 2.5% - 7.5%, owing to a stronger Shilling and stable fuel. With the continued easing of monetary policy following the MPC’s observation that its earlier measures had stabilized the Shilling and anchored inflation, the focus has now shifted to lowering borrowing costs, supporting the private sector, and promoting economic growth. As a result, we expect this to exert upward pressure on inflation. The Monetary Policy Committee (MPC) has lowered the Central Bank Rate (CBR) by cumulative of 225.0 bps to 9.00% in December 2025 from 11.25% in December 2024. Going forward, we still expect the inflationary pressures to remain within the CBK’s preferred target range of 2.5% - 7.5%.
December 2025 Inflation
The year-on-year inflation in December 2025 remained unchanged from the 4.5% recorded in November 2025. This was in line with our projection to a range of 4.3% to 4.5%, where our projection was mainly driven by the appreciation of the Kenya Shilling against the USD coupled with the stability of fuel prices. The price increase was primarily driven by a rise in prices of items in the Food and Non-Alcoholic Beverages (7.8 %), Transport (5.2 %), and Housing, Water, Electricity, Gas and other fuels (1.6%) over the one-year period. The month-on-month inflation rate stood at 0.6% in December 2025. The table below summarizes the performance of commodity indices both on a year-on-year and month-on-month basis:
|
Cytonn Report: Major Inflation Changes – December 2025 |
|||
|
Broad Commodity Group |
Price change m/m (December-2025/ November -2025) |
Price change y/y December-2025/December-2024) |
Reason |
|
Food and non- alcoholic beverages |
0.8% |
7.8% |
The m/m increase was mainly driven by the rise in prices of maize flour loose, kale/sukuma wiki, and potatoes by 5.1%, 4.7% and 2.9% respectively. However, the increase was weighed down by a decline in prices of mangoes, sugar and cooking oil of 1.6%, 1.5% and 0.7% respectively |
|
Transport |
1.9% |
5.2% |
The m/m increase was driven by the 5.3% increase in country bus and matatu fares for travel between towns coupled with the 14.4% increase in the prices of international flights due to effect of festive seasons. |
|
Housing, water, electricity, gas and other fuels |
(0.1%) |
1.6% |
The m/m decline was mainly due to a fall in electricity prices, with 50 kWh and 200 kWh decreasing by 2.8% and 2.6% respectively. However, the decline was partially offset by a 0.4% increase in the price of gas/LPG. |
|
Overall Inflation |
0.6% |
4.5% |
The m/m increase was mainly attributable to the 1.9% increase in transport |
In December 2025, overall inflation remained unchanged at 4.5% recorded in November 2025 on a y/y basis, signaling continued moderation in price pressures across major categories. Additionally, the inflation rate remained within the Central Bank of Kenya’s preferred range of 2.5%–7.5% for the thirtieth consecutive month, reflecting sustained macroeconomic stability. The increase was mainly driven by a 7.8% y/y rise in food and non-alcoholic beverage prices, a 5.2% increase in transport costs, and a 1.6% rise in housing, water, electricity, gas and other fuels. On a month-to-month basis, inflation remained modest at 0.6%, indicating relative price stability. Prices for Super Petrol and Diesel remained unchanged at Kshs 184.5 and Kshs 171.5 per litre respectively. Electricity costs eased during the month, with 50 kWh and 200 kWh declining by 2.8% and 2.6%, respectively. Meanwhile, the Kenya Shilling appreciated by 0.6% m/m against the US Dollar, to Kshs 129.0 from Kshs 129.8 recorded at the end of November and a 0.2% year-to-date appreciation to Kshs 129.0 as of 31st December 2025, from the Kshs 129.3 recorded at the beginning of the year.
Going forward, we expect inflation to remain within the CBK’s preferred range of 2.5%-7.5%, mainly on the back of a stable currency and stable fuel prices. Additionally, favorable weather conditions will also contribute to stabilizing food prices, further supporting stable inflation rates. The risk, however, lies in the fuel prices which despite their stability still remain elevated compared to historical levels. Additionally, the Monetary Policy Committee cut the Central Bank Rate by 25.0 bps to 9.0% from 9.25% in its December 2025 meeting, with the aim of easing the monetary policy, while maintaining exchange rate stability, and will meet again in February 2026. This cut in the Central Bank Rate is likely to elevate inflationary pressures gradually as consumer spending rises from increased money supply. The committee is expected to adopt a more cautious approach to rate adjustments in the coming meetings in a bid to continue supporting the private sector, while also keeping an eye on the effect on the inflation and exchange rate.
Monetary Policy:
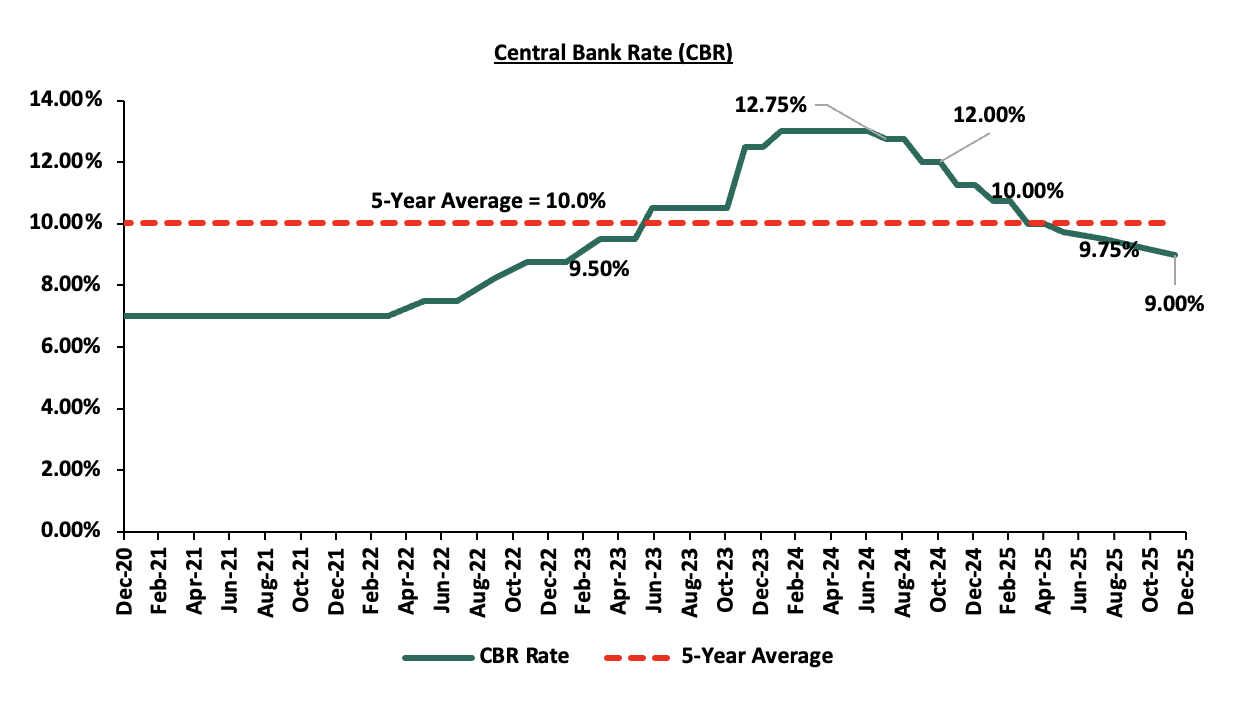
During the year, the Monetary Policy Committee (MPC) met six times and progressively eased monetary policy, lowering the Central Bank Rate (CBR) by a total of 225.0 bps, to 9.00% in December 2025 to 11.25% in December 2025. The reductions were aimed at stabilizing the exchange rate and anchoring inflation expectations, supported by a strengthened and stable currency and inflation remaining within the Central Bank of Kenya’s (CBK) target range of 2.5%–7.5%. In its latest meeting held in December 2025, the MPC lowered the CBR by another 25.0 basis points to 9.00%, in line with our expectations, on the back of accommodative policy trends in major economies, anchored inflationary pressures, and the need to support economic growth through lower financing costs. Overall, the MPC cut the CBR by a cumulative 175 bps from 10.75% in February 2025 to 9.00% in December 2025. We expect the MPC to continue lowering the rates in the short to medium term therefore lowering borrowing costs, leading to increased spending and an uptick in the business environment as well as reduced debt servicing costs for the government, and anchoring private sector credit growth, noting that its previous measures have successfully reduced overall inflation to below the mid-point of the target range of 2.5% - 7.5%, stabilized the exchange rate, and anchored inflationary expectations. The following is a graph highlighting the Central Bank Rate for the last 5 years.
Source: Central Bank of Kenya
2025 Key Highlights:
-
FY’2025/2026 National Budget
On 12th June 2025, the National Treasury presented Kenya’s FY’2025/2026 National Budget to the National Assembly highlighting that the total budget estimates for FY’2025/26 increased by 7.1% to Kshs 4.3 tn from the Kshs 4.0 tn in FY’2024/2025 while the total revenue inclusive of grants increased by 8.0% to Kshs 3.4 tn from the Kshs 3.1 tn in FY’2024/2025. The increase is mainly due to an 6.7% increase in ordinary revenue to Kshs 2.8 tn for FY’2025/2026, from the Kshs 2.6 tn in FY’2024/25. For more information, please read our Budget Review Note.
-
Credit Facilities Extended to Kenya
-
In 2025, Kenya recorded no disbursements from the International Monetary Fund, marking a sharp break from the post-Covid period when IMF support flowed consistently. The Fund terminated Kenya’s 2021 Extended Fund Facility (EFF) and Extended Credit Facility (ECF) programme in March 2025 after the country failed to meet key performance benchmarks, resulting in the loss of Kshs 109.7 bn in expected financing. By the time of termination, Kenya had received USD 2.8 bn of the total USD 3.6 bn expected under the programme. Kenya missed 11 out of 16 programme conditions, including restructuring Kenya Airways, enforcing fiscal consolidation, strengthening revenue mobilisation, and safeguarding the fuel stabilisation fund. Discussions are ongoing for a new IMF programme, with talks expected to resume in early 2026, though disagreements persist around exchange rate management and the classification of securitised debt, issues that may delay fresh funding.
-
Similarly, the World Bank did not disburse any funds to Kenya in 2025, having frozen Kshs 96.7 bn under its Development Policy Operations (DPO) programme due to stalled reforms. While Kenya enacted a Conflict-of-Interest law, the Bank maintains that 11 prior actions, including amendments to the Competition Act, implementation of the Treasury Single Account, e-procurement reforms, and sector-specific regulatory frameworks, remain outstanding. The National Treasury has prioritised unlocking the DPO facility, citing its relatively flexible structure and budgetary support role, with efforts underway to fast-track approval and disbursement. However, as at end-2025, World Bank financing remained on hold, underscoring continued reform slippage and execution risks.
-
-
FY’2024/2025 KRA Revenue Performance
In July 2025, the Kenya Revenue Authority (KRA) released the annual revenue performance for FY’2024/25, highlighting that revenue mobilization for the period grew by a notable 6.8% down from 11.1% growth in the previous financial year, after KRA collected Kshs 2.6 tn compared to Kshs 2.4 tn in the previous financial year. This translates to a performance rate of 100.6% against the target of Kshs 2.6 tn; Please see our Cytonn Monthly – July 2025,
Kenya National Bureau of Statistics released the Q2’2025 Balance of Payment Report, noting that Kenya’s balance of payments position deteriorated significantly by 86.6% in Q2’2025, to a deficit of Kshs 157.0 bn, from a deficit of Kshs 84.1 bn in Q2’2024. The y/y negative performance in BoP was mainly driven by a significant 282.8% increase in financial account deficit to Kshs 136.5 bn from a deficit of Kshs 35.7 bn in Q2’2024. Please see our Cytonn Weekly 43/2025,
-
Current account
Kenya’s current account deficit widened by 76.6% to Kshs 83.7 bn in Q2’2025 from the Kshs 47.4 bn deficit recorded in Q2’2024. The y/y expansion registered was driven by the widening of the merchandise trade account deficit (the value of import goods exceeds the value of export goods, resulting in a negative net foreign investment) by 11.7% to Kshs 348.4 bn in Q2’2025, from Kshs 311.8 bn recorded in Q2’2024, a 59.1% improvement in the secondary trade balance to a surplus of Kshs 43.6 bn from a surplus of Kshs 27.4 bn in Q2’2023, and, the narrowing of the primary income deficit (the earnings that residents of a country receive from their investments abroad and the compensation they receive for providing labour to foreign entities) by 3.1% to Kshs 43.8 bn in Q2’2024, from Kshs 45.2 bn recorded in Q2’2024.
-
Credit Ratings
-
On January 24th 2025, the global ratings agency, Moody’s announced its revision of Kenya’s credit outlook to positive from negative, while maintaining the credit rating at Caa1, on the back of a likelihood of an ease in liquidity risks and improved debt affordability. The improved debt affordability is largely attributable to the reduction in domestic borrowing costs, evident in the sharp decline of yields for short-dated papers. Given the low inflation rates in the country, the stability of the exchange rate, and the ease in the monetary policy stance, domestic borrowing costs are expected to continue decreasing over the short-medium term. Please see our Cytonn Weekly 04/2025.
-
On 25th July 2025, the global ratings agency, Fitch Ratings affirmed Kenya’s Long-Term Foreign-Currency Issuer Default Rating (IDR) at B-, while maintaining the Stable outlook. The affirmation reflects Fitch’s view that Kenya’s medium-term economic growth prospects remain robust, supported by a relatively diversified economy, sustained multilateral and bilateral creditor support, and moderate progress on fiscal consolidation. Please see our Cytonn Monthly- July, and,
-
On 22nd August 2025, S&P Global Ratings raised Kenya’s long-term sovereign credit rating to ‘B’ from ‘B-’, with a stable outlook, while affirming the short-term sovereign credit rating at ‘B’. At the same time, the agency revised Kenya’s transfer and convertibility assessment upward to ‘B+’ from ‘B’, reflecting the country’s improved external liquidity buffers and relatively resilient economic fundamentals compared to peers. This development marks a notable turnaround in Kenya’s sovereign risk profile, coming only a year after the same agency downgraded the country in August 2024 in the wake of fiscal setbacks following the repeal of the Finance Bill 2024. For more information, see our, Cytonn H1'2025 Markets Review. Below is a summary of the credit rating on Kenya by various rating agencies;
|
Cytonn Report: Kenya’s Credit Ratings |
||||||
|
Rating Agency |
Previous Rating |
Previous Outlook |
Current Rating |
Current Outlook |
Meaning |
Date Released |
|
Moody's Rating |
Caa1 |
Negative |
Caa1 |
Positive |
Substantial credit risks |
24th January, 2025 |
|
Fitch Ratings |
B- |
Stable |
B- |
Stable |
Highly Speculative |
25th July 2025 |
|
S&P Global |
B- |
Stable |
B |
Stable |
Extremely high risk, very vulnerable to default |
22rd August 2025 |
Source: Fitch Ratings, S&P Global, Moody’s
2025 Returns by Various Asset Classes:
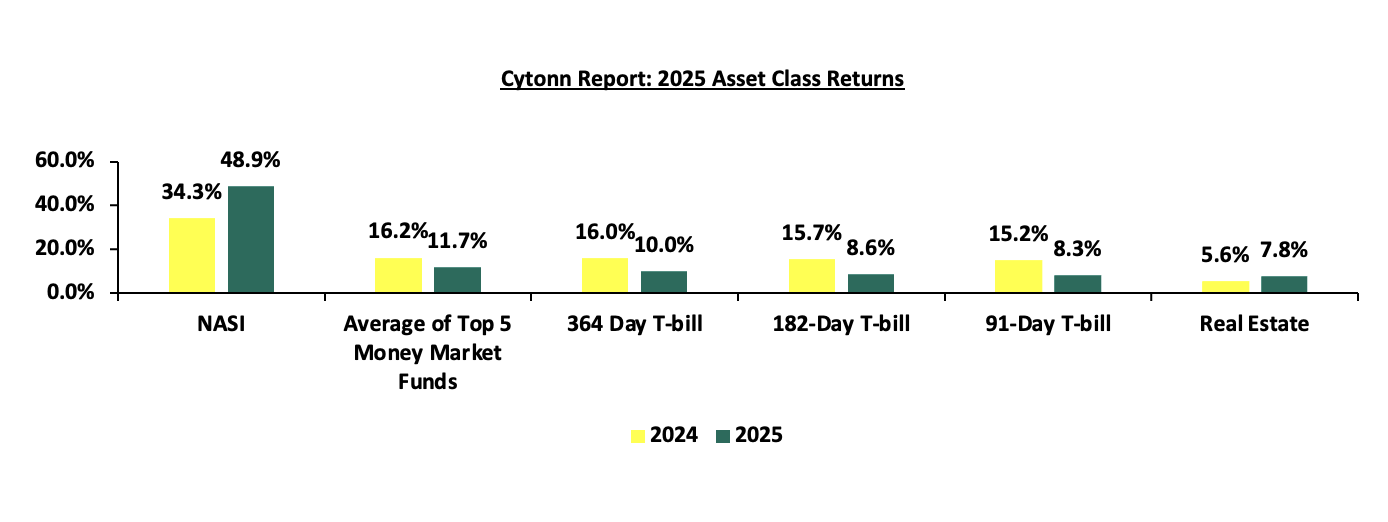
The returns by the various asset classes recorded mixed performances in 2025, in comparison to a similar period last year, with the NASI and real estate, being on upward trajectories. For the equities class, NASI registered a 48.9% gain in 2025, an improvement from the 34.3% gain recorded in 2024, as the average of top 5 MMFs recorded a yield of 11.7%, 4.5% points lower than the 16.2% average recorded in 2024. Additionally, the 364-day, 182-day and 91-day Government papers recorded average yields of 10.0%, 8.6% and 8.3%, respectively, lower than the average yields of 16.0%, 15.7% and 15.2%, respectively recorded in 2024, while the average Real Estate yield increased by 2.2% points to 7.8% in 2025, from 5.6% recorded in 2024. The graph below shows the summary of returns by various asset classes (Average top 5 MMF, Fixed Income, Real Estate and Equities).
The table below shows the macro-economic indicators that we track, indicating our expectations for each variable at the beginning of 2025 versus the experience;
|
Cytonn Report: Macro-Economic & Business Environment Outlook |
||||
|
Macro-Economic Indicators |
2025 Outlook |
Effect |
2025 Experience |
Effect |
|
Government Borrowing |
|
Negative |
|
Negative |
|
Exchange Rate |
|
Neutral |
|
Positive |
|
Interest Rates |
|
Positive |
|
Positive |
|
Inflation |
|
Neutral |
|
Positive |
|
GDP |
|
Neutral |
|
Neutral |
|
Investor Sentiment |
|
Positive |
|
Positive |
|
Security |
|
Negative |
|
Negative |
Since the beginning of the year, notable improvements were observed in two of the seven key macroeconomic metrics tracked, namely the exchange rate and inflation. At the start of the year, interest rates and investor sentiment were assessed as positive, exchange rate, inflation, and GDP (economic growth) were assessed as neutral, while government borrowing and security were assessed as negative. By the end of the year, interest rates, investor sentiment, exchange rate, and inflation were assessed as positive, GDP (economic growth) remained neutral, and government borrowing and security remained negative, indicating that overall macroeconomic performance improved relative to initial expectations. Notably, government borrowing remained negative, reflecting continued fiscal pressures, while economic growth remained neutral, broadly in line with expectations. Interest rates and investor sentiment remained positive throughout the year, supported by easing monetary policy and sustained market confidence, while security conditions remained negative, weighed down by persistent political tensions. In conclusion, macroeconomic fundamentals exhibited mixed but improving performance during the year, with most metrics trending positively. This was underpinned by the Kenyan shilling’s modest appreciation, inflation remaining well within the 2.5%–7.5% target range for the thirtieth consecutive month, and sustained investor confidence. Looking ahead, we expect a modest recovery in 2026, supported by continued GDP growth momentum, a stable exchange rate, and improving business conditions, underpinned by proactive fiscal and monetary policy measures implemented during the year.
T-Bills & T-Bonds Primary Auction:
During the year, T-bills were oversubscribed, with the overall subscription rate coming in at 135.6%, down from 153.3% in FY’2024. Investors’ preference for the 91-day paper persisted as they sought to avoid duration risk, with the paper receiving bids worth Kshs 423.5 bn against the offered Kshs 208.0 bn, translating to an oversubscription rate of 203.6%, albeit lower than the oversubscription rate of 399.7% recorded in FY’2024. Overall subscription rates for the 364-day paper came in at 175.0% higher than the 103.0% recorded in FY’2024 while that of the 182-day papers came in 69.1%, lower than the 104.9%, recorded in FY’2024. The average yields on the 364-day, 182-day, and 91-day papers were on a downward trajectory with the 182-day yields decreasing the most by 7.2% points to 8.6%, from 15.7% in 2024, while the 91-day and 364-day decreased by 6.9% points and 6.1% points bps to 8.3% and 10.0% in 2025, from 15.2% and 16.0% in 2024, respectively. Additionally, on y/y basis, the yields on the government papers registered significant decline in 2024 with the 182-day paper decreasing the most by 222.2 bps to close the year at 7.8% from the 10.0% recorded at the close of FY’2024, while the yields on the 364-day and 91-day decreased by 219.9 bps and 216.7 bps to close the year at 9.2% and 7.7%, from the 11.4% and 9.9%, respectively, recorded at the end of FY’2024. The year-on-year decline in yields is primarily driven by investors perceiving lower risks due to eased inflation, currency appreciation, and improved liquidity positions. As a result, there is less demand for higher returns to compensate for potential losses. The average acceptance rate during the period came in at 88.7%, higher than the 77.3% recorded in FY’2024, with the government accepting a total of Kshs 1,501.8 bn out of the Kshs 1,692.7 bn worth of bids received. Notably, the decline in the government papers yields continued in December 2025, with the yields on the 91-day paper decreasing by 2.4 bps, compared to 8.4 bps decline that was recorded in November 2025, as the government manages the borrowing costs amid budgetary pressures. The chart below shows the yields growth rate for the 91-day, 182-day and 365-day papers during the year.
During the week, T-bills were oversubscribed for the first time in three weeks, with the overall subscription rate coming in at 108.0%, higher than the subscription rate of 22.5% recorded the previous week. Investors’ preference for the shorter 91-day paper persisted, with the paper receiving bids worth Kshs 6.3 bn against the offered Kshs 4.0 bn, translating to a subscription rate of 158.2%, significantly higher than the subscription rate of 60.4%, recorded the previous week. The subscription rate for the 182-day paper increased to 112.9% from the 7.1% recorded the previous week, while that of the 364-day papers increased to 83.0% from 22.8% recorded the previous week. The government accepted a total of Kshs 25.91 bn worth of bids out of Kshs 25.92 bn bids received, translating to an acceptance rate of 99.97%. The yields on the government papers showed mixed performance with the yield on the 182-day paper remaining unchanged at the 7.8% recorded the previous week, while the yield on the 91-day paper increased by 0.1 bps to remain relatively unchanged at the 7.7% recorded the previous week. The yield on the 364-day paper decreased by 0.1 bps to remain relatively unchanged at the 9.2% recorded the previous week.
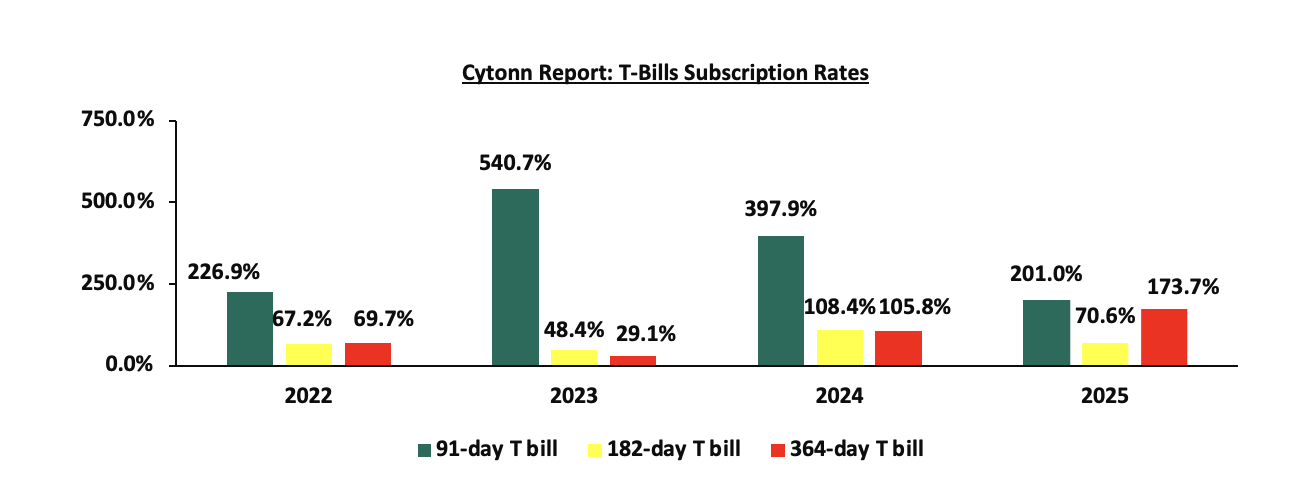
The chart below compares the overall average T- bills subscription rates obtained in 2022, 2023, 2024 and 2025;
Primary T-Bond Auctions in FY’2025
Primary T-bond auctions in 2025 were generally oversubscribed, with bonds receiving bids worth Kshs 1,691.7 bn against the offered Kshs 755.0 bn, translating to an oversubscription rate of 224.1%, higher than the oversubscription rate of 171.1% recorded in 2024. The government accepted Kshs 1,109.3 bn of the Kshs 1,691.7 bn worth of bids received, translating to an acceptance rate of 65.6%;
Secondary Bond Market Activity:
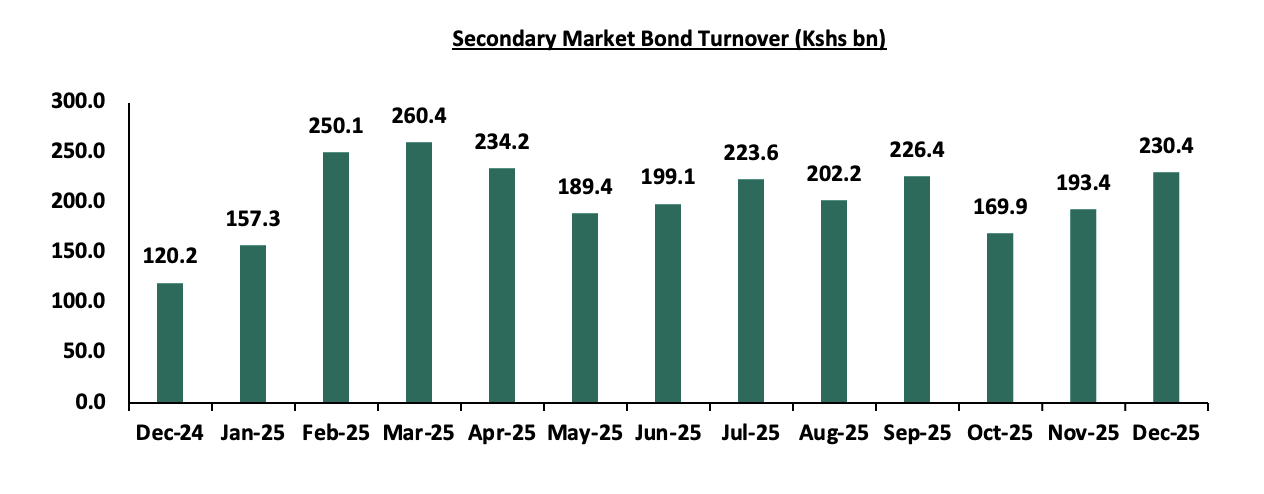
The secondary bond turnover increased by 19.2% to Kshs 230.4 bn in December 2025, from Kshs 193.4 bn recorded in November 2025, pointing towards increased activities by commercial banks in the secondary bonds market for the month of December. Similarly, on a year-on-year basis, the bond turnover increased by 91.8% from Kshs 120.2 bn worth of treasury bonds transacted over a similar period last year. The chart below shows the bond turnover over the past 12 months to December 2025;
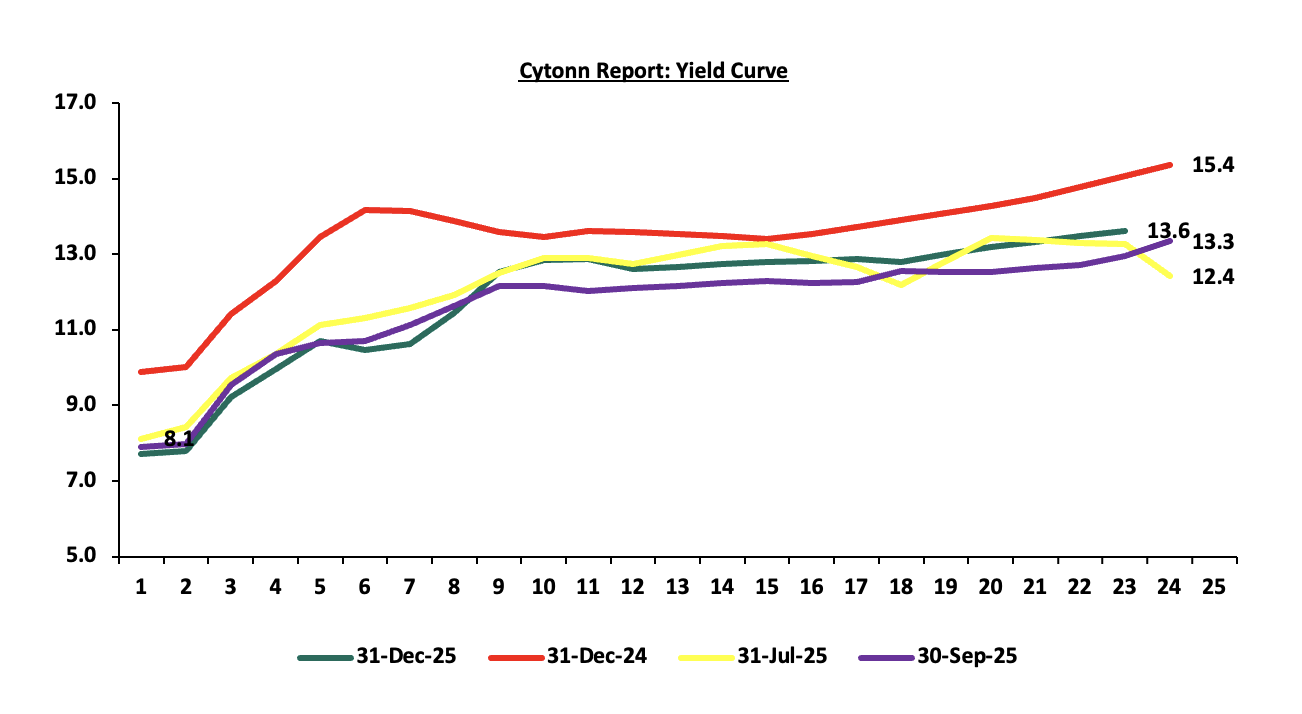
In 2025, the yield curve experienced a downward adjustment compared to 2024, primarily driven by continued effort by the government to reject highly priced bids, local currency stabilization and relatively eased inflation. These factors reduced the need for investors to demand higher yields as compensation for inflation and currency depreciation risks, resulting in an overall decline across the yield curve. Notably, the yield curve has adjusted towards a normal upward sloping curve, with long-term bonds registering highest yields. The chart below is the yield curve movement during the period;
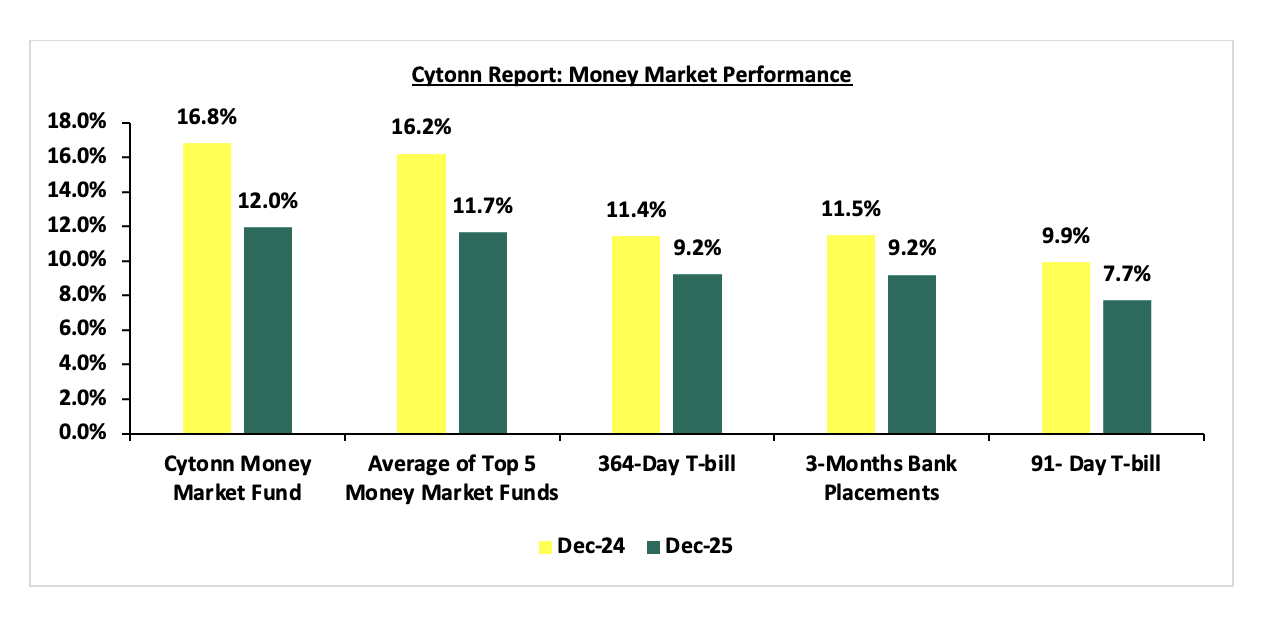
Money Market Performance:
The 3-month bank placements recorded 9.2% at the end of FY’2025, 2.3% points lower than the 11.5% recorded at the end of FY’2024 (based on what we have been offered by various banks). The 364-and 91-day papers both decreased by 2.2% points to close the year at 9.2% and 7.7%, from the 11.4% and 9.9%, respectively, recorded at the end of FY’2024, while the average Top 5 Money Market Funds decreased by 4.5% points to 11.7%, from 16.2% at the end of FY’2024. The yield on the Cytonn Money Market (CMMF) decreased by 4.8% points from 16.8% at the end of FY’2024, to 12.0% recorded at the end of FY’2025.
During the week, 3-month bank placements ended the week at 9.2% (based on what we have been offered by various banks), and yields on the government papers decreased, with the yields on the 364-day and 91-day papers decreased by 0.1 bps to remain relatively unchanged at 7.7% and 9.2% respectively recorded the previous week. The yield on the Cytonn Money Market Fund increased by 5.0 bps to 11.96% from the 11.91% recorded the previous week, while the average yields on the Top 5 Money Market Funds remained unchanged at 11.7% recorded the previous week. The table below shows the Money Market Fund Yields for Kenyan Fund Managers as published on 1st January 2026:
|
Money Market Fund Yield for Fund Managers as published on 1st January 2026 |
||
|
Rank |
Fund Manager |
Effective Annual Rate |
|
1 |
Arvocap Money Market Fund |
12.2% |
|
2 |
Cytonn Money Market Fund ( Dial *809# or download Cytonn App) |
12.0% |
|
3 |
Nabo Africa Money Market Fund |
11.8% |
|
4 |
Etica Money Market Fund |
11.4% |
|
5 |
Lofty-Corban Money Market Fund |
11.1% |
|
6 |
Ndovu Money Market Fund |
11.1% |
|
7 |
Enwealth Money Market Fund |
11.0% |
|
8 |
Gulfcap Money Market Fund |
10.8% |
|
9 |
Kuza Money Market fund |
10.6% |
|
10 |
Jubilee Money Market Fund |
10.6% |
|
11 |
Old Mutual Money Market Fund |
10.5% |
|
12 |
Orient Kasha Money Market Fund |
10.0% |
|
13 |
Madison Money Market Fund |
9.9% |
|
14 |
British-American Money Market Fund |
9.8% |
|
15 |
Dry Associates Money Market Fund |
9.6% |
|
16 |
Apollo Money Market Fund |
9.5% |
|
17 |
KCB Money Market Fund |
9.5% |
|
18 |
SanlamAllianz Money Market Fund |
9.4% |
|
19 |
Faulu Money Market Fund |
9.2% |
|
20 |
GenAfrica Money Market Fund |
9.1% |
|
21 |
Genghis Money Market Fund |
8.9% |
|
22 |
CIC Money Market Fund |
8.5% |
|
23 |
ICEA Lion Money Market Fund |
8.4% |
|
24 |
CPF Money Market Fund |
8.3% |
|
25 |
Co-op Money Market Fund |
8.2% |
|
26 |
Mali Money Market Fund |
8.1% |
|
27 |
Absa Shilling Money Market Fund |
7.5% |
|
28 |
Mayfair Money Market Fund |
6.9% |
|
29 |
AA Kenya Shillings Fund |
6.8% |
|
30 |
Ziidi Money Market Fund |
6.1% |
|
31 |
Stanbic Money Market Fund |
5.2% |
|
32 |
Equity Money Market Fund |
4.7% |
Source: Business Daily
Liquidity:
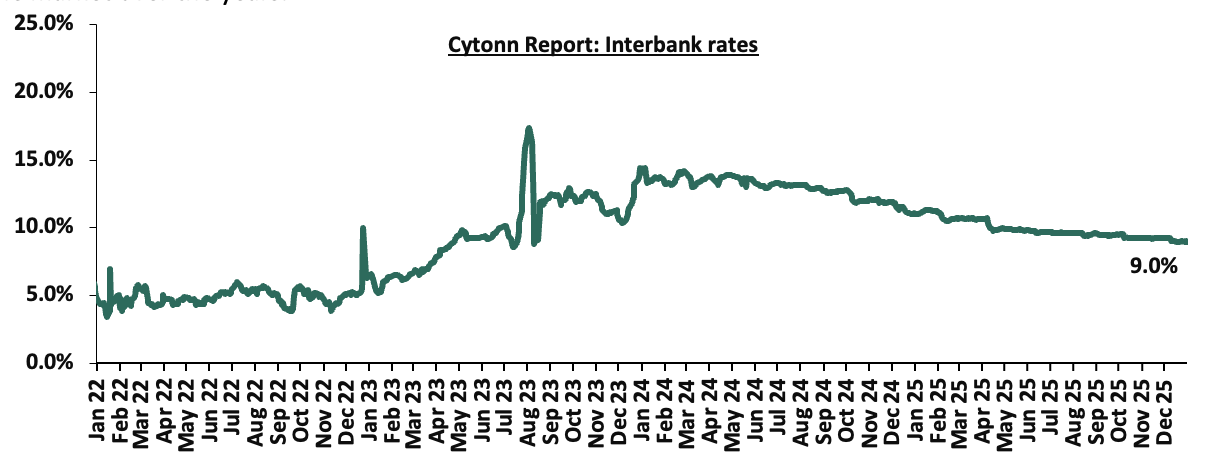
During the year, liquidity levels eased as evidenced by the decrease in the average interbank rate by 3.1% points to 9.9%, from 13.0% in 2024. The eased liquidity is partly due to government payments that offset tax remittances. Similarly, the average volumes traded in the interbank market decreased by 48.2% to Kshs 13.8 bn in 2025, from Kshs 26.7 bn recorded in 2024.
During the week, liquidity in the money markets eased, with the average interbank rate decreasing marginally by 0.03 bps, to remain relatively unchanged at 9.0% recorded the previous week, partly attributable to government payments that offset tax remittances. The average interbank volumes traded decreased by 4.0% to Kshs 9.6 bn from Kshs 10.1 bn recorded the previous week. The chart below shows the interbank rates in the market over the years:
Kenya Eurobonds:
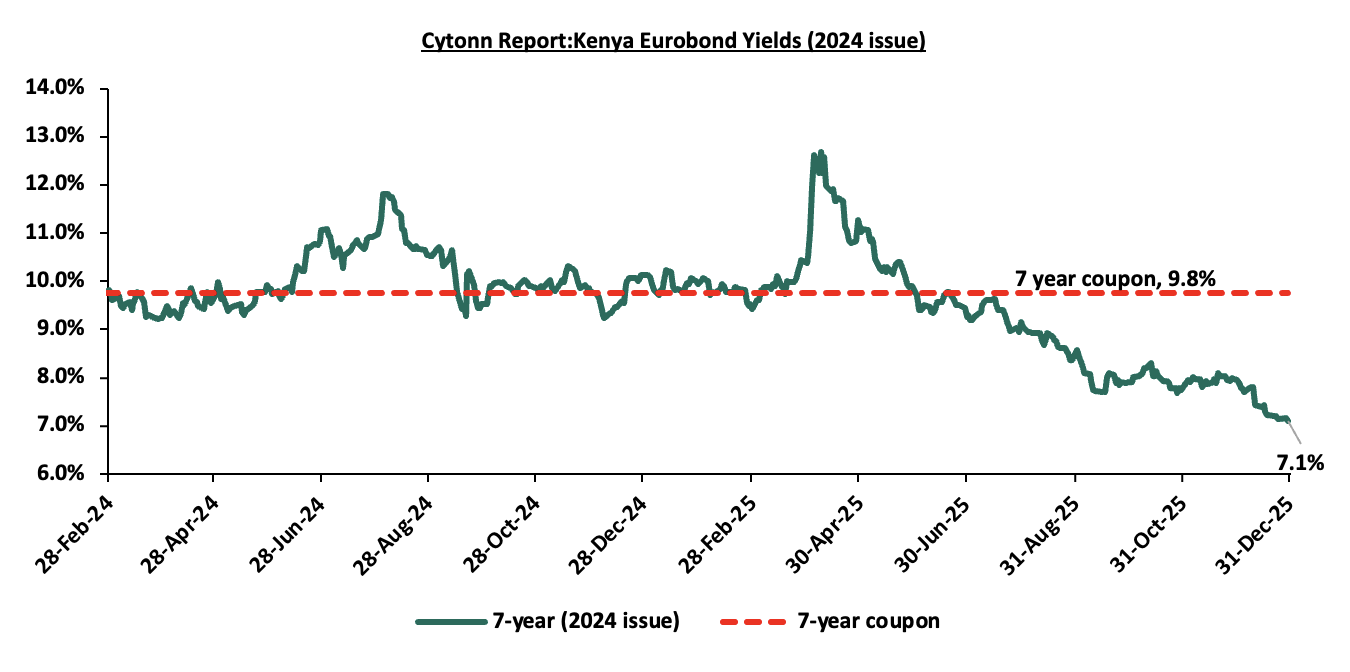
Yields on the 7-Year Eurobond issued in 2024, set to mature in 2031, decreased by 3.0% points to close the year at 7.1%, from 10.1% recorded at the beginning of 2025.
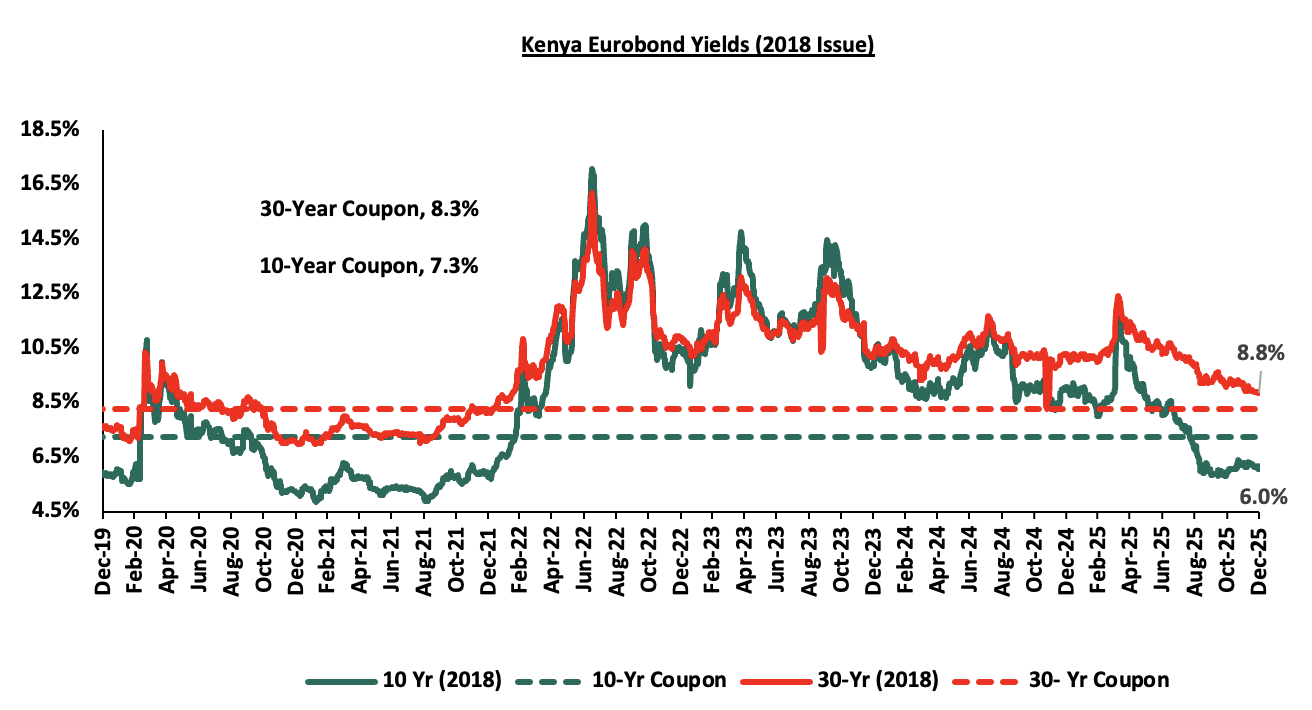
For the 2018 Eurobond issue, the yields on the 10-year Eurobond decreased by 3.1% points to close the year at 6.0% from 9.1% recorded at the start of 2025, while the yields on the 30-year Eurobond increased by 1.5% points to close the year at 8.8% from 10.3% recorded at the beginning of 2025.
For the 2019 Eurobond issue, the yields on the 12-year Eurobond increased by 2.9% points, to close the year at 7.2% from 10.1% at the beginning of 2025.

The yields on the 12-Year Eurobond issued in 2021, set to mature in 2033, decreased by 2.4% points to close the year at 7.8% from 9.5% recorded at the start of the year;
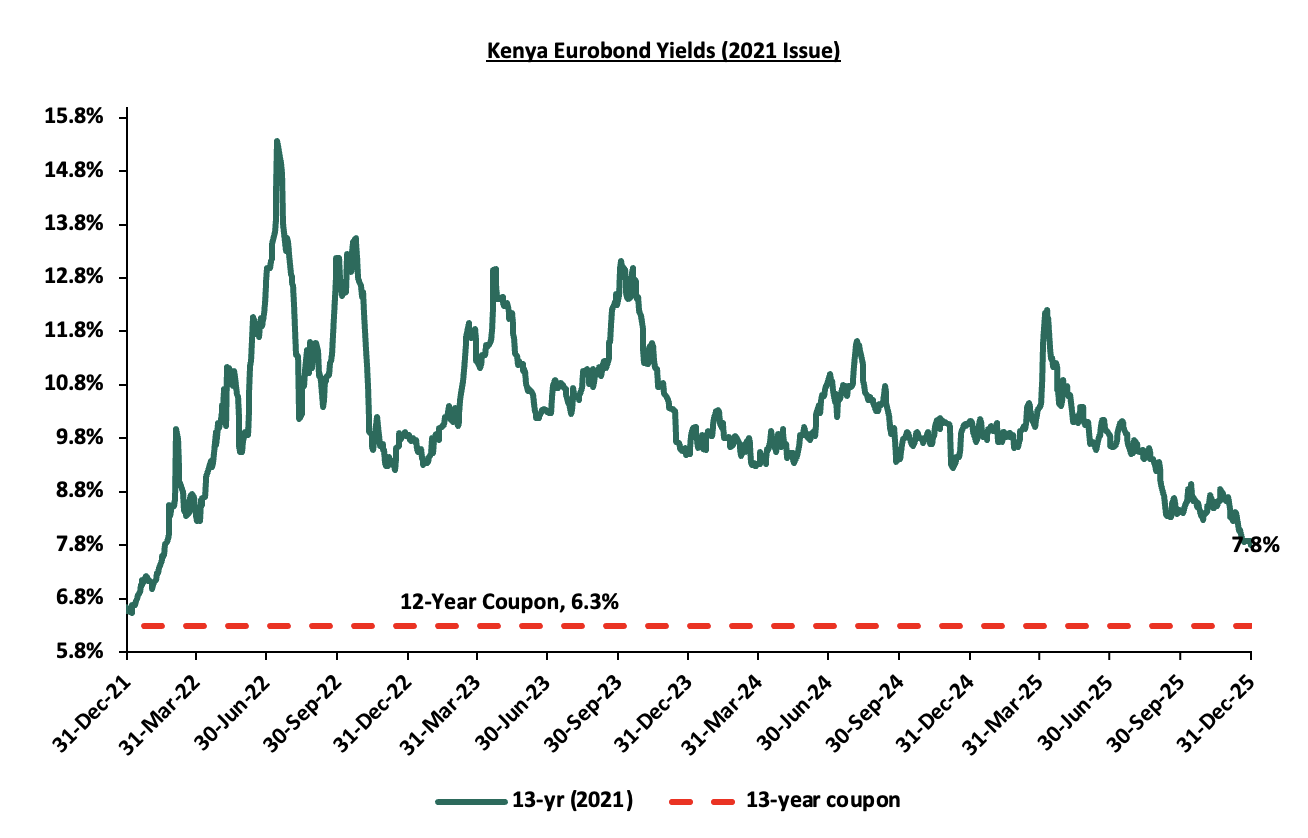
During the year, the yields on Eurobonds were on a downward trajectory, with the yields on the 13-year Eurobond issued in 2021 decreasing the most by 301.2 bps to 6.0% from 9.1% recorded at the start of the year.
Similarly, during the week, the yields on Eurobonds were on a downward trajectory, with the yields on the 7-year Eurobond issued in 2024 decreasing the most by 10.9 bps, to 7.1% from 7.2% recorded the previous week. The table below shows the summary of the performance of the Kenyan Eurobonds as of 31st December 2025:
|
Cytonn Report: Kenya Eurobond Performance |
|||||||||||
|
|
2018 |
2019 |
2021 |
2024 |
2025 |
||||||
|
Tenor |
10-year issue |
30-year issue |
7-year issue |
12-year issue |
13-year issue |
7-year issue |
11-year issue |
||||
|
Amount Issued (USD) |
1.0 bn |
1.0 bn |
0.9 bn |
1.2 bn |
1.0 bn |
1.5 bn |
1.5 bn |
||||
|
Years to Maturity |
2.5 |
22.5 |
1.7 |
6.7 |
8.8 |
5.5 |
10.5 |
||||
|
Yields at Issue |
7.3% |
8.3% |
7.0% |
7.9% |
6.2% |
10.4% |
9.9% |
||||
|
2-Jan-25 |
9.1% |
10.3% |
8.5% |
10.1% |
10.1% |
10.1% |
|
||||
|
4-Dec-25 |
6.2% |
9.1% |
- |
8.1% |
8.6% |
7.9% |
|
||||
|
23-Dec-25 |
6.1% |
8.9% |
- |
7.3% |
7.9% |
7.2% |
|
||||
|
24-Dec-25 |
6.2% |
8.9% |
|
7.3% |
7.9% |
7.2% |
|
||||
|
29-Dec-25 |
6.1% |
8.9% |
- |
7.3% |
7.9% |
7.1% |
10.0% |
||||
|
30-Dec-25 |
6.2% |
8.9% |
|
7.2% |
7.9% |
7.2% |
|
||||
|
31-Dec-25 |
6.0% |
8.8% |
- |
7.2% |
7.8% |
7.1% |
|
||||
|
Weekly Change |
(0.1%) |
0.0% |
- |
(0.1%) |
(0.1%) |
(0.1%) |
0.0% |
||||
|
MTD Change |
(0.2%) |
(0.3%) |
- |
(0.9%) |
(0.8%) |
(0.8%) |
0.0% |
||||
|
YTD Change |
(3.0%) |
(1.4%) |
- |
(2.9%) |
(2.3%) |
(3.0%) |
0.0% |
||||
Source: Central Bank of Kenya (CBK)
Rates in the Fixed Income market have been on a downward trend due to high liquidity in the money market which allowed the government to front load most of its borrowing. The government is 106.2% ahead of its prorated net domestic borrowing target of Kshs 327.8 bn, having a net borrowing position of Kshs 676.0 bn (inclusive of T-bills). However, we expect a stabilization of the yield curve in the short and medium term, with the government looking to increase its external borrowing to maintain the fiscal surplus, hence alleviating pressure in the domestic market. As such, we expect the yield curve to stabilize in the short to medium-term and hence investors are expected to shift towards the long-term papers to lock in the high returns
Market Performance
In 2025, the Kenyan equities market was on an upward trajectory, with NSE 20 gaining the most by 52.5%, while NASI, NSE 10 and NSE 25 gained by 48.9%, 48.0% and 47.4% respectively. Below is a summary of the 2025 annual performance of some of the large-cap stocks in the Kenyan stock market:
|
Cytonn Report: Kenya Equities Performance - Large Cap Gainers and Losers 2025 |
||
|
No |
Company |
Share Price Performance 2025 |
|
1 |
DTBK |
71.5% |
|
2 |
SCOM |
64.8% |
|
3 |
NCBA |
64.7% |
|
4 |
KCB |
55.1% |
|
5 |
EABL |
49.9% |
|
6 |
STANBIC |
41.5% |
|
7 |
EQTY |
39.1% |
|
8 |
COOP |
37.2% |
|
9 |
ABSA |
31.0% |
|
10 |
BAT |
22.0% |
|
11 |
SCBK |
4.2% |
|
12 |
BAMB |
(1.8%) |
Source: Cytonn Research
During the week, the Kenyan equities market was on an upward trajectory, with NSE 10 gaining the most by 2.3%, while NSE 25, NASI and NSE 20 gained by 2.1%, 1.8% and 1.3% respectively. The equities market performance was driven by gains recorded by large-cap stocks such as ABSA, KCB and NCBA of 8.0%, 5.2% and 2.4% respectively. The performance was, however, weighed down by losses by large-cap stocks such EABL, Standard Chartered and BAT of 0.4%, 0.1% and 0.1% respectively.
During the week, the banking sector index gained by 2.6% to 204.4 from 199.3 recorded the previous week. This is attributable to gains recorded by stocks such as Absa, KCB and NCBA of 8.0%, 5.2% and 2.4% respectively. The performance was, however, weighed down by losses recorded by large cap stocks such as Standard Chartered of 0.1%.
During the year, equities turnover increased by 40.6% to close the year at USD 1.1 bn, from USD 0.8 bn recorded in 2024. Foreign investors remained net sellers, with a net outflow of USD 92.9 mn, compared to net outflows of USD 16.9 mn recorded in 2024.
During the week, equities turnover decreased by 30.8% to USD 8.2 mn from USD 11.8 mn recorded the previous week. Additionally, foreign investors became net buyers for the first time in two weeks, with a net buying position of USD 0.1 mn, from a net selling position of USD 0.5 mn recorded the previous week.
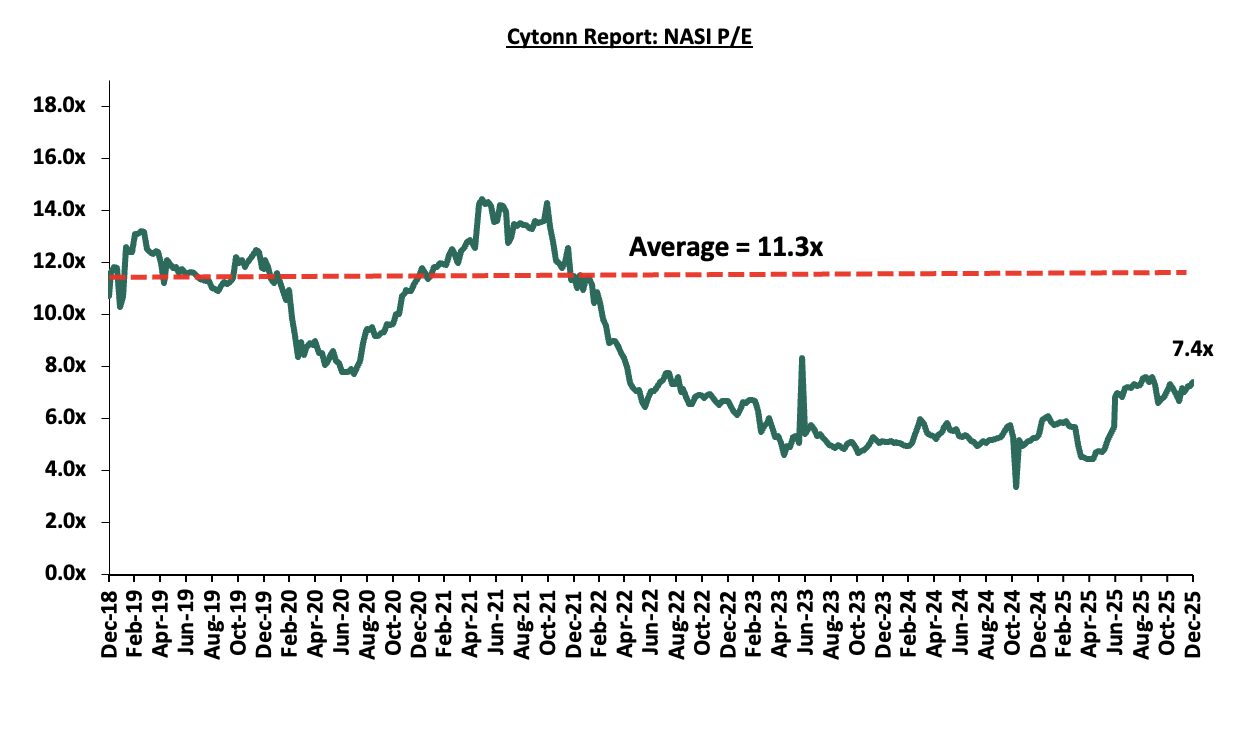
The market is currently trading at a price-to-earnings ratio (P/E) of 7.4x higher than 5.3x recorded at the end of 2024, and is 34.8% below the 15-year historical average of 11.3x. NASI’s P/E ratio remained boosted for the majority of the year, mainly attributable to a rise in price of large-cap stocks such as Safaricom whose price rose by 64.8% during the year. Safaricom continues to be a key part of Kenyan equities portfolios, accounting for 39.1% of Nairobi Stock Exchange (NSE’s) market capitalization and has dominated both the market turnover and determines the direction of the market given its weight and liquidity in the Nairobi Securities Exchange. On the other hand, the dividend yield is currently at 5.3%, 0.6% points above the historical average of 4.7%.
Key to note, NASI’s PEG ratio currently stands at 0.9x, an indication that the market is slightly undervalued relative to its future growth. A PEG ratio greater than 1.0x indicates the market may be overvalued while a PEG ratio less than 1.0x indicates that the market is undervalued. The charts below indicate the market’s historical P/E and dividend yield:

2025 Key Highlights
-
Banking Sector Earnings
According to the Q3’2025 banking results core earnings per share (EPS) for the listed banks recorded a weighted growth of 7.6% in Q3’2025, compared to a weighted growth of 24.6% recorded in Q3’2024, an indication of deteriorated performance mainly on the back of a 3.3% decline in non-funded income in Q3’2025, compared to a growth of 14.5% in Q3’2024, despite an improvement in loan book expansion. The table below highlights the performance of the banking sector, showing the performance using several metrics, and the key take-outs of the performance.
|
Cytonn Report: Kenyan Listed Banks Performance Q3’2025 |
|||||||||||||||
|
Bank |
Core EPS Growth |
Interest Income Growth |
Interest Expense Growth |
Net Interest Income Growth |
Net Interest Margin |
Non-Funded Income Growth |
NFI to Total Operating Income |
Growth in Total Fees & Commissions |
Deposit Growth |
Growth in Government Securities |
Loan to Deposit Ratio |
Loan Growth |
Return on Average Equity |
COF |
YIEA |
|
Equity Group |
32.7% |
2.9% |
(20.7%) |
16.1% |
7.9% |
2.5% |
40.1% |
7.6% |
2.2% |
19.9% |
63.9% |
7.5% |
24.5% |
3.7% |
11.3% |
|
I&M Group |
24.2% |
0.6% |
(23.1%) |
21.1% |
8.3% |
17.9% |
26.0% |
15.7% |
10.2% |
65.2% |
66.2% |
7.3% |
19.2% |
5.3% |
13.1% |
|
Absa Bank Kenya |
14.7% |
(9.6%) |
(21.9%) |
(4.6%) |
9.6% |
11.2% |
29.2% |
16.3% |
9.2% |
71.1% |
80.6% |
(0.6%) |
26.8% |
3.8% |
12.9% |
|
Diamond Trust Bank |
12.3% |
0.9% |
(14.6%) |
17.9% |
6.2% |
(5.8%) |
26.7% |
10.7% |
15.5% |
22.9% |
58.1% |
7.8% |
11.2% |
5.5% |
11.7% |
|
Co-operative Bank |
12.3% |
10.0% |
(9.0%) |
22.8% |
8.7% |
(0.8%) |
32.8% |
1.6% |
6.7% |
20.7% |
74.1% |
6.6% |
18.8% |
5.4% |
13.4% |
|
NCBA Group |
8.5% |
(11.8%) |
(42.3%) |
27.4% |
7.3% |
(1.9%) |
40.0% |
2.5% |
(5.3%) |
3.0% |
60.0% |
(3.5%) |
21.0% |
5.3% |
12.1% |
|
KCB Group |
0.7% |
1.1% |
(17.6%) |
12.4% |
8.4% |
(10.1%) |
30.2% |
(1.5%) |
(0.8%) |
6.1% |
74.7% |
8.2% |
22.7% |
4.0% |
12.2% |
|
Stanbic Group |
(7.7%) |
(17.2%) |
(41.4%) |
8.0% |
6.3% |
(24.5%) |
27.6% |
1.1% |
4.9% |
32.8% |
73.6% |
15.7% |
18.5% |
4.5% |
11.1% |
|
Standard Chartered Bank |
(38.2%) |
(13.5%) |
(9.2%) |
(10.3%) |
9.3% |
(28.6%) |
31.3% |
(6.9%) |
(0.3%) |
55.9% |
51.7% |
(3.2%) |
21.5% |
1.5% |
10.6% |
|
HF Group |
(58.3%) |
19.4% |
(12.4%) |
63.3% |
6.6% |
28.6% |
28.8% |
(10.1%) |
21.6% |
94.3% |
71.7% |
2.8% |
7.7% |
6.1% |
12.3% |
|
Q3'2025 Mkt Weighted Average* |
7.6% |
(2.6%) |
(21.7%) |
13.4% |
8.2% |
(3.3%) |
33.1% |
4.1% |
3.2% |
29.9% |
67.9% |
4.8% |
21.7% |
4.2% |
12.0% |
|
Q3’2024 Mkt Weighted Average** |
24.6% |
25.5% |
52.9% |
14.7% |
7.9% |
14.5% |
36.9% |
10.0% |
2.3% |
10.4% |
66.3% |
(2.3%) |
23.5% |
4.9% |
12.5% |
|
*Market cap weighted as at 11/12/2025 |
|||||||||||||||
|
**Market cap weighted as at 11/12/2024 |
|||||||||||||||
Key takeaways from the table include:
-
The listed banks recorded a 7.6% growth in core Earnings per Share (EPS) in Q3’2025, compared to the weighted average growth of 24.6% in Q3’2024, an indication of weaker performance on the back of a 3.3% decline in non-funded income in Q3’2025, compared to a growth of 14.5% in Q3’2024. This was majorly attributable to a decline in foreign exchange income due to reduced dollar demand and lower transaction volumes weighing down on fees and commissions income growth which declined by 5.9% points to 4.1% in Q3’2025 from 10.0% in Q3’2024. The performance during the period was mainly weighed down by a 3.3% weighted average decline in non-funded income, but however supported by a 13.4% weighted average growth in net interest income,
-
Investments in government securities investments by listed banks increased significantly in Q3’2025, having recorded a market-weighted average growth of 29.9%, from the 10.4% growth recorded in Q3’2024, with all of the listed banks recording increases in government securities investments. HF Group and Absa Bank Kenya recorded the largest increases of 94.3% and 71.1% respectively.
-
The listed banks’ Net loans and advances to customers recorded a weighted average growth of 4.8% in Q3’2025, an increase from the 2.3% decline recorded in Q3’2024, an indicating increased lending activity supported by easing borrowing costs, as a result of declining lending interest rates.
-
Interest income recorded a weighted average decline of 2.6% in Q3’2025, compared to a growth of 25.5% in Q3’2024. Similarly, interest expenses recorded a market-weighted average decline of 21.7% in Q3’2025 compared to a growth of 52.9% in Q3’2024. Consequently, net interest income recorded a weighted average growth of 13.4% in Q3’2025, slightly lower than the 14.7% growth recorded in Q3’2024, on the back of easing monetary policy leading to lower lending and deposit rates,
-
Notably, non-funded income growth softened during the year, as evidenced by non-funded income weighted average decline of 3.3% in Q3’2025 compared to a weighted average growth of 14.5% in Q3’2024. The performance was largely attributable to the decrease in foreign exchange income recorded by the banks during the period as a result of decreased dollar demand in the country. Additionally, listed banks recorded a weighted average growth of 4.1% in total fees and commissions income in Q3’2025 compared to a weighted growth of 10.0% in Q3’2024, and,
-
The listed banks recorded a 21.7% weighted average growth on return on average equity (RoaE), 1.8% points lower than the 23.5% growth registered in Q3’2024. Similarly, the entire banking sector’s Return On Equity (ROE) stood at 22.2% as of September 2025, a 0.8% points decrease from the 23.0% recorded in June 2025 and a 2.7% points decrease from the 24.9% recorded in September 2024 . On a global level, the Kenyan banking sector continues to record high profitability compared to other economies in the world, as highlighted in the chart below:
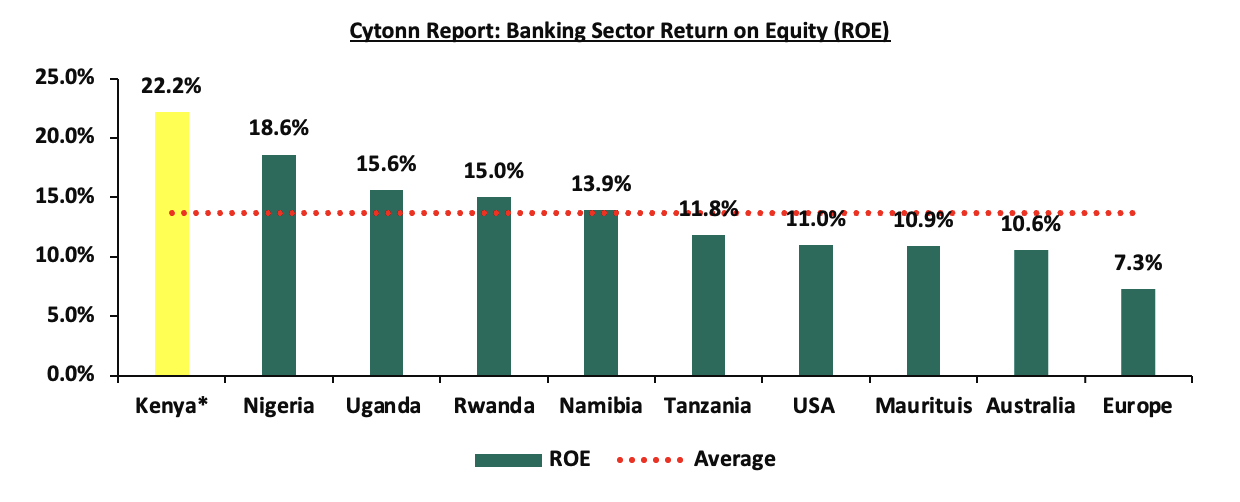
For more information, see our Kenya Listed Banks Q3’2025 Report.
-
Insurance Sector Earnings:
During the year, Kenya listed insurers released their H1’2025 results, recording a weighted average decrease in core earnings per share of 6.6% in H1’2025, compared to the weighted increase of 39.6%, in H1’2024. The table below highlights the performance of the listed insurance sector, showing the performance using several metrics, and the key take-outs of the performance;
|
Cytonn Report: Listed Insurance Companies H1’2025 Earnings and Growth Metrics |
||||||||
|
Insurance |
Core EPS Growth |
Net Premium growth |
Claims growth |
Loss Ratio |
Expense Ratio |
Combined Ratio |
ROaE |
ROaA |
|
Sanlam |
(94.7%) |
6.1% |
5.3% |
89.1% |
60.0% |
149.1% |
1.2% |
0.1% |
|
Liberty |
(29.8%) |
(37.4%) |
(20.0%) |
73.6% |
80.0% |
153.6% |
4.4% |
0.9% |
|
Jubilee Insurance |
20.4% |
32.6% |
36.6% |
92.2% |
108.4% |
200.7% |
5.5% |
1.4% |
|
Britam |
(15.0%) |
10.6% |
11.4% |
76.8% |
96.4% |
173.2% |
6.0% |
1.2% |
|
CIC |
(23.3%) |
8.4% |
23.4% |
92.2% |
117.2% |
209.4% |
6.0% |
1.3% |
|
*H1'2025 Weighted Average |
(6.6%) |
13.7% |
19.8% |
85.2% |
102.5% |
187.7% |
5.6% |
1.3% |
|
**H1'2024 Weighted Average |
39.6% |
51.7% |
(18.2%) |
81.1% |
68.2% |
149.4% |
7.3% |
1.6% |
|
*Market cap weighted as at 09/10/2025 |
||||||||
|
**Market cap weighted as at 18/10/2024 |
||||||||
Source: Cytonn Research
The key take-outs from the above table include;
-
Core EPS growth recorded a weighted decline of 6.6%, compared to the weighted growth of 39.6%, in H1’2024. The decline in earnings was attributable to decreased premiums during the period following declined yields from government papers during the period,
-
Insurance revenue grew at a slower pace of 13.7% in H1’2025, compared to a growth of 51.7% in H1’2024, while claims also grew at a rate of 19.8% in H1’2025, a reversal from the 18.2% decline recorded in H1’2024 on a weighted average basis,
-
The loss ratio across the sector increased to 85.1% in H1’2025 from 81.1% in H1’2024,
-
The expense ratio increased to 102.5% in H1’2025, from 68.2% in H1’2024, owing to increase in operating expenses, a sign of decreased efficiency,
-
The insurance core business still remains unprofitable, with a combined ratio of 187.8% as at H1’2025, higher than the 149.4% in H1’2024, and higher than the desired ratio of 100.0%, and,
-
On average, the insurance sector delivered a Return on Average Equity (ROaE) of 5.6%, a decrease from a weighted Return on Average Equity of 7.6% in H1’2024
For more information, see our Kenya H1’2025 Listed Insurance Report.
Other Key Results
Safaricom Limited released their H1’2025 results, recording an decrease in core earnings per share of 17.7% to Kshs 0.7 in H1’2025, from Kshs 0.9 in H1’2024. The decrease was largely attributable to a 34.6% increase in operating expenses to Kshs 114.4 bn from Kshs 84.9 bn recorded in H1’2024, which outpaced the 15.1% growth in total revenue to Kshs 189.4 bn in H1’2025, from Kshs 164.6 bn in H1’2024. The group achieved a 15.1% year-on-year (YoY) growth in total revenue, reaching Kshs 189.4 billion, up from Kshs 164.6 billion recorded in H1’2024 with the profit after tax decreasing by 63.2% to Kshs 10.0 bn in H1’2025, from Kshs 27.2 bn.
During the year, 8 companies issued profit warnings to investors, compared to 9 companies in 2024 and 15 companies in 2023. The decreased in number of companies that issued profit warning in 2025 is an indication of improving economic conditions brought about by the continued appreciation of the Kenyan Shilling against other global currencies and reduced rate of inflation. The situation was however weighed down by the reduction in purchasing power of consumers occasioned by the high cost of living and increased taxes in addition to disruption of the global supply chain due to the challenging geopolitics resulting in high production costs. Companies are required to issue profit warnings if they project a more than 25.0% decline in profits year-on-year. Below is the summary of the said companies:
|
Cytonn Report: Companies That Issued Profit Warnings |
||||
|
No |
2025 |
2024 |
2023 |
2022 |
|
1 |
Express Kenya |
Car & General |
Bamburi Cement PLC |
|
|
2 |
Centum Plc |
Kakuzi Plc |
Centum Plc |
Centum Investments Co Plc |
|
3 |
Kapchorua Tea Kenya Plc |
Total Energies Kenya Plc |
Crown Paints Kenya |
Crown Paints Kenya PLC |
|
4 |
WPP Scangroup Plc |
WPP Scangroup Plc |
Eveready |
Flame Tree Group Holdings Ltd |
|
5 |
TPS Eastern Africa Plc |
Sasini Plc |
Express Kenya |
Kakuzi Plc |
|
6 |
Kenya Airways |
Eaagads Limited |
Kakuzi Plc |
Liberty Kenya Holdings Ltd |
|
7 |
Standard Charterred Bank Kenya |
Bamburi Cement PLC |
Kenya Airways |
Nairobi Securities Exchange PLC |
|
8 |
Umeme Limited |
Umeme Limited |
KPLC |
Sameer Africa plc |
|
9 |
Limuru Tea PLC |
Longhorn Publishers Plc |
Sanlam Plc |
|
|
10 |
Nation Media Group |
The Limuru Tea Kenya Plc |
||
|
11 |
Sameer Africa Plc |
|||
|
12 |
Sanlam Plc |
|||
|
13 |
Sasini Plc |
|||
|
14 |
Unga Plc |
|||
|
15 |
WPP Scan Group |
|||
Source: Cytonn Research
The key highlights from the table include:
-
Williamson Tea Kenya issued a profit warning in 2025 for the financial year ended 31st March 2025, indicating that expected earnings would decline by more than 25.0% due to depressed global tea prices driven by oversupply and a strong Kenyan Shilling against the US Dollar which reduced export revenues and increased operating costs,
-
Centum Plc issued a profit warning for the financial year ending 31st March 2025, indicating that the expected decline in net profit was mainly due to lower fair value gains on its investment property portfolio relative to the previous year, affecting earnings despite stable operational performance,
-
Kapchorua Tea Plc issued a profit warning for the financial year ended 31st March 2025, noting that the expected drop in earnings of more than 25.0% was primarily due to continued low global tea prices from oversupply and currency headwinds impacting export returns,
-
WPP Scangroup Ltd issued a profit warning for the year ending 31st December 2025, stating that the expected decline in earnings of at least 25.0% was due to weaker client spending, loss of a major account, reduced interest income, and costs related to restructuring,
-
TPS Eastern Africa Plc issued a profit warning for the financial year ending 31st December 2025, indicating that the expected decline in profit was mainly attributable to the disappearance of significant foreign exchange gains recorded in 2024, compounded by weaker regional travel demand and increased provisions for outstanding receivables under IFRS 9,
-
Kenya Airways issued a profit warning for the year ending 31st December 2025, projecting that net profits would fall by at least 25.0% due to grounded aircraft, lower passenger volumes, and constrained operations largely driven by ongoing operational challenges and reduced network capacity,
-
Standard Chartered Bank Kenya Plc issued a profit warning for the financial year ending 31st December 2025, warning that net earnings were expected to decline by at least 25.0% due to a one-off settlement of a pension tribunal judgment and lower forex income, which materially reduced profitability compared to the prior year,
-
Umeme Limited issued a profit warning for the 2025 financial period after reporting a significant net loss for the half-year ended 30th June 2025, attributing the expected decline in full-year earnings to the natural end of its 20-year electricity distribution concession, which halted revenue generation and led to substantial amortisation charges and operational losses,
Below is a summary of the number of companies that issued profit warnings over the last 10 years:
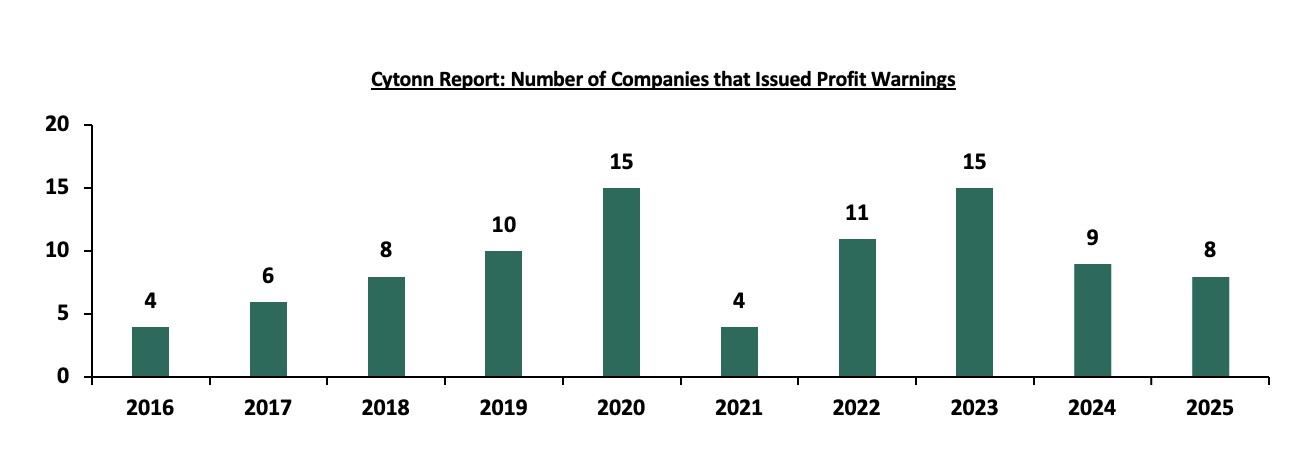
Source: Cytonn Research, NSE
-
Listings and Suspensions
During the year, a total of three securities were suspended from trading, namely Bamburi Cement Plc, TransCentury Plc, and East African Cables Plc, reflecting corporate actions, financial distress, and continued non-compliance with NSE listing requirements. Bamburi Cement Plc was suspended from trading on the NSE effective 28th February 2025, following the acquisition of 96.5% of its share capital by Amsons Industries (K) Ltd, to allow for the compulsory acquisition of remaining minority shareholders and completion of legal and regulatory processes that may lead to its eventual delisting after over five decades as a listed entity. In addition, TransCentury Plc and East African Cables Plc remained suspended, reflecting that both companies were placed under receivership over unpaid loans, ongoing financial distress, governance challenges and continued non-compliance with NSE listing and disclosure requirements, underscoring the Exchange’s commitment to market discipline and investor protection. These suspensions bring the total number of suspended companies on the NSE to six, including are Mumias Sugar Company, ARM Cement, and Deacons East Africa
2025 recorded two new additions, with Shri Krishana Overseas Limited listing on the NSE, expanding investor exposure to the manufacturing and export-oriented segment, and the Satrix MSCI World Feeder ETF providing local investors with access to global developed equity markets through a diversified exchange-traded fund
Looking ahead, Family Bank Plc is a planned new listing, expected to further strengthen the banking sector’s representation on the NSE. These periodic reviews and market adjustments reinforce index integrity, market transparency, and investor confidence, ensuring NSE benchmarks continue to serve as reliable guides for portfolio management and investment decisions.
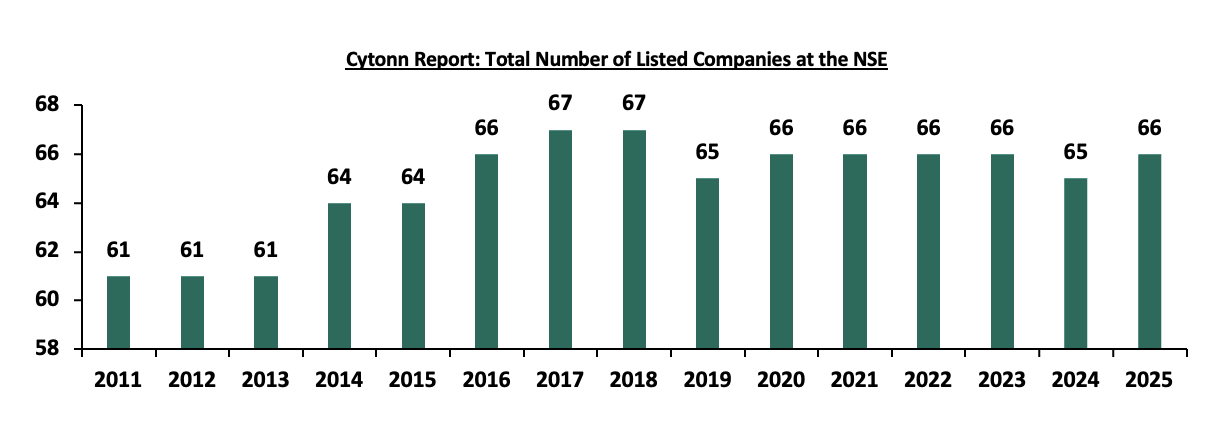
Source: Cytonn Research
-
Liquidations
During the year, no formal liquidations were announced by the Central Bank, although the Office of the Official Receiver continued to record insolvency filings across various sectors. In the insurance industry, Invesco Assurance was placed under provisional liquidation, reflecting prolonged financial strain, weak governance structures, and sustained losses, particularly in high-risk segments such as PSV insurance. These developments continued to weigh on customer confidence and industry stability, underscoring the need for stronger governance, risk management, and liquidity frameworks within the sector.
-
Legislation and 0ther Developments
During the year, there were significant legislative and rule changes that impacted the equities market and investor sentiment:
-
Removal of Odd-Lot Trading Restrictions
In 2025, the Nairobi Securities Exchange (NSE) implemented a major market access reform by removing restrictions on odd-lot trading, allowing investors to buy and sell shares in quantities from one share. This move was aimed at expanding participation by retail investors, improving market inclusivity, and lowering entry barriers to equity investing. By enabling fractional participation in high-priced stocks, the reform enhanced liquidity at the retail end of the market and aligned the NSE with global best practices that promote broader investor access and market depth.
-
NSE Reclassification of Market Segments
Following the implementation of the Capital Markets (Public Offers, Listing and Disclosure) Regulations, 2023, the Nairobi Securities Exchange (NSE) officially restructured its market segmentation framework after receiving formal approval from the Capital Markets Authority (CMA).
The reclassification marked a significant regulatory milestone aimed at simplifying issuer obligations, enhancing investor clarity, and aligning the Exchange with international standards for capital markets structure. The table below show the reorganization under the new structure.
|
Old Structure |
New structure |
|
Main Investment Market Segment (MIMS) |
Retained and expanded to cover both equities and bonds |
|
Growth Enterprise Market Segment (GEMS) |
Merged into SME Market Segment |
|
Alternative Investment Market Segment (AIMS) |
Merged into SME Market Segment |
|
Fixed Income Securities Market Segment (FISMS) |
Integrated into either MIMS or SME FISMS based on issuer profile |
Source: Cytonn Research, NSE
The reclassified framework now comprises:
-
Main Investment Market Segment (MIMS) – For established entities (both equity and fixed income)
-
SME Market Segment – For small and medium-sized issuers, including equity and debt instruments
This restructuring is intended to:
-
Streamline listing procedures by eliminating outdated or redundant market categories
-
Improve issuer visibility through a simplified two-tier structure
-
Enhance investor understanding of the risks and profiles associated with listed firms
-
Encourage SME listings through a more inclusive and supportive regulatory framework
-
Align Kenya’s capital markets with best practice standards, increasing regional and global competitiveness
The tables below show the market overview following the segment reclassification
Equities Market
|
Segment |
Number of Issuers |
Notable Constituents |
|
MIMS |
57 |
Safaricom, Equity Group, EABL, KCB, BAT, Bamburi, EAPC |
|
SME |
9 |
Homeboyz Entertainment, Nairobi Business Ventures, Kurwitu Ventures |
Fixed Income Market
|
Segment |
Number of Issuers |
Instruments |
|
MIMS (Bonds) |
4 |
Family Bank MTN, EABL MTN, KMRC MTN, Linzi 003 IABS |
|
SME FISMS |
1 |
Real People Kenya MTN |
- East Africa Exchanges (EAE) 20 Share Index Launch
During the year, the East African Securities Exchanges Association (EASEA) launched the East Africa Exchanges (EAE) 20 Share Index, the first regional index in East Africa. The EAE 20 Share Index comprises of the top 20 listed companies in Kenya, Tanzania, Uganda and Rwanda securities exchanges in terms of market capitalization. The table below shows the listed companies in the EAE 20 Share index and their market caps as of 11th April 2025 following the launch;
|
Cytonn Report: EAE 20 Share Index Listed Companies |
||||||||||||||||||||||||||||||||||||||||||||||||||||||||||||||||||||||||||||||||||||||||||||||||||
|
Country |
Company |
Market Cap (USD mn) |
||||||||||||||||||||||||||||||||||||||||||||||||||||||||||||||||||||||||||||||||||||||||||||||||
|
Kenya |
Safaricom Plc |
5,452.2 |
||||||||||||||||||||||||||||||||||||||||||||||||||||||||||||||||||||||||||||||||||||||||||||||||
|
KCB Group Plc |
948.9 |
|||||||||||||||||||||||||||||||||||||||||||||||||||||||||||||||||||||||||||||||||||||||||||||||||
|
Equity Group Holdings Plc |
1,297.7 |
|||||||||||||||||||||||||||||||||||||||||||||||||||||||||||||||||||||||||||||||||||||||||||||||||
|
The Co-operative Bank of Kenya Limited |
723.8 |
|||||||||||||||||||||||||||||||||||||||||||||||||||||||||||||||||||||||||||||||||||||||||||||||||
|
Absa Bank Kenya |
714 |
|||||||||||||||||||||||||||||||||||||||||||||||||||||||||||||||||||||||||||||||||||||||||||||||||
|
Tanzania |
CRDB Bank Plc |
771.3 |
||||||||||||||||||||||||||||||||||||||||||||||||||||||||||||||||||||||||||||||||||||||||||||||||
|
NMB Bank Plc |
1,121.5 |
|||||||||||||||||||||||||||||||||||||||||||||||||||||||||||||||||||||||||||||||||||||||||||||||||
|
Tanzania Breweries Limited |
1,202.3 |
|||||||||||||||||||||||||||||||||||||||||||||||||||||||||||||||||||||||||||||||||||||||||||||||||
|
Tanga Cement Company Limited |
42.8 |
|||||||||||||||||||||||||||||||||||||||||||||||||||||||||||||||||||||||||||||||||||||||||||||||||
|
Tanzania Cigarette Corporation |
635.5 |
|||||||||||||||||||||||||||||||||||||||||||||||||||||||||||||||||||||||||||||||||||||||||||||||||
|
Rwanda |
Bralirwa Limited |
98.5 |
||||||||||||||||||||||||||||||||||||||||||||||||||||||||||||||||||||||||||||||||||||||||||||||||
|
BK Group Plc |
206.7 |
|||||||||||||||||||||||||||||||||||||||||||||||||||||||||||||||||||||||||||||||||||||||||||||||||
|
I&M Bank (Rwanda) Plc |
24.8 |
|||||||||||||||||||||||||||||||||||||||||||||||||||||||||||||||||||||||||||||||||||||||||||||||||
|
Cimerwa Plc |
75.8 |
|||||||||||||||||||||||||||||||||||||||||||||||||||||||||||||||||||||||||||||||||||||||||||||||||
|
MTN Rwandacell Plc |
134.1 |
|||||||||||||||||||||||||||||||||||||||||||||||||||||||||||||||||||||||||||||||||||||||||||||||||
|
Uganda |
MTN Uganda Limited |
1,654.8 |
||||||||||||||||||||||||||||||||||||||||||||||||||||||||||||||||||||||||||||||||||||||||||||||||
|
Stanbic Uganda Holdings |
653.8 |
|||||||||||||||||||||||||||||||||||||||||||||||||||||||||||||||||||||||||||||||||||||||||||||||||
|
Bank of Baroda (Uganda) |
100.0 |
|||||||||||||||||||||||||||||||||||||||||||||||||||||||||||||||||||||||||||||||||||||||||||||||||
|
Airtel Uganda Limited |
1,032.7 |
|||||||||||||||||||||||||||||||||||||||||||||||||||||||||||||||||||||||||||||||||||||||||||||||||
|
Quality Chemical Industries Limited |
86.3 |
|||||||||||||||||||||||||||||||||||||||||||||||||||||||||||||||||||||||||||||||||||||||||||||||||
Source: Cytonn Research
To be included in the index, a company must meet specific criteria: its shares should be primarily listed in one of the East African exchanges, it should maintain consistent profitability, a proven record of dividend payments, maintain a continuous listing of a minimum of one year and demonstrate stability as a blue-chip firm. The constituent firms will be reviewed semi-annually by the EASEA Index Management Committee, which oversees updates such as additions and removals based on mergers, restructuring, delisting or other market factors.
A reserve list is maintained with five top-ranking non-constituent securities to allow immediate replacements if any constituent is removed. New issues of securities can be added to the index either during periodic reviews or earlier if deemed critical to market representation. Daily index values and updates are published by member exchanges and the EA Securities Exchanges websitetoensuretransparencyandaccessibilityforstakeholders.
This launch aligns with ongoing efforts to deepen financial integration across East Africa, harmonize market operations and foster innovation in financial instruments. For the Kenyan market, the index enhances the visibility of local blue chip-companies on a broader stage, potentially attracting more foreign direct investment and portfolio inflows.
-
Nairobi Securities Exchange Plc Launches Banking Sector Index
During the year, the Nairobi Securities Exchange (NSE) launched the NSE Banking Sector Share Index (NSE BSI) on 1stOctober 2025 to track the performance of all listed commercial banks in Kenya. This index provides investors with a transparent benchmark to measure the performance of banking stocks and serves as a basis for structured products and investment strategies. The ground rules outline its construction, eligibility, maintenance, and governance.
Below are the key ground rules that manage the NSE BSI :
-
To qualify, a company must be a listed commercial bank on the NSE. Both local and cross-listed banks are included, and all ordinary shares are eligible without restrictions on size, liquidity, or free float.
-
The index uses a float-adjusted, market capitalization-weighted methodology. The base date is set at a value of 1000, with calculations reflecting the tradable market value of constituent stocks. Adjustments are made using a divisor to ensure index continuity when corporate actions, share changes, or structural adjustments occur.
-
The index is reviewed annually to account for share changes in constituent companies. Additions occur when new banks list, while deletions result from delistings, suspensions, or financial failures. The divisor is recalculated to maintain index accuracy.
-
If a constituent undergoes mergers, takeovers, or restructuring, adjustments are made accordingly. For instance, in a merger between index members, the surviving entity remains, while new eligible entities may be added. Suspended stocks lasting over 30 days are removed unless relisted.
-
Changes in share capital, such as rights issues or employee share schemes, trigger adjustments in constituent weightings. Significant corporate actions like stock splits, dividends, or bonus issues may require divisor changes to ensure index stability. The NSE issues timely notices on adjustments. Divisor changes ensure that corporate actions do not distort index performance.
-
The index comprises 11 banks: ABSA Kenya, Stanbic, Diamond Trust, Equity Group, I&M, KCB Group, NCBA, Standard Chartered Kenya, Co-operative Bank, BK Group, and HF Group.
The Banking Sector Index increased by 23.0% to 203.7 on 31st December 2025 from 165.6 recorded on 1st October 2025(Inception date) attributable to losses recorded by large cap stocks such as NCBA, Co-Operative Bank and KCB of 18.7%, 15.7% and 15.4% respectively. It is expected to deliver wide-ranging benefits to the market by serving as a transparent benchmark to guide portfolio allocation and investment decision-making, enhancing visibility for listed banks while supporting sector-based research and analysis. It will equally provide a foundation for product innovation such as Exchange Traded Funds (ETFs) and other index-linked products, thereby deepening market activity and broadening investor participation
-
NSE 25 Share Index Update and Sasini Plc Inclusion
During the year, the Nairobi Securities Exchange (NSE) announced the inclusion of Sasini Plc as a constituent in the NSE 25 Share Index to replace TransCentury Plc following the court order placing it under receivership and subsequent suspension of trading of TransCentury Plc and its subsidiary East Africa Cables. The update came after NSE had conducted annual review of its benchmarks in an effort to align its indices with global best practices and to ensure its benchmark indices provide a true representation of the Kenyan equity market’s performance and composition. The NSE 25 Share Index is a market capitalization weighted index that tracks the performance of 25 select companies listed on the Nairobi Securities Exchange. The constituents are selected based on liquidity, market activity, and free-float market capitalization, ensuring a balanced representation of the Kenyan equity market. Banking sector dominates with 11 companies in NSE 25 followed by insurance, manufacturing, energy and petroleum with 5, 3 and 2 companies respectively and with the agricultural, investment, investments services and telecommunication sector being represented by a company each. In line with global best practices, NSE remains committed to conducting annual reviews of its benchmark indices the NSE 10, NSE 20, and NSE 25 to ensure they remain robust, transparent, and reflective of prevailing market dynamics. These periodic reviews not only uphold the integrity of the market but also enhance investor confidence by offering reliable performance benchmarks to guide investment decisions and portfolio management.
-
Share Purchase and Consolidation
During the year, consolidation activity remained a key highlight, with sector players pursuing acquisitions and mergers to form larger, better-capitalized, and more stable entities. The following were some of the major M&A activities in 2025.
-
On May 30, 2025, Access Bank Plc completed the acquisition of 100% of National Bank of Kenya Limited (NBK) from KCB Group Plc, following the March 2024 announcement. The transaction valued NBK at Kshs 13.3 bn, representing 1.3x book value, with NBK’s book value standing at Kshs 10.6 bn as of December 2023. This acquisition marks a strategic milestone for Access Bank, expanding its footprint in Kenya and supporting its five-year growth plan. The transaction follows KCB’s 2019 rescue acquisition of NBK, which was supervised by the Central Bank of Kenya. For more information, please see our Kenya Listed Banks Q3’2025,
-
In April 2025, Sidian Bank disclosed that the founders and other individual shareholders sold 728,525 shares (16.6% stake) to Pioneer General Insurance Limited, Pioneer Life Investments Limited, Wizro Enterprises Limited, Afrah Limited, and Telesec Africa Limited. The transaction amounted to Kshs 0.8 bn, representing a 1.0x P/Bv multiple. This follows the earlier October 2023 acquisition when the same investors acquired 38.9% stake in the lender, consolidating their ownership position in Sidian Bank. For more information, please see our Cytonn Weekly #37.2025
Below is a summary of the deals in the last 10 years that have either happened, been announced or expected to be concluded:
|
Cytonn Report: Banking Sector Deals and Acquisitions |
||||||
|
Acquirer |
Bank Acquired |
Book Value at Acquisition (Kshs bn) |
Transaction Stake |
Transaction Value (Kshs bn) |
P/Bv Multiple |
Date |
|
Pioneer General Insurance and four other companies |
Sidian Bank |
5.0 |
16.57% |
0.8 |
1.0x |
Apr-24 |
|
Access Bank PLC (Nigeria)* |
National Bank of Kenya |
10.6 |
100.00% |
13.3 |
1.3x |
Mar-24* |
|
Pioneer General Insurance and two other companies |
Sidian Bank |
5.0 |
38.91% |
2.0 |
1.0x |
Oct-23 |
|
Equity Group |
Cogebanque PLC ltd |
5.7 |
91.13% |
6.7 |
1.3x |
Dec-23 |
|
Shorecap III |
Credit Bank Plc |
3.6 |
20.00% |
0.7 |
1.0x |
Jun-23 |
|
Premier Bank Limited |
First Community Bank |
2.8 |
62.50% |
Undisclosed |
N/A |
Mar-23 |
|
KCB Group PLC |
Trust Merchant Bank (TMB) |
12.4 |
85.00% |
15.7 |
1.5x |
Dec-22 |
|
Equity Group |
Spire Bank |
Unknown |
Undisclosed |
Undisclosed |
N/A |
Sep-22* |
|
Access Bank PLC (Nigeria)* |
Sidian Bank |
4.9 |
83.40% |
4.3 |
1.1x |
June-22* |
|
KCB Group |
Banque Populaire du Rwanda |
5.3 |
100.00% |
5.6 |
1.1x |
Aug-21 |
|
I&M Holdings PLC |
Orient Bank Limited Uganda |
3.3 |
90.00% |
3.6 |
1.1x |
Apr-21 |
|
KCB Group** |
ABC Tanzania |
Unknown |
100.00% |
0.8 |
0.4x |
Nov-20* |
|
Co-operative Bank |
Jamii Bora Bank |
3.4 |
90.00% |
1 |
0.3x |
Aug-20 |
|
Commercial International Bank |
Mayfair Bank Limited |
1.0 |
51.00% |
Undisclosed |
N/A |
May-20* |
|
Access Bank PLC (Nigeria) |
Transnational Bank PLC. |
1.9 |
100.00% |
1.4 |
0.7x |
Feb-20* |
|
Equity Group ** |
Banque Commerciale Du Congo |
8.9 |
66.50% |
10.3 |
1.2x |
Nov-19* |
|
KCB Group |
National Bank of Kenya |
7.0 |
100.00% |
6.6 |
0.9x |
Sep-19 |
|
CBA Group |
NIC Group |
33.5 |
53%.47% |
23 |
0.7x |
Sep-19 |
|
Oiko Credit** |
Credit Bank |
3.0 |
22.80% |
1 |
1.5x |
Aug-19 |
|
CBA Group** |
Jamii Bora Bank |
3.4 |
100.00% |
1.4 |
0.4x |
Jan-19 |
|
AfricInvest Azure |
Prime Bank |
21.2 |
24.20% |
5.1 |
1.0x |
Jan-18 |
|
KCB Group |
Imperial Bank |
Unknown |
Undisclosed |
Undisclosed |
N/A |
Dec-18 |
|
SBM Bank Kenya |
Chase Bank Ltd |
Unknown |
75.00% |
Undisclosed |
N/A |
Aug-18 |
|
DTBK |
Habib Bank Kenya |
2.4 |
100.00% |
1.8 |
0.8x |
Mar-17 |
|
SBM Holdings |
Fidelity Commercial Bank |
1.8 |
100.00% |
2.8 |
1.6x |
Nov-16 |
|
M Bank |
Oriental Commercial Bank |
1.8 |
51.00% |
1.3 |
1.4x |
Jun-16 |
|
I&M Holdings |
Giro Commercial Bank |
3.0 |
100.00% |
5 |
1.7x |
Jun-16 |
|
Mwalimu SACCO |
Equatorial Commercial Bank |
1.2 |
75.00% |
2.6 |
2.3x |
Mar-15 |
|
Centum |
K-Rep Bank |
2.1 |
66.00% |
2.5 |
1.8x |
Jul-14 |
|
GT Bank |
Fina Bank Group |
3.9 |
70.00% |
8.6 |
3.2x |
Nov-13 |
|
Average |
|
|
73.3% |
|
1.3x |
|
|
Average: 2013 to 2018 |
|
|
73.5% |
|
1.7x |
|
|
Average: 2019 to 2025 |
|
|
73.2% |
|
1.0x |
|
|
* Announcement Date ** Deals that were dropped |
||||||
Source: Cytonn Research
-
Kalahari Cement Limited to Acquire Strategic Stake in East African Portland Cement Plc
On 31st July 2025, Kalahari Cement Limited (Kalahari or the Offeror), a Kenyan investment vehicle backed by Pacific Cement Limited and Comercio Et Consiel Limited, issued a formal notice of intention to acquire a controlling stake in East African Portland Cement Plc (EAPC), a publicly listed cement manufacturer on the Nairobi Securities Exchange (NSE). The transaction is structured as a direct acquisition of shares from two existing foreign shareholders:
-
13.1 mn shares from Associated International Cement Limited (AIC)
-
13.2mn shares from Cementia Holding AG (Cementia)
The combined acquisition of 26.3 mn shares represents 29.2% of EAPC’s issued share capital, and will give Kalahari effective control of the company. The proposed consideration is Kshs 27.30 per share, to be settled in USD. Kalahari has applied for an exemption from making a mandatory take-over offer to the remaining shareholders, pursuant to Regulation 5 of the Capital Markets (Take-Overs & Mergers) Regulations, 2002. The exemption is sought on grounds that the deal constitutes a strategic investment intended to support EAPC’s turnaround and long-term sustainability. Notably, Kalahari has no intention to delist EAPC from the NSE post-transaction.
The acquisition of a controlling stake in East African Portland Cement Plc (EAPC) represents a strategic move by Kalahari Cement Limited, a non-operating holding company established to manage and consolidate investments in the regional cement and infrastructure sectors. Backed by Pacific Cement Limited and Comercio Et Consiel Limited, both linked to the broader Amsons Group, Kalahari’s entry into EAPC is intended to bring long-term capital, governance oversight, and strategic direction without direct operational involvement. The investment aligns with Kalahari’s broader mandate of acquiring and stewarding critical industrial assets in East and Southern Africa through a portfolio-driven approach.
For EAPC, the transaction signals the arrival of a committed institutional shareholder with the resources and strategic interest to support its turnaround and future growth. While day-to-day operations will remain with management, EAPC stands to benefit from Kalahari’s affiliations with operating entities such as Bamburi Cement Plc, enabling access to technical support, regional market insights, and supply chain efficiencies. The investment underscores confidence in Kenya’s cement industry and reflects a long-term vision of regional consolidation, value unlocking, and industrial resilience.
Key Conditions Precedent The transaction is subject to:
-
Approval by the Competition Authority of Kenya
-
Approval from the Capital Markets Authority (CMA) for exemption and block/private trade
-
Approval by the Ministry of Mining for the change in control under the Mining Act
-
A potential shareholder circular if required by the CMA
-
Financing guarantees if any portion of the consideration is not paid upfront in cash
|
Cytonn Report: EAPC Shareholding (Post-Transaction Snapshot) |
|
|
Shareholder |
Approximate Stake |
|
Kalahari (Post Acquisition) |
29.2% |
|
Bamburi Cement Plc |
12.5% |
|
National Treasury |
25.3% |
|
NSSF |
27.0% |
|
Others |
6.0% |
Source: Kalahari
If approved, the transaction would mark one of the most significant strategic investments into a listed manufacturing company in recent years, reinforcing confidence in Kenya’s capital markets and supporting ongoing reforms aimed at improving corporate governance and investor protection in publicly listed.
d. Sanlam Announces Rights Issue Results
During the year, Sanlam released the results of its earlier approved rights issue, announcing that the rights were fully subscribed including underwriting with a total subscription rate of 81.5% before underwriting, having received offers worth Ksh 2.0 bn against the offered Ksh 2.5 bn. Sanlam Allianz Africa Proprietary Limited, acquired an extra 92.3 mn shares at a cost of Kshs 461.5 mn in its role as the underwriter (buyer of last resort) in the rights issue. Notably, the Group accepted 402.6 million shares under the entitlement option against the offered 500.0 million, translating to an acceptance rate of 80.5%
The rights issue offered a total of 500,000,000 new shares at an offer price of Ksh 5.0 per share. The entitlement ratio was 125 shares for every 36 ordinary shares held, with a minimum success rate of 50.0%. If fully subscribed, the rights issue was expected to raise gross proceeds of Ksh 2.5 bn.
The results revealed that a total of 402,623,246 shares were accepted under entitlement, representing a take-up rate of 80.5%, with a total value of Ksh 2.0 bn. Additionally, 5,062,718 shares were applied for under additional shares, valued at Kshs 25.3 mn. Despite the strong take-up, there remained 92,314,036 untaken shares, equivalent to 18.5% of the offer. In line with a pre-arranged underwriting agreement dated 3 April 2025 with Sanlam Allianz Africa Proprietary Limited (SAZ), these remaining shares were fully subscribed by the underwriter. This intervention ensured the company met its funding target, bringing the total gross proceeds of the Rights Issue to Kshs 2.5 bn, and raising the final subscription performance rate to 100.0%. The table below summarizes the rights issue results statistics;
|
Cytonn Report: Sanlam Rights Issue Results Summary |
|
|
Data |
Statistic |
|
Total number of new shares accepted under entitlement |
402,623,246 |
|
Total value of new shares accepted under entitlement |
Kshs 2,013,116,230 |
|
Take up percentage under entitlement |
80.5% |
|
Total number of additional new shares applied for under additional shares |
5,062,718 |
|
Total value of additional new shares applied for under additional shares |
Kshs 25,313,590 |
|
Grand total number of new shares applied for under the rights issue (entitlement shares + additional shares) |
407,685,964 |
|
Grand total value of new shares applied for under the rights issue (Entitlement shares + additional shares) |
Ksh 2,038,429,820 |
|
Total Subscription Rate before Underwriting (%) |
81.5% |
|
Total Number of Untaken Shares accepted under the Underwriting Agreement |
92,314,036 |
|
Total Value of Untaken Shares accepted under the Underwriting Agreement |
Kshs 461,570,180 |
|
Total Subscription Performance Rate including Underwriting |
100.0% |
Source: Sanlam
The proceeds from the rights issue will be directed towards several key areas aligned with Sanlam Kenya’s long-term strategy. Primarily, the Group aims to use this capital to reduce its long-term debt levels and support its return to profitability. Before the rights issue, Sanlam Kenya’s debt to equity ratio was significantly high, being the highest among peer insurance companies. Post-rights issue, Sanlam Kenya’s debt to equity will reduce by 56.5% to 7.9 from 19.4 attributable to the decline in its debt level. The table below shows the debt to equity ratio before and after the rights issue;
|
Sanlam Kenya's Leverage Ratio |
Before the rights issue |
After the rights issue |
Change (% points) |
|
Debt to Equity ratio |
19.4 |
7.9 |
(56.5%) |
Compared to peer insurance companies in Kenya, Sanlam Kenya will have a more balanced leverage position following the rights issue. The tables above illustrate Sanlam Kenya’s debt-to-equity ratios relative to its peers;
|
Cytonn Report: Listed Insurance Companies Debt to Equity ratios (FY’2024) |
|
|
Insurance Company |
Debt to Equity Ratio |
|
Kenya Re Insurance Corporation Ltd |
0.3 |
|
Jubilee Holdings Ltd |
3.2 |
|
Liberty Kenya Holdings Plc |
3.5 |
|
CIC Insurance Group Plc |
4.6 |
|
Britam Holdings Plc |
6.1 |
|
Sanlam Kenya Plc * |
19.4 |
|
Sanlam Kenya Plc ** |
7.9 |
*Before the rights issue
**After the rights issue
Going forward, it is our expectation that Sanlam Kenya’s success will hinge on its ability to effectively deploy the new capital to fuel growth and reduce its debt levels. In addition, the Group’s strategy of strengthening its capital and investments through divesting from real estate, restructuring its debt portfolio and closing dormant subsidiaries has proven to be effective. Following a return to profitability in 2024, with a significant 933.5% increase in Profit After Tax to Kshs 1.1 bn, from the Kshs 0.1 bn loss recorded in FY’2023 and the rights issue, shareholders will be watching closely for improved performance and increased market share in Kenya’s insurance sector
Universe of coverage:
|
Cytonn Report: Equities Universe of Coverage |
|||||||||||
|
Company |
Price as at 24/12/2024 |
Price as at 02/01/2026 |
w/w change |
m/m change |
YTD Change 2025 |
Year Open 2025 |
Target Price* |
Dividend Yield*** |
Upside/ Downside** |
P/TBv Multiple |
Recommendation |
|
I&M Group |
42.4 |
42.8 |
0.9% |
(3.3%) |
17.9% |
36.0 |
53.1 |
7.0% |
31.1% |
0.7x |
Buy |
|
NCBA |
83.0 |
85.0 |
2.4% |
1.2% |
64.7% |
51.0 |
101.3 |
6.5% |
25.6% |
1.4x |
Buy |
|
ABSA Bank |
23.0 |
24.9 |
8.0% |
13.0% |
31.0% |
18.9 |
28.3 |
7.0% |
20.9% |
1.6x |
Buy |
|
Diamond Trust Bank |
114.0 |
114.8 |
0.7% |
3.6% |
71.5% |
66.8 |
129.4 |
6.1% |
18.9% |
0.4x |
Accumulate |
|
Equity Group |
65.8 |
67.0 |
1.9% |
6.4% |
39.1% |
48.0 |
75.2 |
6.3% |
18.6% |
1.2x |
Accumulate |
|
Co-op Bank |
23.7 |
23.9 |
0.8% |
4.6% |
37.2% |
17.5 |
26.8 |
6.3% |
18.4% |
0.8x |
Accumulate |
|
Standard Chartered Bank |
300.0 |
299.8 |
(0.1%) |
3.4% |
4.2% |
285.3 |
307.9 |
15.0% |
17.7% |
1.7x |
Accumulate |
|
Stanbic Holdings |
197.3 |
197.8 |
0.3% |
8.1% |
41.5% |
139.8 |
205.5 |
10.5% |
14.4% |
1.2x |
Accumulate |
|
Jubilee Holdings |
329.8 |
322.5 |
(2.2%) |
3.1% |
91.7% |
174.8 |
333.5 |
4.2% |
7.6% |
0.5x |
Hold |
|
CIC Group |
4.7 |
4.5 |
(2.8%) |
(0.4%) |
113.6% |
2.1 |
4.8 |
2.9% |
7.5% |
1.2x |
Hold |
|
Britam |
9.0 |
9.1 |
0.9% |
4.6% |
56.4% |
5.8 |
9.5 |
0.0% |
5.1% |
0.8x |
Hold |
|
KCB Group |
62.5 |
65.8 |
5.2% |
11.9% |
55.1% |
42.4 |
65.8 |
4.6% |
4.6% |
0.8x |
Lighten |
|
*Target Price as per Cytonn Analyst estimates **Upside/ (Downside) is adjusted for Dividend Yield ***Dividend Yield is calculated using FY’2024 Dividends |
|||||||||||
We are “Bullish” on the Equities markets in the short term due to current attractive valuations, lower yields on short-term government papers and expected global and local economic recovery, and, “Neutral” in the long term due to persistent foreign investor outflows. With the market currently trading at a discount to its future growth (PEG Ratio at 0.9x), we believe that investors should reposition towards value stocks with strong earnings growth and that are trading at discounts to their intrinsic value. We expect the current high foreign investors sell-offs to continue weighing down the economic outlook in the short term.
In 2025, the general Real Estate sector continued to witness considerable growth in activity in terms of property transactions and development activities. Consequently, the sector’s activity contribution to Gross Domestic Product (GDP) grew by 5.5% to Kshs 364.6 bn in Q2’2025, from Kshs 339.2 bn recorded during the same period in 2024. In addition, the sector contributed 8.1% to the country’s GDP, to remain relatively unchanged from the 8.1% recorded in Q1’2025. Cumulatively, the Real Estate and construction sectors contributed 15.3% to GDP, 3.8% points decrease from 19.1% in Q2’2024, attributable to decline in construction contribution to GDP by 3.7% points, to 5.0% in Q2’2025, from 8.7% recorded in Q2’2024. The graph below highlights the Real Estate and Construction sectors’ contribution to GDP from 2020 to Q2’2025;

Source: Kenya National Bureau of Statistics (KNBS)
In 2025, Real Estate was promoted by key initiatives as follows:
-
Government’s continued focus on Affordable Housing: the Kenyan government has sustained its strong commitment to the Affordable Housing Program (AHP), a key pillar under the Bottom-Up Economic Transformation Agenda (BETA). According to the Architectural Association of Kenya’s (AAK) Status of the Built Environment Report 2025, there are 307 ongoing projects across the country, comprising 214,057 housing units. Of these, 77.0% are Affordable Housing Programme units, 10.0% are student housing, 7.0% are institutional staff housing and 6.0% are private projects benefitting from VAT exemptions. The program continues to gain momentum following the operationalization of the Affordable Housing Act, 2024, which introduced the Affordable Housing Levy, a dedicated funding mechanism now actively supporting project financing. The government has also expanded collaborations with county governments and private developers to unlock land and fast-track approvals, further accelerating housing delivery across the country,
-
Infrastructural development: Kenya sustained momentum in infrastructure development, with focus shifting to ongoing government and public-private partnership (PPP) projects aimed at improving connectivity and supporting Real Estate activity. Key highlights in the quarter included progress on Phase II of the Dongo Kundu Bypass, particularly works on the Mwache and Mteza bridges, and continued upgrades of road networks under the Kenya Urban Roads Authority (KURA) in Nairobi and other urban centres. Additionally, reports pointed to new disbursements under the Roads Annuity Program and ongoing construction under the Affordable Housing supporting infrastructure initiative, which includes feeder roads, water and sewer systems in housing project sites. These developments underline the state’s prioritization of infrastructure as a catalyst for economic growth, even as challenges such as high construction costs and delayed contractor payments remain constraints to faster implementation,
-
Provision of affordable mortgage financing: Kenya Mortgage Refinance Company (KMRC) has continued to play a critical role in expanding access to affordable housing finance by offering single- digit fixed-rate, long-term refinancing to Primary Mortgage Lenders (PMLs) such as banks, SACCOs, and microfinance institutions. In Q3’2025, KMRC advanced the implementation of its widened eligibility framework to include non-shareholder SACCOs and microfinance banks, aimed at enabling more institutions to offer low-cost mortgages to underserved segments, particularly low- and middle- income earners. This initiative aligns with the government’s affordable housing agenda by enhancing the availability of sustainable mortgage products. KMRC also sustained its capital-raising efforts through bond issuances to support continued liquidity for mortgage lenders, reinforcing its mandate to deepen Kenya’s mortgage market.
-
Aggressive expansion pursued by retailers: The retail landscape has seen a surge in growth, with both domestic and international retailers like Naivas, QuickMart, China Square, Panda Mart, and Carrefour aggressively expanding their market presence. These retailers are capitalizing on the opportunities created by the exit of distressed chains like Choppies, Nakumatt, Tuskys, and Uchumi.
-
Kenya’s recognition as a regional business hub: Kenya continues to enjoy recognition as a regional business hub. As a result, foreign entities have continued to open business operations in Kenya, boosting the demand for both commercial and residential Real Estate. Increased business activity has driven up demand for office space, apartments, and housing near business hubs, leading to the development of new projects, increased property values, and job creation in the construction sector,
-
Positive Demographics: with relatively high urbanization and population growth rates of 2.8% p.a and 2.0% p.a, respectively, against the global average of 1.4% p.a and 1.0% p.a, respectively, as at 2024, there is a sustained demand for more housing units in the country,
-
Increasing Investor Confidence: Increase in investor confidence has greatly influenced hospitality sector and this is evident through mergers, acquisitions and expansions of hotels. Furthermore, Kenya National Bureau of Statistics’ Leading Economic Indicators – September 2025 report highlighted that arrivals through Jomo Kenyatta International Airport (JKIA) and Moi International Airport (MIA) registered an increase of 52.2% to 745,720 visitors in Q3’2025 from 489,831 visitors recorded in Q3’2024. Notably, the Hotel Chain Development Pipelines in Africa 2025 Report ranked Nairobi at 6th position by planned number rooms with 26 hotels and 4,344 rooms in the pipeline,
-
Special Built Developments: There has been an increased popularity of purpose-built properties to host Student housing, medical centers, Diplomatic residentials, data centers which offer potential for growth to the Real Estate sector through alternative markets. Due to these assets classes, the industry remains resilient despite the rapidly changing technological and economic environments, and,
-
Easing Construction Costs: construction costs in Kenya showed signs of stabilization, largely supported by subdued inflation of 0.6% y/y as of July 2025 and a relatively stable currency. According to the Kenya National Bureau of Statistics (KNBS) Q2’2025 Construction Input Price Indices Report, the Building Cost Index (BCI) increased slightly to 119.8 in Q2’2025 from 119.1 in Q1’2025, marking a 0.6% quarter-on-quarter increase. This indicates a moderation in construction cost growth, driven by steadier prices for key inputs such as fuel, steel and transport. Despite the easing overally, prices for specific materials continued to rise modestly; cement increased by 2.6%, quarry products by 2.7%, and sand by 1.4%, suggesting that while input inflation is moderate, developers are still facing some upward pressure in select areas.
Despite the above drivers, the sector’s optimal performance is expected to be hampered by the following factors in 2025:
-
Existing oversupply of physical space in select sectors: With approximately 5.7 mn SQFT in the NMA commercial office market, approximately 3.0 mn SQFT in the Nairobi Metropolitan Area (NMA) retail market, with the rest of the Kenyan retail market having an oversupply of approximately 1.7 mn SQFT. This has led to prolonged vacancy rates in the respective Real Estate sectoral themes,
-
Subdued REITs Market: The REITs market in Kenya continues to be subdued owing to various challenges such as the large capital requirements of Kshs 100.0 mn for trustees compared to Kshs. 10 mn for pension fund Trustees, which limits the role to banks, prolonged approval process for REITs, only a few legal entities capable of incorporating REITs, high minimum subscription amounts or offer parcels set at Kshs 0.1 mn for D-REITs and 5.0 mn for restricted I-REITs and lack of adequate knowledge of the financial asset class by investors,
-
Constrained financing to developers: Financing for real estate developers remains constrained due to elevated borrowing costs and increased lending caution, with lenders demanding more collateral given the heightened credit risk in the sector. Recent data points to a worsening of overall bank asset quality: the gross non-performing loans (NPL) ratio in the banking sector worsened to 17.6% by June 2025, up from 17.4% in March 2025. Among listed banks, the weighted average NPL ratio also deteriorated, rising to 14.0% in Q1’2025 from 13.5% a in 2024. Elevated non-performing loans squeeze banks’ capacity to extend credit, tighten lending standards and heighten risk perceptions, all of which exacerbate financing constraints for real estate developers.
The table below shows the annual Real Estate rental yields for existing properties in all the sectors from FY’2020 to FY’2025 ;
|
Cytonn Report: Annual Real Estate Rental Yields Summary Table, for Existing Properties |
|||||||
|
FY’2020 |
FY’2021 |
FY’2022 |
FY’2023 |
FY’2024 |
FY’2025 |
Y/Y Change (% Points) |
|
|
Average Rental Yield |
6.1% |
6.5% |
6.8% |
6.1% |
7.5% |
7.8% |
0.3% |
Source: Cytonn Research
Sectoral Market Performance
-
Residential Sector
|
All values are in Kshs unless stated otherwise |
|||||||||||
|
Cytonn Report: Residential Apartments Summary FY'2025 |
|||||||||||
|
Area |
Average of Price per SQM FY'2025 |
Average of Rent per SQM FY'2025 |
Average of Rental Yield FY'2025 |
Average of Price Appreciation FY'2025 |
Total Returns FY'2025 |
Average of Rental Yield FY'2024 |
Average of Price Appreciation FY'2024 |
Total Returns FY'2024 |
y/y ∆ in Rental Yield |
y/y ∆ in Price Appreciation |
y/y ∆ in Total Returns |
|
Detached Units |
|||||||||||
|
Lower Middle |
81,256 |
388 |
5.6% |
1.7% |
7.3% |
4.9% |
0.6% |
5.5% |
0.7% |
1.1% |
1.8% |
|
Upper Middle |
142,647 |
624 |
5.1% |
0.9% |
6.0% |
5.0% |
0.3% |
5.3% |
0.1% |
0.6% |
0.7% |
|
High End |
211,239 |
932 |
5.1% |
0.5% |
5.6% |
4.8% |
0.1% |
4.9% |
0.3% |
0.4% |
0.7% |
|
Detached Grand Average |
145,047 |
648 |
5.3% |
1.0% |
6.3% |
4.9% |
0.4% |
5.2% |
0.4% |
0.7% |
1.1% |
|
Apartment |
|||||||||||
|
Lower Mid-End Satellite Towns |
87,692 |
497 |
6.4% |
1.3% |
7.7% |
6.3% |
(0.1%) |
6.2% |
0.1% |
1.4% |
1.5% |
|
Upper Mid-End |
133,727 |
834 |
7.0% |
0.6% |
7.6% |
6.0% |
1.2% |
7.2% |
1.0% |
(0.6%) |
0.4% |
|
Lower Mid-End Suburbs |
105,768 |
455 |
5.8% |
(0.5%) |
5.3% |
5.7% |
0.0% |
5.7% |
0.1% |
(0.5%) |
(0.4%) |
|
Apartment Grand Average |
109,063 |
595 |
6.4% |
0.5% |
6.8% |
6.0% |
0.4% |
6.4% |
0.4% |
0.1% |
0.5% |
|
Residential Market Average |
127,055 |
622 |
5.9% |
0.8% |
6.6% |
5.4% |
0.4% |
5.8% |
0.4% |
0.4% |
0.8% |
During FY’2025, the NMA residential sector recorded a marginal increase in performance, with the average total returns to investors coming in at 6.6%, a 0.8%-point increase from 5.8% recorded in FY’2024. The performance was attributed to an increase in the residential average y/y price appreciation which came in at 0.8% in FY’2025, 0.4%-points higher than the 0.4% appreciation recorded in FY’2024, driven by increased property transactions during the year. On the other hand, the average rental yield came in at 5.9% in FY’2025, recording a 0.5%-points increase from the 5.4% rental yield recorded in FY’2024. This was driven by an increase in the average rent per SQM by 9.7% to Kshs 622, from Kshs 567 recorded in FY’2024. The table below shows the NMA residential sector’s performance during FY’2024 and FY’2025;
Source: Cytonn Research
-
Detached Units Performance
|
All values are in Kshs unless stated otherwise |
|||||||||
|
Cytonn Report: Detached Units Summary FY'2025 |
|||||||||
|
Area |
Average of Price per SQM FY'2025 |
Average of Rent per SQM FY'2025 |
Average of Occupancy FY'2025 |
Average of Uptake FY'2025 |
Average of Annual Uptake FY'2025 |
Average of Rental Yield FY'2025 |
Average of Price Appreciation FY'2025 |
Total Returns |
|
|
High End |
|||||||||
|
Lower Kabete |
169,047 |
628 |
95.9% |
93.4% |
10.5% |
4.7% |
1.9% |
6.6% |
|
|
Runda |
259,964 |
1,182 |
96.8% |
96.8% |
8.1% |
5.5% |
0.3% |
5.9% |
|
|
Karen |
194,187 |
994 |
92.6% |
93.8% |
10.9% |
5.6% |
(0.2%) |
5.4% |
|
|
Rosslyn |
195,018 |
903 |
94.1% |
98.4% |
9.5% |
5.3% |
0.0% |
5.3% |
|
|
Kitisuru |
232,804 |
823 |
88.9% |
85.9% |
9.3% |
4.0% |
1.3% |
5.2% |
|
|
Average |
210,204 |
906 |
93.7% |
93.6% |
9.7% |
5.0% |
0.7% |
5.7% |
|
|
Upper Middle |
|||||||||
|
South B/C |
123,594 |
828 |
91.2% |
88.8% |
9.6% |
7.5% |
1.7% |
9.2% |
|
|
Redhill & Sigona |
92,806 |
503 |
93.2% |
98.4% |
10.3% |
6.2% |
1.5% |
7.7% |
|
|
Loresho |
148,655 |
749 |
88.7% |
88.9% |
9.3% |
5.4% |
1.2% |
6.6% |
|
|
Langata |
119,711 |
470 |
93.1% |
90.2% |
7.6% |
4.5% |
1.0% |
5.5% |
|
|
Runda Mumwe |
164,028 |
702 |
91.1% |
96.2% |
13.4% |
4.7% |
0.0% |
4.7% |
|
|
Lavington |
191,594 |
623 |
87.2% |
86.5% |
8.3% |
3.5% |
0.7% |
4.2% |
|
|
Ridgeways |
176,697 |
388 |
88.8% |
90.2% |
8.9% |
2.7% |
0.0% |
2.7% |
|
|
Average |
145,298 |
609 |
90.5% |
91.3% |
9.6% |
4.9% |
0.9% |
5.8% |
|
|
Lower Middle |
|||||||||
|
Rongai |
89,895 |
708 |
96.9% |
95.9% |
10.6% |
9.8% |
1.1% |
10.8% |
|
|
Thika |
65,443 |
352 |
87.1% |
84.5% |
9.8% |
6.1% |
4.5% |
10.6% |
|
|
Juja |
99,737 |
357 |
90.7% |
94.4% |
14.6% |
5.2% |
3.0% |
8.2% |
|
|
Kitengela |
65,774 |
302 |
93.6% |
93.3% |
9.8% |
5.2% |
1.5% |
6.7% |
|
|
Syokimau/Mlolongo |
76,063 |
419 |
90.8% |
87.5% |
9.4% |
6.1% |
0.4% |
6.4% |
|
|
Donholm & Komarock |
94,549 |
425 |
86.5% |
91.4% |
9.1% |
4.8% |
1.0% |
5.9% |
|
|
Athi River |
87,445 |
360 |
91.3% |
96.4% |
9.4% |
4.6% |
1.2% |
5.9% |
|
|
Ngong |
79,719 |
399 |
90.2% |
92.3% |
7.6% |
5.5% |
0.2% |
5.7% |
|
|
Average |
82,328 |
415 |
90.9% |
92.0% |
10.1% |
5.9% |
1.6% |
7.5% |
|
|
Detached Grand Average |
145,943 |
643 |
91.7% |
92.3% |
9.8% |
5.3% |
1.0% |
6.2% |
|
The table below shows the NMA residential sector detached units’ performance during FY’2025;
Source: Cytonn Research
The key take-outs from the table include;
-
Average Total Returns – The average total returns to detached units’ investors came in at 6.3%, 1.1% higher than the 5.2% recorded in FY’2024. The performance was driven by a 0.4%-points increase in the average rental yield to 5.3% in FY’2025, from 4.9% recorded in FY’2024. The increase in performance was attributable to a 3.9% increase in the average rents per SQM to Kshs 643 in FY’2025, from Kshs 619 recorded in FY’2024,
-
Segment Performance – The best-performing segment was the Lower-middle segment offering an average total return of 7.5%, attributable to a relatively high average price appreciation of 1.6%, 0.6%-points higher than the detached market average appreciation of 1.0%. The impressive performance of the segment was driven by returns from well-performing nodes such as Rongai, Thika and Juja, which have continued to offer relatively high returns to investors, and,
-
Nodal Performance – Overall, Kitengela was the best-performing node, offering the highest returns at 10.8%, 4.6% points higher than the detached market average of 6.2%, driven by a relatively high y/y price appreciation of 9.8%. The node has seen increased detached unit property investments owing to an inflow of residents brought about by the enhanced accessibility to the Nairobi CBD through various roads such as the Southern By-pass. Thika followed with an average total return of 10.6%, 4.6% points higher than the detached market average of 6.2%.
-
Apartments Performance
The table below shows the NMA residential sector apartments’ performance during FY’2025;
|
All values are in Kshs unless stated otherwise |
|||||||||
|
Cytonn Report: Residential Apartments Summary FY'2025 |
|||||||||
|
Area |
Average of Price per SQM FY'2025 |
Average of Rent per SQM FY'2025 |
Average of Occupancy FY'2025 |
Average of Uptake FY'2025 |
Average of Annual Uptake FY'2025 |
Average of Rental Yield FY'2025 |
Average of Price Appreciation FY'2025 |
Total Returns |
|
|
Upper Mid-End |
|||||||||
|
Kilimani |
109,009 |
729 |
95.8% |
93.1% |
14.2% |
7.6% |
1.2% |
8.7% |
|
|
Westlands |
162,893 |
970 |
93.3% |
93.7% |
13.8% |
6.9% |
0.8% |
7.6% |
|
|
Kileleshwa |
137,430 |
766 |
96.2% |
92.9% |
10.1% |
6.7% |
0.6% |
7.3% |
|
|
Upperhill |
133,679 |
885 |
92.3% |
92.7% |
10.1% |
7.5% |
(0.7%) |
6.8% |
|
|
Parklands |
123,626 |
885 |
93.2% |
94.8% |
9.7% |
6.3% |
(0.1%) |
6.1% |
|
|
Average |
133,327 |
847 |
94.1% |
93.4% |
11.6% |
7.0% |
0.3% |
7.3% |
|
|
Lower Mid-End Suburbs |
|||||||||
|
Dagoretti |
95,222 |
236 |
94.9% |
81.5% |
9.6% |
9.1% |
(0.5%) |
8.6% |
|
|
Imara Daima |
82,846 |
344 |
95.7% |
90.1% |
8.7% |
5.0% |
3.1% |
8.1% |
|
|
Race Course/Lenana |
97,047 |
638 |
96.5% |
96.7% |
13.2% |
7.5% |
0.0% |
7.6% |
|
|
Waiyaki Way |
132,218 |
463 |
92.8% |
93.3% |
12.6% |
5.7% |
0.4% |
6.1% |
|
|
Langata |
111,997 |
490 |
95.5% |
91.5% |
9.4% |
5.1% |
0.7% |
5.8% |
|
|
South B |
109,317 |
494 |
93.4% |
97.8% |
11.6% |
4.9% |
0.3% |
5.3% |
|
|
South C |
118,331 |
467 |
85.3% |
96.2% |
11.7% |
4.1% |
0.0% |
4.1% |
|
|
Kahawa West |
84,602 |
486 |
93.2% |
93.9% |
7.7% |
6.6% |
(9.1%) |
(2.5%) |
|
|
Average |
103,948 |
452 |
93.4% |
92.6% |
10.6% |
6.0% |
(0.6%) |
5.4% |
|
|
Lower Mid-End Satellite Towns |
|||||||||
|
Kikuyu |
88,127 |
469 |
96.1% |
96.5% |
13.8% |
6.3% |
8.2% |
14.5% |
|
|
Ngong |
75,051 |
485 |
98.3% |
93.7% |
10.9% |
6.8% |
3.0% |
9.8% |
|
|
Syokimau |
71,644 |
393 |
90.1% |
91.3% |
10.1% |
6.1% |
1.5% |
7.6% |
|
|
Athi River |
58,236 |
469 |
97.4% |
95.3% |
10.1% |
8.7% |
(1.5%) |
7.2% |
|
|
Rongai |
60,948 |
366 |
91.7% |
91.3% |
12.1% |
6.4% |
0.5% |
6.9% |
|
|
Thindigua |
104,734 |
552 |
92.0% |
90.0% |
11.8% |
6.0% |
0.7% |
6.7% |
|
|
Ruiru |
88,937 |
522 |
92.5% |
90.8% |
11.5% |
6.5% |
0.1% |
6.6% |
|
|
Ruaka |
113,989 |
589 |
91.3% |
90.0% |
20.3% |
5.5% |
0.2% |
5.7% |
|
|
Average |
82,708 |
481 |
93.7% |
92.4% |
12.6% |
6.5% |
1.6% |
8.1% |
|
|
Apartments Grand Average |
106,661 |
593 |
93.7% |
92.8% |
11.6% |
6.5% |
0.4% |
6.9% |
|
Source: Cytonn Research
The key take-outs from the table include;
-
Average Total Returns – The average total returns to apartments’ investors came in at 6.9%, recording a 0.5%-points increase from the 6.4% recorded during FY’2024. The slightly improved performance was driven by a 0.6%-points increase in the average rental yield to 6.5% in FY’2025, from 5.9% recorded in FY’2024. This was driven by a slightly increased apartment property transactions during the period, attributable to 4.0% points increase in the average occupancy to 93.7% in FY’2025 from 91.6% in FY’2024,
-
Segment Performance – The best-performing segment was the lower mid-end satellite towns with average total returns of 8.1%, attributed to a relatively high average y/y price appreciation of 1.6% and rental yield of 6.5%. The impressive performance of the segment was driven by returns from well-performing nodes such as Kikuyu, Ngong and Syokimau that have continued to offer competitive returns to investors in comparison to other segments, and
-
Nodal Performance – Overall, the best-performing node was Kikuyu, offering investors average total returns of 14.5%, 7.6%-points higher than the apartment market average total return of 6.9%. Kikuyu is attracting apartment investments owing to infrastructural development with the roads such as Southern Bypass, proximity to CBD favouring residents in the area and a high number of middle-class families in the area.
For notable highlights during FY’2025, please see our, Cytonn Q1’2025 Markets-Review, Cytonn H1’2025 Markets Review, and, Cytonn Q3’ 2025 Markets Review reports. During Q4’2025;
-
National Treasury disclosed that KMRC’s interventions have helped lift cumulative mortgage lending to Kshs 21.4 bn as at August 2025 and that more than 4,500 affordable home loans were disbursed across 39 counties under its refinancing programme. These loans have an average interest rate of 10.0%, made possible by KMRC’s provision of long-term funding to primary mortgage lenders (PMLs) at approximately 5.0%, which in turn helps reduce borrowing costs for homebuyers. For more information, please see our Cytonn Weekly #52/2025,
-
The State Department of Housing and Urban Development reported that the State missed its affordable housing buyer registration and delivery targets, with 292,326 Kenyans registered on the Boma Yangu platform by June 2025, 41.5% below the government’s initial expectations of onboarding over 500,000 buyers. Official disclosures show that only 292,326 people registered by end-June, while just 2,075 housing units had been completed under the Affordable Housing Programme (AHP) between July 2022 and June 2025, significantly undershooting target of 250,000 units annually signifying 0.8% achievement of the target. The State attributes the slow progress to court cases, delays in passing housing regulations, and the lack of a legal framework to support Housing Levy collections, which constrained funding and construction momentum, despite Kshs 81.4 bn already spent on the programme and a long-term budget of Kshs 627.0 bn up to 2032. For more information, please see our Cytonn Weekly #51/2025,
-
Mi Vida Homes announced the signing of a major development partnership with International Housing Solutions (IHS) to construct 240 housing units in Riruta, Nairobi. The project will incorporate IFC’s EDGE sustainability standards, emphasizing energy efficiency, water conservation and reduced carbon footprints. The housing units will include studio, one-bedroom and three-bedroom apartments, designed to meet growing demand for modern, affordable homes in urban centres. For more information, please see our Cytonn Weekly #46/2025.
We have a NEUTRAL outlook for the NMA residential sector, we expect continued vibrant performance in the residential sector within the country sustained by; i) ongoing residential developments under the Affordable Housing Agenda, aiming to reduce the housing deficit in the country currently estimated at 80.0%, ii) increased investment from local and international investors in the housing sector, iii) favorable demographics in the country, shown by high population and urbanization rates of 2.0% p.a and 2.8% p.a, respectively, leading to higher demand for housing units. However, challenges such as rising construction costs, strain on infrastructure development, and limited access to financing will continue to restrict the optimal performance of the residential sector.
-
Commercial Office Sector
The table below highlights the performance of the Nairobi Metropolitan Area (NMA) Commercial Office sector over time;
|
Cytonn Report: Nairobi Metropolitan Area (NMA) Commercial Office Returns Over Time |
||||||||||
|
Year |
Q1'2024 |
H1'2024 |
Q3'2024 |
FY'2024 |
Q1'2025 |
H1'2025 |
Q3'2025 |
FY'2025 |
∆ FY'2024/FY'2025 |
|
|
Occupancy % |
80.1% |
80.1% |
79.6% |
80.7% |
80.3% |
80.9% |
82.4% |
82.3% |
1.6% |
|
|
Asking Rents (Kshs/SQFT) |
103 |
103 |
104 |
105 |
105 |
105 |
105 |
106 |
1.5% |
|
|
Average Prices (Kshs/SQFT) |
12,665 |
12,677 |
12,677 |
12,614 |
12,614 |
12,673 |
12,681 |
12,699 |
0.7% |
|
|
Average Rental Yields (%) |
7.6% |
7.7% |
7.7% |
7.80% |
7.6% |
7.7% |
7.8% |
7.82% |
0.02% |
|
Source: Cytonn Research
The key take-outs from the table include
-
Average Asking Rents – In FY’2025, average asking rents per SQFT in the NMA increased by 1.5% to Kshs 106 from Kshs 105 in FY’2024 while on, quarter-on-quarter basis (q/q) this performance represented a 1.0% improvement. This performance can be attributable to addition of new Grade A offices to the pipeline; including Eneo at Tatu City, The Mandrake, Matrix One, thereby driving up the asking rents for commercial office spaces.
-
Average Occupancy Rate – In FY’2025, commercial office occupancy showed an improvement in performance by 1.6% points to 82.3% from 80.7% recorded in FY’2024.
-
Average Rental Yield – The average rental yields showed resilience with 0.02%-points increase, coming at 7.82% in FY’2025 from 7.80% in FY’2024. This is attributable to an increase in occupancy by 1.6% during the period under review.
For submarket performance, Westlands and Gigiri emerged as the top performers, achieving an average rental yield of 9.3% and 8.5% respectively in FY’2025, surpassing the market average of 7.8%. This performance can be attributed to several factors: i) a high concentration of Grade A offices in these locations, ii) excellent connectivity to these areas facilitated by roads such as the Nairobi Expressway, Redhill Road, Limuru Road, and the expanded Waiyaki Way, iii) the presence of after-work amenities such as hotels and high-quality social venues, and iv) growing demand for premium office spaces driven by embassies, international organizations, and multinational corporations. In contrast, Mombasa Rd was the least performing node with an average rental yield of 6.5% in FY’2025, 1.3% points lower than the market average of 7.8%. This lower performance can be attributed to: i) a lower concentration of premium Grade A office spaces compared to other nodes, ii) proximity to industrial zones resulting in perceived lower prestige and environmental concerns such as pollution, and, iii) intense competition from other sub-markets further compounds the challenges Mombasa Road faces in attracting tenants and achieving higher rental yields. The table below displays the performance of sub-markets in the Nairobi Metropolitan Area (NMA).
|
Cytonn Report: NMA Commercial Office Submarket Performance FY'2025 |
||||||||||||
|
Area |
Price/SQFT FY'2025 |
Rent/SQFT FY'2025 |
Occupancy FY'2025 |
Rental Yields FY'2025 |
Price/SQFT FY'2024 |
Rent/SQFT FY'2024 |
Occupancy FY'2024 |
Rental Yields FY'2024 |
∆ in Rent |
∆ in Occupancy (% points) |
∆ in Rental Yields (% points) |
|
|
Westlands |
12,478 |
122 |
82.6% |
9.3% |
12,448 |
119 |
80.4% |
8.5% |
2.3% |
2.2% |
0.8% |
|
|
Gigiri |
15,050 |
131 |
81.4% |
8.5% |
14,850 |
131 |
82.6% |
8.8% |
0.0% |
(1.2%) |
(0.3%) |
|
|
Karen |
14,077 |
115 |
83.3% |
8.2% |
14,077 |
115 |
80.9% |
8.2% |
0.0% |
2.4% |
0.0% |
|
|
Nairobi CBD |
12,294 |
92 |
89.0% |
8.0% |
12,206 |
92 |
86.6% |
7.9% |
0.6% |
2.4% |
0.2% |
|
|
Parklands |
12,018 |
94 |
84.5% |
8.0% |
11,922 |
94 |
83.0% |
7.8% |
0.5% |
1.5% |
0.1% |
|
|
Kilimani |
12,945 |
103 |
82.9% |
7.9% |
12,873 |
101 |
82.9% |
8.3% |
2.0% |
0.0% |
(0.3%) |
|
|
Upperhill |
12,857 |
104 |
77.2% |
7.1% |
12,857 |
104 |
76.1% |
7.6% |
0.7% |
1.1% |
(0.5%) |
|
|
Thika Road |
13,057 |
92 |
79.4% |
6.7% |
12,643 |
90 |
79.3% |
6.7% |
2.7% |
0.1% |
0.1% |
|
|
Mombasa Road |
11,700 |
82 |
75.7% |
6.5% |
11,325 |
80 |
72.2% |
6.5% |
3.1% |
3.5% |
0.1% |
|
|
Average |
12,699 |
106 |
82.3% |
7.8% |
12,614 |
105 |
80.7% |
7.8% |
1.3% |
1.6% |
0.0% |
|
Source: Cytonn Research
Notable highlights in Q4’2025 include;
-
The Standard Investment Bank revealed its plans to invest Kshs 3.0 bn in a new headquarters in Westlands, Nairobi to support its growth in Kenya’s financial sector. The headquarters will serve as a hub for the firm’s growing operations, housing trading desks, advisory teams and wealth management experts. The proposed 32-floor SIB International Centre will provide a modern, sustainable workspace to enhance operational efficiency and accommodate the bank’s growing needs. Although the exact square footage of the offices has not been disclosed, this will continue to cater strong demand on Grade A offices particularly for buildings with advanced infrastructure. For more details, please see our Cytonn Weekly #50.2025.
For more notable highlights during the year please see our Cytonn Q1’2025 Markets Review and Cytonn H1’2025 Markets Review.
We maintain a NEUTRAL outlook on the Nairobi Metropolitan Area (NMA) commercial office sector, impacted by several key dynamics: i) the increasing presence of multinational companies in Kenya is likely to drive up occupancy levels, ii) co-working spaces are gaining in popularity in the region iii) the gradual return to “working from office” after the Covid-19 pandemic, iv) more start-ups are expected to drive demand for commercial spaces, and v) a considerable take-up of prevailing commercial office spaces after developers adopted a 'wait-and-see' approach to avoid vacancies in newly built spaces, However, the sector continues to face challenges due to a significant oversupply of office space, currently standing at 5.7 mn SQFT. Despite these challenges, there are attractive investment opportunities in areas such as Westlands, Gigiri, and Karen, which offer returns that exceed the market average.
-
Retail Sector
The table below shows the performance of the retail sector performance in Nairobi Metropolitan Area from FY’2024 to FY’2025;
|
All Figures in Kshs unless stated otherwise |
||||||
|
Cytonn Report: Summary of Retail Sector Performance in Nairobi Metropolitan Area FY’2024 to FY’2025 |
||||||
|
Item |
FY'2024 |
Q1'2025 |
H1'2025 |
Q3'2025 |
FY'2025 |
Y/Y 2025 ∆ |
|
Average Asking Rents (Kshs/SQFT) |
182.5 |
182.5 |
182.5 |
189.0 |
183.8 |
0.8% |
|
Average Occupancy (%) |
82.2% |
81.8% |
83.3% |
84.8% |
85.5% |
3.3% |
|
Average Rental Yields |
8.4% |
8.3% |
8.5% |
8.7% |
8.8% |
0.4% |
Source: Cytonn Research
The key take-outs from the table include;
-
Average Occupancy Rate - The average occupancy rates increased by 3.3% points to 85.5% in FY’2025, from 82.2% recorded in FY’2024. This increase was primarily propelled by several factors including; i) aggressive growth strategies implemented by both domestic and international retailers such as Naivas, QuickMart, China square and Carrefour, and, ii) continuous demand for consumer goods and services supported by positive demographics, encouraging further expansions from current retailers,
-
Asking Rents - The average rental rates per SQFT surged by 0.8% to Kshs 183.5 in FY’2025 from the Kshs 182.5 recorded in FY’2024. This slight surge was driven by the introduction of high-quality retail developments such as the Global Trade Centre (GTC) Mall, BBS Mall in Eastleigh, and Mwanzi Market, which command premium rental rates. Prime retail spaces located in strategic nodes within the Nairobi Metropolitan Area (NMA), including Karen, Kilimani, Westlands, and along Kiambu and Limuru Roads, continue to attract higher rents due to their superior quality and tenant mix. These locations have increasingly drawn foreign businesses seeking proximity to multinational corporations and diplomatic missions in order to serve an international customer base. The entry of global brands such as Adidas, Puma, Michael Kors, and Aldo into the Kenyan market has intensified competition for these prime spaces. Collectively, this heightened foreign interest has played a significant role in driving up rental rates across these areas., and,
-
Average Rental Yield- The average rental yield for the NMA retail sector improved by 0.4% points to 8.8% in FY’2025, from 8.4% in FY’2024, as a result of improved asking rents and occupancy rates.
In terms of sub-market performance, Kilimani, Karen and Westlands have retained their status as the leading nodes, boasting impressive average rental yields of 9.8%,9.6 and 9.5% respectively, surpassing the overall market average of 8.8%. This performance was primarily propelled by the presence of top-tier retail spaces commanding higher rents, complemented by the provision of quality infrastructure services in these areas. Conversely, retail spaces in satellite towns reported the lowest average rental yield at 7.6%, attributed to several factors: i) the rental rates stood at Kshs 141 per SQFT, notably lower than the market average of Kshs 184 per SQFT, due to oversupply of retail space from numerous malls along Thika Road thereby creating an excess in supply, reducing demand and rental rates, ii) there is oversaturation of retail businesses which increases competition among malls and retail spaces forcing landlords to lower rents to attract customers, iii) increased e-commerce reducing demand for physical retail spaces along iv) certain retail spaces suffer from insufficient foot traffic, particularly outside peak hours or in less popular malls. Moreover, this deliberate adjustment is a strategic manoeuvre to attract a more extensive clientele base by providing more affordable options, especially considering the amplified demand for consumer goods, diverse services, and entertainment facilities in these burgeoning locales. The table below shows the submarket performance of nodes in the Nairobi Metropolitan Area (NMA) 2025;
|
(All values in Kshs unless stated otherwise) |
||||||||||
|
Nairobi Metropolitan Area Retail Market Performance FY2025 |
||||||||||
|
Area |
Prices Kshs /SQFT FY'2025 |
Rent Kshs /SQFT FY'2025 |
Occupancy% FY’2025 |
Rental Yield FY'2025 |
Rent Kshs /SQFT FY'2024 |
Occupancy% FY’2024 |
Rental Yield FY’2024 |
∆ in Rental Rates |
∆ in Occupancy (% points) |
∆ in Rental Yield (% points) |
|
Kilimani |
20,000 |
194 |
84.6% |
9.8% |
198 |
82% |
9.8% |
(1.8%) |
2.4% |
0.1% |
|
Karen |
24,800 |
216 |
93.0% |
9.6% |
218 |
91% |
10.0% |
(1.0%) |
2.1% |
(0.4%) |
|
Westlands |
27,000 |
264 |
81.3% |
9.5% |
239 |
79.4% |
9.1% |
10.4% |
1.9% |
0.4% |
|
Mombasa road |
20,143 |
177 |
89.7% |
9.4% |
165 |
85.0% |
8.6% |
7.1% |
4.7% |
0.8% |
|
Kiambu road & Limuru Road |
20,000 |
186 |
80.0% |
9.0% |
187 |
76.3% |
8.7% |
(0.4%) |
3.7% |
0.3% |
|
Ngong Road |
24,263 |
193 |
89.5% |
8.6% |
191 |
86.2% |
8.7% |
1.0% |
3.3% |
(0.1%) |
|
Eastlands |
20,500 |
165 |
80.9% |
7.8% |
161 |
78.1% |
7.3% |
2.3% |
2.8% |
0.5% |
|
Thika Road |
20,124 |
150 |
82.5% |
7.7% |
160 |
79.3% |
6.3% |
(6.2%) |
3.2% |
1.4% |
|
Satellite towns |
20,000 |
141 |
88.6% |
7.6% |
140 |
82.2% |
7.2% |
0.8% |
6.4% |
0.4% |
|
Average |
21,870 |
183.8 |
85.5% |
8.8% |
182.5 |
82% |
8.4% |
0.8% |
3.3% |
0.3% |
Source: Cytonn Research
For notable highlights during the year please see our Cytonn Q1’2025 Markets-Review, Cytonn H1’2025 Markets Review, and, Cytonn Q3’ 2025 Markets Review reports.
We maintain a NEUTRAL outlook on the retail sector’s performance for 2026, influenced by several factors; i) continued expansion by local and international retailers, driven by evolving consumer preferences and market trends, ii) infrastructure improvements, including ongoing road and railway projects, are set to increase accessibility to key retail zones, unlocking further investment opportunities, and iii) favorable demographic trends, such as a growing urban population, will sustain demand for retail goods and services. However, growth could face challenges from: i) oversupply issues, with around 3.6 mn SQFT of retail space available in Nairobi and an additional 1.9 mn SQFT countrywide, leading to low occupancy rates and rental yields, ii) e-commerce adoption, increasingly shifting retail demand online, pushing brick-and-mortar outlets to adapt, and iii) limited financing options for retail developments, along with high costs, are likely to hinder investment, especially for small and medium-sized enterprises (SMEs) that need to adopt technology to stay competitive
-
Hospitality Sector
In 2025, Kenya's hospitality sector continues to display remarkable resilience in the aftermath of the COVID-19 pandemic. Its performance is largely supported by Nairobi's emergence as a regional business hub, attracting multinational companies to set up offices and hosting major international conferences. Additionally, Kenya’s status as a leading tourist destination has further driven recovery and growth, with increased business travel and tourism playing a significant role in strengthening the sector's contribution to the economy.
In terms of international arrivals, Kenya National Bureau of Statistics’ Leading Economic Indicators – September 2025 report highlighted that arrivals through Jomo Kenyatta International Airport (JKIA) and Moi International Airport (MIA) registered an increase of 52.2% to 745,720 visitors in Q3’2025 from 489,831 visitors recorded in Q3’2024. The graph below shows the number of international arrivals in Kenya between Q1’2023 and Q3’ 2025;
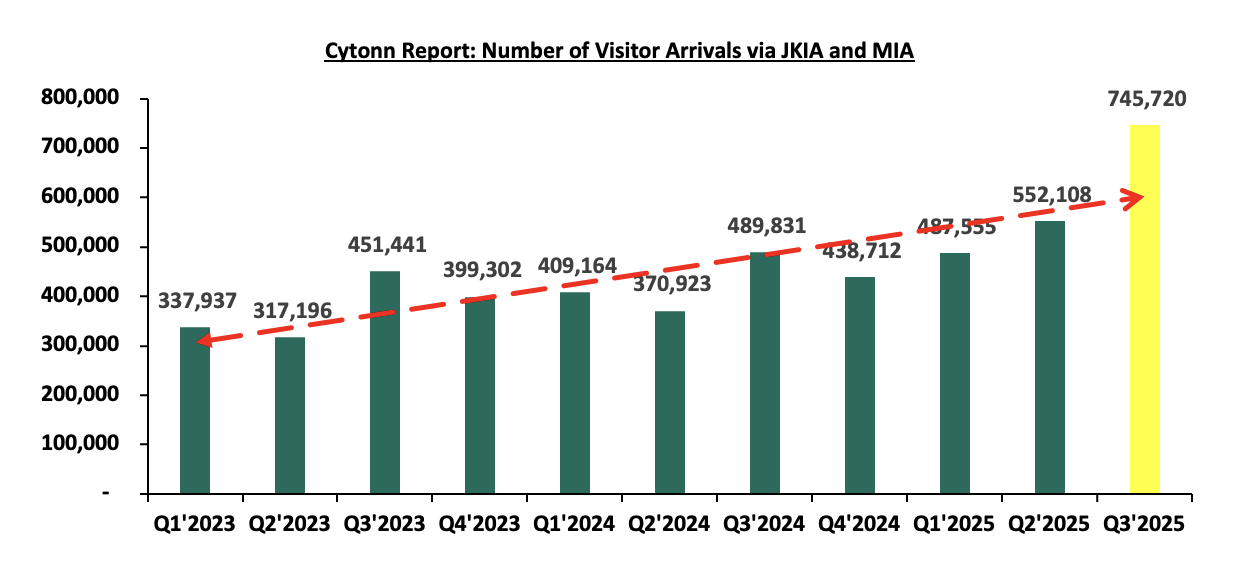
Source: Kenya National Bureau of Statistics (KNBS)
The improved performance was a result of i) aggressive global campaigns, including digital marketing with Artificial Intelligence (AI), Augmented Reality (AR), and Virtual Reality (VR) tools, have boosted Kenya's visibility under brands like "Magical Kenya", ii) niche promotions by the Ministry of Tourism in collaboration with the Kenya Tourism Board for segments such as MICE (Meetings, Incentives, Conferences, and Exhibitions), cultural heritage, wellness, and adventure tourism, iii) initiatives like the "Meet in Kenya" campaign and collaborations with influencers and travel agencies reduced seasonality and attracted high-value visitors, iv) introduction of the Electronic Travel Authorization (ETA) system, e-visas, visa-on-arrival options, and harmonized East Africa Tourist Visas reduced entry barriers. Simplified processes for events, sports, and niche travelers, along with relaxed regulations, facilitated easier access for international and regional visitors, contributing to the arrival surge, v) addition of direct routes from Europe, Middle East, Asia, and within Africa via airlines, reducing travel times and costs. This, alongside intra-African travel growth under frameworks like the African Continental Free Trade Area (AfCFTA), boosted regional visitors and economic links, vi) Kenya co-hosted the 2024 African Nations Championship (CHAN), which was postponed to and held from 2nd to 30th August 2025 alongside Uganda and Tanzania. The tournament showcased upgraded infrastructure, attracted regional fans and teams, and significantly boosted sports tourism through increased hotel occupancy, visitor spending, and international exposure, vii) global brands (Marriott, Accor, Ascott, Radisson, CityBlue) have improved service standards, marketing reach, and investor confidence, lifting overall sector performance, and, viii) growth of Kenya’s middle class, regional travel from East and Central Africa, and “staycation” culture has supported occupancy, especially during low international seasons.
Additionally, during the year, we released the Nairobi Metropolitan Area Serviced Apartments Report 2025 which highlighted that the overall performance of serviced apartments improved on y/y, with the occupancy rates coming in at 74.7% in 2025, a 2.5%-points increase from the 72.2% recorded in 2024. The average monthly charges for 2025 increased by 6.7% to Kshs 3,366 per SQM from 3,155 recorded in 2024. Consequently, the average rental yield increased to 7.4% in 2025, 0.1% points increase from the 7.3% recorded in 2024. The improvement in performance was primarily on the back of; i) a significant surge in international visitor arrivals, including the 52.2% increase in Q3’2025 as reported by KNBS, driving higher demand for extended-stay accommodations, ii) increasing preference among expatriates, business travelers, and tourists for the home-like convenience, privacy, and cost-effectiveness of serviced apartments over traditional hotels, iii) continued aggressive marketing initiatives under platforms like Magical Kenya and targeted promotions for business, MICE, and leisure segments, iv) the intensive marketing of Kenya’s tourism market through platforms such as the Magical Kenya platform and various, v) Kenya continued efforts to host various events such as the World Rally Championship (WRC) held in March-2025 and the African Nations Championship (CHAN) in August 2025, vi) Guests preference to stay within the city for extended periods.
Key highlights during Q4’2025 include:
-
The government of Kenya announced its plans to develop high-end hotels and generate revenue from carbon credits at the new Tsavo West Rhino Sanctuary in Ngulia, Taita-Taveta County. According to them, the expansion which covers more than 3200 Square Kilometers will prove beneficial to addressing congestion that has threatened the Black Rhino species, with over 80.0% living in overcrowded sanctuaries which reduces breeding potential and increases risks of territorial conflict. The revenue generated will be used to enhance wildlife protection and develop infrastructure such as wildlife corridors and dams which will help animals during drought. For more details, please see our Cytonn Weekly #50.2025,
-
Kenya and Malaysia signed several agreements aimed at strengthening bilateral ties. The two countries finalized an air services agreement that will improve connectivity between Nairobi and Kuala Lumpur, making travel more convenient for traders, investors, and tourists. They also signed a letter of intent to twin Nairobi and Kuala Lumpur, a partnership designed to enhance collaboration in urban planning, technology, and service delivery. In addition, an MOU between the Kenya National Chamber of Commerce and Industry (KNCCI) and the Malaysian Chamber of Commerce will foster deeper private sector cooperation and expand business opportunities for enterprises in both countries. For more details, please see our Cytonn Monthly - November 2025, and,
-
Hilton has marked a significant milestone in Kenya with the launch of the AVA Hotel Nairobi, Tapestry Collection by Hilton in the upscale Lavington suburb of Nairobi. The 91-room property will be operated by Aleph Hospitality under Hilton’s Tapestry Collection brand, which focuses on lifestyle-driven, locally rooted hotels. The hotel will include modern amenities such as rooftop spaces, a swimming pool, dining outlets and meeting rooms, signaling the rising ambition of Kenya’s hospitality players to serve both business and high-end leisure travellers. For more details, please see our Cytonn Monthly - October 2025.
For more notable highlights during the year please see our Cytonn Q1’2025 Markets Review, Cytonn H1’2025 Markets Review, and, Cytonn Q3’ 2025 Markets Review reports.
We maintain a POSITIVE outlook for the hospitality sector, supported by several key drivers: i) aggressive marketing campaigns promoting Kenya’s tourism, expected to boost tourist arrivals and improve occupancy rates at hospitality venues, ii) international recognition of Kenya’s tourism industry, enhancing its status as a leading tourist destination and drawing more global visitors, iii) strategic partnerships within the tourism sector, fostering innovation and collaboration to capitalize on new opportunities, iv) events and initiatives aimed at increasing tourism activity and improving guest experiences. However, while the sector demonstrated resilience in its overall performance in 2025, the outlook remains cautiously optimistic. Kenya continues to face significant competition from neighboring markets, such as Rwanda, which employs aggressive promotional strategies, alongside Zanzibar, Tanzania, and South Africa. These regions actively position themselves as attractive alternatives, challenging Kenya's market share in the region. Additionally, Kenya’s hospitality sector remains vulnerable to the impacts of negative travel advisories issued during times of crisis, resulting in reduced international visitor numbers.
-
Mixed-Use Developments (MUDs)
In November 2025, we released the Nairobi Metropolitan Area (NMA) Mixed Used Developments (MUDs) Report 2025, which highlighted that MUDs recorded an average rental yield of 8.7% in 2025, 0.1% points higher than the respective single-use themes which recorded an average rental yield of 7.1% in a similar period the previous year. The relatively better performance was mainly attributable to changing client preferences and MUDs' attractiveness driven by the diversity in amenities and social offerings they provide to clients. The table below shows the performance of Mixed-Use development themes by node in 2025;
|
Cytonn Report: Nairobi Metropolitan Area Mixed Use Developments Performance by Nodes 2025 |
|||||||||||
|
Location |
Commercial Office |
Commercial Retail |
Residential |
Average MUD Yield |
|||||||
|
Rent (Kshs/SQFT) |
Occupancy |
Rental Yield |
Rent (Kshs/SQFT) |
Occupancy |
Rental Yield |
Price (Kshs/SQM) |
Rent (Kshs/SQM) |
Annual Uptake |
Rental Yield |
||
|
Karen |
129 |
85.0% |
9.6% |
270 |
95.0% |
11.8% |
|
|
|
|
10.7% |
|
Kilimani |
121 |
85.4% |
9.1% |
186 |
88.0% |
10.2% |
|
|
|
|
9.6% |
|
Westlands |
129 |
79.8% |
9.7% |
204 |
75.4% |
10.1% |
287,314 |
3,460 |
8.5% |
9.1% |
9.6% |
|
Limuru Road |
113 |
77.5% |
7.8% |
305 |
77.5% |
12.9% |
180,396 |
1,314 |
23.1% |
7.9% |
9.5% |
|
UpperHill |
112 |
87.0% |
9.3% |
173 |
80.0% |
9.7% |
|
|
|
|
9.5% |
|
Eastlands |
92 |
72.5% |
6.4% |
232 |
87.0% |
10.4% |
|
|
|
|
8.4% |
|
Thika road |
120 |
82.7% |
9.2% |
207 |
81.7% |
9.8% |
145,260 |
766 |
11.7% |
5.3% |
8.1% |
|
Mombasa road |
112 |
70.0% |
7.4% |
205 |
77.5% |
9.0% |
427,404 |
693 |
8.6% |
6.5% |
7.6% |
|
Average |
116 |
80.0% |
8.6% |
223 |
82.8% |
10.5% |
260,093 |
1,558 |
13.0% |
7.2% |
9.1% |
|
*Selling prices used in the computation of rental yields for commercial office and retail themes entailed a combination of both real figures and market estimates of comparable properties in the locations of the Mixed-Use Developments (MUDs) sampled |
|||||||||||
Source: Cytonn Research
Overall performance: In terms of performance per node, Karen, Kilimani, and Westlands were the best performing of all sampled nodes with an average yield of 10.7%, 9.6%, and 9.6% respectively; 2.0% and 0.9% higher than the market average of 8.7% in 2025. The strong performance was mainly attributed to: i) a large base of residents with substantial consumer spending power, ii) robust infrastructure supporting investment opportunities, and iii) the availability of prime retail and office spaces commanding higher rents and yields. On the other hand, Mombasa Road recorded the lowest performance with an average rental yield of 7.6%, 1.5% lower than the market average of 8.7%. This performance can be attributed to; i) heavy traffic on Mombasa Road potentially deterring businesses and residents, reducing demand and rental yields, ii) low rental rates attracted by developments, and iii) the area's perception as an industrial hub reducing appeal for high-rent tenants.
For notable highlights during the year please see our Cytonn Q1’2025 Markets-Review, Cytonn H1’2025 Markets Review, and, Cytonn Q3’ 2025 Markets Review reports.
Our overall outlook for Mixed Use Developments is NEUTRAL supported by the remarkable returns compared to single-use themes, changing client preferences, and MUDs attractiveness driven by the diversity in amenities and social offerings they provide to clients. However, the existing oversupply of the NMA office market at 5.7 mn SQFT, and 3.0 mn SQFT in the NMA retail market, is expected to weigh down the performance. Karen, Kilimani, and Westlands nodes provide the best investment opportunities, with the areas providing the highest average MUD yields of 10.7%, and 9.6% respectively, compared to the market average of 9.1%.
-
Land Sector
During the period under review, the land sector in Nairobi Metropolitan Area (NMA) recorded a price appreciation of 3.4% to Kshs 136.7 mn from 132.9 mn. This performance was supported by;
-
Demographics: Kenya continues to record positive demographics shown by high population growth and urbanization rates of 2.0% p.a and 2.8% p.a, respectively against the global averages 1.0% p.a and 1.4% p.a, respectively, as at 2024. Given this, the demand for residential and commercial spaces continues to soar, which in turn boosts demand for development land,
-
Continued government investment in infrastructure: In 2025, the Kenyan government has sustained momentum in implementing strategic infrastructure projects aimed at accelerating economic development and enhancing regional connectivity. Key ongoing and completed projects include the dualling of the Mombasa Road-Athi River stretch, the expansion of Kiambu Road, progress on the LAPSSET Corridor, and utility extensions (water, electricity, sewer) to satellite towns. These projects have enhanced accessibility and opened up new investment frontiers in towns such as Joska, Kamulu, and Thika, resulting in increased land demand and value appreciation.
-
Acceleration of affordable housing projects: The government's Affordable Housing Programme has gained notable traction in 2025, with more than 40,000 new units launched or under construction across Nairobi Metropolitan Area. Major developments include the Kibera Soweto B and Starehe AHPs in Nairobi, and others in Ruaka, Thika, and Mavoko. These initiatives continue to drive demand for land in areas earmarked for housing development and surrounding regions benefiting from complementary infrastructure upgrades.
-
Diminishing land availability in urban centers: As Nairobi’s urban center becomes increasingly built-up, scarcity of available land parcels has driven investors and developers to the outskirts and emerging satellite towns. This limited land supply—especially within serviced zones—has contributed to upward pressure on prices, particularly in areas with infrastructure access and proximity to key commercial centers.
-
Diaspora and institutional investor interest: There has been a marked increase in land acquisitions by diaspora investors, facilitated by improved transparency in land transactions through digitization, and greater interest by institutional players seeking strategic land banks. This trend is further supported by capital flight from more volatile investment classes amid global uncertainty.
Overall Performance:
Unserviced land in the satellite towns of Nairobi recorded an average YoY capital price appreciation of 3.3%, with average asking prices coming in at Kshs 17.6 mn in FY’2024/25, from the Kshs 17.0 mn recorded in FY’2023/24. Additionally, the performance grew by a 14-year average CAGR of 12.4%, to average asking prices of Kshs 17.6 mn in FY’2024/25 from the Kshs 3.6 mn recorded in 2011. The performance was supported by; i) Ongoing and planned infrastructure improvements, such as the Western, South and Eastern bypass, commuter railways and other utilities have made satellite towns more accessible and appealing for investment, and, ii) Investors looking for capital gains have been buying land in these towns, anticipating future appreciation as the areas develop and urbanize. On the other hand, Land in Nairobi suburbs commercial zones recorded an average YoY capital appreciation of 3.3%, with the average asking prices coming in at Kshs 424.4 mn in FY’2024/25, from Kshs 411.5 mn in FY’2023/24. The table below shows the overall performance of the sector across all land sub-sectors during FY’2025;
|
Summary of the Performance Across All regions FY’2025 |
|||
|
|
FY'2024 |
FY'2025 |
Annualized Capital Appreciation |
|
Un-serviced land - Satellite Towns |
17.0 mn |
17.6 mn |
3.3% |
|
Nairobi Suburbs- Commercial Areas |
411.5 mn |
424.4 mn |
3.3% |
|
Serviced Land - Satelllite Towns |
19.6 mn |
20.2 mn |
3.0% |
|
Nairobi High End Suburbs (Low and High Rise Areas) |
136.3 mn |
138.9 mn |
3.0% |
|
Nairobi Middle End Suburbs- High Rise Residential Areas |
80.4 mn |
82.6 mn |
2.7% |
|
Average |
133.0 mn |
136.7 mn |
2.8% |
Source: Cytonn Research
Sub-markets Performance – For the unserviced satellite towns, Limuru, Utawala and Juja emerged as the best-performing nodes with annualized capital appreciation of 5.0%, 4.6% and 3.2%, respectively. This performance can be attributed to: i) good transport network connecting these areas to Nairobi ii) a rising middle class looking to settle in these areas, iv) good proximity to retail centers such as malls, and v) relatively affordable prices compared to the market average. Additionally, land in unserviced towns presents a good opportunity for speculative investors, who invest in anticipation of price appreciation. The table below shows NMA’s land performance by submarkets in FY’2025;
|
Price in Kshs per Acre |
|||
|
Cytonn Report: Nairobi Metropolitan Area Land Performance By Submarkets – FY’2025 |
|||
|
Location |
Price FY'2024 |
Price FY'2025 |
Capital Appreciation |
|
Satellite Towns - Unserviced Land |
|||
|
Limuru |
24.8 mn |
26.5 mn |
5.0% |
|
Juja |
15.5 mn |
16.0 mn |
3.2% |
|
Utawala |
17.4 mn |
18.2 mn |
4.6% |
|
Rongai |
18.3 mn |
18.5 mn |
1.1% |
|
Athi River |
8.9 mn |
8.9 mn |
0.3% |
|
Average |
17.0 mn |
17.6 mn |
3.3% |
|
Satellite Towns - Serviced Land |
|||
|
Syokimau |
18.5 mn |
19.3 mn |
4.3% |
|
Ruiru & Juja |
29.0 mn |
30.1 mn |
4.0% |
|
Athi River |
17.4 mn |
18.1 mn |
3.6% |
|
Rongai |
20.6 mn |
21.2 mn |
3.0% |
|
Ruai |
12.4 mn |
12.5 mn |
0.3% |
|
Average |
19.6 mn |
20.2 mn |
3.0% |
|
Nairobi High End Suburbs (Low and High Rise Areas) |
|||
|
Karen |
63.6 mn |
67.8 mn |
6.6% |
|
Kitisuru |
92.5 mn |
98.0 mn |
6.0% |
|
Runda |
90.2 mn |
92.5 mn |
2.5% |
|
Spring Valley |
168.3 mn |
172.4 mn |
2.5% |
|
Ridgeways |
86.4 mn |
87.1 mn |
0.7% |
|
Kileleshwa |
316.8 mn |
315.4 mn |
(0.4%) |
|
Average |
136.3 mn |
138.9 mn |
3.0% |
|
Nairobi Middle End Suburbs – High Rise Residential Areas |
|||
|
Kasarani |
74.4 mn |
78.3 mn |
5.2% |
|
Dagoretti |
91.1 mn |
93.9 mn |
3.1% |
|
Embakasi |
75.8 mn |
75.5 mn |
(0.4%) |
|
Average |
80.4 mn |
82.6 mn |
2.7% |
|
Nairobi Suburbs - Commercial Zones |
|||
|
Riverside |
327.1 mn |
349.7 mn |
4.9% |
|
Westlands |
433.2 mn |
447.2 mn |
3.2% |
|
Upperhill |
471.4 mn |
486.1 mn |
3.1% |
|
Kilimani |
414.3 mn |
414.5 mn |
0.0% |
|
Average |
411.5 mn |
424.4 mn |
3.3% |
Source: Cytonn Research
We maintain a POSITIVE outlook for the land sector in the Nairobi Metropolitan Area (NMA), We expect the performance to be further boosted by factors driving demand for development land such as; i) Increased infrastructure developments which has improved and opened up areas for investment, ii) Roll out of numerous affordable housing projects by both the public and private sectors, iii) Affordability of land in the satellite towns, iv) Limited supply of land especially in urban areas which has contributed to exorbitant prices, and, v) Positive demographics driving demand for land upwards, facilitated by high population growth and urbanization rates of 2.0% p.a and 2.8% p.a, respectively against the global averages 1.0% p.a and 1.4% p.a, respectively.
-
Infrastructure Sector
The Kenyan governments continues to demonstrate commitment to improve infrastructure around the country by launching and progressing several key projects across the nation, with a special focus on road networks during the year: the recent key launch being the Rironi-Mau Summit Road into a modern, tolled expressway. These road projects continue to enhance connectivity that supports trading activities, draws investments in various sectors and promotes economic growth.
Key highlights during Q4’2025;
-
Treasury disclosed that it had settled Kshs 123.0 bn worth of pending bills owed to road contractors, primarily through loans from local commercial banks and proceeds from infrastructure bond issuances. The payments covered obligations accumulated up to December 2024, with the funds channeled directly to contractors to clear long-outstanding dues. Please see our Cytonn Weekly #52/2025,
-
The Cabinet approved a Kshs 5.0 tn infrastructure fund aimed at accelerating investment in critical projects, including roads, railways, ports, energy, water, irrigation, and digital infrastructure. The fund, to be anchored under the Sovereign Wealth Fund and structured to attract both local and foreign private capital, is intended to reduce reliance on public debt while fast-tracking development and job creation. For more information, please see our Cytonn Weekly #51/2025,
-
The department of roads reported that road maintenance output declined sharply by 28.0% in the year to June 2025, with agencies maintaining 35,965.0 km of roads compared to 49,758.0 km in the previous financial year. This significant drop followed substantial budget cuts that constrained the capacity of KeRRA, KeNHA and KURA to execute planned routine and periodic works across the country, leading to widespread delays and reduced upkeep on key national, urban and rural road networks. For more information, please see our Cytonn Weekly #49/2025,
-
US President cancelled a Kshs 7.8 bn (USD 60.0 mn) Millennium Challenge Corporation (MCC) Threshold Program that had been agreed upon between his predecessor and Kenya’s President. The programme, signed in September 2023 and effective from May 2024, was designed to support Nairobi’s Bus Rapid Transit (BRT) system by enhancing urban mobility, improving long-term planning, and funding climate-friendly and gender-inclusive transport solutions. It was to run through June 2027, with the US contributing Kshs 5.8 bn and Kenya Kshs 1.6 bn. For more details, please see our Cytonn Monthly - November 2025,
-
President William Ruto launched the dualling of the 170-kilometre Rironi–Nakuru–Mau Summit Road, a major upgrade intended to ease congestion and improve safety along one of Kenya’s busiest transport corridors. The project, undertaken through a public-private partnership by a consortium including China Road and Bridge Corporation (CRBC) and the National Social Security Fund (NSSF), will expand the road into a four-lane dual carriageway from Rironi to Naivasha and a six-lane dual carriageway from Naivasha to Nakuru. For more details, please see our Cytonn Monthly - November 2025,
-
President William Ruto, launched the construction of the 81 km Kasoyo- Kampi Samaki Road in Baringo County, marking an important milestone for infrastructure development in the region. The road links the settlement of Kasoyo with Kampi-Ya-Samaki on the shores of Lake Baringo and aims to enhance connectivity, stimulate economic activity and bolster regional development. For more details, please see our Cytonn Monthly - October 2025,
-
The Kenya Ports Authority (KPA) has revealed its plans to establish a special cruise terminal at the Lamu Port in Kililana. The arrival of 120 international tourists aboard the MV SH Diana highlighted the steady rise of cruise tourism in Lamu, with at least six vessels having docked at the port this year, a sign of the growing appeal of Kenya’s coastal destinations. The move marks a new chapter for Kenya’s maritime infrastructure, positioning Lamu not only as a cargo hub but also as a key gateway for leisure and tourism-related maritime traffic. For more details, please see our Cytonn Monthly - October 2025, and,
-
The Asian Infrastructure Investment Bank (AIIB) is lining up its first project in Kenya, which has lined up its debut mega road investment in the country. The multilateral lender has invited bids for a consultancy to evaluate the upgrading of the 243-kilometre Mau Summit–Malaba Highway into a modern, tolled dual carriageway. This marks a significant step in diversifying Kenya’s infrastructure financing sources and underscores growing investor confidence in the country’s transport sector. For more details, please see our Cytonn Monthly - October 2025.
For more notable highlights during the year please see our Cytonn Q1’2025 Markets Review, Cytonn H1’2025 Markets Review, and Cytonn Q3’2025 Markets Review reports.
We maintain a POSITIVE outlook for the infrastructure sector. We anticipate continued government efforts to advance infrastructure development across Kenya, particularly in the roads and transport sector, in line with the Bottom-Up Economic Transformation Agenda (BETA) and broader economic stimulus objectives. These enhancements are expected to facilitate the more efficient movement of people, goods, and services, thereby reducing logistics costs, stimulating economic activity, and increasing demand for real estate in previously underserved remote areas and satellite towns. Our optimistic stance is supported by several key developments: i) The launch of the National Infrastructure Fund and Sovereign Wealth Fund, designed to channel resources into priority projects with minimal additional public debt, primarily through privatization proceeds; such as the planned IPO of Kenya Pipeline Company; ii) The anticipated mid-2026 commencement of construction on the Nairobi–Mombasa Usahihi Expressway, a flagship PPP project; iii) The 2026 launch of the Naivasha–Narok–Kisumu–Malaba extension of the Standard Gauge Railway (SGR), establishing a modern logistics corridor across East and Central Africa; iv) Accelerated progress on PPPs for the Rironi–Mau Summit highway; v) The 2025 clearance of Kshs 123 bn in pending bills, which restored contractor confidence; vi) Anticipated construction of a new world-class terminal at Jomo Kenyatta International Airport (JKIA) to solidify Kenya’s position as East Africa’s premier aviation hub; vii) Ongoing modernization of Mombasa and Lamu ports under the LAPSSET corridor initiative; and, viii) Expected completion of the Talanta Sports Complex and Bomas International Convention Centre, enhancing sports and MICE tourism infrastructure. Nevertheless, the sector continues to face longstanding challenges that could temper progress if not effectively managed. These include the recent cancellation of the U.S. government’s Millennium Challenge Corporation (MCC) Threshold Program grant, persistent delays in project execution, land acquisition disputes, cost overruns, a weak culture of infrastructure maintenance, and lingering reliance on debt-financed models. Addressing these headwinds will be critical to fully realizing the sector’s transformative potential.
-
Industrial Sector
During the year, The Nairobi Metropolitan Area has been on the front line and a major contributor to the Industrial Real Estate Sector accounting for approximately 90.0% of the country’s industrial space. It is known for its high concentration of industrial projects in areas like Nairobi, Kiambu, Machakos and Kajiado; with Nairobi County holding the largest share at 66.0%, largely due to its status as the capital city. Kiambu follows, housing key industrial investments such as Tatu City, Nairobi Gate Industrial Park (NGIP), Tilisi, and Northlands City. These areas have attracted major industrial projects like Africa Logistics Property (ALP) West in Tilisi and ALP North in Tatu City, bolstering Kiambu’s market share. The growth in the area has been driven by several factors such as the surge in e-commerce, demand for high-quality facilities, favorable demographics, enhanced infrastructure, government-led initiatives aligned with Vision 2030 and Nairobi’s role as East Africa’s business hub which has attracted foreign investments. For more notable highlights during the year please see our Cytonn Q1’ 2025 Market Review, Cytonn H1’2025 Market Review, and Cytonn Q3’2025 Market Review reports.
Below are some of the highlights witnessed throughout the year;
-
President William Ruto presided over the groundbreaking of Centum Investment Company’s Vipingo Special Economic Zone (SEZ) in Kilifi County, shortly after KCB Bank Kenya and the African Export-Import Bank (Afreximbank) signed a Kshs 103.0 bn financing agreement to support its development. The 2,000-acre project is envisioned as one of the most competitive manufacturing hubs in the region, offering plug-and-play infrastructure, reliable utilities and fiscal incentives designed to attract global and local manufacturers. Cytonn Weekly #37/2025.
We maintain a neutral outlook for the sector. Going forward, we expect the sector to continue on an upward trajectory driven by: i) the rising demand for data centers in the country, ii) an increasing demand for cold rooms, especially in the Nairobi Metropolitan Area, iii) demand for quality warehouses due to the growing e-commerce business in the country, iv) support from the government, as evidenced by the establishment of Special Economic Zones (SEZ) and Export Processing Zones (EPZ), v) increased development activities by industry players such as ALP Africa Logistics, vi) Kenya’s continued recognition as a regional hub, hence attracting international investors, and, vii) efforts by the government to support agricultural and horticultural products in the international market.
-
Real Estate Investments Trusts (REITs)
-
REITs performance
In 2025, Kenya's Real Estate Investment Trusts (REITs) exhibited moderate performance, with notable growth in key financial metrics. The combined Net Operating Income (NOI) of Kenyan REITs saw a 24.9 % increase, reaching Kshs 1028.0 mn in H1’2025, up from Kshs 823.2 mn in H1’2024. This growth was largely driven by a 117.9% rise in the net operating income of Acorn D-REIT, which increased to Kshs 566.8 mn from Kshs 260.2 mn in H1’2024. Additionally, ILAM Fahari I-REIT reported a notable NOI growth of 19.5%, reaching Kshs 64.3 mn from Kshs 53.8 mn in similar period in 2023. Overall, while the sector showed signs of growth, particularly in operational income, it continued to face hurdles in market liquidity and investor confidence, indicating the need for strategic interventions to enhance market participation and performance.
On the Unquoted Securities Platform, Acorn D-REIT and I-REIT traded at Kshs 27.4 and Kshs 23.2 per unit, respectively, as per the last updated data on 5th December 2025. The performance represented a 33.4% and 14.5% gain for the D-REIT and I-REIT, respectively, from the Kshs 20.0 inception price. The volumes traded for the D-REIT and I-REIT came in at Kshs 12.8 mn and Kshs 40.6 mn shares, respectively, with a turnover of Kshs 323.5 mn and Kshs 791.5 mn, respectively, since inception in February 2021. Additionally, ILAM Fahari I-REIT traded at Kshs 11.0 per share as of 5th December 2025, representing a45.0% loss from the Kshs 20.0 inception price. The volume traded to date came in at 1.2 mn shares for the I-REIT, with a turnover of Kshs 1.5 mn since inception in November 2015.
REITs offer various benefits, such as tax exemptions, diversified portfolios, and stable long-term profits. However, the ongoing decline in the performance of Kenyan REITs and the restructuring of their business portfolios are hindering significant previous investments. Additional general challenges include:
-
Insufficient understanding of the investment instrument among investors leading to a slower uptake of REIT products,
-
Lengthy approval processes for REIT creation,
-
High minimum capital requirements of Kshs 100.0 mn for REIT trustees compared to Kshs 10.0 mn for pension funds Trustees, essentially limiting the licensed REIT Trustee to banks only
-
The rigidity of choice between either a D-REIT or and I-REIT forces managers to form two REITs, rather than having one Hybrid REIT that can allocate between development and income earning properties
-
Limiting the type of legal entity that can form a REIT to only a trust company, as opposed to allowing other entities such as partnerships, and companies,
-
We need to give time before REITS are required to list – they would be allowed to stay private for a few years before the requirement to list given that not all companies maybe comfortable with listing on day one, and,
-
Minimum subscription amounts or offer parcels set at Kshs 0.1 mn for D-REITs and Kshs 5.0 mn for restricted I-REITs. The significant capital requirements still make REITs relatively inaccessible to smaller retail investors compared to other investment vehicles like unit trusts or government bonds, all of which continue to limit the performance of Kenyan REITs.
For notable highlights during the year please see our Cytonn Q1’2025 Markets-Review, Cytonn H1’2025 Markets Review, and, Cytonn Q3’ 2025 Markets Review reports.
Notable highlights during Q4'2025 include;
-
Africa Logistics Properties (ALP) received approval from the Capital Markets Authority (CMA) to proceed with a restricted offer for its ALP Industrial Real Estate Investment Trust (I-REIT), targeting professional investors only. The offer involves issuing up to 30 mn units at USD 1.0 per unit to raise up to USD 30.0 mn, alongside a promoter consideration of up to 15 mn units issued in exchange for seed logistics assets. The I-REIT will invest in modern Grade A and B warehousing and logistics facilities across East Africa, with initial seed assets located in Imara Daima and Tatu City, Nairobi. For more information, please see our Cytonn Weekly #51/2025,
-
Centum Investment Company announced that they expect to issue a dollar denominated Income Real Estate Investment Trust (I-REIT) at its Two Rivers Special Economic zone in Nairobi in January 2026. Centum is eyeing Kshs 4.8 bn from the proposed I-REIT, which is pending regulatory approval, with the proceeds budgeted for the construction of green commercial property in the Two Rivers International Finance and Innovation Centre (TRIFIC). For more information, please see our Cytonn Weekly #50.2025, and,
-
Mi Vida Homes announced plans to raise between Kshs 15.0 bn and 20.0 bn from both local and international institutional investors in the first quarter of 2026. This is considered a big stride in Kenya’s Real Estate sector because this is set to be earmarked as Kenya’s first hybrid real estate fund. A hybrid Real Estate fund describes an investment vehicle that is designed to pool capital from investors by combining both an Income and Development Real Estate Investment Trust (REIT). For more details, please see our Cytonn Monthly - October 2025.
Moving forward, we also expect the trend of strategic acquisitions to persist, with REITs actively seeking opportunities to broaden and diversify their portfolios, cater to evolving market demands and also set standards in promoting environmental sustainability such as execution of green bonds by Acorn holding. For more information on the REITs sector in Kenya, please see our Kenya’s REITs H1’2025 report.
Real Estate Performance Summary and Outlook
Below is a summary of the sectorial performance in FY’2025 and investment opportunities:
|
Theme |
Cytonn Report: Thematic Performance and Outlook 2026 |
Outlook |
|
Residential |
|
Neutral |
|
||
|
Commercial Office |
The average rental yields showed resilience with 0.04%-points increase, coming at 7.84% in FY’2025 from 7.80% in FY’2024. This is attributable to an increase in occupancy by 2.4% during the period under review. |
Neutral |
|
||
|
Retail |
|
Neutral |
|
||
|
Hospitality |
|
Positive |
|
Land |
|
Positive |
|
Mixed Use Development |
|
Neutral |
|
We maintain Neutral outlook for the Real Estate sector supported by ongoing residential developments under the Affordable Housing Agenda, aiming to reduce the housing deficit in the country currently estimated at 80.0%, increased investment from local and international investors in the housing sector, favorable demographics in the country, shown by high population and urbanization rates of 3.8% p.a and 2.0% p.a, respectively, leading to higher demand for housing units, the increasing presence of multinational companies in Kenya is likely to drive up occupancy levels, co-working spaces are gaining in popularity in the region, continued expansion by local and international retailers, driven by evolving consumer preferences and market trends, infrastructure improvements, including ongoing road and railway projects, are set to increase accessibility to key retail zones, unlocking further investment opportunities, and favorable demographic trends, such as a growing urban population, will sustain demand for retail goods and services and the remarkable returns compared to single-use themes, changing client preferences, and MUDs attractiveness driven by the diversity in amenities and social offerings they provide to clients. However, challenges such as rising construction costs, strain on infrastructure development, and limited access to financing will continue to restrict the optimal performance of the Real Estate sector.
Disclaimer: The views expressed in this publication are those of the writers where particulars are not warranted. This publication, which is in compliance with Section 2 of the Capital Markets Authority Act Cap 485A, is meant for general information only and is not a warranty, representation, advice or solicitation of any nature. Readers are advised in all circumstances to seek the advice of a registered investment advisor.

- Talk to us
- Kenya
- P.O Box 20695 - 00200, Nairobi, Kenya
- Cell +254709101200
- Tel +254709101200
- WhatsApp +254741676635
- United States
- +254709101200
- DOWNLOAD OUR APP
-


- Kenya
- 8th Floor, Pinetree Plaza, Kaburu Drive, Ngong Road, Nairobi, Kenya
- USA
- Suite 1150, 1775 Eye Street NW, USA, Washington DC 20006, USA
- Investments
- High Yield
- Private Equity
- Real Estate
- Real Estate
- RiverRun Estates
- Cytonn Towers
- The Ridge
- Taraji Heights
- The Alma