Ruaka Research Note, & Cytonn Weekly #03/2023
By Research, Jan 22, 2023
Executive Summary
Fixed Income
During the week, T-bills remained oversubscribed, with the overall subscription rate coming in at 122.7%, up from 108.9% recorded the previous week. Investor’s preference for the shorter 91-day paper persisted as they sought to avoid duration risk, with the paper receiving bids worth Kshs 14.2 bn against the offered Kshs 4.0 bn, translating to a subscription rate of 354.3%, down from 392.3% recorded the previous week. The subscription rate for the 182-day paper increased to 131.0% from 57.7% recorded the previous week, while that of the 364-day paper declined to 21.9% from 46.7% recorded the previous week. The yields on the government papers were on an upward trajectory, with the yields on the 364-day, 182-day and 91-day papers increasing by 3.8 bps, 3.2 bps and 4.9 bps to 10.5%, 9.9% and 9.5%, respectively;
In the Primary Bond Market, the government is seeking to raise an additional Kshs 10.0 bn for budgetary support in the FY’2022/2023 by offering a tap sale for the recently reopened Fixed Coupon Treasury Bonds, FXD1/2020/005 and FXD1/2022/015 with effective tenors to maturity of 2.4 years and 14.3 years respectively. The tap sale period closes on 20th January 2023, or upon attainment of the Kshs 10.0 bn quantum. The accepted average yields for the two bonds are 12.9% and 14.2% for FXD1/2020/005 and FXD1/2022/015, respectively, while the coupon rates are 11.7% and 13.9% for FXD1/2020/005 and FXD1/2022/015, respectively. Additionally, the government re-opened one bond, FXD1/2017/010, and issued a new one, FXD1/2023/010, with effective tenors to maturity of 4.5 years and 10.0 years respectively, in a bid to raise Kshs 50.0 bn for budgetary support. The period of the sale for the bonds runs from 17th January 2023 to 7th February 2023. Our recommended bidding range for the two bonds is 13.3%-13.7% for FXD1/2017/010 and 13.9%-14.3% for FXD1/2023/010, respectively, according to what bonds of similar tenors are trading;
Additionally, the Kenya Revenue Authority released the draft regulations for the Excise Duty (Excisable Goods Management Systems)(Amendment) Regulations, 2023 having reviewed the previous Excise Duty (Excisable Goods Management Systems)(Amendment) Regulations, 2017, under the Excise Duty Act No. 23 of 2015, seeking to increase the stamp duty fees on various commodities. Also, during the week, the National Treasury released the Draft 2023 Budget Policy Statement, projecting a 59.2% increase in tax revenue in the medium term to Kshs 4.0 tn by the end of FY’2026/27 from the Kshs 2.5 tn original FY’2022/23 budget estimates;
Equities
During the week, the equities market recorded mixed performance, with NASI gaining by 0.8%, while NSE 20 declined by 0.7%. NSE 25 remained relatively unchanged, taking the YTD performance to losses of 2.4% and 0.7% for NASI and NSE 25, respectively, and a 0.5% gain for NSE 20. The equities market performance was mainly driven by gains recorded by large cap stocks such as Bamburi and Safaricom of 4.6% and 2.5%, respectively. The gains were however weighed down by losses recorded by large cap stocks such as Diamond Trust Bank (DTB-K), EABL and Co-operative Bank of 3.3%, 2.3% and 1.6%, respectively;
Additionally, the Insurance Regulatory Authority of Kenya (IRA) recently released the Quarterly Insurance Industry Report for the period ending 30th September 2022 highlighting that the industry’s profits after tax declined by 3.3% to Kshs 6.2 bn in Q3’2022, from Kshs 6.4 bn recorded in Q3’2021;
Real Estate
During the week, President William Ruto oversaw the ground breaking of the Kings Boma Estate affordable housing project consisting 1,050 residential units, worth Kshs 2.8 bn, located along the Ruiru-Kiambu road in Kiambu County. In the Real Estate Investment Trusts (REITs) segment, Fahari I-REIT closed the week trading at an average price of Kshs 6.4 per share on the Nairobi Securities Exchange, remaining relatively unchanged from the previous week. On the Unquoted Securities Platform as at 13th January 2023, Acorn D-REIT and I-REIT closed the week trading at Kshs 23.9 and Kshs 20.9 per unit, respectively, registering a 19.4% and 4.4% gain for the D-REIT and I-REIT, respectively, from the Kshs 20.0 inception price;
Focus of the Week
The Real Estate market in Ruaka has recorded significant growth in recent years driven by the completion of major infrastructural developments and its proximity to international organization zones and prime leafy suburbs in Nairobi Metropolitan Area (NMA). As highlighted in our, Annual Markets Review 2022, the area saw total returns of up to 7.5%, compared to satellite towns average of 6.9% with strong potential for investment in both the residential and commercial Real Estate sectors. In 2023, we review the investment potential in Ruaka by analyzing the market performance of the region and come up with recommendations on key take outs gathered from our research;
Investment Updates:
- Weekly Rates:
- Cytonn Money Market Fund closed the week at a yield of 10.80%. To invest, dial *809# or download the Cytonn App from Google Playstore here or from the Appstore here;
- Cytonn High Yield Fund closed the week at a yield of 13.87% p.a. To invest, email us at sales@cytonn.com and to withdraw the interest, dial *809# or download the Cytonn App from Google Playstore here or from the Appstore here;
- Cytonn Investments CEO, Edwin H. Dande featured on a twitter space to discuss Kenya Real Estate Investments Environment and the way forward. Listen to the conversation here;
- We continue to offer Wealth Management Training every Wednesday, from 9:00 am to 11:00 am, through our Cytonn Foundation. The training aims to grow financial literacy among the general public. To register for any of our Wealth Management Trainings, click here;
- If interested in our Private Wealth Management Training for your employees or investment group, please get in touch with us through wmt@cytonn.com;
- Any CHYS and CPN investors still looking to convert are welcome to consider one of the five projects currently available for assignment, click here for the latest term sheet;
- Cytonn Insurance Agency acts as an intermediary for those looking to secure their assets and loved ones’ future through insurance namely; Motor, Medical, Life, Property, WIBA, Credit and Fire and Burglary insurance covers. For assistance, get in touch with us through insuranceagency@cytonn.com;
- Cytonnaire Savings and Credit Co-operative Society Limited (SACCO) provides a savings and investments avenue to help you in your financial planning journey. To enjoy competitive investment returns, kindly get in touch with us through clientservices@cytonn.com;
Real Estate Updates:
- For an exclusive tour of Cytonn’s real estate developments, visit: Sharp Investor's Tour, and for more information, email us at sales@cytonn.com;
- Phase 3 of The Alma is now ready for occupation and the show house is open daily. To rent please email properties@cytonn.com;
- We have 8 investment-ready projects, offering attractive development and buyer targeted returns; See further details here: Summary of Investment-ready Projects;
- For Third Party Real Estate Consultancy Services, email us at rdo@cytonn.com;
- For recent news about the group, see our news section here;
Hospitality Updates:
- We currently have promotions for Staycations. Visit cysuites.com/offers for details or email us at sales@cysuites.com;
Money Markets, T-Bills Primary Auction:
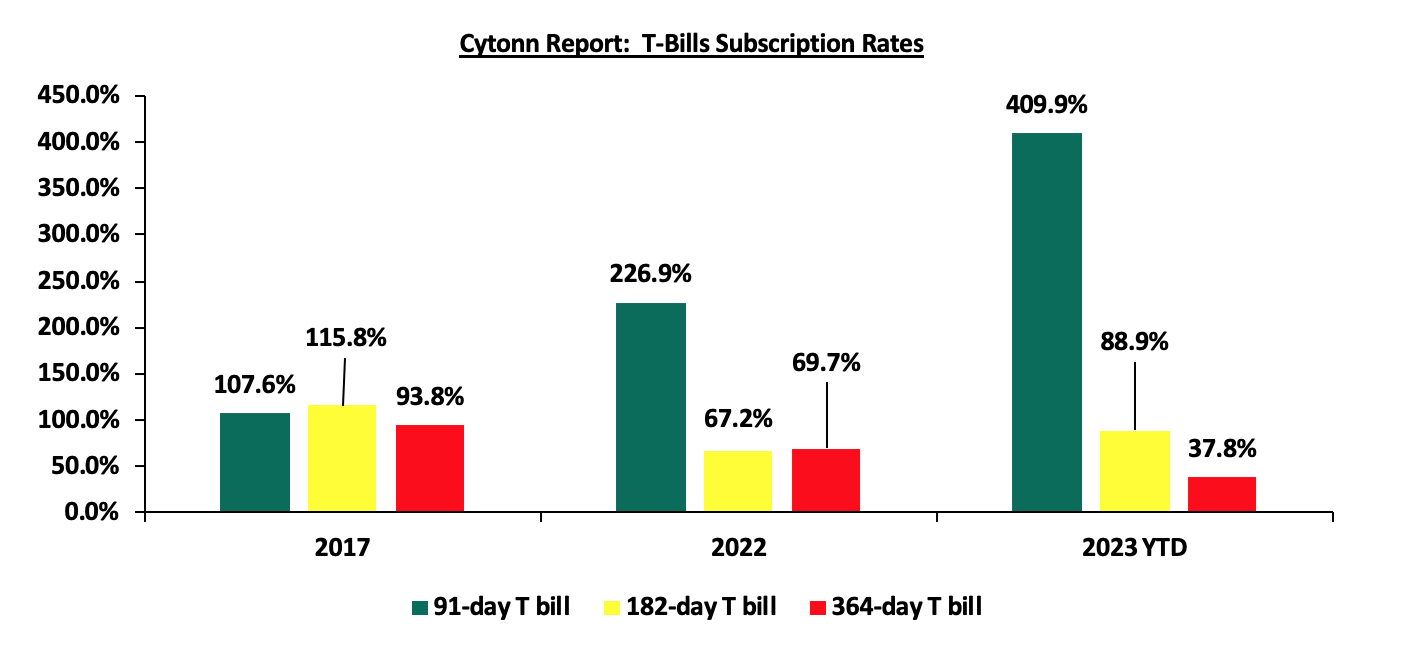
During the week, T-bills remained oversubscribed, with the overall subscription rate coming in at 122.7%, up from 108.9% recorded the previous week. Investor’s preference for the shorter 91-day paper persisted as they sought to avoid duration risk, with the paper receiving bids worth Kshs 14.2 bn against the offered Kshs 4.0 bn, translating to a subscription rate of 354.3%, down from 392.3% recorded the previous week. The subscription rate for the 182-day paper increased to 131.0% from 57.7% recorded the previous week, while that of the 364-day paper declined to 21.9% from 46.7% recorded the previous week. The yields on the government papers were on an upward trajectory, with the yields on the 364-day, 182-day and 91-day papers increasing by 3.8 bps, 3.2 bps and 4.9 bps to 10.5%, 9.9% and 9.5%, respectively. The Government accepted a total of Kshs 29.4 bn worth of bids out of the Kshs 29.5 bn worth of bids received, translating to an acceptance rate of 99.8%. The graph below compares the overall T- bills subscription rates obtained in 2017, 2022 and 2023 Year to Date (YTD):
In the Primary Bond Market, the government is seeking to raise an additional Kshs 10.0 bn for budgetary support in the FY’2022/2023 by offering a tap sale for the recently reopened Fixed Coupon Treasury Bonds, FXD1/2020/005 and FXD1/2022/015 with effective tenors to maturity of 2.4 years and 14.3 years respectively. The tap sale period closes on 20th January 2023, or upon attainment of the Kshs 10.0 bn quantum. The weighted average yields for the two bonds are 12.9% and 14.2% for FXD1/2020/005 and FXD1/2022/015, respectively, while the coupon rates are 11.7% and 13.9% for FXD1/2020/005 and FXD1/2022/015, respectively. Although the initial re-opening of the two bonds received an undersubscription of 83.3%, we anticipate an oversubscription on the tap sale, given the low amount offered on the tap sale at Kshs 10.0 bn and the low tenure to maturity presented by the FXD1/2020/005 at 2.4 years, a preference by investors as they seek to avoid duration risks.
Additionally, the government re-opened one bond, FXD1/2017/010, and issued a new one, FXD1/2023/010, with effective tenors to maturity of 4.5 years and 10.0 years respectively, in a bid to raise Kshs 50.0 bn for budgetary support. The coupon rates for the bonds are 13.0% for FXD1/2017/010 while that for FXD1/2023/010 will be market determined. We expect the bonds to be undersubscribed, with FXD1/2017/010 receiving a higher subscription as investors avoid duration risk. The reopened bond FXD1/2017/010 is currently trading in the secondary market at a yield of 12.3%. Our recommended bidding range for the two bonds is 13.3%-13.7% for FXD1/2017/010 and 13.9%-14.3% for FXD1/2023/010. The period of sale for the bonds runs from 17th January 2023 to 7th February 2023.
Key to note, the high number of bonds on auction in the primary bond market depicts the government’s preference for domestic borrowing to finance the Kshs 862.5 bn fiscal deficit for the FY’2022/2023. However, the rate of undersubscription of the various bonds issued indicates investors’ apathy coupled with the tightened liquidity market, evidenced by the average interbank rate increasing to 5.7% from 5.4% recorded the previous week.
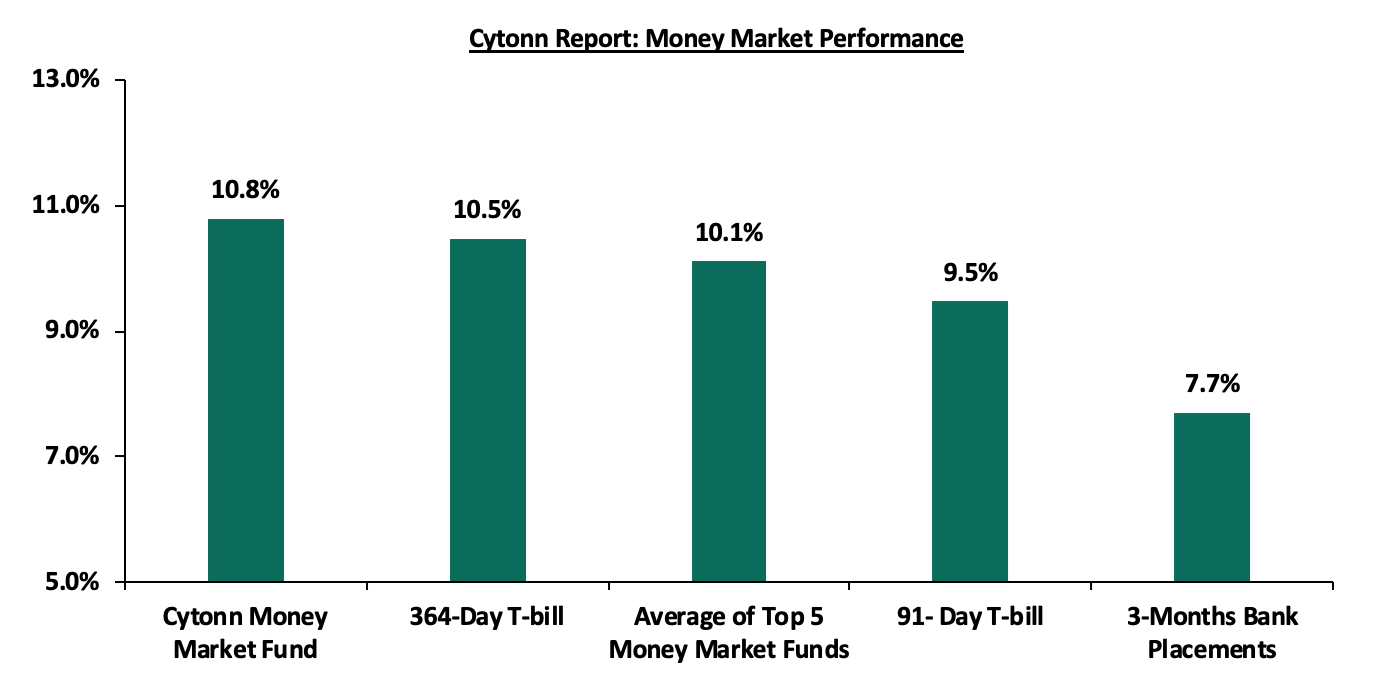
In the money markets, 3-month bank placements ended the week at 7.7% (based on what we have been offered by various banks), while the yield on the 364-day T-bill and 91-day T-bill increased by 3.8 bps and 4.9 bps to 10.5% and 9.5%, respectively. The average yield of the Top 5 Money Market Funds remained relatively unchanged at 10.1%, while yield on the Cytonn Money Market Fund declined slightly by 0.1% points to close the week at 10.8% from 10.9% recorded the previous week.
The table below shows the Money Market Fund Yields for Kenyan Fund Managers as published on 20th January 2023:
|
Cytonn Report: Money Market Fund Yield for Fund Managers as published on 20th January 2023 |
||
|
Rank |
Fund Manager |
Effective Annual Rate |
|
1 |
Cytonn Money Market Fund (dial *809# or download Cytonn App) |
10.8% |
|
2 |
Apollo Money Market Fund |
10.2% |
|
3 |
Zimele Money Market Fund |
9.9% |
|
4 |
Nabo Africa Money Market Fund |
9.8% |
|
5 |
GenCap Hela Imara Money Market Fund |
9.8% |
|
6 |
NCBA Money Market Fund |
9.8% |
|
7 |
Kuza Money Market fund |
9.7% |
|
8 |
Old Mutual Money Market Fund |
9.6% |
|
9 |
Sanlam Money Market Fund |
9.6% |
|
10 |
Madison Money Market Fund |
9.5% |
|
11 |
Dry Associates Money Market Fund |
9.3% |
|
12 |
Co-op Money Market Fund |
9.2% |
|
13 |
CIC Money Market Fund |
9.2% |
|
14 |
AA Kenya Shillings Fund |
9.1% |
|
15 |
British-American Money Market Fund |
8.9% |
|
16 |
ICEA Lion Money Market Fund |
8.8% |
|
17 |
Orient Kasha Money Market Fund |
8.6% |
|
18 |
Equity Money Market Fund |
7.7% |
|
19 |
Absa Shilling Money Market Fund |
7.6% |
Source: Business Daily
Liquidity:
During the week, liquidity in the money markets tightened, with the average interbank rate increasing to 5.7% from 5.4% recorded the previous week, partly attributable to tax remittances that offset government payments. The average interbank volumes traded declined by 30.9% to Kshs 15.6 bn from Kshs 22.5 bn recorded the previous week.
Kenya Eurobonds:
During the week, the yields on Eurobonds were on a downward trajectory with the yield on the 10-year Eurobond issued in 2014 recording the largest decline having declined by 1.2% points to 10.9% from 12.1%, recorded the previous week. The reduced yields on the 10 year Eurobond issued in 2014 is partly attributable to increased investor sentiments following International Monetary Fund (IMF) positive reviews as well as the new administration’s pledge on honouring debt payments. The table below shows the summary of the performance of the Kenyan Eurobonds as of 19th January 2023;
|
Cytonn Report: Kenya Eurobonds Performance |
||||||
|
|
2014 |
2018 |
2019 |
2021 |
||
|
Date |
10-year issue |
10-year issue |
30-year issue |
7-year issue |
12-year issue |
12-year issue |
|
Amount Issued (USD) |
2.0 bn |
1.0 bn |
1.0 bn |
* 2.1 bn |
1.0 bn |
|
|
Years to Maturity |
1.4 |
5.1 |
25.1 |
4.3 |
9.3 |
11.4 |
|
30-Dec-22 |
12.9% |
10.5% |
10.9% |
10.9% |
10.8% |
9.9% |
|
2-Jan-23 |
12.9% |
10.5% |
10.9% |
10.9% |
10.8% |
9.9% |
|
12-Jan-23 |
12.1% |
10.1% |
10.6% |
10.4% |
10.3% |
9.6% |
|
13-Jan-23 |
11.6% |
10.0% |
10.6% |
10.4% |
10.2% |
9.6% |
|
16-Jan-23 |
11.6% |
10.0% |
10.6% |
10.4% |
10.2% |
9.6% |
|
17-Jan-23 |
11.6% |
10.1% |
10.5% |
10.5% |
10.3% |
9.6% |
|
18-Jan-23 |
11.3% |
9.1% |
10.4% |
10.2% |
10.1% |
9.4% |
|
19-Jan-23 |
10.9% |
9.9% |
10.4% |
9.9% |
10.1% |
9.4% |
|
Weekly Change |
(1.2%) |
(0.2%) |
(0.2%) |
(0.5%) |
(0.2%) |
(0.2%) |
|
MTD Change |
(2.0%) |
(0.6%) |
(0.5%) |
(1.0%) |
(0.7%) |
(0.5%) |
|
YTD Change |
(2.0%) |
(0.6%) |
(0.5%) |
(1.0%) |
(0.7%) |
(0.5%) |
*2019 aggregate amount issued was USD 2.1 bn
Source: Central Bank of Kenya (CBK)
Kenya Shilling:
During the week, the Kenyan shilling depreciated by 0.2% against the US dollar to close the week at Kshs 124.1, from Kshs 123.8 recorded the previous week, partly attributable to increased dollar demand from importers, especially oil and energy sectors against a slower supply of hard currency. On a year to date basis, the shilling has depreciated by 0.5% against the dollar, adding to the 9.0% depreciation recorded in 2022. We expect the shilling to remain under pressure in 2023 as a result of:
- High global crude oil prices on the back of persistent supply chain bottlenecks coupled with high demand,
- An ever-present current account deficit estimated at 5.2% of GDP in the 12 months to November 2022, despite improving by 0.2% points from 5.4% recorded in a similar period in 2021,
- The need for Government debt servicing which continues to put pressure on forex reserves given that 69.3% of Kenya’s External debt was US Dollar denominated as of October 2022, and,
- A continued hike in the USA Fed interest rates in 2022 to a range of 4.25% - 4.50% in December 2022 has strengthened the dollar against other currencies by causing capital outflows from other global emerging markets.
The shilling is however expected to be supported by:
- Improved diaspora remittances standing at a cumulative USD 4.0 bn for the year 2022, representing an 8.3% y/y increase from a cumulative USD 3.7 bn recorded in 2021. Notably on a m/m basis, the remittance for the month of December 2022 increased by 3.4% to USD 0.4 bn, from USD 0.3 bn recorded in November 2022, and,
- Sufficient Forex reserves currently at USD 7.4 bn (equivalent to 4.1 months of import cover) as at 19th January 2023, which is above the statutory requirement of maintaining at least 4.0-months of import cover. The chart below summarizes the evolution of Kenya months of import cover over the last 10 years;
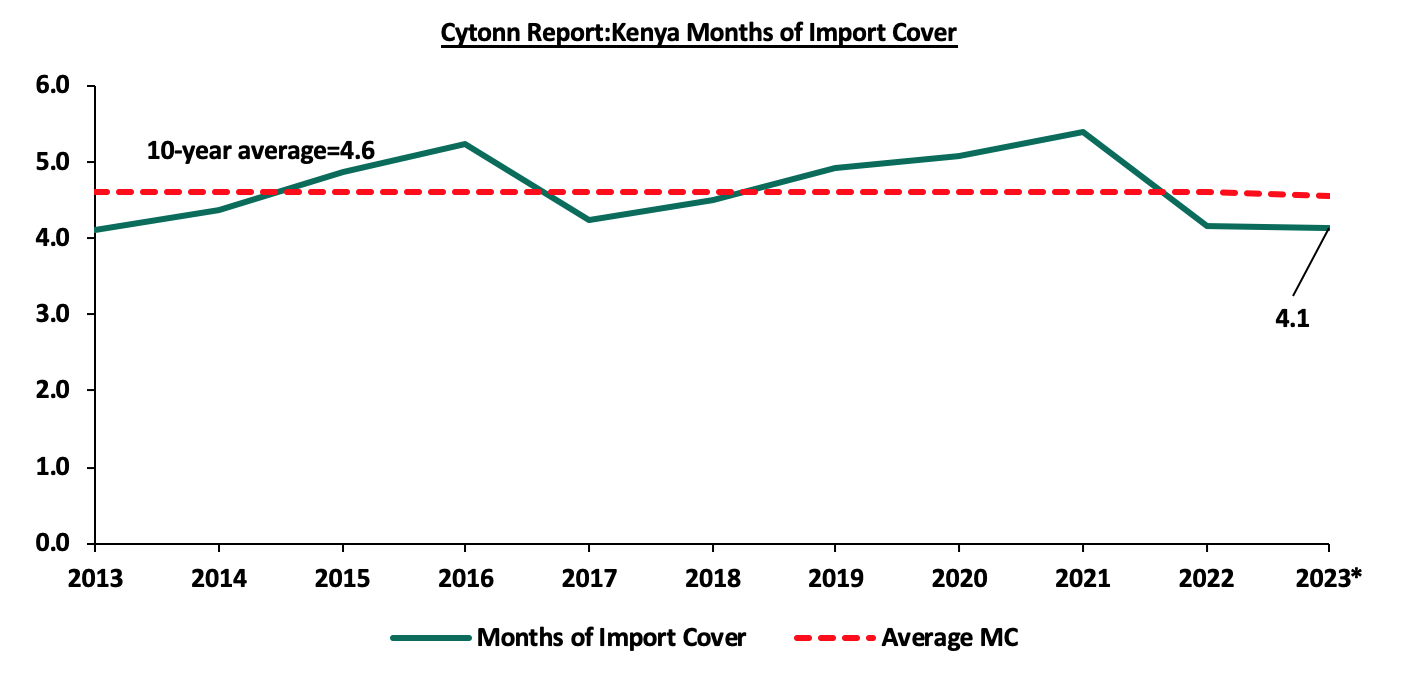
*Figure as of January 2023
Weekly Highlights:
- Excise Duty (Excisable Goods Management Systems) (Amendment) Regulations, 2023
On 13th January 2023, the Kenya Revenue Authority released the draft regulations for the Excise Duty (Excisable Goods Management Systems)(Amendment) Regulations, 2023 having reviewed the previous Excise Duty (Excisable Goods Management Systems)(Amendment) Regulations, 2017, under the Excise Duty Act No. 23 of 2015, seeking to increase the stamp duty fees on various commodities. The key take-outs from the draft include:
- Regulation 3 of the Excise Duty (Excisable Goods Management Systems) (Amendment) Regulations, 2017, has been amended to require that every package of excisable goods manufactured or imported into Kenya in the first schedule of regulations shall be subject to an excise stamp fees,
- The excisable goods provided in the second schedule of the Exercise Duty Regulations Act, 2017 shall be stamp-exempted,
- Increase on the stamp duty fees of the following categories of goods:
|
|
Cytonn Report: Proposed Exercise Duty on Various Commodities |
|||
|
|
Item |
Current Stamp Fee |
Proposed |
% Change |
|
1 |
cigarettes, tobacco, and products that contain nicotine or nicotine substitutes intended for inhalation excluding the medicinal products approved by the Cabinet Secretary for Health |
2.8 |
5.0 |
78.6% |
|
2 |
Compounded spirits with more than 6.0% alcohol content, wines and other alcoholic beverages obtained by fermenting fruits |
0.0 |
5.0 |
|
|
3 |
Spirits or beverages with less than 6.0% alcohol content |
0.0 |
3.0 |
|
|
4 |
A bottle of Beer, Cider, Perry, Mead or mixtures of fermented beverages with non-alcoholic beverages |
1.5 |
3.0 |
100.0% |
|
5 |
All bottled or packaged water as initially the stamp duty only applied to mineral and aerated water under the tariff 2201.10.00 |
0.0 |
0.5 |
|
|
6 |
Fruits juices (unfermented and not containing added spirit or sweetening ingredients) and other non-alcoholic beverages |
0.6 |
2.2 |
266.7% |
|
7 |
Cosmetics and beauty products classified under no: 3303, 3304, 3305, and 3307 |
0.6 |
2.5 |
316.7% |
|
Pending public feedback |
||||
Source: KRA
The proposed regulations shall be effective as from 1st March 2023 upon public approval and adoption by the legislature. As such, the public and stakeholders have until 3rd February to give their views via the Kenya Revenue Authority’s website. The proposed draft Regulations aim to lift some of the existing exemptions on excise stamp fees, and revise the existing stamp fees upwards for specified excisable goods, in line with the current administration’s objective to increase tax revenue and reduce the need for excessive borrowing. However, we believe the move is overly ambitious at a time when both businesses and consumers are grappling with elevated inflationary pressures coupled with depreciating currency that has consequently stifled consumer spending.
- Draft 2023 Policy Statement
On 18th January 2023, the National Treasury released the Draft 2023 Budget Policy Statement, projecting a 59.2% increase in tax revenue in the medium term to Kshs 4.0 tn by the end of FY’2026/27 from the Kshs 2.5 tn original FY’2022/23 budget estimates. As such, the government is keen to implement tax reforms and administrative tax policies. Kenya Revenue Authority is mandated to undertake the following measures among others: reduce the Value Added Tax (VAT) gap to 19.8% from 38.9%, minimize Corporate Income Tax gap to 30.0% from the current 32.2% recorded in FY’2022/23, integrate KRA tax system with telecommunication companies, and expand the tax base to include the informal sector targeting 2800 SMEs. KRA will also implement Rental Tax Measures and enhance Customs Border and Control through technical capacities to improve revenue collections. Other key take-outs from the report include;
- Total revenue to be collected by Kenya Revenue Authority (KRA) at the end of FY’2023/2024 inclusive of Appropriation-in-Aid (A.i.A), is projected to increase by 15.3% to Kshs 2.9 tn, from Kshs 2.5 tn in the original estimates in FY’2022/2023. The ambitious growth is pegged on increasing taxes such as the proposed excise duty regulations, and the on-going tax reforms with the rollout of electronic Tax Management System (eTIMS) expected to reduce the Value-Added tax (VAT) gap to 19.8% from the current 38.9%. Notably, in FY’2023/2024, the National Treasury projects to collect Kshs 2.6 tn in ordinary revenue, 17.1% increase from the projected 2.2 tn in FY’2022/2023,
- Total expenditure and net lending actual performance for the five months of FY’2022/2023 came in at Kshs 1.1 tn in November 2022, 9.6% below the original estimate of Kshs 1.2 tn Kshs, indicating the current administration’s efforts for low expenditures in fiscal consolidation. In FY’2023/2024, total expenditure is projected to increase by 7.4% to Kshs 3.6 tn in FY’2023/24 from the original estimates of Kshs 3.4 tn in FY2022/23, with recurrent expenditure expected to constitute 66.5% (Kshs 2.4 tn) while development expenditure and county government transfers will constitute 21.8% (Kshs 0.8 tn) and 11.6%(Kshs 0.4 tn). However, total government expenditure as a share of GDP is projected to decline by 1.3% points to 22.4% in FY’2023/24 from 23.7% in FY’2022/23, and,
- Fiscal deficit for FY’2023/2024 is projected to decline by 18.1% to a deficit of Kshs 695.2 bn in FY’2023/24, equivalent to 4.3% of the GDP from the original estimates of Kshs 849.2 bn recorded in FY’2022/23, equivalent to 5.8% of the GDP. The decline is attributable to the projected 15.3% growth in total revenue collections that is expected to outpace the projected expenditure growth of 7.4%.
The increased revenue collection target to Kshs 2.6 tn for FY’2023/2024, from this fiscal year’s target of Kshs 2.1 tn was expected given the current administration’s focus on expanding the tax base to include the informal sector, increasing the exercise duty tax, and the roll-out of the e-TIMS system to improve VAT collection margins. However, the upward revision of taxes comes at a time when the business environment remains subdued, underpinned by the elevated inflationary pressures and the aggressive depreciation of the Kenyan shilling that has suppressed business production levels. The low production performance will weigh down on the revenue performance. Further, we believe that despite KRA’s efforts to increase tax revenues, the fiscal deficit remains a challenge due to the historical mismatch between revenue and expenditure.
Rates in the Fixed Income market have remained relatively stable due to the relatively ample liquidity in the money market. The government is 1.1% behind its prorated borrowing target of Kshs 324.4 bn having borrowed Kshs 320.8 bn of the Kshs 581.7 bn borrowing target for the FY’2022/2023. We expect sustained gradual economic recovery as evidenced by the revenue collections of Kshs 987.9 bn in the FY’2022/2023 as at the end of December, equivalent to a 46.1% of its target of Kshs 2.1 tn. Despite the performance, we believe that the projected budget deficit of 6.2% is relatively ambitious given the downside risks and deteriorating business environment occasioned by high inflationary pressures. We however expect the support from the IMF and World Bank to ease the need for elevated borrowing and thus help maintain a stable interest rate environment since the government is not desperate for cash. Owing to this, our view is that investors should be biased towards short-term fixed-income securities to reduce duration risk.
Market Performance:
During the week, the equities market recorded mixed performance, with NASI gaining by 0.8%, while NSE 20 declined by 0.7%. NSE 25 remained relatively unchanged, taking the YTD performance to losses of 2.4% and 0.7% for NASI and NSE 25, respectively, and a 0.5% gain for NSE 20. The equities market performance was mainly driven by gains recorded by large cap stocks such as Bamburi and Safaricom of 4.6% and 2.5%, respectively. The gains were however weighed down by losses recorded by large cap stocks such as Diamond Trust Bank (DTB-K), EABL and Co-operative Bank of 3.3%, 2.3% and 1.6%, respectively.
During the week, equities turnover significantly increased by 294.1% to USD 40.0 mn from USD 9.4 mn recorded the previous week. This was attributable to increased foreign trading on Safaricom, which saw its turnover significantly increase to USD 29.8 mn from USD 2.8 mn recorded the previous week, representing 80.7% of the weekly turnover of the bourse, thus taking the YTD turnover for the equities market to USD 52.6 mn. Additionally, foreign investors remained net sellers, with a net selling position of USD 20.1 mn, from a net selling position of USD 1.2 mn recorded the previous week, taking the YTD net selling position to USD 23.6 mn.
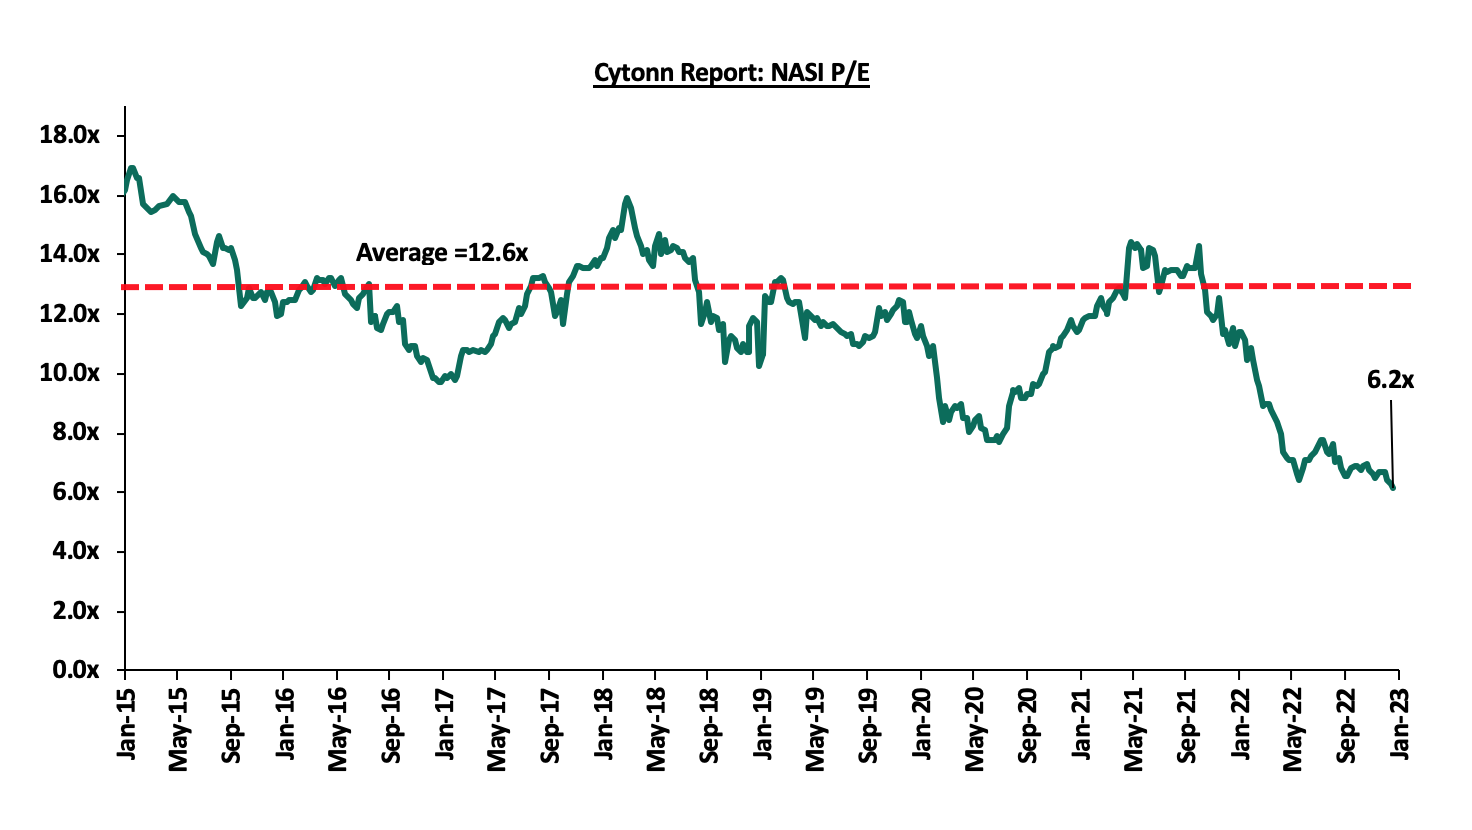
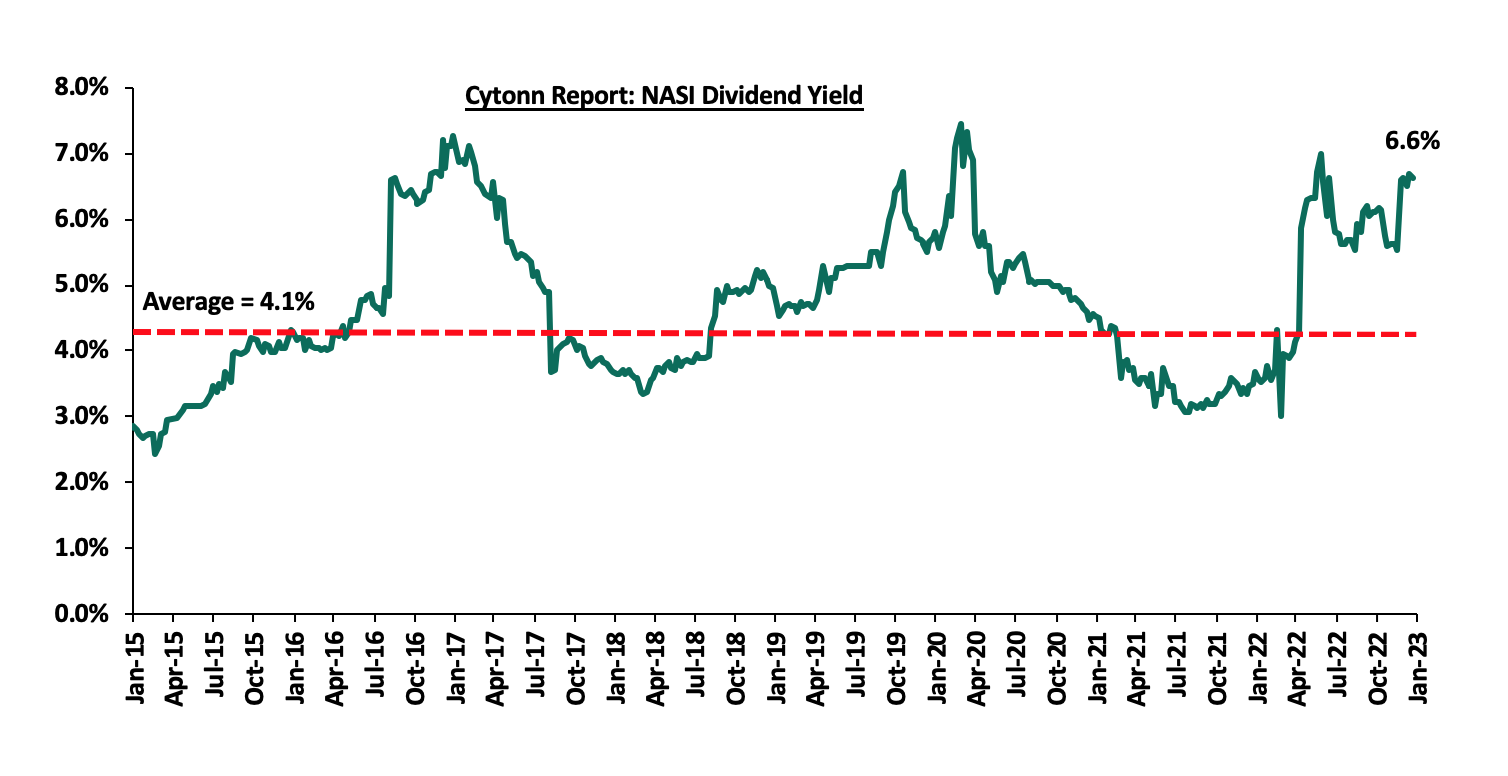
The market is currently trading at a price to earnings ratio (P/E) of 6.2x, 51.0% below the historical average of 12.6x, and a dividend yield of 6.6%, 2.5% points above the historical average of 4.1%. Key to note, NASI’s PEG ratio currently stands at 0.8x, an indication that the market is undervalued relative to its future growth. A PEG ratio greater than 1.0x indicates the market may be overvalued while a PEG ratio less than 1.0x indicates that the market is undervalued. The charts below indicate the historical P/E and dividend yields of the market;
Weekly Highlight:
Q3’2022 Insurance Industry Report
During the week, the Insurance Regulatory Authority of Kenya (IRA) released the Quarterly Insurance Industry Report for the period ending 30th September 2022 highlighting that the industry’s profits after tax declined by 3.3% to Kshs 6.2 bn in Q3’2022, from Kshs 6.4 bn recorded in Q3’2021. The decline in profits was mainly driven by a 10.8% increase in claims incurred in the general insurance to Kshs 56.8 bn in Q3’2022, from Kshs 51.3 bn in Q3’202, coupled with 2.9% increase in management expenses to Kshs 34.9 bn in Q3’2022, from Kshs 33.9 bn in Q3’2021. However, the industry’s performance was cushioned from a further decline by a 14.2% decrease in policy holder’s benefits paid in the long term insurance segment to Kshs 52.8 bn in Q3’2022, from Kshs 61.5 bn in Q3’2021. Additionally, the industry’s gross premiums grew by 11.4% y/y to Kshs 237.9 bn in Q3’2022, from Kshs 213.5 bn recorded in Q3’2021, with the general insurance business contributing 56.5% of the industry’s premium income, a slight decline of 0.4% points from the 56.9% contribution witnessed in Q3’2021.
Other key take-outs from the report include:
- Investment income declined by 20.8% to Kshs 32.0 bn in Q3’2022, from Kshs 40.4 bn recorded in Q3’2021 for long term insurance business, and similarly declined by 16.1% for general insurance business to Kshs 8.1 bn, from Kshs 9.7 bn recorded in Q3’2021. The declines are partly attributable to fair value losses on quoted equity investments in the capital markets as evidenced by the declines in the NASI, NSE 25 and NSE 20 which posted losses of 23.2%, 10.3% and 17.4%, respectively, at the end of Q3’2022,
- Net premium income for the long term business grew by 11.9% to Kshs 95.2 bn in Q3’2022, from Kshs 85.0 bn in Q3’2021, mainly driven by a 26.9% growth in the net premium under Deposit Administration segment to Kshs 37.6 bn in Q3’2022, from Kshs 29.6 bn in Q3’2021. Additionally, net premium from Group Life segment increased by 12.7% to Kshs 12.1 bn in Q3’2022, from Kshs 10.8 bn in recorded in Q3’2021. However, the retention ratio for the long term business declined slightly by 0.3% points to 92.0% in Q3’2022, from 92.3% recorded in Q1’2021
- Net claims for the general business increased by 10.8% to Kshs 56.8 bn, from Kshs 51.3 bn in Q2’2022, driven by a 22.2% growth in medical claims to Kshs 23.9 bn in Q3’2022, from Kshs 19.6 bn in Q3’2021. Contrastingly, net premiums income increased by 11.3% to Kshs 93.8 bn in Q3’2022, from Kshs 84.3 bn in Q3’2021,
- The loss ratio for the long term business improved by 16.9% points to 55.4%, from 72.3% recorded in Q3’2021 on the back of a 11.9% increase in net premium income, coupled with a 14.2% decrease in net claims in Q3’2022. On the other hand, the loss ratio for the general insurance businesses slightly businesses improved slightly by 0.2% points to 68.4% in Q3’2022, from 68.6% in Q3’2021 owing to a 11.3% increase in net earned premium income which outpaced the 10.8% increase in the claims,
- The combined ratio for general insurance business improved by 2.8% points to 102.7% in Q3’2022, from 105.5% recorded in Q3'2021 and remained relatively unchanged from Q2'2022. The y/y decrease in the combined ratio was mainly attributable to the 2.5% points drop in the management expense ratio, to 27.5% in Q3'2022, from 30.0% in Q3'2021, coupled with a 0.2% points decline in the claims ratio to 68.4%, from 68.6% in Q3’2021, and,
- Notably, the general insurance businesses recorded an underwriting loss of Kshs 2.3 bn, which was an improvement as compared to the underwriting loss of Kshs 4.1 bn recorded in Q3’2021. The improvement was mainly driven by the 50.1% increase in the underwriting profit of Kshs 2.5 bn from Kshs 1.7 bn in Q3’2021, coupled with 40.2% and 29.4% declines in motor private and motor commercial underwriting losses to Kshs 2.9 bn and Kshs 1.8 bn from Kshs 4.8 bn and Kshs 2.5 bn recorded in Q3’2021, respectively.
The insurance sector continues to suffer from low insurance penetration rates at 2.2% at the end of 2021, 4.8% points lower than the global average of 7.0%. This has been worsened by a deteriorated local business environment due to hiked interest rates and elevated inflationary pressures that have reduced the disposable income and reduced consumer spending among Kenyans. Despite that, the industry remained resilient during the quarter evidenced by improvement in its loss ratios during the quarter, coupled with a decline in the amounts claimed in the long term line of business. Going forward, we note that insurance sector has much strides to cover to increase the uptake of insurance in the country. As such, we expect the insurance sectors’ players and regulators to come up with measures that will improve efficiency to lower the elevated expense ratio, which came in at 34.3% at the end of Q3’2022. Additionally, since the core underwriting business remains unprofitable, we also expect investment diversification into avenues such as unit trusts and fund management to minimize losses.
Universe of coverage:
|
Company |
Price as at 06/01/2023 |
Price as at 13/01/2023 |
w/w change |
YTD Change |
Target Price* |
Dividend Yield |
Upside/ Downside** |
P/TBv Multiple |
Recommendation |
|
|
Jubilee Holdings |
195.0 |
196.3 |
0.6% |
(1.3%) |
305.9 |
0.5% |
56.4% |
0.4x |
Buy |
|
|
Kenya Reinsurance |
1.9 |
1.8 |
(3.2%) |
(3.7%) |
2.5 |
5.6% |
45.0% |
0.1x |
Buy |
|
|
KCB Group*** |
38.7 |
38.4 |
(0.8%) |
0.1% |
52.5 |
7.8% |
44.5% |
0.6x |
Buy |
|
|
Sanlam |
9.0 |
8.3 |
(7.7%) |
(12.9%) |
11.9 |
0.0% |
42.8% |
0.9x |
Buy |
|
|
Liberty Holdings |
5.5 |
4.8 |
(12.5%) |
(4.2%) |
6.8 |
0.0% |
39.8% |
0.4x |
Buy |
|
|
ABSA Bank*** |
12.3 |
12.3 |
0.4% |
0.8% |
15.5 |
12.2% |
37.8% |
1.0x |
Buy |
|
|
Equity Group*** |
46.6 |
46.0 |
(1.2%) |
2.1% |
58.4 |
6.5% |
33.4% |
1.1x |
Buy |
|
|
Britam |
5.6 |
5.4 |
(3.6%) |
3.1% |
7.1 |
0.0% |
32.8% |
0.9x |
Buy |
|
|
Co-op Bank*** |
12.6 |
12.4 |
(1.6%) |
2.5% |
15.5 |
8.1% |
32.8% |
0.7x |
Buy |
|
|
I&M Group*** |
17.0 |
17.1 |
0.6% |
0.3% |
20.8 |
8.8% |
30.5% |
0.4x |
Buy |
|
|
NCBA*** |
38.7 |
38.3 |
(1.0%) |
(1.7%) |
43.4 |
11.1% |
24.4% |
0.9x |
Buy |
|
|
CIC Group |
2.0 |
1.9 |
(2.1%) |
0.0% |
2.3 |
0.0% |
21.5% |
0.7x |
Buy |
|
|
Diamond Trust Bank*** |
53.0 |
51.3 |
(3.3%) |
2.8% |
57.1 |
5.9% |
17.3% |
0.2x |
Accumulate |
|
|
Standard Chartered*** |
155.5 |
155.0 |
(0.3%) |
6.9% |
166.3 |
3.9% |
11.1% |
1.1x |
Accumulate |
|
|
HF Group |
3.1 |
3.1 |
(0.3%) |
(0.6%) |
3.4 |
0.0% |
9.6% |
0.2x |
Hold |
|
|
Stanbic Holdings |
108.8 |
111.8 |
2.8% |
9.6% |
112.0 |
8.1% |
8.3% |
1.0x |
Hold |
|
|
*Target Price as per Cytonn Analyst estimates **Upside/ (Downside) is adjusted for Dividend Yield ***For Disclosure, these are stocks in which Cytonn and/or its affiliates are invested in |
||||||||||
We are “Neutral” on the Equities markets in the short term due to the current adverse operating environment and huge foreign investor outflows, and, “Bullish” in the long term due to current cheap valuations and expected global and local economic recovery.
With the market currently trading at a discount to its future growth (PEG Ratio at 0.8x), we believe that investors should reposition towards value stocks with strong earnings growth and that are trading at discounts to their intrinsic value. We expect the current high foreign investors sell-offs to continue weighing down the economic outlook in the short term.
- Residential Sector
During the week, President Ruto oversaw the ground breaking of the Kings Boma Estate affordable housing project consisting 1,050 residential units, worth Kshs 2.8 bn, located along the Ruiru-Kiambu road in Kiambu County, nearing Kenya Prisons Staff Training College. Construction of the project will be spearheaded by Kings Developers Limited (KDL), a local Real Estate development company, on a 6.1-acre piece of land provided through a partnership with the government under a Public-Private Partnership (PPP). The housing units will consist of studio, 1, 2 and 3-bedroom residential units as shown below;
|
Cytonn Report: Kings Boma Estate Project |
|||
|
Typology |
Unit size (SQM) |
Price |
Price per SQM |
|
Studio |
25 |
2.0 mn |
80,000 |
|
1 bedroom |
30 |
1.5 mn |
50,000 |
|
2 bedroom |
40 |
2.0 mn |
50,000 |
|
2 bedroom |
64 |
3.4 mn |
53,000 |
|
2 bedroom |
75 |
4.0 mn |
53,000 |
|
3 bedroom |
85 |
4.5 mn |
53,000 |
|
Average |
53 |
2.9 mn |
56,500 |
Source: Cytonn Research
The Kings Boma Estate project comes at a time when the government has intensively focused on affordable housing initiative with an aim of constructing 200,000 annually. This is in a bid to curb the 80.0% annual housing deficit, as only 50,000 new houses are delivered annually, with the demand for housing in Kenya at 250,000 houses annually. The affordable housing projects in the pipeline include;
|
Cytonn Report: Notable Ongoing Affordable Housing Projects by the Government |
|||
|
Name |
Developer |
Location |
Number of Units |
|
Pangani Affordable Housing Program |
National Government and Tecnofin Kenya Limited |
Pangani |
1,562 |
|
River Estate Affordable Housing Program |
National Government and Erdemann Property Limited |
Ngara |
2,720 |
|
Park Road Affordable Housing Program |
National Housing Corporation |
Ngara |
1,370 |
|
Mukuru Affordable Housing Program |
National Housing Corporation |
Mukuru kwa Njenga, Enterprise Road |
15,000 |
|
Mavoko Affordable Housing Project |
National Government and Epco Builders |
Syokimau, Machakos County |
5,360 |
|
NHC Stoni Athi View (Economy Block-Rental) |
National Housing Corporation |
Athi River, Machakos County |
50 |
|
NHC Stoni Athi View |
National Housing Corporation |
Athi River, Machakos County |
120 |
|
Mariguini Informal Settlement |
National Government |
Starehe, Nairobi County |
2,600 |
|
Kibera Soweto East Zone B |
National Government |
Kibera, Nairobi County |
3,000 |
|
Starehe Affordable Housing Project |
National Government and Tecnofin Kenya Limited |
Starehe, Nairobi County |
3,000 |
|
Kings Boma Estate |
National Government and Kings Developers Limited |
Gitabaya Estate, Kiambu County |
1,050 |
|
Total |
|
|
35,832 |
Source: Boma Yangu Portal
In addition to the above, there also exists several projects initiated by private developers to fast-track the delivery of housing projects through the program such as;
|
Cytonn Report: Notable Ongoing Affordable Housing Projects by the Private Sector |
|||
|
Name |
Developer |
Location |
Number of Units |
|
Great Wall Gardens Phase 5 |
Erdemann Limited |
Mavoko, Machakos County |
1,128 |
|
Samara Estate |
Skymore Pine Limited |
Ruiru |
1,824 |
|
Moke Gardens |
Moke Gardens Real Estate |
Athi River |
30,000 |
|
Habitat Heights |
Afra Holding Limited |
Mavoko |
8,888 |
|
Tsavo Apartments |
Tsavo Real Estate |
Embakasi, Riruta, Thindigua, Roysambu, and, Rongai |
3,200 |
|
Unity West |
Unity Homes |
Tatu City |
3,000 |
|
RiverView |
Karibu Homes |
Athi River |
561 |
|
Kings Serenity |
|
Ongata Rongai, Kajiado County |
734 |
|
Joinven Estate |
Joinven Investments Limited |
Syokimau, Machakos County |
440 |
|
Total |
|
|
49,775 |
Source: Boma Yangu Portal
Upon completion, we expect the aforementioned affordable housing projects to boost the performance of the Real Estate sector by increasing the ownership rates in the country, which currently stands at a national average of 61.3%. This is as compared to other African countries like Angola and Algeria with 75.4% and 74.8% national home ownership rates respectively, according to the Centre for Affordable Housing Finance in Africa (CAHF). The graph below shows the national home ownership percentages for different countries compared to Kenya;
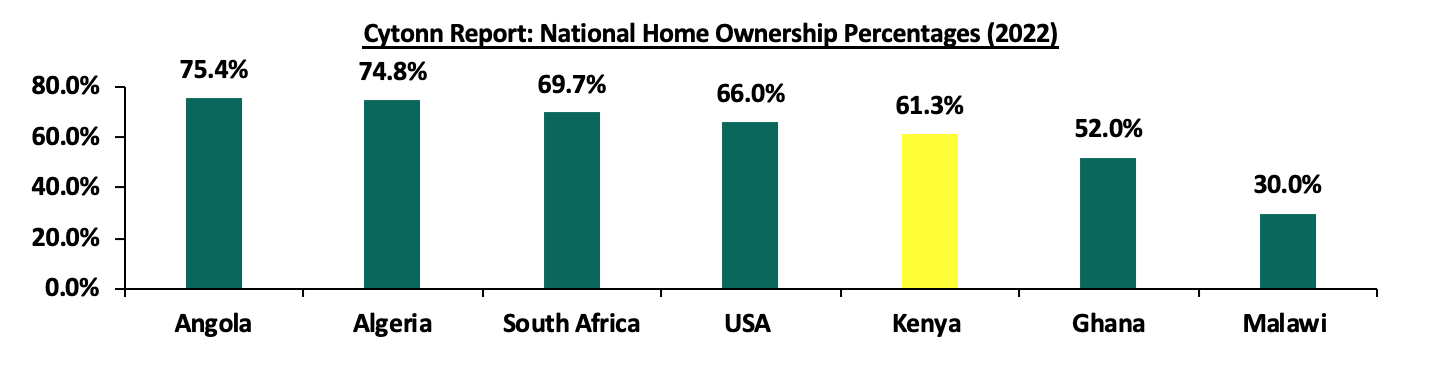
Source: US Census Bureau, CAHF
Increasing the rate of home ownership therefore makes it necessary for the government to clearly prioritize the provision of affordable housing, in order to facilitate decent living standards for all Kenyans, particularly in urban areas, which stood at 21.3% in 2020, compared to other African countries such as South Africa and Ghana with a 53.0% and 47.2% urban home ownership rates respectively, as shown below;
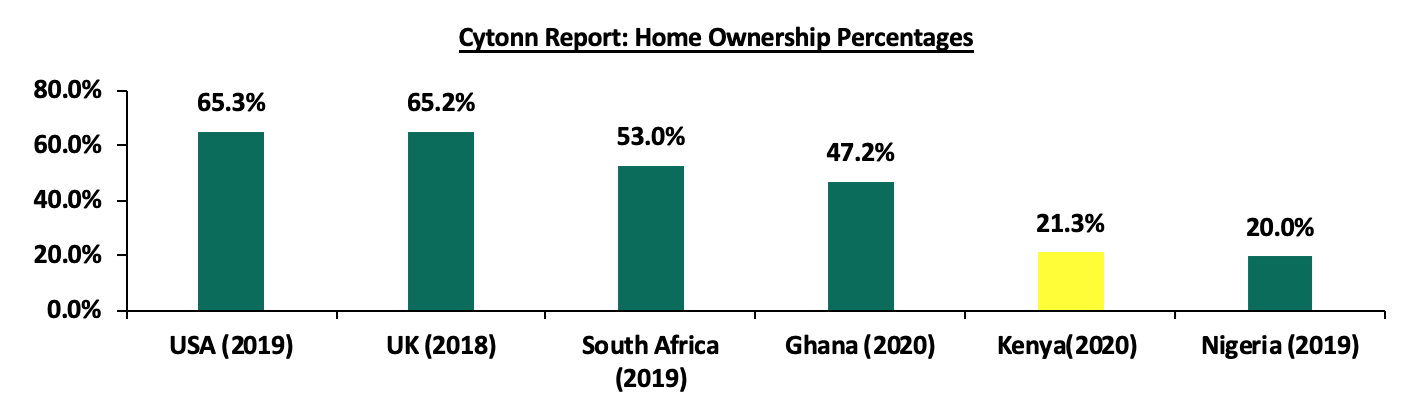
Source: Federal Reserve Bank, CAHF
However, the difficulty developers face in accessing financing with banks providing about 99.0% of funding at expensive rates, coupled with an underdeveloped capital markets regime, amid increasing costs of construction on the back of inflation continues to hamper optimum development activities in the sector. In addition, the government's allocated expenditure for Infrastructure, Energy, and ICT in the draft Budget Policy Statement for FY'2023/2024 is forecast to be Kshs 398.2 bn, which is a 4.4% decline compared to the Kshs 416.4 bn allocation in FY'2022/2023. The decline in government spending will reduce construction of new roads, bridges, and other support services that are essential for the development of housing, thereby subduing the sector. This illustrates the need to explore alternative financing models, such as Public-Private Partnerships (PPPs), to ensure the necessary resources are made available. We therefore expect an increase in implementation of PPPs in the sector, as they provide a long-term and sustainable solution that can help to bridge the gap between current funding levels that is over-reliant on bank financing and what is needed to meet the growing demand for housing.
- Real Estate Investment Trusts (REITs)
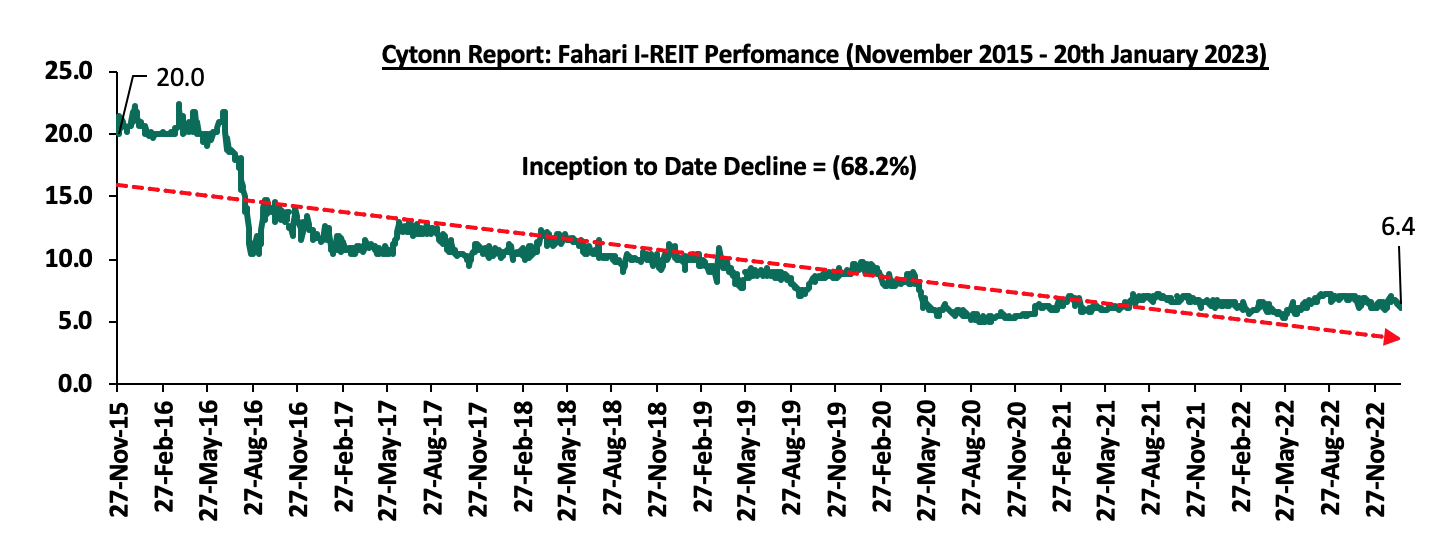
In the Nairobi Securities Exchange, ILAM Fahari I-REIT closed the week trading at an average price of Kshs 6.4 per share, remaining relatively unchanged from the previous week. The performance represents a 6.2% Year-to-Date (YTD) decline from Kshs 6.8 per share recorded at the beginning of the year, taking it to a 68.2% Inception-to-Date (ITD) loss from the Kshs 20.0 price. The dividend yield currently stands at 7.9%. The graph below shows Fahari I-REIT’s performance from November 2015 to 20th January 2023;
In the Unquoted Securities Platform, Acorn D-REIT and I-REIT traded at Kshs 23.9 and Kshs 20.9 per unit, respectively, as at 13th January 2023. The performance represented a 19.4% and 4.4% gain for the D-REIT and I-REIT, respectively, from the Kshs 20.0 inception price. The volumes traded for the D-REIT and I-REIT came in at 12.3 mn and 28.7 mn shares, respectively, with a turnover of Kshs 257.5 mn and Kshs 591.8 mn, respectively, since inception in February 2021.
We anticipate the performance of Kenya’s Real Estate sector to continue on an upward trajectory in terms of activity on the back of the ongoing focus by the government and private sector to increase home ownership in the country through the initiation and actuation of affordable housing projects. However, we expect the performance of the Real Estate sector to be subdued by difficulty in accessing development financing, and the stymied REITs market that is constrained by challenged such as; i) inadequate investor knowledge of REITs as an investment vehicle, ii) lengthy approval process in creation of REITs, iii) high minimum capital requirements for a Trustee at Kshs 100.0 mn, iv) only few entities capable of incorporating REITs, and, v) High minimum investment amounts set at Kshs 5.0 mn.
In recent years, Ruaka has become one of the fastest growing satellite towns in the Nairobi Metropolitan Area (NMA), and has become a major centre for Real Estate investment and development. Offering relatively higher returns of up to 7.5%, compared to satellite towns average of 6.9%, as highlighted in our Annual Markets Review 2022. This has also driven a construction boom in Ruaka supported by the growing demand for residential property. Additionally, there has been a shift by investors towards satellite towns attributable to availability of cheaper land for development in these areas, coupled with improved accessibility owing to key infrastructural developments that have unlocked value for investors. In 2022, land prices in satellite towns recorded the highest capital appreciations of 11.1% and 8.0% for unserviced and serviced land respectively, against the 4.3% market average cementing their affordability. Furthermore, infrastructural developments have played a fundamental role in connecting Ruaka to main transport networks, and have also reduced commute time to the city centre thus benefitting home buyers seeking to settle in serene neighbourhoods around away from the city, and at the same time have the convenience of travel time.
Ruaka has become an investor’s paradise, and a thriving hub for Real Estate development in the NMA Real Estate sector. We have been tracking its performance through a series of supplementary research reports. In 2018, we published a research note on the investment opportunity in Ruaka, which highlighted the area’s average total returns to investors at 11.1%, on the back of high rental yields and capital appreciation of 5.3% and 5.8%, respectively. As such, we decided to update our previous market research in Ruaka to determine and analyse new market trends, as well as reaffirm the area’s market performance by covering the following:
- Introduction,
- Overview of Ruaka,
- Market Performance, and,
- Conclusion and Recommendation.
- Introduction
Ruaka is a suburb located along Limuru Road within Karuri Municipality in Kiambu County, to the northwest of Nairobi city, and 15.0 km from the Nairobi Central Business District (CBD). Ruaka was historically a pre-colonial rural shopping centre, with the hinterland being utilized for agricultural purposes, which formed part of the former Karuri Town Council local authority area. However, subsequent change of land-use in recent years on the back of continued urbanization paved way for zoning ordinances that allowed for more comprehensive and high-density developments in the area. Today, Ruaka’s housing profile is predominantly comprised of high-rise apartment complexes, owing to the area’s growing middle-income earning population and the need for developers to construct efficiently within the available land. Due to this, we focused our research on Ruaka’s furnished and unfurnished residential apartments market. In order to evaluate the investment opportunity in the area, we assessed the unfurnished apartments’ performance in terms of selling price, rental yield, capital appreciation, total returns and made a comparison with the performance on a year on year basis. In addition, we assessed the furnished apartments’ market performance in terms of monthly rent, occupancy, and rental yield to investors in the Real Estate sector within Ruaka.
- Overview of Ruaka
Over the years, Ruaka has seen considerable growth in terms of the Real Estate sector, with increased activity in the residential, commercial office, retail, and industrial sectors. This is as a result of improved accessibility to the area on the back of improved infrastructural development, owing to the construction of the Northern and Western Bypasses. This makes the area attractive for investment, by reason of which Cytonn Investments has two residential developments; The Alma and Taraji Heights within Ruaka. Some of the strengths that have continued to drive the growth of the Real Estate sector in Ruaka over the years include:
- Ample infrastructure: The completion of the Northern Bypass and the expansion of Limuru Road served to greatly improve accessibility in Ruaka and its environs. The upgrade of these roads, in conjunction with the existing Banana-Raini Road, Redhill Road, and Ruaka Hill Road, reduced transit times to the larger NMA, thereby increasing investment activities. Furthermore, these improved roadways connect to major highways such as the Waiyaki Way, Nairobi-Nakuru highway, and the Western Bypass completed in 2022, opening up the area and thereby boosting its Real Estate sector,
- Accessibility to social amenities: Ruaka has access to attractive amenities such as Windsor Golf Club and Wadi Degla Sporting Club
- Accessibility to key shopping centers: Ruaka boasts access to some of the best amenities in the country and the Eastern Africa region, including top-of-the-line shopping centers and leisure spaces. One notable example is Two Rivers, which is currently the largest mall in East and Central Africa. Additionally, Ruaka is adjacent to superb shopping centers such as Rossyln Riveira and Village Market, providing even more affordable options for the middle-income residents living in Ruaka who seek high-end amenities, making it a desirable location,
- Strategic location: Ruaka is strategically located within the NMA, neighboring prime and affluent neighborhoods such as Runda (4.3km), Rossyln (4.2km), Gigiri (6.0km), and Nyari Estate (5.5km). Additionally, it is situated near the United Nations approved diplomatic blue zone. These areas boast of a wide range of prime properties, including high-end residential properties, Grade A office spaces, and prime commercial centers. The presence of foreign embassies and headquarters of international organizations, such as the United States of America, Embassy of Jordan, Italian Embassy, and United Nations, have had a positive impact on property values in Ruaka owing to influx of workers in foreign embassies and headquarters of international organizations, thus creating demand for housing units ,
- Improved security measures and systems: As Ruaka transformed from a rural area into a rapidly growing urban center within the NMA, the suburb saw an increase in security measures. This is due to the increase in population due to urbanization, leading to more safety needs. Consequently, most developers responded to this demand by building properties with guarded gates, security camera surveillance systems, and electric fences. Additionally, the presence of the Ruaka Police Station and installation of street lights along the major highways and street-ways add an extra layer of security to the area, supplementing the private security measures put in place by investors in the area,
- Educational institutions: Ruaka hosts a number of both public and private learning institutions such as Simoga Valley Primary School, Castle Academy Ruaka, Gacharage School, and many more. With its proximity to affluent neighborhoods, the area complements with international educational institutions in those regions such as International School of Kenya, Peponi School and Rosslyn Academy Creche International German School Nairobi Montessori Plus Centre. These schools not only focus on academic development, but also promote the growth of students in areas such as relationships, identities, emotional abilities, and overall well-being, and,
- Health facilities: The Ruaka area is served by a robust healthcare infrastructure, consisting of a plethora of medical centers that cater to the needs of the residents. Some of the notable hospitals in the area include AAR Healthcare Ruaka, M.P. Shah Hospital, and Gertrude’s Children’s Hospital Ruaka, which are among the leading healthcare providers in the country. This is also doubled up by the presence of numerous public hospitals, private clinics and pharmacies that are readily available to cater to the healthcare needs of the population in the area, making it a suitable residence for many.
- Market Performance
The vibrant market performance in Ruaka is animated by the area’s constantly growing demand for housing, driven by an expanding population which is a mix of both local middle-income earners as well as foreign residents. According to the KNBS, the larger Karuri area emerged among the top-ten most populous urban areas with a population of 194,342 people in the 2019 Census, registering a 49.6% increase from the 129,934 people recorded in the 2009 Census. Given an annual national population growth of 1.9%, it is projected that the population will be 217,576 people by 2025. As highlighted in our Annual Markets Review 2022, Ruaka was the leading node in terms of unfurnished apartment performance, with average total return of 7.5% against the NMA residential sector average total return of 6.8%. In addition, the Limuru Road area hosting Ruaka serves as a residence for workers in foreign embassies and headquarters of international organizations, thus creating demand for housing units. Consequently, Limuru Road recorded an average rental yield of 5.8%, though lower than the 6.2% furnished apartments’ average yield according to our NMA Furnished Apartments Report 2022. In 2023, we focused on the performance of residential as well as furnished apartments in the area:
- Unfurnished Apartments Market
The table below shows the year-on-year comparison in performance for residential apartments in Ruaka;
|
Cytonn Report: Ruaka Unfurnished Apartments Year-on-Year Performance Summary |
|||||||||
|
Unit Typology |
Plinth Area (SQM) |
Price per SQM Q1'2022 |
Price per SQM Q1'2023 |
Rent per SQM Q1'2023 |
Occupancy |
Annualized Uptake |
Rental Yield |
Price Appreciation |
Total Return |
|
One-Bedroom |
60 |
118,083 |
121,448 |
630 |
75.2% |
20.8% |
3.9% |
5.1% |
9.0% |
|
Two-Bedroom |
92 |
99,022 |
101,291 |
484 |
85.1% |
15.4% |
4.9% |
2.2% |
7.1% |
|
Three-Bedroom |
122 |
101,852 |
106,475 |
503 |
82.4% |
16.3% |
4.8% |
5.5% |
10.3% |
|
Average |
102 |
103,734 |
107,492 |
510 |
82.9% |
16.5% |
4.8% |
4.0% |
8.8% |
Source: Cytonn Research
The key take-outs from the table above include:
- Average Total Returns: The average total return for apartments in Ruaka increased by 1.3% points to 8.8% in Q1’2023 from 7.5% recorded in Q1’2022, driven by an average rental yield of 4.8% and a capital appreciation of 4.0%. The apartments’ rental yield reduced by 0.8% points to 4.8% in 2023 from 5.6% recorded in Q1’2022, majorly attributable to a decrease in average asking rent to Kshs 510 from Kshs 559 realized in Q1’2022. The Year-on-Year (y/y) price appreciation increased by 2.1% points to 4.0% in Q1’2023 from 1.9% recorded in Q1’2022, driven by an increase in average apartment selling price to Kshs 107,492 from the Kshs 103,734 realized in 2022, and,
- Typology Performance: The best performing typology was three-bedroom apartments owing to high average total returns coming in at 10.3% compared to one-bedroom and two-bedroom apartments offering total returns of 9.0% and 7.1%, respectively.
The table below shows the breakdown in performance for the profiled one-bedroom apartments in Ruaka;
|
All values in Kshs unless stated otherwise |
|||||||||
|
Cytonn Report: One-Bedroom Unfurnished Apartments Summary |
|||||||||
|
Property |
Plinth Area (SQM) |
Price per SQM Q1'2022 |
Price per SQM Q1'2023 |
Rent per SQM Q1'2023 |
Occupancy |
Annualized Uptake |
Rental Yield |
Price Appreciation |
Total Return |
|
The Alma Phase 1, 2 & 4 |
51 |
154,902 |
166,667 |
784 |
66.7% |
5.5% |
3.8% |
7.6% |
11.4% |
|
Cascadia Apts |
57 |
154,386 |
161,404 |
877 |
|
20.3% |
|
4.5% |
4.5% |
|
Willow Park Apts |
65 |
96,923 |
100,000 |
415 |
82% |
30.0% |
4.1% |
3.2% |
7.3% |
|
Magic Dash Apts |
68 |
102,941 |
102,941 |
441 |
77% |
27.7% |
4.0% |
0.0% |
4.0% |
|
Average |
60 |
118,083 |
121,448 |
630 |
75.2% |
20.8% |
3.9% |
5.1% |
9.0% |
Source: Cytonn Research
The key take-outs from the table above include:
- Average Total Returns: The average total return for one-bedrooms in Ruaka came in at 9.0% in Q1’2023, compared to 11.4% recorded in our previous research in 2018, driven by decrease in rental yields by 0.6% points from 4.5% in 2018. However, the 0ne-bedroom apartments recorded a 4.9% gain in average selling price to Kshs 121,448 in 2023, from Kshs 115,821 recorded in 2018. This is in addition to the 2.8% increase in average selling price from Kshs 118,083 in Q1’2022 attributable to; i) increased demand from young and single professional workers who prefer one-bedroom units than other typologies, which is enough for their shelter needs, and, ii) presence and affordability of the apartment units in Ruaka as compared to its environs such as Runda, and Rossyln, which have no allowances for high-rise apartment complexes in their zoning ordinances.
The table below shows the breakdown in performance for the profiled two-bedroom apartments in Ruaka;
|
All values in Kshs unless stated otherwise |
|||||||||
|
Cytonn Report: Two-Bedroom Unfurnished Apartments Summary |
|||||||||
|
Property |
Plinth Area (SQM) |
Price per SQM Q1'2022 |
Price per SQM Q1'2023 |
Rent per SQM Q1'2023 |
Occupancy |
Annualized Uptake |
Rental Yield |
Price Appreciation |
Total Return |
|
The Alma Phase 1,2,3 & 4 |
86 |
143,452 |
142,500 |
619 |
87.7% |
3.9% |
4.6% |
(0.7%) |
3.9% |
|
Willow Park Homes |
90 |
93,023 |
98,837 |
407 |
79% |
12.9% |
3.9% |
6.3% |
10.2% |
|
Temus |
92 |
100,000 |
94,444 |
444 |
98% |
11.1% |
5.5% |
(5.6%) |
(0.1%) |
|
Ruaka ridge |
80 |
86,957 |
81,522 |
380 |
98% |
12.3% |
5.5% |
(6.3%) |
(0.8%) |
|
Marigold Apts |
97 |
106,250 |
112,500 |
500 |
84% |
14.0% |
4.5% |
5.9% |
10.4% |
|
Palace Apts |
97 |
72,165 |
72,165 |
381 |
82% |
7.6% |
5.2% |
0.0% |
5.2% |
|
Eagle parlour |
110 |
92,784 |
92,784 |
412 |
80% |
16.6% |
4.3% |
0.0% |
4.3% |
|
Eagle parlour |
95 |
100,000 |
100,909 |
455 |
79% |
16.4% |
4.3% |
0.9% |
5.2% |
|
The Enkare |
86 |
85,263 |
92,632 |
421 |
80% |
28.7% |
4.4% |
8.6% |
13.0% |
|
Runda View |
90 |
116,279 |
113,372 |
640 |
85% |
12.5% |
5.8% |
(2.5%) |
3.3% |
|
Cascadia Apts |
90 |
136,667 |
161,111 |
778 |
25.0% |
17.9% |
17.9% |
||
|
Mulberry |
91 |
85,556 |
88,889 |
500 |
87% |
9.1% |
5.9% |
3.9% |
9.8% |
|
Magic Dash Apts |
100 |
87,912 |
93,407 |
385 |
83% |
28.0% |
4.1% |
6.3% |
10.4% |
|
Nalani Homes |
86 |
80,000 |
73,000 |
450 |
84% |
18.0% |
6.2% |
(8.8%) |
(2.5%) |
|
Average |
92 |
99,022 |
101,291 |
484 |
85.1% |
15.4% |
4.9% |
2.2% |
7.1% |
Source: Cytonn Research
The key take-outs from the table above include:
- Average Total Returns: The average total return for two-bedrooms in Ruaka came in at 7.1% in 2023, 5.2% points decrease from 12.3% recorded in our previous research in 2018, mainly driven by decline in capital appreciation by 3.9% points to 2.2% in 2023, from the 6.1% recorded in 2018. This was on the back of lower annual sales realized, with the average annual uptake rate coming to 15.4% in 2023, compared to 32.4% recorded in 2018. The drop in annual sales is attributed to the overall negative effect of Real Estate sector during the COVID-19 pandemic, bringing a drastic hit on demand for the 2-bedroom units and hence slowed sales. However, with the continuous recovery of the sector from the pandemic, increased business activities, and return to normalcy regarding income levels of most middle-income earners, the 2-bedroom units in Ruaka are witnessing an upward trajectory in demand for uptake. This has consequently affected a 2.3% Y/Y increase in average selling price per SQM to Kshs 101,291 in Q1’2023 from Kshs 99,022 in Q1’2022.
The table below shows the breakdown in performance for the profiled three-bedroom apartments in Ruaka;
|
All values in Kshs unless stated otherwise |
|||||||||
|
Cytonn Report: Three-Bedroom Unfurnished Apartments Summary |
|||||||||
|
Property |
Plinth Area (SQM) |
Price per SQM Q1'2022 |
Price per SQM Q1'2023 |
Rent per SQM Q1'2023 |
Occupancy |
Annualized Uptake |
Rental Yield |
Price Appreciation |
Total Return |
|
The Alma Phase 1,2, & 3 |
119.5 |
130,544 |
125,188 |
460 |
100.0% |
1.8% |
4.4% |
(4.1%) |
0.3% |
|
The Alma (Premium) |
127 |
137,795 |
125,157 |
472 |
20.8% |
(9.2%) |
(9.2%) |
||
|
Marigold Apts |
150 |
83,333 |
83,333 |
400 |
79% |
13.5% |
4.6% |
0.0% |
4.6% |
|
Temus |
107 |
104,673 |
107,477 |
467 |
79% |
9.2% |
4.1% |
2.7% |
6.8% |
|
Runda View |
104 |
103,365 |
103,365 |
577 |
79% |
12.5% |
5.3% |
0.0% |
5.3% |
|
Magic Dash Apts |
103 |
92,233 |
87,379 |
437 |
82% |
28.3% |
4.9% |
(5.3%) |
(0.4%) |
|
Willow Park Homes |
115 |
89,565 |
91,304 |
391 |
82% |
12.9% |
4.2% |
1.9% |
6.2% |
|
Burton Apts |
141 |
92,199 |
85,106 |
390 |
83% |
12.1% |
4.6% |
(7.7%) |
(3.1%) |
|
Zuri Ridge Apts |
108 |
64,815 |
69,444 |
463 |
80% |
22.5% |
6.4% |
7.1% |
13.5% |
|
Eagle Parlour |
131 |
95,420 |
96,947 |
496 |
80% |
16.6% |
4.9% |
1.6% |
6.5% |
|
Morning Star Apts |
120 |
81,667 |
83,333 |
375 |
80% |
21.3% |
4.3% |
2.0% |
6.4% |
|
Cascadia Apts |
108 |
135,185 |
177,819 |
833 |
|
25.0% |
|
31.5% |
31.5% |
|
Cascadia Apts |
117 |
143,590 |
191,674 |
855 |
|
25.0% |
|
33.5% |
33.5% |
|
Pearl Court |
130 |
92,308 |
103,846 |
462 |
86% |
12.3% |
4.6% |
12.5% |
17.1% |
|
Westlock Creek |
148 |
81,081 |
84,459 |
473 |
80% |
11.4% |
5.4% |
4.2% |
9.5% |
|
Average |
122 |
101,852 |
106,475 |
503 |
82.5% |
16.3% |
4.8% |
5.5% |
10.3% |
Source: Cytonn Research
The key take-outs from the table above include:
- Average Total Returns: The average total return for three-bedrooms in Ruaka came in at 10.3% in 2023, a 0.8% points increase from 9.5% recorded in our previous research in 2018, mainly driven by increase in the capital by 1.7% points to 5.5% in 2023, from 3.8% recorded in 2018, attributable to increase in the average selling price per SQM to Kshs 106,475 in 2023, from Kshs 96,547 recorded in 2018. The three-bedrooms have witnessed increased demand especially from clients with families and working in most of the international organizations and embassies across the environs of Ruaka such as the UN Blue Zone, Runda, Gigiri, and Rossyln. Due to zoning ordinances in the select environs, presence of apartments is limited with the aformentioned areas mainly restricted to detached and stand-alone houses. Ruaka also offers quality three-bedroom apartments at affordable prices for the middle-income earners, especially areas around major shopping centres such as The Two Rivers mall. The increase in selling prices is also at the back of newer apartments entering the market charging in United State Dollar (USD) currency to shield against the Kenyan currency devaluation.
- Furnished Apartments Market
The table below shows the performance of furnished apartments in Ruaka;
|
All values in Kshs unless stated otherwise |
|||||||
|
Cytonn Report: Ruaka Furnished Apartments Performance Summary |
|||||||
|
Typology |
Unit Size (SQM) |
Daily Rate |
Monthly Rent |
Monthly Rent per SQM |
Occupancy |
Development Cost per SQM |
Rental Yield |
|
Studio |
34 |
3,003 |
84,073 |
2,549 |
57.7% |
231,715 |
6.4% |
|
One-Bedroom |
55 |
4,529 |
126,824 |
2,301 |
61.6% |
231,715 |
6.3% |
|
Two-Bedroom |
74 |
5,879 |
164,599 |
2,221 |
55.7% |
231,715 |
5.5% |
|
Furnished Apartments Average |
59 |
4,787 |
134,030 |
2,314 |
58.6% |
231,715 |
5.9% |
|
The development cost was calculated by taking into account the cost of construction materials, labor, equipment, approval fees, and professional services needed to complete a project within the specific region |
|||||||
Source: Cytonn Research
The key take-outs from the table above include:
- Average Rental Yield: Furnished apartments in Ruaka recorded an average rental yield of 5.9%, with the monthly rent per SQM coming in at Kshs 2,314, and average occupancy rate of 58.6%, and,
- Typology Performance: The best performing typology was studio furnished apartments as a result of offering investors the highest rental yield of 6.4%, attributable to investors asking for relatively high monthly rents per SQM of Kshs 2,549 compared to the market average of Kshs 2,314, owing to their relatively smaller unit size averaging 34 SQM, compared to one and two-bedroom furnished apartments with sizes of 55 SQM and 74 SQM, respectively.
The table below shows the performance breakdown for the profiled studio furnished apartments in Ruaka;
|
All values in Kshs unless stated otherwise |
|||||||
|
Cytonn Report: Studio Furnished Apartments Summary |
|||||||
|
Property |
Unit Size (SQM) |
Daily Rate |
Monthly Rent |
Monthly Rent per SQM |
Occupancy |
Development Cost per SQM |
Rental Yield |
|
Rosslyn Studios |
30 |
4,213 |
117,964 |
3,932 |
50.0% |
231,715 |
8.7% |
|
Jiji Poa Studios |
35 |
2,700 |
75,600 |
2,160 |
60.0% |
231,715 |
5.7% |
|
Emerald Apartments |
30 |
2,600 |
72,800 |
2,427 |
60.0% |
231,715 |
6.4% |
|
Almond Apartments |
37 |
2,500 |
70,000 |
1,892 |
60.0% |
231,715 |
5.0% |
|
The Moon Apartments |
36 |
3,000 |
84,000 |
2,333 |
58.3% |
231,715 |
6.0% |
|
Studio Furnished Average |
34 |
3,003 |
84,073 |
2,549 |
57.7% |
231,715 |
6.4% |
|
The development cost was calculated by taking into account the cost of construction materials, labor, equipment, approval fees, and professional services needed to complete a project within the specific region |
|||||||
Source: Cytonn Research
The key take-outs from the table above include:
- Average Performance: Studio furnished apartments in Ruaka recorded an average rental yield of 6.4%, with the average monthly rent per SQM coming in at Kshs 2,549 and average occupancy rate of 57.7%.
The table below shows the performance breakdown for profiled one-bedroom furnished apartments in Ruaka;
|
All values in Kshs unless stated otherwise |
|||||||
|
Cytonn Report: One-Bedroom Furnished Apartments Summary |
|||||||
|
Property |
Unit Size (SQM) |
Daily Rate |
Monthly Rent |
Monthly Rent per SQM |
Occupancy |
Development Cost per SQM |
Rental Yield |
|
The Alma |
51 |
3,477 |
97,365 |
1,909 |
66.7% |
231,715 |
5.6% |
|
Rosslyn Studios |
65 |
5,500 |
154,000 |
2,369 |
60.0% |
231,715 |
6.3% |
|
Stay.Plus Hillcrest |
56 |
4,582 |
128,296 |
2,291 |
50.0% |
231,715 |
5.0% |
|
Penthouse Paradise |
50 |
4,202 |
117,656 |
2,353 |
57.1% |
231,715 |
5.9% |
|
Tulivu Homes |
55 |
3,963 |
110,964 |
2,018 |
66.7% |
231,715 |
5.9% |
|
The Moon Apartments |
60 |
4,000 |
112,000 |
1,867 |
72.2% |
231,715 |
5.9% |
|
Mayweather Suites |
55 |
5,605 |
156,940 |
2,853 |
66.7% |
231,715 |
8.4% |
|
Jalde Heights |
55 |
3,914 |
109,592 |
1,993 |
62.5% |
231,715 |
5.5% |
|
Raha Comforts |
48 |
5,152 |
144,256 |
3,005 |
60.0% |
231,715 |
7.9% |
|
Moon 401 |
50 |
4,236 |
118,608 |
2,372 |
60.0% |
231,715 |
6.3% |
|
Moon 401 |
65 |
4,706 |
131,768 |
2,027 |
62.5% |
231,715 |
5.6% |
|
House of Kawa |
55 |
5,016 |
140,448 |
2,554 |
54.5% |
231,715 |
6.1% |
|
One-Bedroom Furnished Average |
55 |
4,529 |
126,824 |
2,301 |
61.6% |
231,715 |
6.3% |
|
The development cost was calculated by taking into account the cost of construction materials, labor, equipment, approval fees, and professional services needed to complete a project within the specific region |
|||||||
Source: Cytonn Research
The key take-outs from the table above include:
- Average Performance: One-bedroom furnished apartments in Ruaka recorded an average rental yield of 6.3%, with the average monthly rent per SQM and occupancy rates coming in at Kshs 2,301 and 61.6%, respectively.
The table below shows the performance breakdown for profiled two-bedroom furnished apartments in Ruaka;
|
All values in Kshs unless stated otherwise |
|||||||
|
Cytonn Report: Two-Bedroom Furnished Apartments Summary |
|||||||
|
Property |
Unit Size (SQM) |
Daily Rate |
Monthly Rent |
Monthly Rent per SQM |
Occupancy |
Development Cost per SQM |
Rental Yield |
|
The Alma |
84 |
6,500 |
182,000 |
2,167 |
50.0% |
231,715 |
4.8% |
|
Rosslyn Studios |
80 |
7,500 |
210,000 |
2,625 |
60.0% |
231,715 |
6.9% |
|
The Moon Apartments |
78 |
5,000 |
140,000 |
1,795 |
66.7% |
231,715 |
5.3% |
|
Ruaka View |
80 |
5,500 |
154,000 |
1,925 |
50.0% |
231,715 |
4.2% |
|
Shamaris Apartments |
70 |
5,200 |
145,600 |
2,080 |
42.9% |
231,715 |
3.9% |
|
Tulivu Homes |
75 |
5,350 |
149,800 |
1,997 |
55.6% |
231,715 |
4.9% |
|
Kalahari Kalaz |
69 |
5,459 |
152,852 |
2,215 |
50.0% |
231,715 |
4.9% |
|
Junica Apartments |
73 |
6,316 |
176,848 |
2,423 |
58.3% |
231,715 |
6.2% |
|
Stay.Plus Hillcrest |
70 |
6,193 |
173,404 |
2,477 |
60.0% |
231,715 |
6.5% |
|
Irene Homes |
70 |
5,821 |
162,988 |
2,328 |
62.5% |
231,715 |
6.4% |
|
Zawadi Apartments |
68 |
5,825 |
163,100 |
2,399 |
57.1% |
231,715 |
6.0% |
|
Two-Bedroom Furnished Average |
74 |
5,879 |
164,599 |
2,221 |
55.7% |
231,715 |
5.5% |
|
The development cost was calculated by taking into account the cost of construction materials, labor, equipment, approval fees, and professional services needed to complete a project within the specific region |
|||||||
Source: Cytonn Research
The key take-outs from the table include:
- Average Performance: Two-bedroom furnished apartments in Ruaka recorded an average rental yield of 5.5%, with the average monthly rent per SQM coming in at Kshs 2,221 and average occupancy rate at 55.7%.
- Conclusion and Recommendation
Ruaka’s unfurnished residential apartments market softened in 2023 compared to our last research in 2018, with the total return to investors coming at 8.8% in 2023, registering a 2.3%-points decrease from 11.1% recorded in 2018. This was driven by a 0.5%-points decline in the average rental yield to 4.8% in 2023, from 5.3% recorded in 2018, with the Real Estate sector being one of the worst hit following the COVID-19 pandemic in 2020. However, on a y/y basis, the 8.8% total return in Q1’2023 represented an increase of 1.3% points from 7.5% recorded in 2022, majorly attributable to a 2.1% points increase in capital appreciation to 4.0%, from the 1.9% recorded in 2022. The gain in capital appreciation was driven by increased selling prices, with several developments opting to price their units in United States Dollars (USD) in a bid to shield their profits from Kenyan shilling depreciation as well as inflationary pressures. On the other hand, several other developments registered price corrections on a y/y basis in a bid to stay competitive and retain uptake rates amid a tough economic and operating environment.
The furnished apartments market in Ruaka recorded average rental yields of 5.9% in 2023, 0.3% points lower compared to the serviced apartments average of 6.2% recorded in 2022. This was majorly attributed to Ruaka realizing lower occupancy rates at 58.6% during 2023, compared to the serviced sector market average which stood at 65.8% in 2022. The decline was driven by lower holiday stays during January 2023, as has been in opening quarters of the year. Overall, furnished apartments perform better in Ruaka, offering investors a higher average rental yield at 5.9%, compared to unfurnished apartments with average rental yield of 4.8%. This makes furnished apartments more attractive to investors.
For the investment opportunity in unfurnished apartments, we recommend investing in one and three-bedroom unfurnished apartments which offer the highest returns to investors. Notably, one-bedroom unfurnished apartments sell more in Ruaka, with the annualized uptake coming at 20.8%, compared to Ruaka’s unfurnished apartments’ market average of 16.5%. Additionally, one-bedroom apartments registered higher selling prices and rents per SQM owing to their relatively smaller unit sizes compared to other typologies. In furnished apartments, we recommend investing in studio and one-bedroom apartments owing to closely-tied average rental yields to investors per typology. Notably, one-bedroom furnished apartments recorded the highest occupancy rates at 61.6% compared to Ruaka’s furnished apartments average occupancy rate of 58.6%. This is because one-bedroom furnished apartments attract the highest demographic of young, working-class people and young families within Ruaka that seek short to medium stays, while being more spacious than studio furnished apartments.
The drivers contributing to the growth of the Real Estate sector in Ruaka are; i) ample infrastructure, ii) presence of amenities, iii) strategic location, iv) improved security measures and systems, v) good educational institutions, and, vi) robust healthcare facilities. Therefore, we expect an upward trajectory in performance in terms of selling prices, asking rents and total returns to investors which will continue to place Ruaka as a viable area of investment within Kenya’s Real Estate sector.
Disclaimer: The views expressed in this publication are those of the writers where particulars are not warranted. This publication, which is in compliance with Section 2 of the Capital Markets Authority Act Cap 485A, is meant for general information only and is not a warranty, representation, advice or solicitation of any nature. Readers are advised in all circumstances to seek the advice of a registered investment advisor

- Talk to us
- Kenya
- P.O Box 20695 - 00200, Nairobi, Kenya
- Cell +254709101200
- Tel +254709101200
- WhatsApp +254741676635
- United States
- +254709101200
- DOWNLOAD OUR APP
-


- Kenya
- 8th Floor, Pinetree Plaza, Kaburu Drive, Ngong Road, Nairobi, Kenya
- USA
- Suite 1150, 1775 Eye Street NW, USA, Washington DC 20006, USA
- Investments
- High Yield
- Private Equity
- Real Estate
- Real Estate
- RiverRun Estates
- Cytonn Towers
- The Ridge
- Taraji Heights
- The Alma