Sub-Saharan Africa (SSA) Eurobonds Performance, & Cytonn Weekly #32/2025
By Research Team, Aug 10, 2025
Executive Summary
Fixed Income
This week, T-bills were undersubscribed for the second time in two weeks, with the overall subscription rate coming in at 97.6%, higher than the subscription rate of 67.1% recorded the previous week. Investors’ preference for the shorter 91-day paper increased, with the paper receiving bids worth Kshs 3.98 bn against the offered Kshs 4.0 bn, translating to a subscription rate of 99.7%, higher than the subscription rate of 49.3%, recorded the previous week. The subscription rates for the 364-day and 182-day papers increased to 120.2% and 74.1%, from the 119.8% and 21.4% respectively recorded the previous week. The government accepted a total of Kshs 23.2 bn worth of bids out of Kshs 24.0 bn bids received, translating to an acceptance rate of 99.2%. The yields on the government papers were on a downward trajectory with the yields on the 182-day paper decreasing the most by 23.6 bps to 8.2% from the 8.4% recorded the previous week. The yields on the 91-day paper decreased by 3.1 bps to 8.08% from the 8.11% recorded the previous week, while the 364-day paper decreased by 0.5 bps to remain relatively unchanged from the 9.7% recorded the previous week;
Also, during the week, Stanbic Bank released its monthly Purchasing Manager's Index (PMI) highlighting that the index for the month of July 2025 deteriorated further to remain in the negative territory, coming in at 46.8, down from 48.6 in June 2025, marking a third consecutive month the index fell below the 50.0 neutral mark, signaling a worsening in business conditions, mainly attributable to weaker order inflows, rising price pressures and disruption from protests;
Equities
During the week, the equities market was on an upward trajectory, with NSE 25 gaining the most by 1.7%, while NSE 10, NASI and NSE 20 gained by 1.5%, 1.4% and 1.3% respectively, taking the YTD performance to gains of 28.6%, 24.8%, 20.8% and 20.0% for NASI, NSE 20, NSE 25 and NSE 10 respectively. The equities market performance was driven by gains recorded by large-cap stocks such as NCBA, Equity and DTB of 5.6%, 4.0% and 3.9% respectively. The performance was however weighed down by losses recorded by large cap stocks such as EABL of 1.1%;
Additionally, in the regional equities market, the East African Exchanges 20 (EAE 20) share index lost by 0.3%, attributable to losses recorded by large cap stocks such as Tanzania Breweries Limited, Co-operative Bank of Kenya and Safaricom of 3.8%, 2.7% and 1.1% respectively. The performance was however supported by gains recorded by large cap stocks such as CRDB Bank, MTN Uganda and Equity Group of 15.4%, 2.0% and 2.0% respectively;
During the week, Stanbic Group released their H1’2025 financial results for the period ending 30th June 2025, highlighting that the profit after tax (PAT) for the Group decreased by 9.3% to Kshs 6.5 bn, from 7.2 bn recorded in H1’2024, largely attributable to a 3.3% decrease in operating income to Kshs 19.4 bn, from Kshs 20.1 bn in H1’2024, coupled with 7.5% increase in total operating expense to Kshs 10.8 bn, from Kshs 10.1 bn in H1’2024;
Real Estate
During the week, Acorn Holdings cut its effective interest rate on debt by 5.2% to 11.1% in July from 16.3% in January after refinancing its facilities to take advantage of falling interest rates;
Additionally during the week, Shelter Afrique Development Bank (ShafDB) has signed a Kshs 15.5 bn agreement with the Arab Bank for Economic Development in Africa (BADEA) to support its capital increase subscription initiative;
During the week, it was announced that three United Nations agencies, UN Women, UNICEF and UNFPA will relocate their global headquarters from New York to Nairobi in 2026 under the UN@80 reform agenda. The move is intended to reduce operational costs, improve efficiency and enhance the agencies’ impact in developing regions. Nairobi was chosen due to its strategic location, strong diplomatic presence and regional connectivity;
On the Unquoted Securities Platform, Acorn D-REIT and I-REIT traded at Kshs 26.7 and Kshs 22.9 per unit, respectively, as per the last updated data on 1st August 2025. The performance represented a 33.4% and 14.5% gain for the D-REIT and I-REIT, respectively, from the Kshs 20.0 inception price. Additionally, ILAM Fahari I-REIT traded at Kshs 11.0 per share as of 1st August 2025, representing a 45.0% loss from the Kshs 20.0 inception price. The volume traded to date came in at 1.2 mn shares for the I-REIT, with a turnover of Kshs 1.5 mn since inception in November 2015;
Focus of the Week
The international Eurobonds market has over the years allowed countries in the Sub-Saharan Africa (SSA) region to raise funding to refinance maturing debt obligations, finance their budget deficits and undertake heavy infrastructural projects. In 2024 and the first part of 2025, Sub-Saharan Africa (SSA) Sub-Saharan African countries have begun returning to international capital markets after nearly two years of exclusion, with Côte d’Ivoire, Benin, and Kenya raising a combined USD 4.9 bn in Eurobond issuances in 2024. While these bonds were heavily oversubscribed, indicating renewed investor appetite, they came at high costs, with average coupon rates at 8.8%. The proceeds are largely being used to refinance existing debt or cover budget deficits rather than fund new investments, raising concerns about long-term debt sustainability. With a wave of Eurobond repayments due in the next few years and limited alternative financing sources, many SSA countries may be forced to continue borrowing at elevated rates to stay afloat. Despite the positive signal of market re-entry, the region’s credit crunch is far from over, and future access will depend heavily on global financial conditions and domestic fiscal discipline.;
Investment Updates:
- Weekly Rates: Cytonn Money Market Fund closed the week at a yield of 13.3% p.a. To invest, dial *809# or download the Cytonn App from Google Play store here or from the Appstore here;
- We continue to offer Wealth Management Training every Tuesday, from 7:00 pm to 8:00 pm. The training aims to grow financial literacy among the general public. To register for any of our Wealth Management Trainings, click here;
- If interested in our Private Wealth Management Training for your employees or investment group, please get in touch with us through wmt@cytonn.com;
- Cytonn Insurance Agency acts as an intermediary for those looking to secure their assets and loved ones’ future through insurance namely; Motor, Medical, Life, Property, WIBA, Credit and Fire and Burglary insurance covers. For assistance, get in touch with us through insuranceagency@cytonn.com;
- Cytonn Asset Managers Limited (CAML) continues to offer pension products to meet the needs of both individual clients who want to save for their retirement during their working years and Institutional clients that want to contribute on behalf of their employees to help them build their retirement pot. To more about our pension schemes, kindly get in touch with us through pensions@cytonn.com;
Hospitality Updates:
- We currently have promotions for Staycations. Visit cysuites.com/offers for details or email us at sales@cysuites.com;
Money Markets, T-Bills Primary Auction:
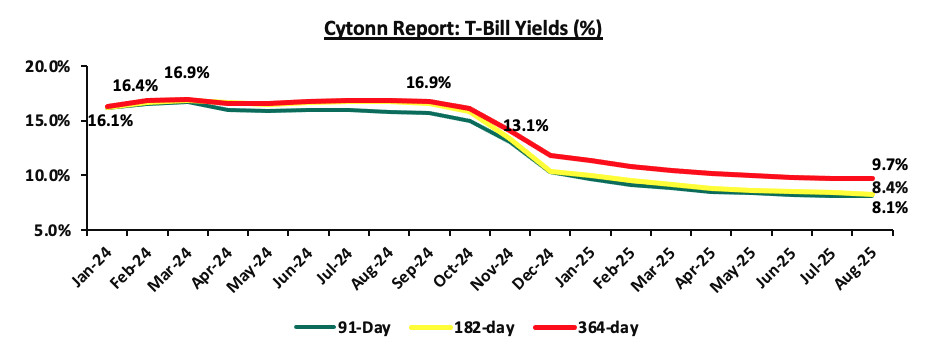
This week, T-bills were undersubscribed for the second time in two weeks, with the overall subscription rate coming in at 97.6%, higher than the subscription rate of 67.1% recorded the previous week. Investors’ preference for the shorter 91-day paper increased, with the paper receiving bids worth Kshs 3.98 bn against the offered Kshs 4.0 bn, translating to a subscription rate of 99.7%, higher than the subscription rate of 49.3%, recorded the previous week. The subscription rates for the 364-day and 182-day papers increased to 120.2% and 74.1% from the 119.8% and 21.4% respectively recorded the previous week. The government accepted a total of Kshs 23.2 bn worth of bids out of Kshs 24.0 bn bids received, translating to an acceptance rate of 99.2%. The yields on the government papers were on a downward trajectory with the yields on the 182-day paper decreasing the most by 23.6 bps to 8.2% from the 8.4% recorded the previous week. The yields on the 91-day paper decreased by 3.1 bps to 8.08% from the 8.11% recorded the previous week, while the 364-day paper decreased by 0.5 bps to remain relatively unchanged from the 9.7% recorded the previous week.
The chart below shows the yield performance of the 91-day, 182-day and 364-day papers over the period:
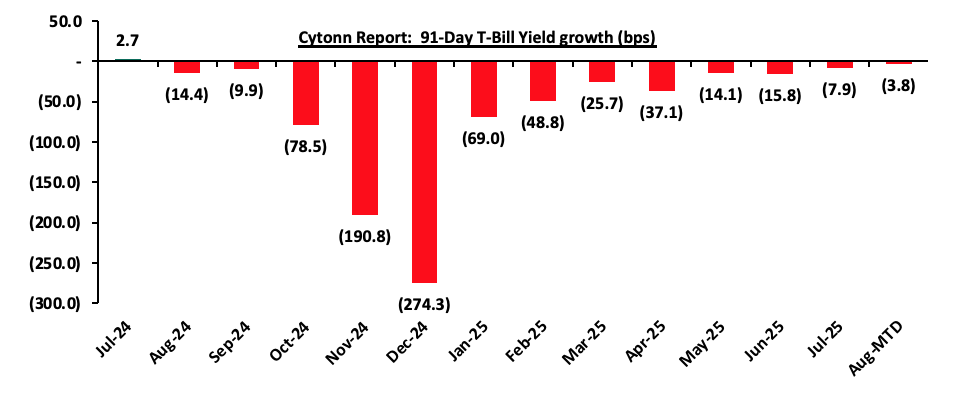
The chart below shows the yield growth for the 91-day T-bill:
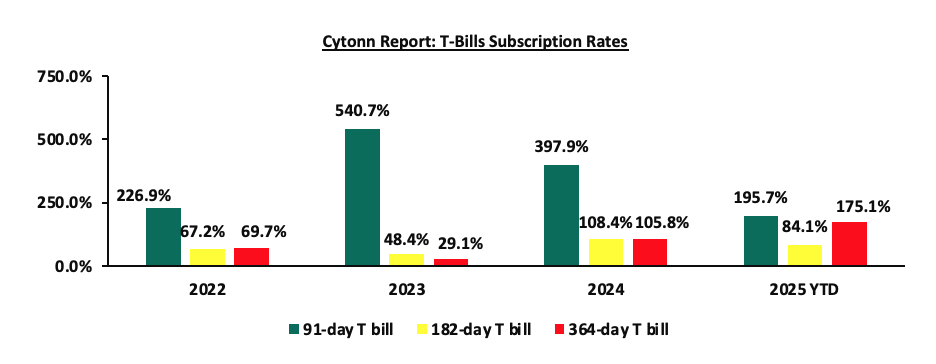
The chart below compares the overall average T-bill subscription rates obtained in 2022, 2023, 2024 and 2025 Year-to-date (YTD):
Money Market Performance:
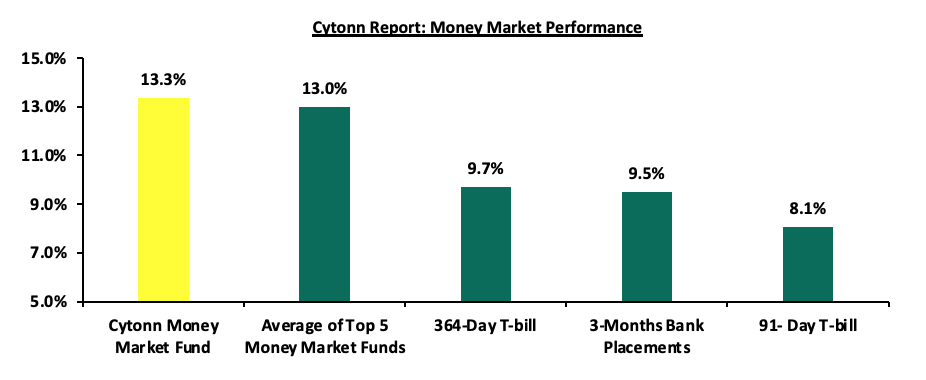
In the money markets, 3-month bank placements ended the week at 9.5% (based on what we have been offered by various banks) and the yields on the government papers were on a downward trajectory with the yields on the 91-day paper decreasing by 3.1 bps to 8.08% from the 8.11% recorded the previous week while the 364-day paper decreased by 0.5 bps to remain relatively unchanged from the 9.7% recorded the previous week. The yield on the Cytonn Money Market Fund remained unchanged from the 13.3% recorded the previous week, while the average yields on the Top 5 Money Market Funds increased marginally by 5.2 bps to remain relatively unchanged from the 13.0% recorded the previous week.
The table below shows the Money Market Fund Yields for Kenyan Fund Managers as published on 8th August 2025:
|
Money Market Fund Yield for Fund Managers as published on 8th August 2025 |
||
|
Rank |
Fund Manager |
Effective Annual Rate |
|
1 |
Cytonn Money Market Fund (Dial *809# or download Cytonn App) |
13.3% |
|
2 |
Gulfcap Money Market Fund |
13.1% |
|
3 |
Ndovu Money Market Fund |
13.1% |
|
4 |
Nabo Africa Money Market Fund |
12.8% |
|
5 |
Lofty-Corban Money Market Fund |
12.7% |
|
6 |
Orient Kasha Money Market Fund |
12.5% |
|
7 |
Kuza Money Market fund |
12.5% |
|
8 |
Etica Money Market Fund |
12.3% |
|
9 |
Arvocap Money Market Fund |
12.2% |
|
10 |
GenAfrica Money Market Fund |
11.4% |
|
11 |
Enwealth Money Market Fund |
11.4% |
|
12 |
Old Mutual Money Market Fund |
11.2% |
|
13 |
Jubilee Money Market Fund |
11.1% |
|
14 |
Madison Money Market Fund |
11.1% |
|
15 |
British-American Money Market Fund |
11.0% |
|
16 |
Dry Associates Money Market Fund |
10.3% |
|
17 |
Apollo Money Market Fund |
10.2% |
|
18 |
Faulu Money Market Fund |
10.2% |
|
19 |
Sanlam Money Market Fund |
10.2% |
|
20 |
KCB Money Market Fund |
9.8% |
|
21 |
ICEA Lion Money Market Fund |
9.4% |
|
22 |
Co-op Money Market Fund |
9.3% |
|
23 |
Mali Money Market Fund |
9.2% |
|
24 |
Genghis Money Market Fund |
9.0% |
|
25 |
CIC Money Market Fund |
8.8% |
|
26 |
Absa Shilling Money Market Fund |
8.6% |
|
27 |
Mayfair Money Market Fund |
8.5% |
|
28 |
AA Kenya Shillings Fund |
7.9% |
|
29 |
Ziidi Money Market Fund |
7.0% |
|
30 |
Stanbic Money Market Fund |
6.9% |
|
31 |
CPF Money Market Fund |
6.4% |
|
32 |
Equity Money Market Fund |
5.1% |
Source: Business Daily
Liquidity:
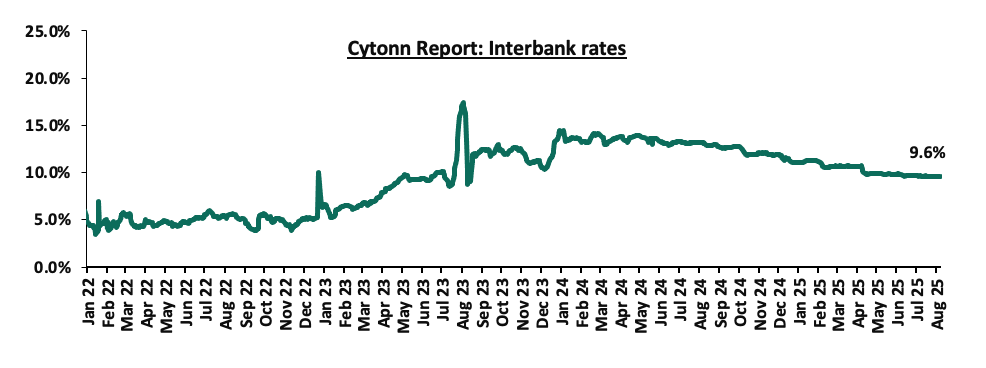
During the week, liquidity in the money markets marginally eased, with the average interbank rate decreasing by 0.9 bps, to remain relatively unchanged from the 9.6% recorded the previous week, partly attributable to government payments that were offset by tax remittances. The average interbank volumes traded decreased by 35.5% to Kshs 7.7 bn from Kshs 11.9 bn recorded the previous week. The chart below shows the interbank rates in the market over the years:
Kenya Eurobonds:
During the week, the yields on Kenya’s Eurobonds recorded a mixed performance with the yield on the 10-year Eurobond issued in 2018 decreasing the most by 16.1 bps to 7.6% from the 7.8% recorded the previous week while the 13-year Eurobond issued in 2021 marginally increased by 0.6 bps to remain relatively unchanged from the 9.6% recorded the previous week. The table below shows the summary performance of the Kenyan Eurobonds as of 7th August 2025;
|
Cytonn Report: Kenya Eurobond Performance |
|||||||
|
|
2018 |
2019 |
2021 |
2024 |
2025 |
||
|
Date |
10-year issue |
30-year issue |
7-year issue |
12-year issue |
13-year issue |
7-year issue |
11-year issue |
|
2-Jan-25 |
9.1% |
10.3% |
8.5% |
10.1% |
10.1% |
10.1% |
|
|
1-Aug-25 |
7.8% |
10.3% |
- |
9.3% |
9.8% |
9.2% |
|
|
31-Jul-25 |
7.8% |
10.2% |
- |
9.2% |
9.5% |
9.0% |
|
|
1-Aug-25 |
7.8% |
10.3% |
- |
9.3% |
9.8% |
9.2% |
|
|
4-Aug-25 |
7.7% |
10.2% |
- |
9.2% |
9.7% |
9.1% |
|
|
5-Aug-25 |
7.7% |
10.2% |
- |
9.1% |
9.6% |
9.0% |
|
|
6-Aug-25 |
7.7% |
10.2% |
- |
9.1% |
9.6% |
9.0% |
10.0% |
|
7-Aug-25 |
7.6% |
10.1% |
- |
9.0% |
9.5% |
8.9% |
|
|
Weekly Change |
(0.2%) |
(0.0%) |
- |
(0.1%) |
0.01% |
(0.0%) |
- |
|
MTD Change |
(0.2%) |
(0.1%) |
- |
(0.3%) |
(0.2%) |
(0.2%) |
- |
|
YTD Change |
(1.4%) |
(0.1%) |
- |
(1.0%) |
(0.6%) |
(1.2%) |
- |
Source: Central Bank of Kenya (CBK) and National Treasury
Kenya Shilling:
During the week, the Kenyan Shilling depreciated marginally against the US Dollar by 0.7 bps, to remain relatively unchanged at Kshs 129.2 recorded the previous week. On a year-to-date basis, the shilling has appreciated by 5.1 bps against the dollar, compared to the 17.6% appreciation recorded in 2024.
We expect the shilling to be supported by:
- Diaspora remittances standing at a cumulative USD 5,084.0 mn in the twelve months to June 2025, 12.1% higher than the USD 4,535.0 mn recorded over the same period in 2024. These has continued to cushion the shilling against further depreciation. In the June 2025 diaspora remittances figures, North America remained the largest source of remittances to Kenya accounting for 57.9% in the period,
- The tourism inflow receipts which came in at Kshs 452.2 bn in 2024, a 19.8% increase from Kshs 377.5 bn inflow receipts recorded in 2023, and owing to tourist arrivals that improved by 8.0% to 2,303,028 in the 12 months to February 2025 from 2,133,612 in the 12 months to February 2024 and,
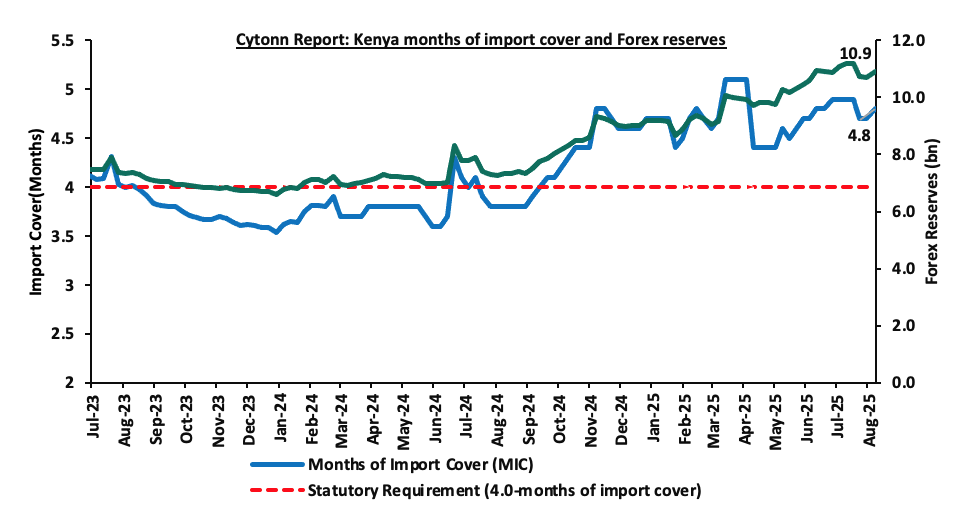
- Improved forex reserves currently at USD 10.9 bn (equivalent to 4.8-months of import cover), which is above the statutory requirement of maintaining at least 4.0-months of import cover and above the EAC region’s convergence criteria of 4.5-months of import cover.
The shilling is however expected to remain under pressure in 2025 as a result of:
- An ever-present current account deficit which came in at 1.8% of GDP in the twelve months to April 2025, and,
- The need for government debt servicing, continues to put pressure on forex reserves given that 62.0% of Kenya’s external debt is US Dollar-denominated as of December 2024.
Key to note, Kenya’s forex reserves increased marginally by 1.9% during the week, to USD 10.9 bn from the USD 10.7 bn recorded in the previous week, (equivalent to 4.8 months of import cover), and above the statutory requirement of maintaining at least 4.0-months of import cover and above the EAC region’s convergence criteria of 4.5-months of import cover.
The chart below summarizes the evolution of Kenya's months of import cover over the years:
Weekly highlights
- Stanbic Bank’s July 2025 Purchasing Manager’s Index (PMI)
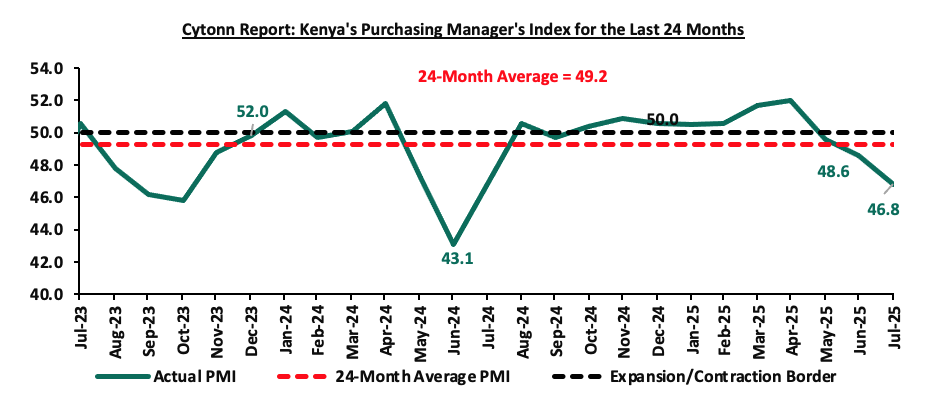
During the week, Stanbic Bank released its monthly Purchasing Manager's Index (PMI) highlighting that the index for the month of July 2025 deteriorated further to remain in the negative territory, coming in at 46.8, down from 48.6 in June 2025, marking a third consecutive month the index fell below the 50.0 neutral mark, signaling a worsening in business conditions, mainly attributable to weaker order inflows, rising price pressures and disruption from protests. On a year-to-year basis, the index recorded 8.6% increase from the 43.1 recorded in July 2024, indicating a slight improvement in business conditions compared to the same period last year. The improvement was largely driven by a slower pace of decline in output and new orders. Input prices continued to rise for six consecutive months, mainly due to increased purchase prices and higher taxation, while output charges rose at a solid pace in July which can be attributed to an increase in operating costs.
In July, business output continued to contract, marking the third consecutive monthly decline. Contraction in business output was mainly in manufacturing and services sectors, while agriculture, construction and wholesale and retail continued to show relative resilience. New orders fell for the third consecutive month since September 2024, attributed to reduced customer spending power, higher prices and political protests leading to lower footfall.
Employment levels dropped to their lowest in six months in July, supported by staff cuts which is linked to reduced customer demand. However, the employment index remained above the 50.0 mark, suggesting firms are taking on additional staff to assist with new projects and busy workloads. Meanwhile, the Backlogs of Work Index came in slightly above the 50.0-mark threshold, implying efficiency improvements which have helped lower work in hand.
Purchasing activity dipped slightly, marking one of the sharpest declines in twelve months, as firms scaled back orders in response to softening demand. This can be attributed to the increased inflation rates. On a month-on-month basis, inflation rates increased by 0.3% points to 4.1% in July 2025 from 3.8% in June 2025. Moreover, inventories decreased for the first time in seven months, as firms opted to tighten their inflows during July. Manufacturers and construction firms drove the reduction, while agriculture, wholesale and retail and services companies posted further uplifts. Supplier delivery times eased lightly in July, and this can be attributed to logistics issue which was caused by political unrest during that month.
Input prices continued to rise for six consecutive months, largely due to higher material costs, taxes, and customs fees. The purchase price index also accelerated, with manufacturers particularly affected. Staff costs increased, although the pace of increase softened from the previous month and was only marginal. The output prices rose at a solid pace in July which can be attributed to an increase in operating costs. Moreover, there was a notable increase in fuel prices, where the Super Petrol, Diesel and Kerosene increased by Kshs 9.0, Kshs 8.7 and 9.7 which brought the new retail prices to Kshs 186.3, Kshs 171.6 and Kshs 156.6 per litre from Kshs 177.3, Kshs 162.9 and Kshs 146.9 per litre respectively.
Key to note, a PMI reading of above 50.0 indicates an improvement in the business conditions, while readings below 50.0 indicate a deterioration. The chart below summarizes the evolution of PMI over the last 24 months:
Going forward, we expect the business environment to remain under pressure in the short to medium term attributable to the increase in inflationary pressures and the increased fuel prices which are set to increase input costs. Additionally, the overall high cost of living and high taxation will continue to restrain the business activity. However, lower interest rates, supported by the MPC’s accommodative monetary policy, should help ease some of this pressure, supporting private sector recovery alongside improving political stability.
Rates in the Fixed Income market have been on a downward trend due to high liquidity which has lowered the cost of borrowing. However, the government is 18.0% behind of its prorated net domestic borrowing target of Kshs 71.6, having a net borrowing position of Kshs 58.7 bn (inclusive of T-bills). However, we expect a stabilization of the yield curve in the short and medium term, with the government looking to increase its external borrowing to maintain the fiscal surplus, hence alleviating pressure in the domestic market. As such, we expect the yield curve to stabilize in the short to medium-term and hence investors are expected to shift towards the long-term papers to lock in the high returns
Market Performance
During the week, the equities market was on an upward trajectory, with NSE 25 gaining the most by 1.7%, while NSE 10, NASI and NSE 20 gained by 1.5%, 1.4% and 1.3% respectively, taking the YTD performance to gains of 28.6%, 24.8%, 20.8% and 20.0% for NASI, NSE 20, NSE 25 and NSE 10 respectively. The equities market performance was driven by gains recorded by large-cap stocks such as NCBA, Equity and DTB of 5.6%, 4.0% and 3.9% respectively. The performance was however weighed down by losses recorded by large cap stocks such as EABL of 1.1%.
Additionally, in the regional equities market, the East African Exchanges 20 (EAE 20) share index lost by 0.3%, attributable to losses recorded by large cap stocks such as Tanzania Breweries Limited, Co-operative Bank of Kenya and Safaricom of 3.8%, 2.7% and 1.1% respectively. The performance was however supported by gains recorded by large cap stocks such as CRDB Bank, MTN Uganda and Equity Group of 15.4%, 2.0% and 2.0% respectively.
During the week, equities turnover decreased by 28.4% to USD 15.6 mn, from USD 21.8 mn recorded the previous week, taking the YTD total turnover to USD 538.6 mn. Foreign investors remained net buyers for the second consecutive week, with a net buying position of USD 2.0 mn, from a net buying position of USD 3.0 mn recorded the previous week, taking the YTD foreign net selling position to USD 27.0 mn, compared to a net selling position of USD 16.9 mn in 2024.
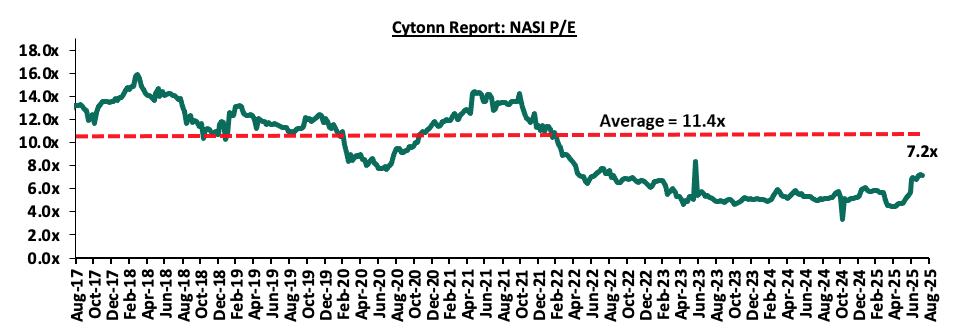
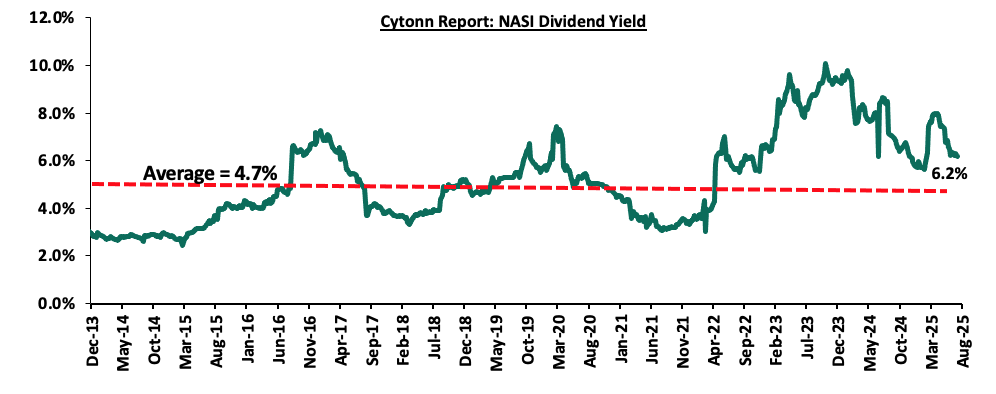
The market is currently trading at a price-to-earnings ratio (P/E) of 7.2x, 37.2% below the historical average of 11.4x. The dividend yield stands at 6.2%, 1.5% points above the historical average of 4.7%. Key to note, NASI’s PEG ratio currently stands at 0.9x, an indication that the market is undervalued relative to its future growth. A PEG ratio greater than 1.0x indicates the market is overvalued while a PEG ratio less than 1.0x indicates that the market is undervalued. The charts below indicate the historical P/E and dividend yields of the market;
|
Cytonn Report: Equities Universe of Coverage |
|||||||||||
|
Company |
Price as at 01/08/2027 |
Price as at 08/08/2028 |
w/w change |
YTD Change |
Year Open 2025 |
Target Price* |
Dividend Yield |
Upside/ Downside** |
P/TBv Multiple |
Recommendation |
|
|
Diamond Trust Bank |
76.5 |
79.5 |
3.9% |
19.1% |
66.8 |
90.4 |
8.8% |
22.5% |
0.3x |
Buy |
|
|
CIC Group |
3.4 |
3.4 |
0.3% |
59.8% |
2.1 |
4.0 |
3.8% |
21.6% |
0.9x |
Buy |
|
|
Co-op Bank |
16.7 |
17.0 |
1.5% |
(2.9%) |
17.5 |
18.9 |
8.8% |
20.5% |
0.6x |
Buy |
|
|
Britam |
8.5 |
8.0 |
(5.4%) |
37.5% |
5.8 |
9.5 |
0.0% |
19.0% |
0.7x |
Accumulate |
|
|
Equity Group |
50.5 |
52.5 |
4.0% |
9.4% |
48.0 |
58.0 |
8.1% |
18.6% |
0.9x |
Accumulate |
|
|
KCB Group |
47.3 |
48.4 |
2.2% |
14.0% |
42.4 |
53.7 |
6.2% |
17.3% |
0.6x |
Accumulate |
|
|
Standard Chartered Bank |
315.0 |
321.0 |
1.9% |
12.5% |
285.3 |
328.8 |
14.0% |
16.4% |
1.8x |
Accumulate |
|
|
ABSA Bank |
19.5 |
19.9 |
1.8% |
5.3% |
18.9 |
21.0 |
8.8% |
14.6% |
1.3x |
Accumulate |
|
|
Stanbic Holdings |
178.5 |
180.8 |
1.3% |
29.3% |
139.8 |
185.8 |
11.5% |
14.3% |
1.1x |
Accumulate |
|
|
I&M Group |
36.9 |
37.3 |
1.2% |
3.6% |
36.0 |
39.0 |
8.0% |
12.6% |
0.7x |
Accumulate |
|
|
Jubilee Holdings |
267.0 |
260.0 |
(2.6%) |
48.8% |
174.8 |
260.4 |
5.2% |
5.3% |
0.4x |
Hold |
|
|
NCBA |
62.8 |
66.3 |
5.6% |
29.9% |
51.0 |
60.2 |
8.3% |
(0.9%) |
1.1x |
Sell |
|
|
*Target Price as per Cytonn Analyst estimates **Upside/ (Downside) is adjusted for Dividend Yield ***Dividend Yield is calculated using FY’2024 Dividends |
|||||||||||
Weekly Highlights
- Stanbic H1’2025 Financial Performance
|
II. Balance Sheet Items |
H1’2024 |
H1’2025 |
y/y change |
|
Net Loans and Advances to Customers |
238.2 |
233.0 |
(2.2%) |
|
Kenya Government Securities |
63.4 |
93.3 |
47.1% |
|
Total Assets |
497.9 |
473.7 |
(4.9%) |
|
Customer Deposits |
355.6 |
346.9 |
(2.5%) |
|
Deposits/branch |
11.9 |
11.6 |
(2.5%) |
|
Total Liabilities |
428.6 |
399.5 |
(6.8%) |
|
Shareholders’ Funds |
69.4 |
74.3 |
7.1% |
|
Balance Sheet Ratios |
H1’2024 |
H1’2025 |
% points change |
|
Loan to Deposit Ratio |
67.0% |
67.2% |
0.2% |
|
Government Securities to Deposit Ratio |
17.8% |
26.9% |
9.1% |
|
Return on average equity |
18.5% |
18.2% |
(0.3%) |
|
Return on average assets |
2.8% |
2.7% |
(0.1%) |
|
Income Statement |
H1’2024 |
H1’2025 |
y/y change |
|
Net Interest Income |
12.6 |
11.8 |
(5.8%) |
|
Net non-Interest Income |
7.6 |
7.6 |
0.8% |
|
Total Operating income |
20.1 |
19.4 |
(3.3%) |
|
Loan Loss provision |
(2.0) |
(1.5) |
(25.6%) |
|
Total Operating expenses |
(10.1) |
(10.8) |
7.5% |
|
Profit before tax |
10.0 |
8.6 |
(14.2%) |
|
Profit after tax |
7.2 |
6.5 |
(9.3%) |
|
Core EPS |
18.2 |
16.6 |
(9.3%) |
|
Dividend Per Share |
1.8 |
3.8 |
106.5% |
|
Dividend Yield (Annualized) |
13.1% |
13.7% |
0.6% Points |
|
Payout Ratio |
10.1% |
23.0% |
12.9% Points |
|
Income Statement Ratios |
H1’2024 |
H1’2025 |
% points change |
|
Yield from interest-earning assets |
11.9% |
11.4% |
(0.5%) |
|
Cost of funding |
5.8% |
5.5% |
(0.2%) |
|
Net Interest Margin |
6.8% |
5.4% |
(1.4%) |
|
Net Interest Income as % of operating income |
62.4% |
60.8% |
(1.6%) |
|
Non-Funded Income as a % of operating income |
37.6% |
39.2% |
1.6% |
|
Cost to Income Ratio |
50.1% |
55.7% |
5.6% |
|
CIR without LLP |
40.4% |
48.3% |
7.8% |
|
Cost to Assets |
1.6% |
2.0% |
0.3% |
|
Capital Adequacy Ratios |
H1’2024 |
H1’2025 |
% points change |
|
Core Capital/Total Liabilities |
14.9% |
17.0% |
2.1% |
|
Minimum Statutory ratio |
8.0% |
8.0% |
0.0% |
|
Excess |
6.9% |
9.0% |
2.1% |
|
Core Capital/Total Risk Weighted Assets |
13.5% |
15.2% |
1.7% |
|
Minimum Statutory ratio |
10.5% |
10.5% |
0.0% |
|
Excess |
3.0% |
4.7% |
1.7% |
|
Total Capital/Total Risk Weighted Assets |
16.4% |
18.9% |
2.5% |
|
Minimum Statutory ratio |
14.5% |
14.5% |
0.0% |
|
Excess |
1.9% |
4.4% |
2.5% |
|
Liquidity Ratio |
52.8% |
54.4% |
1.6% |
|
Minimum Statutory ratio |
20.0% |
20.0% |
0.0% |
|
Excess |
32.8% |
34.4% |
1.6% |
- Declined earnings - Core earnings per share for the group decreased by 9.3% to Kshs 16.6, from Kshs 18.2 in H1’2024, mainly driven by 3.3% decrease in operating income to Kshs 19.4 bn, from Kshs 20.1 bn in H1’2024, coupled with 7.5% increase in total operating expense to Kshs 10.8 bn, from Kshs 10.1 bn in H1’2024,
- Increased Provisioning – General Provisions (LLP) increased by 4.9% to Kshs 13.1 bn in H1’2025 from Kshs 12.5 bn in H1’2024. The NPL coverage increased to 82.7% in H1’2025, from 75.0% in H1’2024, attributable to the 1.8% decrease in Gross non-performing loans to Kshs 23.9 bn, from Kshs 24.4 bn in H1’2024, coupled with the 4.9% increase in both general provisions,
- Declaration of dividends - The Board of Directors recommended an interim dividend of 3.80 from an interim dividend of 1.84 in H1’2024. Dividend yield increased to 13.7% in H1’2025, from 13.1% in H1’2024, while the payout ratio increased to 23.0% in H1’2025, from 10.1% in H1’2024,
- Stable asset quality- The bank’s Asset Quality remained stable, with Gross NPL ratio remaining unchanged from the 9.5% recorded in H1’2024, attributable to the 1.4% decrease in gross loans to Kshs 252.8 bn, from Kshs 256.5 bn recorded in H1’2024, which was balanced out by the 1.8% decrease in Gross non-performing loans to Kshs 23.9 bn, from Kshs 24.4 bn in H1’2024,
- Reduced lending- Customer net loans and advances decreased by 2.2% to Kshs 233.0 bn in H1’202, from Kshs 238.2 bn in H1’2024 attributed to increased credit risk in the industry, with NPLs rising to 17.6% in H1’2025, from 16.3% in H1’2024. Despite reduced borrowing costs, the bank remains reserved in lending, and prefers government securities, as evident by 47.1% increase in government securities to Kshs 93.3 bn, from Kshs 63.4 bn recorded in H1’2024.
For a more detailed analysis, please see the Stanbic Group’s H1’2025 Earnings Note
We are “Bullish” on the Equities markets in the short term due to current cheap valuations, lower yields on short-term government papers and expected global and local economic recovery, and, “Neutral” in the long term due to persistent foreign investor outflows. With the market currently trading at a discount to its future growth (PEG Ratio at 0.9x), we believe that investors should reposition towards value stocks with strong earnings growth and that are trading at discounts to their intrinsic value. We expect the current high foreign investors sell-offs to continue weighing down the economic outlook in the short term.
- Residential Sector
- Acorn Holdings cut its effective interest rate on debt by 5.2%
During the week, Acorn Holdings cut its effective interest rate on debt by 5.2% to 11.1% in July from 16.3% in January after refinancing its facilities to take advantage of falling interest rates. Following the release of the semiannual financial results of 2025, disclosures reveal that the Acorn I-REIT opened the year with total borrowings of Kshs 2.7 bn, which by the end of June had fallen to Kshs 2.4 bn.
Within the half year, the I-REIT made principal repayments of Kshs 4.0 bn and took on new facilities of Kshs 3.8 bn. The overall borrowings movement was also affected by interest expenses, accruals and repayments. The debt was reduced by Kshs 0.4 bn in July, bringing the total debt portfolio to Kshs 1.9 bn. Moreover, the effective cost of the debt fell by 2.2% to 11.1% in July from 13.3% in June, which can be attributed to refinancing actions and access to cheaper capital.
This action by Acorn Holdings will positively impact the residential sector in Kenya. First, lower financing costs and increased project viability. By securing financing at significantly reduced interest rates, Acorn can either reinvest more into new student and residential developments and pass along cost efficiencies, which ultimately helps keep rental prices more affordable. Second, it will enhance institutional investor confidence. Restructuring high cost debt strengthens investor confidence in the REIT model. This could attract further capital into residential sectors beyond student housing, such as affordable housing developments. Third, there will be improved momentum for broader residential REIT growth. Acorn’s success in optimizing costs and profitability highlights the viability of REITs in Kenya’s real estate sector. This may inspire more players to structure or restructure operations to enhance capital efficiency, ultimately accelerating growth across both student and general residential segments.
Acorn’s successful debt restructuring signals a positive shift in the financing dynamics of Kenya’s residential real estate sector. By lowering borrowing costs and boosting investor returns, the move sets a strong precedent for how smart financial engineering can unlock growth, expand regional housing supply, and improve affordability.
- Shelter Afrique secures Kshs 15.5 bn to boost capitalisation programme
During the week, Shelter Afrique Development Bank (ShafDB) has signed a Kshs 15.5 bn agreement with the Arab Bank for Economic Development in Africa (BADEA) to support its capital increase subscription initiative. The new capital increase program includes an initial equal allocation to all member states, followed by a phased reallocation, first on a pro-rata basis and then on a first-come, first-served basis. This approach aims to encourage active participation by member states and to strengthen Shelter’s capital adequacy in a balanced and transparent manner.
This initiative introduces an innovative financing mechanism through which eligible member states can access on-lending at competitive terms. The BADEA-supported will be used to settle and boost member states’ capital subscriptions to Shelter Afrique Development Bank. Moreover, this capital increase program has been designed to significantly strengthen ShafDB’s balance sheet over the medium term, expand its shareholder capital base and to mobilize debts. The capital raised will also support the Bank’s plans to attain investment-grade credit ratings, attract new institutional investors, and expand its lending and technical assistance programs in member countries.
This development will have major positive impact on the infrastructure sector in Kenya. First, this will foster expanded access to affordable urban infrastructure financing. With stronger capitalization, Shelter Afrique Development Bank can provide more funding for urban development projects in Kenya ranging from housing to essential infrastructure such as roads. Second, this deal helps ShafDB move toward an investment-grade rating, enhancing its relevance and sustainability as a financier. This could translate into steadier, lower-cost funding for Kenyan infrastructure, reducing reliance on more expensive and conditional sources. ShafDB emphasizes on emerging issues such as climate resilience. Kenya could benefit from more tailored, inclusive projects such as green affordable housing or infrastructure upgrades in informal settlements.
By boosting ShafDB’s financial strength and broadening its development mandate, the partnership positions the bank as a more influential player in delivering affordable housing, urban infrastructure, and inclusive growth across the country. As Kenya continues to pursue its Vision 2030 and Bottom-up Economic Transformation Agenda, this deal provides a timely and strategic injection of capital that could accelerate progress, attract further investment, and improve the quality of life for millions of Kenyans.
- Office sector
- United Nations Agencies Relocating Headquarters to Nairobi
During the week, it was announced that three United Nations agencies UN Women, UNICEF and UNFPA will move their global headquarters from New York to Nairobi in 2026, marking a major boost for Kenya’s office real estate market. This relocation, part of the UN@80 reform agenda, seeks to cut bureaucratic delays, reduce operational costs and increase field effectiveness by positioning the agencies closer to the regions they serve. Nairobi was selected over other potential cities due to its robust diplomatic ecosystem, hosting over 120 foreign missions, as well as key UN bodies like UNEP and UN-Habitat, alongside strong transport links, ICT infrastructure and human capital.
The relocation is expected to significantly uplift demand for Grade-A office space, particularly in high-security and strategically located areas such as Gigiri, Westlands and Upper Hill, with spillover effects in Riverside, Kileleshwa and Parklands. Landlords of premium office buildings that meet international security and sustainability standards are likely to see increased occupancy rates and rental yields which have been held steady at 77.0% and 8%-10.0% respectively. The move could also trigger ancillary demand in the hospitality sector, as more expatriate staff, consultants and diplomatic visitors require serviced apartments, hotels and conference facilities. Furthermore, the influx of international staff and partner organizations is anticipated to stimulate surrounding retail and service industries, while reinforcing Nairobi’s positioning as a global diplomatic and organizational hub. Overall, this development signals a long-term positive trajectory for the city’s office market, with potential secondary benefits across residential and retail real estate segments.
- Real Estate Investments Trusts
- Real Estate Investments Trusts (REITs) performance
On the Unquoted Securities Platform, Acorn D-REIT and I-REIT traded at Kshs 26.7 and Kshs 22.9 per unit, respectively, as per the last updated data on 1st August 2025. The performance represented a 33.4% and 14.5% gain for the D-REIT and I-REIT, respectively, from the Kshs 20.0 inception price. The volumes traded for the D-REIT and I-REIT came in at Kshs 12.8 mn and Kshs 39.2 mn shares, respectively, with a turnover of Kshs 323.5 mn and Kshs 791.5 mn, respectively, since inception in February 2021. Additionally, ILAM Fahari I-REIT traded at Kshs 11.0 per share as of 1st August 2025, representing a 45.0% loss from the Kshs 20.0 inception price. The volume traded to date came in at 1.2 mn shares for the I-REIT, with a turnover of Kshs 1.5 mn since inception in November 2015.
REITs offer various benefits, such as tax exemptions, diversified portfolios, and stable long-term profits. However, the ongoing decline in the performance of Kenyan REITs and the restructuring of their business portfolios are hindering significant previous investments. Additional general challenges include:
- Insufficient understanding of the investment instrument among investors leading to a slower uptake of REIT products,
- Lengthy approval processes for REIT creation,
- High minimum capital requirements of Kshs 100.0 mn for REIT trustees compared to Kshs 10.0 mn for pension funds Trustees, essentially limiting the licensed REIT Trustee to banks only
- The rigidity of choice between either a D-REIT or and I-REIT forces managers to form two REITs, rather than having one Hybrid REIT that can allocate between development and income earning properties
- Limiting the type of legal entity that can form a REIT to only a trust company, as opposed to allowing other entities such as partnerships, and companies,
- We need to give time before REITS are required to list – they would be allowed to stay private for a few years before the requirement to list given that not all companies maybe comfortable with listing on day one, and,
- Minimum subscription amounts or offer parcels set at Kshs 0.1 mn for D-REITs and Kshs 5.0 mn for restricted I-REITs. The significant capital requirements still make REITs relatively inaccessible to smaller retail investors compared to other investment vehicles like unit trusts or government bonds, all of which continue to limit the performance of Kenyan REITs.
We expect Kenya’s Real Estate sector to remain resilient, supported by: i) improved financing conditions in the residential sector, as seen in Acorn Holdings’ 5.2% cut in effective interest rates through debt refinancing, which enhances project viability and investor confidence, ii) increased residential funding from Shelter Afrique Development Bank’s Kshs 15.5 bn capitalisation programme with BADEA, set to expand access to affordable housing and urban development projects, iii) sustained activity in the REITs market, with Acorn D-REIT and I-REIT delivering gains since inception despite sector-wide structural challenges, iv) continued public and private sector investment in housing and infrastructure under initiatives such as the Affordable Housing Programme, and v) growing demand in the office sector, bolstered by the planned relocation of three UN agencies to Nairobi, which is expected to drive occupancy and long-term lease commitments in Grade A and prime office spaces. However, challenges including high capital requirements and regulatory constraints for REITs, rising construction costs, strain on infrastructure, and oversupply in select market segments will continue to limit optimal performance by constraining development pipelines and deterring some investor participation.
Eurobonds are fixed income debt instruments issued in a currency other than the currency of the country or market in which they are issued, mostly denominated in a currency that is widely traded and accepted globally, like the US Dollar or the Euro. Generally, Eurobonds allow issuers to tap into a broader investor base allowing for diversification in capital sourcing. Hence, Sub-Saharan Eurobonds, of which most are listed on the London and Irish stock exchanges, allow governments and corporations to raise funds by issuing bonds in a foreign currency. Majority of countries in the region issue Eurobonds to finance maturing debt obligations, finance their budget deficits and undertake heavy infrastructural projects.
In 2024, sub-Saharan Africa (SSA) began re-emerging in the international Eurobond market after nearly two years of limited access. This marked a shift from 2023, when high global interest rates and widening spreads effectively shut most SSA countries out of the primary market. While 2023 saw only one exception, Gabon’s USD 500 mn blue bond issued as part of a debt-for-nature swap at a discounted rate tied to conservation outcomes, 2024 brought renewed, though cautious, investor interest. In the first quarter alone, Côte d’Ivoire raised USD 2.6 bn, Benin raised USD 750.0 mn, and Kenya raised USD 1.5 bn through Eurobond issuances, collectively amounting to USD 4.9 bn, all significantly oversubscribed despite high average coupon rates of around 8.5%. As a result, many SSA governments have turned to concessional sources of finance. Countries such as Côte d’Ivoire, Kenya, and Senegal secured high-value arrangements with the IMF, while others leaned on multilateral institutions like the World Bank to plug financing gaps. The region’s broader economic recovery has been hampered by elevated import bills, which continue to strain the external and fiscal positions of commodity-importing nations. Nonetheless, with large Eurobond maturities looming and domestic financing often insufficient, many SSA countries are expected to continue returning to the international market despite the steep borrowing costs.
We have previously covered topicals including the “Sub-Saharan Africa (SSA) Eurobonds: 2019 Performance” in January 2020, where we expected the Eurobond yields to stabilize mainly on the back of loosened monetary policy regimes in advanced countries. Additionally, we did a topical on “Sub-Saharan Africa Eurobond Performance 2022” in July 2022, where we expected yields to continue rising on the back of economic performance uncertainties, with investors attaching a higher risk premium on the region and increased interest in the developed economies. In our 2023 review, “Sub-Saharan Africa Eurobond Performance 2023” in January 2024, we noted that most SSA countries remained locked out of the Eurobond market due to elevated interest rates and rising risk premiums, with investor sentiment weakened by concerns around debt sustainability and credit downgrades. This week we analyze the Sub-Saharan Africa (SSA) Eurobond performance in 2024 and 2025 year to date, given the gradually easing rates in the developed countries. The analysis will be broken down as follows:
- Background of Eurobonds in Sub-Saharan Africa,
- Analysis of Existing Eurobond Issues in Sub-Saharan Africa,
- Debt Sustainability in the Sub-Saharan African region, and,
- Outlook on SSA Eurobonds Performance.
Section I: Background of Eurobonds Issued in Sub-Saharan Africa
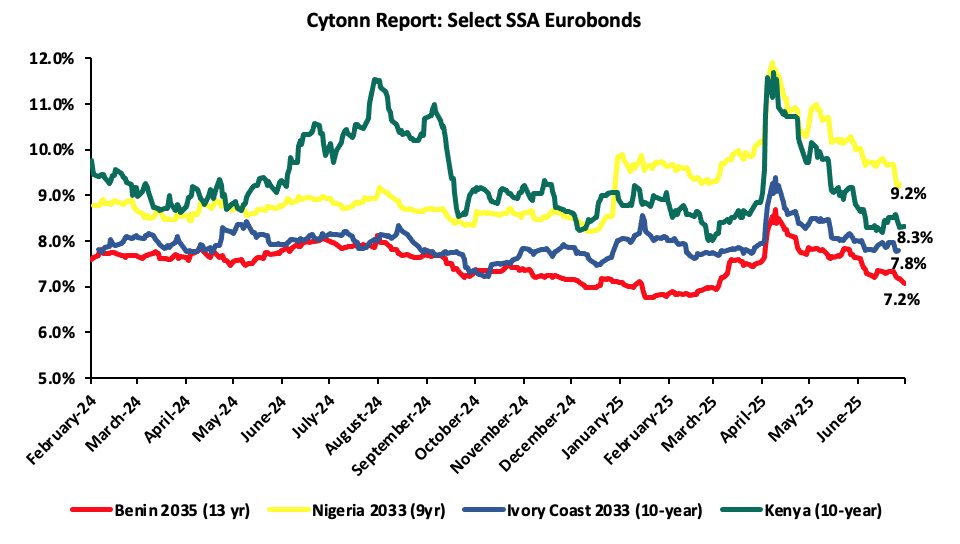
Africa’s appetite for foreign-denominated debt has increased in recent times with the latest issuers during the six months to end of HY’2025 being Ivory Coast and Benin raising a total of USD 1.8 bn and USD 0.5 bn respectively. Additionally, 2024 issuers were Ivory Coast, Benin, Kenya, Senegal and Cameroon raising a total of USD 2.6 bn, USD 0.8 bn, USD 1.5 bn, USD 0.8 bn and USD 0.6 bn respectively. Notably, all the bonds were oversubscribed with the high support being driven by the yield hungry investors and also the outlook of positive recovery in the regional economies. It is good to note that there was a general decline in the yields of the various bonds from most countries due to general improvement in investor sentiment as the economy recovers and the easing inflationary pressures in the region. The yields on Kenya’s 10-year Eurobond maturing in 2028 declined by 2.0% points to 8.3% as of end-June 2025, from 10.4% in June 2024. This was partly attributable to improved investor confidence following the successful buy-back of the 2027 Eurobond in February 2025, increased IMF credit inflows, and the stabilization of the Kenyan shilling against the US dollar. Although Kenya did not receive the final disbursement under its current IMF programme, this was due to a mutual agreement with the Fund to cancel the ninth and final review, citing time constraints, with the government subsequently applying for a new programme to access remaining funds. Similarly, the yields for Benin’s 13-year and Ivory Coast’s 10-year Eurobonds maturing in 2035 and 2033 respectively decreased by 1.0% and 0.5% to 7.1% and 7.7% respectively at the end of June 2025. However, the yields of Nigerian 9-year Eurobond maturing in 2033 increased marginally by 0.2% to 9.1% from 8.9% in June 2024.
|
Fitch Rating's Long-Term Foreign-Currency Issuer Default Rating (IDR) |
2024 Eurobond Issues |
2025 Eurobond Issues |
||||||||||
|
Country |
IDR Credit Rating |
Issue Date |
Value USD Mn |
Tenor (Years) |
Coupon Rate |
Issue Date |
Value USD Mn |
Tenor (Years) |
Coupon Rate |
|||
|
Ivory Coast
|
BB-
|
Stable
|
Aug-24
|
Jan-24
|
1100.0 |
9 |
7.650% |
Mar-25 |
1750.0 |
11 |
8.45% |
|
|
1500.0 |
13 |
8.250% |
||||||||||
|
Benin |
B+ |
Stable |
Feb-25 |
Feb-24 |
750.0 |
14 |
8.375% |
Jan-25
|
500.0 |
16 |
8.625% |
|
|
Kenya |
B- |
Stable |
Jul-25 |
Feb-24 |
1500.0 |
7 |
9.750% |
Feb-25 |
1500.0 |
11 |
9.500% |
|
|
Senegal |
B- |
Stable |
Nov-24 |
Jun-24 |
750.0 |
7 |
7.750% |
|
|
|
|
|
|
Cameroon |
B |
Negative |
May-24 |
Jul-24 |
550.0 |
7 |
10.750% |
|
|
|
|
|
|
South Africa |
BB- |
Stable |
Sep-24 |
Nov-24 |
2000.0 |
12 |
7.100% |
|
|
|
|
|
|
1500.0 |
30 |
7.950% |
||||||||||
|
Nigeria |
B- |
Positive |
Nov-24 |
Dec-24 |
700.0 |
6.5 |
9.625% |
|
|
|
|
|
|
1500.0 |
10 |
10.375% |
||||||||||
Section II: Analysis of Existing Eurobond Issues in Sub-Saharan Africa
Yields on the select SSA Eurobonds recorded a mixed performance with 3 out of the 4 selected countries registering a decline in Eurobond yields in 2025 YTD. Despite the slight decline in the Eurobond yields, the rates remained relatively elevated attributable to investors attaching higher risk premium on the Sub-Saharan region and other emerging markets due to heightened debt sustainability concerns coupled with sustained inflationary pressures and local currency depreciation. Notably, while the U.S. Federal Reserve held interest rates steady throughout 2025 maintaining the federal funds rate in the range of 4.25% to 4.50%, where it has been since December 2024 the sustained high rates continued to support a strong U.S. dollar. This environment kept global capital flows tilted toward the U.S. market, often at the expense of emerging and developing economies such as those in the Sub-Saharan Africa (SSA) region. According to the International Monetary Fund (IMF), growth in the region is now expected to ease to 3.8% in 2025 and 4.2% in 2026, a downward revision of 0.4% points and 0.2% points, respectively. The slowdown has been driven in large part by turbulent global conditions, as reflected in lower external demand, subdued commodity prices, and tighter financial conditions, with more significant downgrades for commodity exporters and countries with larger trade exposures to the United States. In addition to the subdued global outlook, uncertainty surrounding the world economy is exceptionally high, and a further increase in trade tensions or tightening of global financial conditions in advanced economies could weigh on regional confidence and activity, while raising borrowing costs. Moreover, official development assistance inflows into sub-Saharan Africa will likely decline going forward, placing an added burden on the region. The table below highlights the recent performance of select African Eurobonds:
|
Cytonn Report: Yield Changes in Select SSA Eurobonds Issued Before 2025 |
|||||||||
|
Country |
Issue Tenor (years) |
Issue Date |
Maturity Date |
Coupon |
Yield as at 30th June 2024 |
Yield as at 31st Dec 2024 |
Yield as at 30th June 2025 |
2025 y/y change (%Points) |
2025 YTD change (%Points) |
|
Kenya |
10 |
Jul-18 |
Jun-28 |
7.3% |
10.4% |
9.1% |
8.3% |
(1.3%) |
(0.8%) |
|
Ivory Coast |
9 |
Aug-19 |
Jul-28 |
9.0% |
7.4% |
6.7% |
6.3% |
(0.7%) |
(0.5%) |
|
Nigeria |
6 |
Nov-24 |
Nov-30 |
4.9% |
8.9% |
8.6% |
8.5% |
(0.4%) |
(0.0%) |
|
Kenya |
7 |
Feb-24 |
Jan-31 |
8.0% |
10.8% |
10.1% |
9.6% |
(0.7%) |
(0.5%) |
|
Kenya |
12 |
Feb-20 |
Jan-32 |
8.0% |
10.8% |
10.1% |
9.6% |
(0.7%) |
(0.5%) |
|
Nigeria |
9 |
Feb-24 |
Jan-33 |
5.9% |
8.9% |
8.5% |
7.4% |
(0.4%) |
(1.0%) |
|
Nigeria |
9 |
May-24 |
May-33 |
7.8% |
10.9% |
8.6% |
9.1% |
(2.4%) |
0.6% |
|
Ivory Coast |
10 |
Jun-23 |
May-33 |
7.0% |
8.0% |
9.9% |
7.9% |
1.8% |
(2.0%) |
|
Kenya |
13 |
Mar-21 |
Feb-34 |
6.3% |
10.8% |
10.1% |
9.8% |
(0.7%) |
(0.3%) |
|
Benin |
13 |
Dec-22 |
Dec-35 |
6.6% |
8.0% |
7.2% |
7.1% |
(0.8%) |
(0.1%) |
|
Ivory Coast |
13 |
Feb-24 |
Jan-37 |
5.8% |
8.6% |
6.3% |
8.8% |
(2.4%) |
2.5% |
|
Benin |
14 |
Feb-24 |
Jan-38 |
6.3% |
8.9% |
8.7% |
8.6% |
(0.2%) |
(0.1%) |
|
Kenya |
30 |
Feb-18 |
Jan-48 |
7.3% |
11.0% |
10.3% |
10.5% |
(0.7%) |
0.2% |
|
Ivory Coast |
30 |
Dec-18 |
Nov-48 |
6.4% |
8.9% |
8.6% |
8.9% |
(0.4%) |
0.3% |
|
Benin |
30 |
Feb-22 |
Jan-52 |
8.1% |
9.0% |
8.4% |
8.4% |
(0.6%) |
0.0% |
Source: Reuters
From the table above,
- The most notable yield decline in 2025 was observed in Nigeria’s 9-year Eurobond issued in May 2024 and maturing in May 2033, which dropped by 2.4% points year-on-year. This movement was largely driven by improving macroeconomic fundamentals in Nigeria. The government advanced fiscal reforms, particularly the removal of costly fuel subsidies and the continuation of exchange rate unification, which helped reduce distortions in the FX market. Additionally, higher-than-expected oil production levels supported external balances, while successful engagement with the IMF bolstered investor confidence. The combination of these factors, alongside declining global interest rates in early 2025, contributed to the strong rally in Nigerian sovereign debt.
- The most significant yield increase occurred in Côte d’Ivoire’s 13-year Eurobond issued in 2024 and maturing in 2037, which rose by 2.5% points year-to-date. This sharp upward movement was driven by mounting political uncertainty ahead of the 2025 presidential election, which raised concerns about potential fiscal slippage or policy disruptions. In parallel, the country faced deteriorating external conditions, with declining cocoa prices and lower export earnings contributing to current account pressures. These concerns, combined with a broader market reassessment of risk in long-dated West African debt, led to a pronounced sell-off in the bond.
- Benin’s 30-year Eurobond issued in February 2022 and maturing in January 2052 also recorded a notable yield decline of 0.6% points year-on-year. The drop reflected sustained macroeconomic stability and prudent fiscal management underpinned by strong reform implementation and an ongoing IMF-supported program. Benin’s commitment to maintaining a primary fiscal surplus and relatively low debt levels helped reassure investors.
- Kenya also saw a meaningful yield decline of 1.3% points on its 10-year Eurobond maturing in 2028. This was mainly attributed to successful liability management operations early in the year, including a Eurobond buyback and a new issuance that improved maturity profiles and alleviated immediate refinancing concerns. Progress in fiscal consolidation efforts and improved communication with markets further supported positive investor sentiment toward Kenyan debt.
The graph below summarizes the average YTD change in the Eurobond yields of select countries;
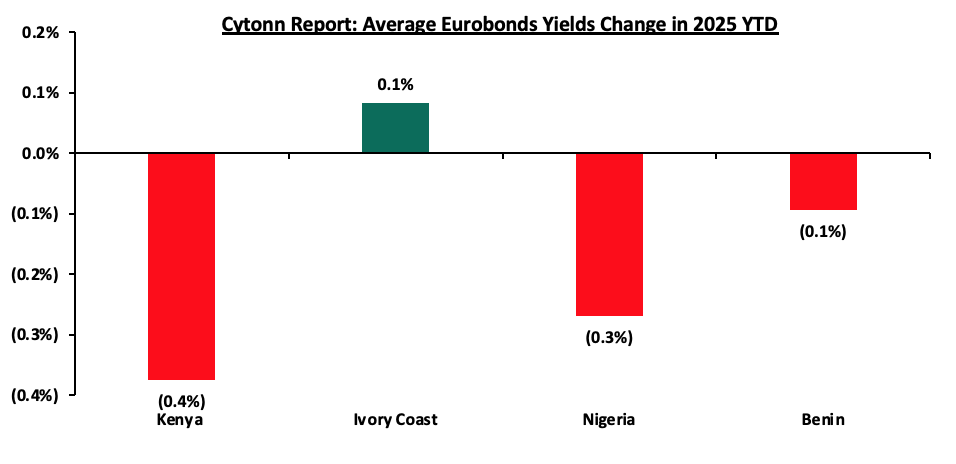
Source: Reuters
*Average yields increase calculated as an average of the Country’s Eurobonds yields increase
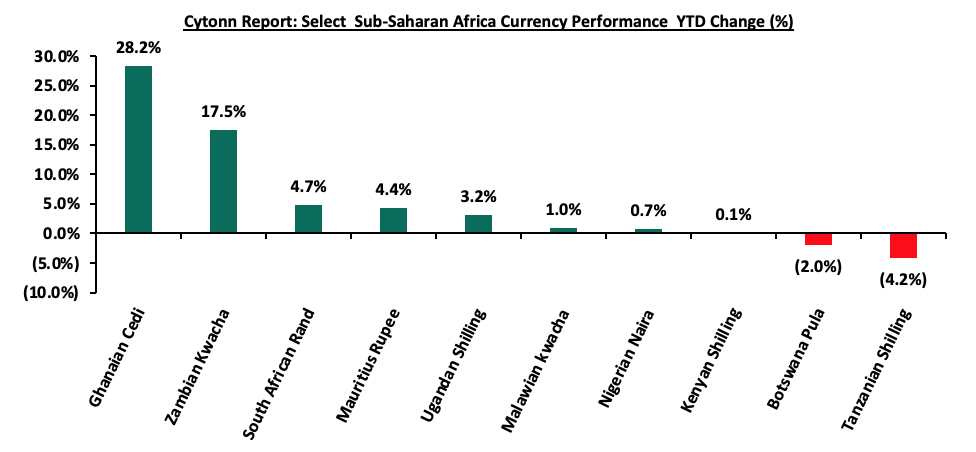
Eurobonds, being denominated in foreign currency, imply that a depreciation in a country’s local currency leads to increased costs. These costs are incurred when purchasing foreign currency to service existing debt obligations. Below is a summary of the performance of the different resident currencies as at the end of July 2025:
|
Currency |
Jul-24 |
Jan-25 |
Jul-25 |
Last 12 months |
YTD change (%) |
|
Ghanaian Cedi |
15.6 |
14.7 |
10.6 |
32.4% |
28.2% |
|
Zambian Kwacha |
26.1 |
27.9 |
23.0 |
11.6% |
17.5% |
|
South African Rand |
18.9 |
18.8 |
17.9 |
5.3% |
4.7% |
|
Mauritius Rupee |
46.3 |
47.7 |
45.6 |
1.4% |
4.4% |
|
Ugandan Shilling |
3713.0 |
3,697.6 |
3580.5 |
3.6% |
3.2% |
|
Malawian kwacha |
1,734.0 |
1,750.3 |
1,733.7 |
0.0% |
1.0% |
|
Nigerian Naira |
1,590.0 |
1,540.7 |
1,529.5 |
3.8% |
0.7% |
|
Kenyan Shilling |
129.2 |
129.3 |
129.2 |
(0.1%) |
0.1% |
|
Botswana Pula |
13.3 |
14.0 |
14.3 |
(7.5%) |
(2.0%) |
|
Tanzanian Shilling |
2,715.0 |
2,374.7 |
2,475.0 |
8.8% |
(4.2%) |
Source: S&P Capital
Most Sub-Saharan African currencies have appreciated on a year-to-date basis in 2025, driven primarily by improved macroeconomic fundamentals, tight monetary policy stances by central banks, and renewed investor confidence. Countries such as Nigeria, Kenya, and Ghana have witnessed a resurgence in foreign inflows, supported by narrower current account deficits, improved trade balances, and enhanced forex liquidity from multilateral disbursements and diaspora remittances. Additionally, monetary authorities across the region have maintained relatively high interest rates to tame inflation and stabilize currencies, thereby attracting yield-seeking investors. The US Federal Reserve’s shift toward a more dovish monetary stance has also lessened pressure on emerging market currencies, providing further relief. Overall, the convergence of internal stabilization measures and a more favorable external environment has buoyed regional currencies, underscoring growing resilience in Sub-Saharan Africa’s macroeconomic outlook.
The Ghanaian Cedi has recorded the best performance appreciating by 28.2% year-to-date in 2025, marking one of the strongest currency performances in Sub-Saharan Africa and reversing the sharp depreciation experienced in previous years. This robust performance has been anchored by Ghana’s successful engagement with the International Monetary Fund (IMF) under the USD 3.0 billion Extended Credit Facility, which has improved market sentiment and unlocked additional multilateral and bilateral support. Disbursements from the IMF, World Bank, and African Development Bank have significantly bolstered foreign exchange reserves, improving liquidity in the foreign exchange market and enhancing the Bank of Ghana’s ability to intervene when necessary. The government has also made meaningful progress on fiscal consolidation, with a marked improvement in revenue collection and expenditure control, resulting in a reduced fiscal deficit of 1.1% of GDP. On the external side, strong commodity exports, particularly from gold, which has benefited from elevated global prices, have supported the trade balance, while remittance inflows have remained resilient. Meanwhile, the Bank of Ghana’s tight monetary stance, with a policy rate maintained above 25.0%, has helped rein in inflation and attracted foreign portfolio flows into government securities. Combined, these factors have contributed to a more stable macroeconomic environment, renewed investor confidence, and a significant rebound in the Cedi’s value;
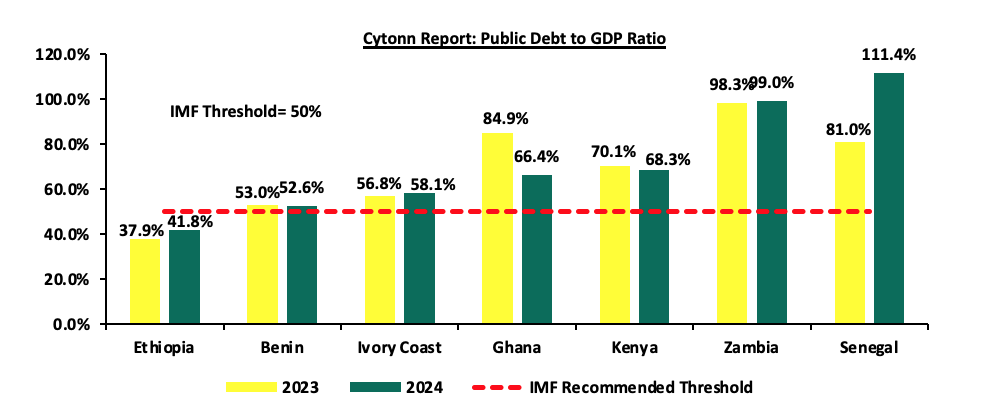
Source: IMF, CBK
From the graph above the key take outs include;
- Senegal’s public debt-to-GDP ratio surged by 30.4% points to 111.4% in 2024 from 81.0% in 2023, marking one of the steepest deteriorations in debt sustainability across Sub-Saharan Africa. This sharp increase was primarily driven by elevated fiscal deficits, heavy pre-production borrowing linked to oil and gas projects, and a significant depreciation of the CFA Franc against the US Dollar. The situation was further exacerbated by delays in hydrocarbon revenue inflows, which were expected to alleviate fiscal pressure. However, the most notable blow to Senegal’s fiscal credibility came in late 2024, following the release of an audit by the Court of Auditors, which uncovered substantial discrepancies in the country's reported debt figures. The audit revealed that central government debt had reached 99.7% of GDP in 2023 roughly 25.0% points higher than previously published, exposing material governance lapses and significantly limiting fiscal space. In response, Moody’s downgraded Senegal’s sovereign credit rating from Ba3 to B1 in 2024, citing weakened fiscal metrics, elevated funding needs, and heightened vulnerability to external shocks. The outlook was also revised to negative, reflecting risks around the government's ability to implement fiscal consolidation and manage gross financing requirements in a constrained funding environment. Although the government has announced ambitious plans to narrow the fiscal deficit, the newly uncovered fiscal realities are expected to complicate consolidation efforts. Moody’s assumes eventual IMF support in its baseline, but warned that tighter market access could challenge liquidity management. Additionally, Senegal’s local and foreign currency ceilings were lowered to Ba2 and Ba3, respectively, from Baa3 and Ba1, to reflect the diminished fiscal credibility. Nonetheless, the country’s membership in the West African Economic and Monetary Union (WAEMU) and the French Treasury’s backing of the CFA Franc-Euro peg continue to provide a degree of external stability, cushioning transfer and convertibility risks.
- Kenya’s public debt-to-GDP ratio declined by 1.8% points to 68.3% in 2024 from 70.1% in 2023, reflecting early signs of fiscal consolidation and improved nominal GDP growth. This was further supported by the Central Bank’s Monetary Policy Committee (MPC), which maintained a tight monetary policy stance through most of 2024 to anchor inflation and support exchange rate stability. However, the Central Bank Rate (CBR) began to ease in August 2024, as inflationary pressures moderated and the Kenyan shilling showed signs of stability. The decline can be further attributed to the government’s deliberate fiscal tightening measures, including expenditure rationalization and improved revenue mobilization efforts under the guidance of its IMF-supported Extended Fund Facility (EFF) and Extended Credit Facility (ECF) programmes. Robust nominal GDP growth, supported by easing inflation and a recovery in key sectors such as agriculture and services, also played a significant role in lowering the debt ratio. On the financing side, Kenya undertook a successful Eurobond issuance in early 2024 to manage its maturing 2024 Eurobond, easing rollover risk and improving investor confidence. The external liability management operations, combined with a stable exchange rate and improved current account position, helped anchor debt metrics. However, despite the marginal improvement, Kenya’s debt burden remains elevated by historical standards, and fiscal pressures persist amid rising interest payments and constrained revenue performance. However, it’s worth noting that there has been a gradual improvement, supported by early fiscal consolidation efforts, improved nominal GDP growth, and more stable macroeconomic conditions. Credit rating agencies have maintained a cautious stance, with Kenya’s outlook remaining under watch given the government’s high gross financing needs and reliance on external market access, even as reforms continue to gain traction. Below is a graph showing the Eurobond secondary market performance of select SSA countries;
- Ethiopia’s public debt-to-GDP ratio rose by 3.9% points to 41.8% in 2024 from 37.9% in 2023, reflecting mounting fiscal pressures amid a fragile post-conflict recovery and limited revenue mobilization. The increase was largely driven by higher external borrowing to support budgetary needs and stabilize the economy, coupled with local currency depreciation, which inflated the value of external debt obligations. Notably, Ethiopia remains in external debt distress, having defaulted on its USD 1.0 bn Eurobond in December 2023 becoming the third Sub-Saharan African country to default since the onset of the COVID-19 pandemic, after Zambia and Ghana. The default highlighted the country’s acute liquidity challenges and underscored its vulnerability to external financing shocks. In response, Ethiopia entered into an IMF-supported programme and, by mid-2025, had secured an MoU with official creditors to restructure approximately USD 8.4 billion in debt and provide USD 2.5 billion in debt service relief through 2028. The IMF completed the third programme review in July 2025, unlocking USD 262.3 mn in additional financing. However, talks with private creditors remain incomplete, and concerns over debt transparency and weak institutional capacity continue to weigh on investor sentiment. While Ethiopia’s debt ratio remains relatively low by regional standards, the country’s default and ongoing restructuring efforts signal elevated sovereign risk and underscore the urgency of comprehensive fiscal and structural reforms.
- Zambia’s public debt-to-GDP ratio edged up slightly by 0.6% points to 99.0% in 2024 from 98.3% in 2023, reflecting continued debt distress and limited fiscal consolidation, despite the country being over three years into its restructuring process. The marginal increase was largely driven by exchange rate depreciation and sluggish economic growth, which have hampered efforts to reduce the debt burden. Although Zambia reached an agreement with official creditors in 2023 and restructured a portion of its Eurobond and commercial debt, progress has been slow in finalizing deals with remaining private and non-Paris Club lenders. The prolonged nature of debt restructuring continues to weigh on investor confidence and limits access to affordable external financing. However, credit rating agency Moody’s upgraded Zambia’s economic outlook from stable to positive in April 2025, affirming its long-term foreign currency sovereign rating at Caa2, signalling cautious optimism despite remaining in speculative-grade territory. Additionally, S&P Global downgraded Zambia to ‘SD’ (selective default) following missed payments during the negotiation process, though the rating is expected to be revisited once a comprehensive agreement with all creditors is reached. Despite securing additional support from the IMF, most recently a USD 145 million disbursement request tied to a 12-month extension of its Extended Credit Facility, Zambia’s debt trajectory remains highly vulnerable to external shocks and implementation delays, underscoring the need for stronger fiscal discipline and governance reforms to restore long-term debt sustainability and,
- Ghana’s public debt-to-GDP ratio declined significantly by 18.5% points to 66.4% in 2024 from 84.9% in 2023, marking a major turnaround in its debt sustainability trajectory following years of distress and default. The sharp decline was driven by a successful restructuring of both domestic and external debt, coupled with a strong recovery in nominal GDP growth and improved macroeconomic management. The completion of the USD 13.1 bn Eurobond restructuring in October 2024 and the ratification of a USD 5.1 bn bilateral debt agreement in January 2025 under the G20 Common Framework played a central role in reducing the debt burden and smoothing the country’s repayment profile. Additionally, strong Cedi appreciation, easing inflation, and an improving current account balance supported macroeconomic stability and strengthened debt affordability metrics. Reflecting these improvements, Fitch Ratings upgraded Ghana’s Long-Term Foreign-Currency Issuer Default Rating (IDR) to ‘B-’ with a Stable Outlook in June 2025, from ‘Restricted Default’ (RD). The upgrade was underpinned by the normalization of relations with the majority of external commercial creditors and Fitch’s expectation that the remaining USD 2.6 bn in unresolved debt, of which only USD 700.0 mn is commercial, will be restructured with minimal holdout risk. Ghana's stronger external buffers, including a rebound in international reserves to USD 6.8 bn and projected surpluses in the current account, further support the country's external liquidity position. However, Fitch flagged high interest-to-revenue ratios, projected at 26.0% in 2025, as a key constraint on the rating, despite falling debt ratios and improved fiscal buffers. Ghana’s outlook remains cautiously optimistic, with projected debt expected to decline to 60.0% of GDP by 2026, supported by strong nominal growth, declining inflation, and a gradual return to market financing. While challenges remain, particularly around sustaining fiscal discipline and reopening the local bond market, the recent upgrade signals a critical turning point in Ghana’s sovereign credit profile following its default in 2022.
Section IV: Outlook on SSA Eurobonds Performance
- Elevated Eurobond Yields – Sub-Saharan Africa (SSA) Eurobond yields have remained elevated in 2025, reflecting sustained investor caution amid global monetary tightening, weak commodity prices, and ongoing fiscal vulnerabilities across the region. While some stability has emerged in the first half of 2025 on the back of easing inflationary pressures and growing expectations of a U.S. Fed pivot, yields for most SSA sovereigns remain high, particularly for issuers grappling with debt restructuring or governance concerns. Countries like Nigeria saw yields spike above 11.0% during Q2’2025 due to external financing pressures and weak investor sentiment, while credit downgrades, such as in Senegal following the disclosure of significantly higher debt levels, have further exacerbated market volatility. Although improving reform momentum and potential multilateral support could pave the way for yield compression in selected names, broader market recovery remains contingent on global risk appetite and credible fiscal consolidation efforts by sovereigns,
- Public debt to GDP ratios will continue to rise – According to the World Bank’s Africa’s Pulse October 2024, Public debt in Sub-Saharan Africa was four times higher in 2023 compared to 2006, reflecting external and domestic debt stabilizing at elevated levels and high Gross Financing Needs (GFN). The average nominal level of debt in 2006–19 was around USD 565.0 bn, and the nominal public debt at end-2023 stood at USD 1.3 tn. As of 2025, public debt-to-GDP ratios across Sub-Saharan Africa (SSA) present a mixed picture, reflecting divergent fiscal paths post-COVID-19 and varying access to concessional financing and debt restructuring. Countries that have undergone or are undergoing debt restructuring, such as Ghana, Zambia, and Ethiopia, have seen notable improvements or moderate increases depending on the stage of restructuring and IMF programme support. For instance, Ghana's debt-to-GDP ratio dropped significantly to 66.4% in 2024 from 84.9% in 2023, following a successful restructuring and stronger nominal GDP growth. Conversely, countries like Senegal recorded a sharp upward revision in debt levels, with public debt-to-GDP rising by 30.4% points to 111.4% in 2024, after a national audit revealed significantly underreported obligations, triggering a sovereign downgrade. Kenya managed to reduce its ratio from 70.1% to 68.3% over the same period, aided by fiscal consolidation and improved revenue mobilisation. Meanwhile, Zambia’s ratio inched up to 99.0% despite ongoing restructuring, while Ethiopia’s rose to 41.8% amid external financing pressures and currency depreciation. These developments underscore the region’s fragile fiscal space, with elevated debt burdens remaining a key vulnerability despite reform momentum and IMF engagement. Going forward, the pace of debt reduction will hinge on sustained fiscal discipline, favourable growth dynamics, and the successful conclusion of external debt treatments., and,
- Debt distress and sustainability concerns - From the regional economic outlook by IMF ,as a result of narrowing primary deficits, average public debt in SSA has stabilized and is now starting to decline as a proportion of GDP. Primary balances are now below pre-pandemic levels in many countries, with the median balance having improved by 0.5% of GDP in 2024, bringing the 2022-24 cumulative consolidation to about 2.0% points. In-addition the World Bank’s report points out that, Sub-Saharan Africa’s total debt service levels have increased steadily since 2006, adversely affecting fiscal space and increasing vulnerability to shocks, especially for countries that have gained access to the international bond market and other non-concessional financing sources. Despite ongoing efforts to stabilise public finances, the region continues to grapple with high external debt levels, limited revenue mobilisation, and rising interest costs, all of which constrain fiscal space and crowd out development spending. Countries like Zambia, Ghana, and Ethiopia have already defaulted on their external obligations and remain engaged in complex restructuring processes under the G20 Common Framework, while others such as Kenya and Nigeria face rising refinancing risks and widening fiscal deficits. In Senegal, the revelation of underreported debt pushed the country into a higher-risk category, leading to a ratings downgrade and a sharp deterioration in investor sentiment. The elevated debt burdens and liquidity challenges have made access to international capital markets prohibitively expensive for most frontier issuers, reinforcing reliance on multilateral support. While recent IMF programmes and fiscal reforms offer a path toward debt sustainability, progress is uneven, and the region remains highly vulnerable to external shocks. Addressing these vulnerabilities will require stronger governance, enhanced debt transparency, and credible medium-term consolidation strategies anchored in domestic resource mobilisation and expenditure efficiency.
Measures that the SSA Region Can Take to Improve Its Credit Ratings
- Engagement with International Institutions – The region should actively seek engagement with prominent international financial institutions as a strategic measure to enhance its creditworthiness. Collaborating with institutions such as the International Monetary Fund (IMF) and the World Bank provides Sub-Saharan African countries with access to financial resources, technical expertise, and policy advice. By doing so, countries in the Sub-Saharan African region can benefit from tailored programs that address country-specific economic challenges,
- Diversification of Revenue Sources – The region should put more efforts on diversifying their economies by encouraging the growth of non-traditional sectors such as technology, agribusiness, manufacturing, and renewable energy as well as Implement structural reforms to improve the ease of doing business and attract foreign direct investment (FDI) which would in turn increase the region’s revenue collection and mitigate the impacts of external shocks,
- Debt Management – Implement comprehensive debt management strategies that encompass short, medium, and long-term objectives which regularly assess the cost and risk profile of the debt portfolio as well as Prioritizing refinancing high-cost debt with lower-cost alternatives to reduce debt service obligations in the region. One way to achieve this is through debt-for-nature swaps as in the case of Gambia,
- Efficient Tax Collection – The region should strengthen tax collection and administration to improve revenue collection without increasing tax rates significantly. This can be done through broadening the tax base while ensuring tax policies are equitable and do not disproportionately burden the lower-income segments of the population,
- Social and Economic Development Initiatives – The region should focus on prioritizing investments in social and economic development projects such as Infrastructure development, education, and healthcare in order to boost the overall economic growth and in turn provide a long-term stability,
- Diaspora remittances & Tourism Promotion – The region should prioritize developing its low hanging sources of dollars, such as diaspora and tourism to bring in foreign currency. This can be achieved by putting in place policies to support the tourism industry, marketing tourist attractions and strengthening security within the region,
- Fiscal Responsibility and Transparency – The region should eliminate the rampant corruption associated with SAA countries and ensure that borrowed funds are allocated to projects with measurable economic and social impact. This can be achieved through the establishment of independent oversight bodies tasked with monitoring the implementation of projects funded through external borrowing. Budgetary discipline coupled with transparent reporting mechanisms must be upheld to prevent unnecessary expenditures, with a clear emphasis on directing funds towards initiatives that promote development, and,
- Development of Robust Capital Markets: – SSA countries should prioritize enhancing capital markets to elevate their credit ratings. Developing transparent, efficient, and well-regulated capital markets attracts diverse investors, both locally and internationally. This will help in broadening investment opportunities, increasing liquidity and participation from institutional investors. Strengthening capital markets is crucial to instil investor confidence, drive economic growth, and improve credit ratings in Sub-Saharan Africa.
Conclusion: From our analysis, the unfavourable credit ratings, elevated debt levels, and fragile investor confidence continue to weigh heavily on the Sub-Saharan Africa (SSA) Eurobond market. Despite signs of stabilisation in global financial markets, access to international capital remains constrained for most frontier issuers, with only a few creditworthy sovereigns managing to return to the market under tighter pricing conditions. Going forward, the region will need to accelerate structural reforms aimed at restoring macroeconomic stability, strengthening debt transparency, and enhancing fiscal credibility. A comprehensive economic restructuring, anchored in robust public financial management, domestic revenue mobilisation, and targeted spending, will be critical not only to support debt sustainability but also to rebuild investor trust and reduce overreliance on costly external borrowing.
Disclaimer: The views expressed in this publication are those of the writers where particulars are not warranted. This publication, which is in compliance with Section 2 of the Capital Markets Authority Act Cap 485A, is meant for general information only and is not a warranty, representation, advice or solicitation of any nature. Readers are advised in all circumstances to seek the advice of a registered investment advisor

- Talk to us
- Kenya
- P.O Box 20695 - 00200, Nairobi, Kenya
- Cell +254709101200
- Tel +254709101200
- WhatsApp +254741676635
- United States
- +254709101200
- DOWNLOAD OUR APP
-


- Kenya
- 8th Floor, Pinetree Plaza, Kaburu Drive, Ngong Road, Nairobi, Kenya
- USA
- Suite 1150, 1775 Eye Street NW, USA, Washington DC 20006, USA
- Investments
- High Yield
- Private Equity
- Real Estate
- Real Estate
- RiverRun Estates
- Cytonn Towers
- The Ridge
- Taraji Heights
- The Alma